

mohatta2015.pdf
signal processing from power amplifier operation control point of view
signal processing from power amplifier operation control point of view

Create successful ePaper yourself
Turn your PDF publications into a flip-book with our unique Google optimized e-Paper software.
116 MAXIMUM LIKELIHOOD SEQUENCE DETECTION<br />
Mathematically, we form a metric<br />
M, = (r 1 -f 1 ) 2 + (r 2 -f 2 ) 2 + ..., (6.1)<br />
where the subscript q indicates a particular symbol sequence hypothesis. This<br />
metric is referred to as the Euclidean distance metric, because it is related to the<br />
distance between two points in geometry.<br />
Let's try it for the Alice and Bob example. We form predicted values using<br />
h = -lOtt+Qfl, (6.2)<br />
f 2 = -1092+9(7!. (6.3)<br />
For example, consider the hypothesis g () = +1, q\ = — 1, and q 2 = +1 (an incorrect<br />
hypothesis). Then<br />
h = -10(-1) +9(+l) = 19 (6.4)<br />
f 2 = -l0(+l)+9(-l) = -19. (6.5)<br />
Recall that r\ = 1 and r 2 — —7, so that the metric would be<br />
M q = (1 - 19) 2 + (-7 - (-19)) 2 = 468. (6.6)<br />
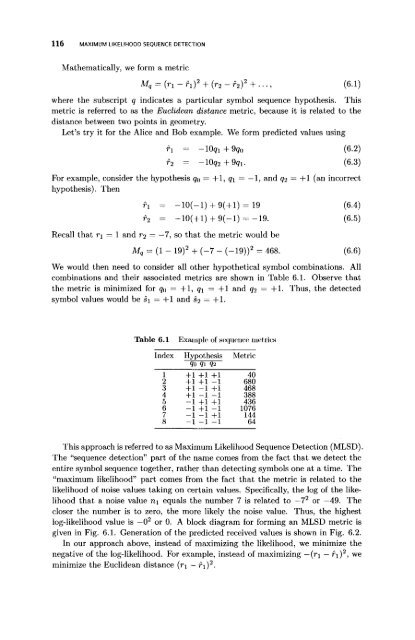
We would then need to consider all other hypothetical symbol combinations. All<br />
combinations and their associated metrics are shown in Table 6.1. Observe that<br />
the metric is minimized for q n — +1, q x = +1 and qi = +1. Thus, the detected<br />
symbol values would be s\ = +1 and s 2 = +1·<br />
Table 6.1<br />
Example of sequence metrics<br />
Index Hypothesis Metric<br />
9o 9i 92<br />
~1 +1 +1 +1 40<br />
2 +1 +1 -1 680<br />
3 +1 -1 +1 468<br />
4 +1 -1 -1 388<br />
5 -1 +1 +1 436<br />
6 -1 +1 -1 1076<br />
7 -1 -1 +1 144<br />
8 -1 -1 -1 64<br />
This approach is referred to as Maximum Likelihood Sequence Detection (MLSD).<br />
The "sequence detection" part of the name comes from the fact that we detect the<br />
entire symbol sequence together, rather than detecting symbols one at a time. The<br />
"maximum likelihood" part comes from the fact that the metric is related to the<br />
likelihood of noise values taking on certain values. Specifically, the log of the likelihood<br />
that a noise value n\ equals the number 7 is related to —7 2 or —49. The<br />
closer the number is to zero, the more likely the noise value. Thus, the highest<br />
log-likelihood value is —0 2 or 0. A block diagram for forming an MLSD metric is<br />
given in Fig. 6.1. Generation of the predicted received values is shown in Fig. 6.2.<br />
In our approach above, instead of maximizing the likelihood, we minimize the<br />
negative of the log-likelihood. For example, instead of maximizing — {r\ — f\) 2 , we<br />
minimize the Euclidean distance (r\ - r\) 2 .