Notes
Notes
Notes
Create successful ePaper yourself
Turn your PDF publications into a flip-book with our unique Google optimized e-Paper software.
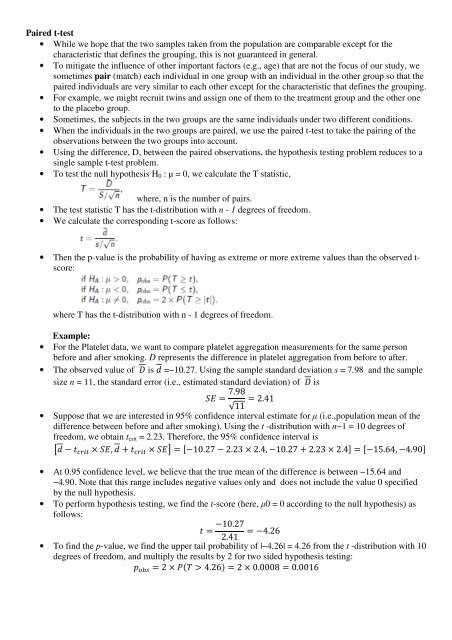
Paired t-test<br />
• While we hope that the two samples taken from the population are comparable except for the<br />
characteristic that defines the grouping, this is not guaranteed in general.<br />
• To mitigate the influence of other important factors (e.g., age) that are not the focus of our study, we<br />
sometimes pair (match) each individual in one group with an individual in the other group so that the<br />
paired individuals are very similar to each other except for the characteristic that defines the grouping.<br />
• For example, we might recruit twins and assign one of them to the treatment group and the other one<br />
to the placebo group.<br />
• Sometimes, the subjects in the two groups are the same individuals under two different conditions.<br />
• When the individuals in the two groups are paired, we use the paired t-test to take the pairing of the<br />
observations between the two groups into account.<br />
• Using the difference, D, between the paired observations, the hypothesis testing problem reduces to a<br />
single sample t-test problem.<br />
• To test the null hypothesis H 0 : µ = 0, we calculate the T statistic,<br />
where, n is the number of pairs.<br />
• The test statistic T has the t-distribution with n - 1 degrees of freedom.<br />
• We calculate the corresponding t-score as follows:<br />
• Then the p-value is the probability of having as extreme or more extreme values than the observed t-<br />
score:<br />
where T has the t-distribution with n - 1 degrees of freedom.<br />
Example:<br />
• For the Platelet data, we want to compare platelet aggregation measurements for the same person<br />
before and after smoking. D represents the difference in platelet aggregation from before to after.<br />
• The observed value of is =−10.27. Using the sample standard deviation s = 7.98 and the sample<br />
size n = 11, the standard error (i.e., estimated standard deviation) of is<br />
7.98 2.41<br />
√11<br />
• Suppose that we are interested in 95% confidence interval estimate for µ (i.e.,population mean of the<br />
difference between before and after smoking). Using the t -distribution with n−1 = 10 degrees of<br />
freedom, we obtain t crit = 2.23. Therefore, the 95% confidence interval is<br />
, 10.27 2.23 2.4, 10.27 2.23 2.4 15.64, 4.90<br />
• At 0.95 confidence level, we believe that the true mean of the difference is between −15.64 and<br />
−4.90. Note that this range includes negative values only and does not include the value 0 specified<br />
by the null hypothesis.<br />
• To perform hypothesis testing, we find the t-score (here, µ0 = 0 according to the null hypothesis) as<br />
follows:<br />
10.27 4.26<br />
2.41<br />
• To find the p-value, we find the upper tail probability of |−4.26| = 4.26 from the t -distribution with 10<br />
degrees of freedom, and multiply the results by 2 for two sided hypothesis testing:<br />
2 4.26 2 0.0008 0.0016


