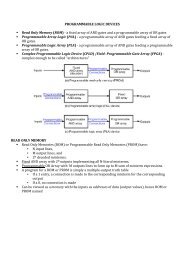
Notes
Notes
Notes

Create successful ePaper yourself
Turn your PDF publications into a flip-book with our unique Google optimized e-Paper software.
Hypothesis testing for population proportion<br />
• For a binary random variable X with possible values 0 and 1, we are typically interested in evaluating<br />
hypotheses regarding the population proportion of the outcome of interest, denoted as X = 1.<br />
• As discussed before, the population proportion is the same as the population mean for such binary<br />
variables.<br />
• So we follow the same procedure as described above.<br />
• More specifıcally, we use the z-test for hypothesis testing.<br />
• Note that we do not use t-test, because for binary random variable, population variance is<br />
σ 2 = µ(1 - µ).<br />
• Therefore, by setting µ=µ 0 according to the null hypothesis, we specify the population variance as<br />
σ 2 = µ 0 (1 - µ 0 ).<br />
• If we assume that the null hypothesis is true, we have<br />
• This means that<br />
• As a result, we obtain the z-score as follows:<br />
where p is the sample proportion (mean).<br />
• Consider the Melanoma dataset available from the MASS package. Suppose that we hypothesize that<br />
less than 50% of cases ulcerate: µ < 0.5. Then the null hypothesis can be expressed as H0 : µ = 0.5.<br />
Using the Melanoma data set, we can test the above null hypothesis. The number of observations in<br />
this data set is n = 205, of which 90 patients had ulceration. Therefore, p = 90/205 = 0.44.<br />
• Next, we can find the z-score for our test statistic as follows:<br />
• Because HA :µ