L. Fituni, I. Abramova Resource Potential of Africa and Russia's ...
L. Fituni, I. Abramova Resource Potential of Africa and Russia's ... L. Fituni, I. Abramova Resource Potential of Africa and Russia's ...
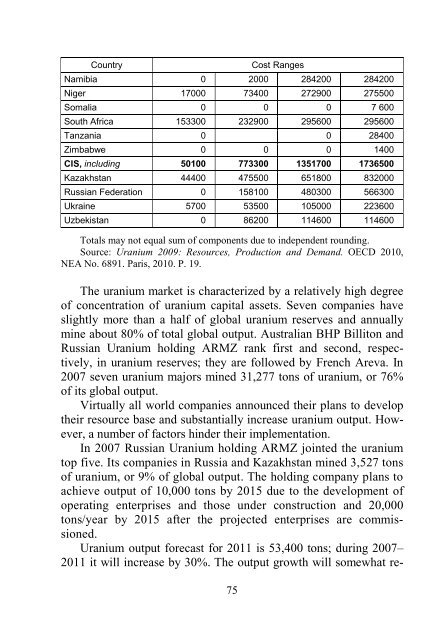
Country 75 Cost Ranges Namibia 0 2000 284200 284200 Niger 17000 73400 272900 275500 Somalia 0 0 0 7 600 South Africa 153300 232900 295600 295600 Tanzania 0 0 28400 Zimbabwe 0 0 0 1400 CIS, including 50100 773300 1351700 1736500 Kazakhstan 44400 475500 651800 832000 Russian Federation 0 158100 480300 566300 Ukraine 5700 53500 105000 223600 Uzbekistan 0 86200 114600 114600 Totals may not equal sum of components due to independent rounding. Source: Uranium 2009: Resources, Production and Demand. OECD 2010, NEA No. 6891. Paris, 2010. P. 19. The uranium market is characterized by a relatively high degree of concentration of uranium capital assets. Seven companies have slightly more than a half of global uranium reserves and annually mine about 80% of total global output. Australian BHP Billiton and Russian Uranium holding ARMZ rank first and second, respectively, in uranium reserves; they are followed by French Areva. In 2007 seven uranium majors mined 31,277 tons of uranium, or 76% of its global output. Virtually all world companies announced their plans to develop their resource base and substantially increase uranium output. However, a number of factors hinder their implementation. In 2007 Russian Uranium holding ARMZ jointed the uranium top five. Its companies in Russia and Kazakhstan mined 3,527 tons of uranium, or 9% of global output. The holding company plans to achieve output of 10,000 tons by 2015 due to the development of operating enterprises and those under construction and 20,000 tons/year by 2015 after the projected enterprises are commissioned. Uranium output forecast for 2011 is 53,400 tons; during 2007– 2011 it will increase by 30%. The output growth will somewhat re-
duce the gap between the raw material requirements of the nuclear power industry and their supply; however, the natural uranium shortage in the market will persist. 15 In the last decade, the burgeoning nuclear power industry has given rise to a steady increase in world uranium consumption; in 2005 it reached 69 thousand tons with its production being 40 thousand tons only. A shortage of about 30 thousand tons is covered by stock resources. Russia faces similar problems as other countries all over the world: uranium demand considerably exceeding its production; a rapid depletion of natural uranium stocks that are enough for less than 10–15 years, and lack of sufficient geological reserves prepared for commercial development. In this connection the RF Government made a decision to substantially facilitate the development of the nuclear power industry and accelerate the development of its mineral resource base. At present, Russia’s total explored uranium reserves of 1+2 categories are 656 thousand tons with the lowest 2 category dominating (67.7%). However, the quality of the reserves leaves much to be desired because of a low uranium grade of ore and insufficient infrastructures in ore districts. Development of about 600 thousand tons of the reserves may be considered practicable in the near future. Besides, there are expected uranium resources, which are also considerable and are estimated at about 830 thousand tons under the most reliable 1+2 categories. In Russia, the region of Eastern Siberia and the Far East stands out for the total mineral resource potential; it accounts for 93% of explored uranium reserves and 56% of total uranium expected resources. A number of districts concentrating main uranium reserves and resources are located just within this region. The Streltsovsky district, Chita Oblast, contains 15 U-Mo deposits. They are mined by the Priargunsky Production Mining/Chemical Association. Total uranium reserves of the district are 22% of its total reserves in the Russian Federation. The Vitim district, Republic of Buryatia, unites 8 uranium deposits in erosional paleovalleys. The district with reserves accounting for 8% of Russia’s total uranium reserves is developed by Khiagda OJSC. 76
- Page 26 and 27: Though US totally depends on import
- Page 28 and 29: isk of supply shortage in the next
- Page 30 and 31: long been obsolete, do exist and te
- Page 32 and 33: a European-African energy forum; th
- Page 34 and 35: upon the same ideology: the new roa
- Page 36 and 37: Force. At the request of the UN Sec
- Page 38 and 39: - The United States has sole jurisd
- Page 40 and 41: uses to track terrorists. Algerian
- Page 42 and 43: sum, in exchange for terminating th
- Page 44 and 45: UK, Greece, Italy and Spain during
- Page 46 and 47: ing Angola’s large oil resources
- Page 48 and 49: China concluded two major M&A deals
- Page 50 and 51: the continent. To help African coun
- Page 52 and 53: egy with regard to Sudan and Zimbab
- Page 54 and 55: some price-related difficulties for
- Page 56 and 57: 100,000 students from almost every
- Page 58 and 59: 15 U.S. Geological Survey, Mineral
- Page 60 and 61: CHAPTER 2 Natural Resource Potentia
- Page 62 and 63: tion in the global division of labo
- Page 64 and 65: of other nations (manifest in an ex
- Page 66 and 67: The mineral resource base (MRB) of
- Page 68 and 69: In Nigeria, the smelter at Ikot Aba
- Page 70 and 71: ite production at Komi to reach 6.5
- Page 72 and 73: depletion. In South Africa, output
- Page 74 and 75: 25-26 thousand tons of copper conce
- Page 78 and 79: The Elkon district, Southern Yakuti
- Page 80 and 81: ites and Miocene sediments extendin
- Page 82 and 83: South, Etango and Valencia alaskite
- Page 84 and 85: of competitiveness by similar produ
- Page 86 and 87: tive scenario, the above goals will
- Page 88 and 89: The concept of resource efficiency
- Page 90 and 91: vately owned. The leading enterpris
- Page 92 and 93: In this respect African and Russian
- Page 94 and 95: Table 2.2.2. Distribution of capita
- Page 96 and 97: will allow the project to overcome
- Page 98 and 99: World prices on all types of minera
- Page 100 and 101: 2.3. Competitors or Partners? Russi
- Page 102 and 103: Soviet organizations supplied Alger
- Page 104 and 105: that the gas crisis between Russia
- Page 106 and 107: The second LUKOIL project in Egypt
- Page 108 and 109: The agreement was finally signed du
- Page 110 and 111: pany “Slavneft” would join a co
- Page 112 and 113: DRC to extract copper and cobalt in
- Page 114 and 115: for 22 years in 2002 Friguia refine
- Page 116 and 117: licenses. They are the only Russian
- Page 118 and 119: that the main aims were inter-alia
- Page 120 and 121: Agency to develop plans for up to 4
- Page 122 and 123: pit nickel mine and the Selkirk und
- Page 124 and 125: deposit also contains a Peridotite-
Country<br />
75<br />
Cost Ranges<br />
Namibia 0 2000 284200 284200<br />
Niger 17000 73400 272900 275500<br />
Somalia 0 0 0 7 600<br />
South <strong>Africa</strong> 153300 232900 295600 295600<br />
Tanzania 0 0 28400<br />
Zimbabwe 0 0 0 1400<br />
CIS, including 50100 773300 1351700 1736500<br />
Kazakhstan 44400 475500 651800 832000<br />
Russian Federation 0 158100 480300 566300<br />
Ukraine 5700 53500 105000 223600<br />
Uzbekistan 0 86200 114600 114600<br />
Totals may not equal sum <strong>of</strong> components due to independent rounding.<br />
Source: Uranium 2009: <strong>Resource</strong>s, Production <strong>and</strong> Dem<strong>and</strong>. OECD 2010,<br />
NEA No. 6891. Paris, 2010. P. 19.<br />
The uranium market is characterized by a relatively high degree<br />
<strong>of</strong> concentration <strong>of</strong> uranium capital assets. Seven companies have<br />
slightly more than a half <strong>of</strong> global uranium reserves <strong>and</strong> annually<br />
mine about 80% <strong>of</strong> total global output. Australian BHP Billiton <strong>and</strong><br />
Russian Uranium holding ARMZ rank first <strong>and</strong> second, respectively,<br />
in uranium reserves; they are followed by French Areva. In<br />
2007 seven uranium majors mined 31,277 tons <strong>of</strong> uranium, or 76%<br />
<strong>of</strong> its global output.<br />
Virtually all world companies announced their plans to develop<br />
their resource base <strong>and</strong> substantially increase uranium output. However,<br />
a number <strong>of</strong> factors hinder their implementation.<br />
In 2007 Russian Uranium holding ARMZ jointed the uranium<br />
top five. Its companies in Russia <strong>and</strong> Kazakhstan mined 3,527 tons<br />
<strong>of</strong> uranium, or 9% <strong>of</strong> global output. The holding company plans to<br />
achieve output <strong>of</strong> 10,000 tons by 2015 due to the development <strong>of</strong><br />
operating enterprises <strong>and</strong> those under construction <strong>and</strong> 20,000<br />
tons/year by 2015 after the projected enterprises are commissioned.<br />
Uranium output forecast for 2011 is 53,400 tons; during 2007–<br />
2011 it will increase by 30%. The output growth will somewhat re-


