L. Fituni, I. Abramova Resource Potential of Africa and Russia's ...
L. Fituni, I. Abramova Resource Potential of Africa and Russia's ... L. Fituni, I. Abramova Resource Potential of Africa and Russia's ...
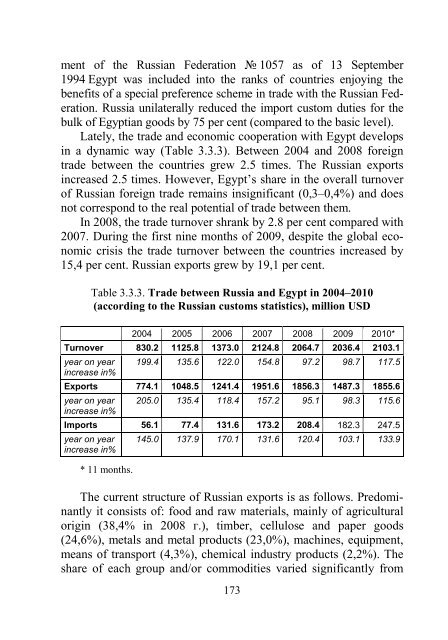
ment of the Russian Federation 1057 as of 13 September 1994 Egypt was included into the ranks of countries enjoying the benefits of a special preference scheme in trade with the Russian Federation. Russia unilaterally reduced the import custom duties for the bulk of Egyptian goods by 75 per cent (compared to the basic level). Lately, the trade and economic cooperation with Egypt develops in a dynamic way (Table 3.3.3). Between 2004 and 2008 foreign trade between the countries grew 2.5 times. The Russian exports increased 2.5 times. However, Egypt’s share in the overall turnover of Russian foreign trade remains insignificant (0,3–0,4%) and does not correspond to the real potential of trade between them. In 2008, the trade turnover shrank by 2.8 per cent compared with 2007. During the first nine months of 2009, despite the global economic crisis the trade turnover between the countries increased by 15,4 per cent. Russian exports grew by 19,1 per cent. Table 3.3.3. Trade between Russia and Egypt in 2004–2010 (according to the Russian customs statistics), million USD 2004 2005 2006 2007 2008 2009 2010* Turnover 830.2 1125.8 1373.0 2124.8 2064.7 2036.4 2103.1 year on year increase in% 199.4 135.6 122.0 154.8 97.2 98.7 117.5 Exports 774.1 1048.5 1241.4 1951.6 1856.3 1487.3 1855.6 year on year increase in% 205.0 135.4 118.4 157.2 95.1 98.3 115.6 Imports 56.1 77.4 131.6 173.2 208.4 182.3 247.5 year on year increase in% * 11 months. 145.0 137.9 170.1 131.6 120.4 103.1 133.9 The current structure of Russian exports is as follows. Predominantly it consists of: food and raw materials, mainly of agricultural origin (38,4% in 2008 .), timber, cellulose and paper goods (24,6%), metals and metal products (23,0%), machines, equipment, means of transport (4,3%), chemical industry products (2,2%). The share of each group and/or commodities varied significantly from 173
year to year. Thus, during the first half of 2009 the share of alimentary products and food increased to 62,3% of the total, the major part being wheat and maize. Russia imports from Egypt predominantly agricultural products (83% in 2008): citruses, potato, rice, onions, garlic, and tea. Russia also imports manufactured consumer goods (textiles and textile products, footwear – 4,5%, carpets – 3,2%) produce of the chemical industry – 1,7%, including pharmaceutical goods – 0,9%. The cooperation between the countries in the investment sphere is not as developed as commodity trade or trade in services. In 2008, Egypt invested some 16,4 million USD in Russia. The accumulated amount of Egyptian investment in Russia equaled 53,6 million USD, out of which direct investment amounted to 52,7 USD. The major part of Egyptian investment in Russia goes into manufacturing – 14,8 million USD out of the 16,4 million USD total, in 2008. The volume of Russian investment in Egypt is insignificant. In 2008, only 900,000 USD were invested. However, there are good perspectives for expansion in the nearest future. One of the areas that particularly interest Russian companies is Egypt’s oil and gas sector (see Chapter 2). Russians understand that Egypt is not among the world's oil and gas leaders in terms of prospected and proven reserves and production of hydrocarbons. Nevertheless, revenues from oil and gas sales are of primary importance to the country's economy: oil exports were 65 percent of Egypt's total national export volume in 2001- 2002. Egyptian proved reserves at the end of 2002 were 3.7 billion bbl of oil (508.2 million tons) and 58,500 bcf of natural gas (1,660 m). The country's primary fields are located in the Suez Gulf region (about 60% of total reserves), the Libyan Desert, the Eastern Desert and Sinai. Oil production in 2002 was 37 million tons Over 20 multinational companies are already working in Egypt, including Royal Dutch/Shell, British Petroleum, ENI-Agip, ChevronTexaco, ExxonMobil, TotalFinaElf, British Gas, Norsk Hydro, Marathon, Apache, Deminex, Dover Petroleum, Dublin Oil, Novus, Repsol, LUKOIL and others. 174
- Page 124 and 125: deposit also contains a Peridotite-
- Page 126 and 127: and Eastern parts of the EPL 3850 p
- Page 128 and 129: Russian economy and the specifics o
- Page 130 and 131: 34 . 2009. C. 366- 368. 35 John St
- Page 132 and 133: CHAPTER 3 Project RUSSAFRICA: Towar
- Page 134 and 135: copra, spices, other products of tr
- Page 136 and 137: This theoretic and scientific aura
- Page 138 and 139: and technical cooperation with Afri
- Page 140 and 141: higher and specialized secondary ed
- Page 142 and 143: used and repaid part of the credit.
- Page 144 and 145: exploitation of projects. Soviet ex
- Page 146 and 147: At the same time we recognize that
- Page 148 and 149: For the Soviet Union, solidarity wi
- Page 150 and 151: disappeared together with their ass
- Page 152 and 153: cial Representative of the Presiden
- Page 154 and 155: countries and minimize the adverse
- Page 156 and 157: The principled line in support of A
- Page 158 and 159: Exports of Russian raw materials to
- Page 160 and 161: of Su-30MKA fighters. At the same t
- Page 162 and 163: etc. He also remarked that since th
- Page 164 and 165: However, there are harbingers of a
- Page 166 and 167: There was a good demand in Egypt fo
- Page 168 and 169: Another promising sphere for Russia
- Page 170 and 171: Lada users in Egypt. In 2010, a new
- Page 172 and 173: All these companies have permanent
- Page 176 and 177: As of mid 2010, other areas of econ
- Page 178 and 179: cooperation and hydrocarbon product
- Page 180 and 181: tion." The participants in the Raba
- Page 182 and 183: 2009 consisted of such traditional
- Page 184 and 185: From October 21-23, 2010, the Fourt
- Page 186 and 187: (May 2009), and Ugandan President Y
- Page 188 and 189: Russia provided humanitarian aid to
- Page 190 and 191: Nigeria’s Share in Russia’s Imp
- Page 192 and 193: supplies only it is either a blatan
- Page 194 and 195: On the initiative of the Ethiopian
- Page 196 and 197: - Automotive and components - Capit
- Page 198 and 199: led by the two Chambers and attende
- Page 200 and 201: coal mixture of a new generation. T
- Page 202 and 203: cial architecture and food safety a
- Page 204 and 205: The talks in Luanda led the two cou
- Page 206 and 207: 9 Annual Report of Alexander Saltan
- Page 208 and 209: CONCLUSIONS THE RESULTS OF THE UNDE
- Page 210 and 211: interpretations is the intensifying
- Page 212: Leonid FITUNI and Irina ABRAMOVA RE
ment <strong>of</strong> the Russian Federation 1057 as <strong>of</strong> 13 September<br />
1994 Egypt was included into the ranks <strong>of</strong> countries enjoying the<br />
benefits <strong>of</strong> a special preference scheme in trade with the Russian Federation.<br />
Russia unilaterally reduced the import custom duties for the<br />
bulk <strong>of</strong> Egyptian goods by 75 per cent (compared to the basic level).<br />
Lately, the trade <strong>and</strong> economic cooperation with Egypt develops<br />
in a dynamic way (Table 3.3.3). Between 2004 <strong>and</strong> 2008 foreign<br />
trade between the countries grew 2.5 times. The Russian exports<br />
increased 2.5 times. However, Egypt’s share in the overall turnover<br />
<strong>of</strong> Russian foreign trade remains insignificant (0,3–0,4%) <strong>and</strong> does<br />
not correspond to the real potential <strong>of</strong> trade between them.<br />
In 2008, the trade turnover shrank by 2.8 per cent compared with<br />
2007. During the first nine months <strong>of</strong> 2009, despite the global economic<br />
crisis the trade turnover between the countries increased by<br />
15,4 per cent. Russian exports grew by 19,1 per cent.<br />
Table 3.3.3. Trade between Russia <strong>and</strong> Egypt in 2004–2010<br />
(according to the Russian customs statistics), million USD<br />
2004 2005 2006 2007 2008 2009 2010*<br />
Turnover 830.2 1125.8 1373.0 2124.8 2064.7 2036.4 2103.1<br />
year on year<br />
increase in%<br />
199.4 135.6 122.0 154.8 97.2 98.7 117.5<br />
Exports 774.1 1048.5 1241.4 1951.6 1856.3 1487.3 1855.6<br />
year on year<br />
increase in%<br />
205.0 135.4 118.4 157.2 95.1 98.3 115.6<br />
Imports 56.1 77.4 131.6 173.2 208.4 182.3 247.5<br />
year on year<br />
increase in%<br />
* 11 months.<br />
145.0 137.9 170.1 131.6 120.4 103.1 133.9<br />
The current structure <strong>of</strong> Russian exports is as follows. Predominantly<br />
it consists <strong>of</strong>: food <strong>and</strong> raw materials, mainly <strong>of</strong> agricultural<br />
origin (38,4% in 2008 .), timber, cellulose <strong>and</strong> paper goods<br />
(24,6%), metals <strong>and</strong> metal products (23,0%), machines, equipment,<br />
means <strong>of</strong> transport (4,3%), chemical industry products (2,2%). The<br />
share <strong>of</strong> each group <strong>and</strong>/or commodities varied significantly from<br />
173


