full paper.pdf - An International Quarterly Journal of Environmental ...
full paper.pdf - An International Quarterly Journal of Environmental ...
full paper.pdf - An International Quarterly Journal of Environmental ...

Create successful ePaper yourself
Turn your PDF publications into a flip-book with our unique Google optimized e-Paper software.
NSave Nature to Survive<br />
QUARTERLY<br />
4(2&3) : 227-234, 2010<br />
WATER QUALITY AT TWO SPRING SITES AND AT SITES BEFORE<br />
WATER DISCHARGE INTO NAGROTA NULLAH, NEAR KASHMIR<br />
MIGRANT QUARTERS, NAGROTA, JAMMU<br />
S. P. S. DUTTA, N. JANDIAL* AND M. KHAJURIA<br />
Department <strong>of</strong> Environment Sciences,<br />
University <strong>of</strong> Jammu, Jammu - 180 004, J and K, INDIA<br />
E-mail: nidhijee@hotmail.com<br />
INTRODUCTION<br />
Springs, natural outlets <strong>of</strong> subsurface water, are not only the important sources<br />
<strong>of</strong> water to the lakes and rivers, but even origin <strong>of</strong> some streams and rivers is<br />
from such water bodies. Thermostatic and chemostatic spring water is used by<br />
aquaculturists for trout and other fish culture. Some springs like <strong>An</strong>antnag,<br />
Mutton, Bhaderwah, Akhnoor, Basohli, Katra, Jhandi, etc. have religious<br />
importance attached to them and are the important fish sanctuaries in J and K<br />
state. Fish restocking in rivers like Jehlum, Kashmir and Chenab, Tawi and Ravi<br />
rivers, Jammu region, is through these fish sanctuaries, situated along these lotic<br />
water bodies. Importance <strong>of</strong> spring in having medicinal properties has also<br />
been well recorded (Newbold, 1848; Buist, 1851; Macpherson, 1855 and<br />
Schlagistweit, 1862). Inspite <strong>of</strong> wide distribution and great importance <strong>of</strong> these<br />
springs, detailed water quality characteristics reports are scanty (Dutta et al.,<br />
1995a, b, 2002, 2009; Slathia et al., 2001 and Gupta et al., 2009) for Jammu<br />
Region. Taking this all into consideration, one year water quality characteristics<br />
<strong>of</strong> two springs, near Migrant camp, Nagrota, at their source and before water<br />
discharge into Nagrota nullah, Jammu, were undertaken and have been<br />
described.<br />
Topography<br />
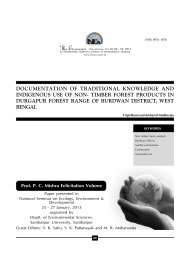
Nagrota town, located at a distance <strong>of</strong> 12km from Jammu city, is drained by<br />
Nagrota nullah (Fig. 1). It is an important tributary <strong>of</strong> the river Tawi and is fed by<br />
a large number <strong>of</strong> widely scattered springs. For the present study, two springs at<br />
their origin (Figs. 1a and 1b) and at sites before water discharge into Nagrota<br />
stream (Figs. 2a and 2b), located at a distance <strong>of</strong> 15feet from spring sites, were<br />
selected for detailed water quality analysis.<br />
ABSTRACT<br />
Water quality parameters viz., temperature,<br />
turbidity, pH, DO, COD, BOD, HCO 3<br />
, Ca ++ ,<br />
Mg ++ , total Hardness, Na + , K + , Silicate,<br />
Phosphate, Nitrate, electrical conductivity and<br />
TDS were analysed for one year viz. January,<br />
2003 – December, 2003 at two spring sites and<br />
at sites away from springs, before water discharge<br />
into Nagrota nullah, Jammu and have been<br />
described. Comparison <strong>of</strong> water quality<br />
parameters with national and international<br />
standards has revealed these within optimum<br />
limits for consumption.<br />
MATERIALS AND METHODS<br />
Monthly water samples for one year viz. January, 2003 to December, 2003<br />
monthly, were collected at origin <strong>of</strong> springs and at sites, before water discharge<br />
into Nagrota nullah, in plastic container and analysed for various physicochemical<br />
characteristics by standard methods (APHA, 1998).<br />
RESULTS AND DISCUSSION<br />
The results <strong>of</strong> water quality parameters at spring sites, at sites before water<br />
discharge into Nagrota nullah and their mean have been shown in Tables 1-6.<br />
Air temperature, at spring sites and at sites away from springs, recorded an<br />
annual mean variation <strong>of</strong> 15.3ºC, January, 2003 - 39.0ºC , May, 2003 and<br />
15.8ºC, January, 2003 - 38.0ºC, May, 2003, respectively.<br />
At spring sites and sites before water discharge into Nagrota stream water<br />
temperature, due to thermostatistics characteristics, recorded an annual<br />
KEY WORDS<br />
Water quality<br />
Twosprings<br />
Nagrota<br />
Jammu<br />
Received : 12.12.2009<br />
Revised : 17.03.2010<br />
Accepted : 21.07.2010<br />
*Corresponding author<br />
227
S. P. S. DUTTA AND N. JANDIAL<br />
Table 1: Monthly variations in physico-chemical parameters at spring site-I, Nagrota, Jammu (January, 2003 - December, 2003)<br />
Parameters Jan. Feb. Mar. Apr. May Jun. Jul. Aug. Sept. Oct. Nov. Dec.<br />
Air Temperature ( 0 C) 15.5 20 25 35 38.5 29 33 22 31 29 25 16.5<br />
Water Temperature ( 0 C) 22.5 21 22 25 24 26 28 31 26 27 26 23<br />
Turbidity (NTU) 7.5 3 2.5 6 3 2.5 0 3 2.5 3 2.5 2.5<br />
pH 6.94 7.12 6.87 6.93 6.91 6.87 7.05 6.70 6.67 6.92 7.12 7.04<br />
Free CO 2<br />
(mg/L) 29.2 15.1 30.3 27.3 32.1 35.5 21.9 36.0 47.1 27.9 18.2 19.5<br />
Dissolved Oxygen (mg/L) 5.6 8.5 6.7 5.0 1.1 1.6 4.5 2.15 5.2 10.5 10.9 2.9<br />
Bicarbonate (mg/L) 335.1 358.4 223.1 278.7 303.2 315.0 359.8 348.2 318.8 425.9 319.7 417.9<br />
Chloride (mg/L) 38.33 38.8 30.9 37.9 58.7 34.3 13.4 18.3 25.5 31.9 37.9 21.0<br />
Calcium (mg/L) 105.9 120.2 165.3 89.6 83.1 21.9 114.1 80.0 72.3 38.0 63.7 101.4<br />
Magnesium (mg/L) 23.42 20.3 10.6 28.7 17.4 19.4 19.5 16.3 41.6 18.6 16.5 16.1<br />
Total Hardness (mg/L) 355.4 383.7 497.3 341.9 279.3 135.0 365.2 266.8 352.0 172.7 180.5 319.2<br />
Potassium (mg/L) 2.5 3.0 4.0 2.5 4.0 3.0 4.0 1.5 2.0 2.5 4.0 2.5<br />
Sodium (mg/L) 34 34 34.5 35 40 38 36 26 25 34 38 44.5<br />
Silicate (mg/L) 1.2 4.1 8 8.6 2.2 12 3.0 3.4 8.9 11.6 5.6 7.4<br />
Nitrate (mg/L) 3.75 5.75 3.25 2.75 4.50 10.0 12.0 6.50 2.50 1.50 0.25 1.00<br />
Phosphate (mg/L) 0.1 0.01 0.11 0.13 0.03 0.08 0.2 0.06 0.22 0.08 0.09 0.11<br />
Sulphate (mg/L) 23.5 29.0 22.5 44 16.5 22.0 34.5 5.5 12.0 20.0 16.0 10.14<br />
BOD 1.2 2.8 1.2 2 0.2 0.2 3.2 0.25 1.1 1.2 3.3 1.2<br />
COD 9.64 13.6 11.9 13.6 19.5 18.7 20.7 17.6 20.4 32.6 31.5 33.2<br />
Conductivity (ms) 0.521 0.408 0.464 0.378 229 0.465 0.351 0.348 0.330 0.457 0.408 0.475<br />
Salinity (ppt) 0.6 0.4 0.4 0.4 0.4 0.4 0.4 0.4 0.4 0.4 0.4 0.50<br />
Total Dissolved Solids (mg/L) 0.280 0.219 0.190 0.202 0.229 0.237 0.230 0.186 0.330 0.239 0.221 0.234<br />
Table 2: Monthly variations in physico-chemical parameters at spring site-II, Nagrota, Jammu (January, 2003 - December, 2003)<br />
Parameters Jan. Feb. Mar. Apr. May Jun. Jul. Aug. Sep. Oct. Nov. Dec.<br />
Air Temperature ( 0 C) 15.5 20 25 35 38 29 32 22 30.5 29 23 17<br />
Water Temperature ( 0 C) 21.5 20.5 22.5 24 25 26.5 26.75 29 26 28 25 24<br />
Turbidity (NTU) 3 2.5 15 8 6 15 10 2.5 6 3 0 3<br />
pH 6.96 7.21 6.94 6.99 6.94 6.97 7.3 6.83 6.67 7.02 7.21 7.14<br />
Free CO 2<br />
(mg/L) 22.3 19.9 23.8 23.3 23.0 32.2 15.7 32.0 34.1 14.1 19.1 17.9<br />
Dissolved Oxygen (mg/L) 4.8 9.0 7.3 5.4 2.4 1.9 5.7 1.84 4.1 3.4 13.7 4.3<br />
Bicarbonate (mg/L) 228.7 324.9 221.6 292.9 300.2 323.8 302.0 330.6 326.8 391.1 330.2 366.5<br />
Chloride (mg/L) 38.8 38.3 33.5 33.1 53.5 33.7 15.5 22.7 25.5 28.4 33.1 19.7<br />
Calcium (mg/L) 101.4 117.5 158.8 80.8 81.4 27.0 95.8 85.8 76.0 34.3 63.7 106.2<br />
Magnesium (mg/L) 21.95 25.4 19.2 25.5 21.5 18.4 14.2 17.1 35.0 18.6 2.2 21.9<br />
Total Hardness (mg/L) 343.3 397.6 514.2 306.9 292.0 143.4 297.8 282.5 333.9 163.6 189.5 355.4<br />
Potassium (mg/L) 2.0 2.5 4.0 2.5 3.0 2.5 3.0 0.05 1.0 2.5 3 2.5<br />
Sodium (mg/L) 34.5 38.5 36 34.5 40 32.5 14.5 23 14 30 36.5 44.5<br />
Silicate (mg/L) 3.1 5.3 7.1 7.7 3.9 11.2 11.2 2.8 4.3 10.8 3.3 10.3<br />
Nitrate (mg/L) 3.50 5 3 4.50 3.25 6.50 4.25 3.50 1.75 3.0 0.25 4.50<br />
Phosphate (mg/L) .05 .02 .03 .09 .01 .08 .01 .08 .01 .04 .08 .08<br />
Sulphate (mg/L) 28 23 13.5 40.5 49 25 30.7 15.5 6.5 15.5 15.5 13<br />
BOD 3.2 5.4 1.9 3.0 1.1 2.9 4.1 1.44 1.2 0.2 4.2 1.1<br />
COD 19.28 3.1 11.9 4.5 6.52 12.4 25.3 26.4 20.4 52.1 5.7 33.2<br />
Conductivity (ms) .558 .207 .319 .365 .457 .453 .339 .334 .330 .474 .394 .309<br />
Salinity (ppt) .6 .4 .4 .4 .4 .4 .3 .3 .4 .4 .4 .5<br />
Total Dissolved Solids (mg/L) .285 .207 .189 .191 .234 .235 .187 .334 .208 2.30 .218 .244<br />
difference <strong>of</strong> 8.7ºC (19.8ºC, February, 2003 - 28.5ºC, July,<br />
2003) and 9.0ºC (19.5ºC, February, 2003 - 28.5ºC, August,<br />
2003), respectively. Heating and cooling <strong>of</strong> water, during its<br />
flow from spring source to the point <strong>of</strong> entry <strong>of</strong> water into<br />
Nagrota stream, may explain more annual difference in water<br />
temperature at sites before water discharge into Nagrota stream.<br />
This is in agreement with the observations <strong>of</strong> Kumar (2002).<br />
Seasonally, air and water temperature, recorded summer viz.<br />
May-September (2003) increase and winter viz. January and<br />
February (2003) trough (Tables 5-6) and is in accordance to<br />
228
WATER QUALITY AT TWO SPRING SITES<br />
Table 3: Monthly variations in physico-chemical parameters at site away from spring-I, Nagrota, Jammu (January, 2003 - December, 2003)<br />
Parameters Jan. Feb. Mar. Apr. May Jun. Jul. Aug. Sep. Oct. Nov. Dec.<br />
Air Temperature ( 0 C) 15.25 18 28 37 39.5 31 35 32 28.5 29.5 23 17.25<br />
Water Temperature ( 0 C) 19.75 18.75 21.75 25.75 27 29 29 29 28 27 24 21<br />
Turbidity (NTU) 2.5 3 2.5 2.5 3 2.5 6 6 3 7.5 0 2.5<br />
pH 7.47 7.36 7.08 7.07 6.93 6.93 7.08 6.83 7.0 7.16 7.26 7.19<br />
Free CO 2<br />
(mg/L) 10.1 13.6 25.6 30.4 36 33.2 21.9 32.6 22.9 20.4 17.2 22.6<br />
Dissolved Oxygen (mg/L) 4.4 7.2 5.6 5.4 1.3 1.6 4.3 2.2 2.9 3.7 10.9 4.0<br />
Bicarbonate (mg/L) 345.4 293.9 223.0 307.1 338.5 335.6 309.9 297.8 326.8 434.0 351.2 400.8<br />
Chloride (mg/L) 14.5 21.5 21.3 22.2 26.2 13.2 5.9 12.4 18.4 24.1 22.2 9.0<br />
Calcium (mg/L) 96.6 92.3 148.7 82.6 67.8 18.6 67.9 66.0 76.0 38.0 56.5 101.4<br />
Magnesium (mg/L) 36.5 30.5 26.0 23.9 33.9 23.5 34.3 27.5 39.4 24.1 14.3 16.1<br />
Total Hardness (mg/L) 391.5 355.8 514.2 304.7 308.9 143.4 310.8 275.7 352.0 195.4 198.5 319.2<br />
Potassium (mg/L) 1.0 1.5 2.5 2.0 2.0 2.0 2.0 1.0 1.5 2.5 3 2.5<br />
Sodium (mg/L) 17.5 19.5 19.5 19.5 20.5 20 31.5 14.5 14.5 24 26 27<br />
Silicate (mg/L) 1.8 7.6 10.9 10.8 1.6 4 8.9 4.2 6.8 8.9 7.6 9.5<br />
Nitrate (mg/L) 1.75 2 0.1 3.25 1.25 6.0 2.0 3.75 0.50 6.0 .20 2.5<br />
Phosphate (mg/L) .04 .03 .06 .08 .05 .07 .06 .04 .05 .06 .18 .19<br />
Sulphate (mg/L) 2.5 23 13 46 44.2 14 27.5 5 16 20 34 24<br />
BOD 0.7 1.5 0.7 2.4 0.4 0.2 2.2 0.7 1.8 1.4 1.4 0.7<br />
COD 9.64 13.6 2.7 13.6 13.0 3.1 6.9 26.4 6.8 19.5 23.6 24.9<br />
Conductivity (ms) .502 .344 .336 .390 .435 .426 .449 .334 .395 .506 .440 .411<br />
Salinity (ppt) .5 .4 .3 .3 .3 .4 .3 .3 .3 .5 .4 .5<br />
Total Dissolved Solids (mg/L) .244 .167 .178 .188 .216 .213 1.76 .160 .204 .253 .225 .239<br />
Table 4: Monthly variations in physico-chemical parameters at site away from spring-II, Nagrota, Jammu (January, 2003 – December, 2003)<br />
Parameters Jan. Feb. Mar. Apr. May Jun. Jul. Aug. Sep. Oct. Nov. Dec.<br />
Air Temperature ( 0 C) 15.25 18 27.5 36 39.5 31 32.5 21.5 32 28.5 23.5 17.25<br />
Water Temperature ( 0 C) 19.5 18.5 22.5 26 29 29 30 28 30 27 24 21<br />
Turbidity (NTU) 3.0 2.5 10 7.5 6 10 11.2 7.5 7.5 7.5 2.5 2.5<br />
pH 7.09 7.51 7.26 7.47 7.38 7.21 7.16 7.16 6.96 7.34 7.58 7.34<br />
Free CO 2<br />
(mg/L) 16.5 12.5 15.6 14.1 14.4 21.1 27.2 14.9 32.9 23.4 20.2 18.6<br />
Dissolved Oxygen (mg/L) 8.2 9.2 7.3 6.4 1.8 2.4 5.1 1.6 4.1 4.6 14.7 4.6<br />
Bicarbonate (mg/L) 340.3 288.8 321.6 305.7 341.5 350.3 354.6 288.9 342.9 442.0 344.9 398.3<br />
Chloride (mg/L) 15.0 16.3 20.4 22.2 24.9 15.8 15.3 8.8 18.4 25.5 22.2 10.0<br />
Calcium (mg/L) 91.7 92.3 145.3 56.2 59.4 18.8 102.8 74.9 114.0 52.4 56.5 111.1<br />
Magnesium (mg/L) 32.20 28.8 32.3 46.8 37.0 27.6 24.2 17.4 39.4 15.3 18.7 19.0<br />
Total Hardness (mg/L) 361.4 348.8 531.0 333.2 300.4 164.5 356.5 255.6 446.8 195.4 216.6 355.4<br />
Potassium (mg/L) 1.0 1.5 2.0 1.5 2.0 2.0 4.0 1.0 1.0 2.0 2.5 2.0<br />
Sodium (mg/L) 18 19 19 19 21.5 19.5 34 10.5 25 23.5 25.5 26<br />
Silicate (mg/L) 4.4 .4 11 8.0 2.9 13.7 3.7 3.7 7.3 .05 10.3 14.1<br />
Nitrate (mg/L) 1.25 0.25 1 2.50 2.50 6.0 11.25 4.0 1.50 9.75 0.50 6.50<br />
Phosphate (mg/L) .04 .05 .07 .12 .03 .03 .16 .07 .01 .05 .16 .03<br />
Sulphate (mg/L) 10.2 18.5 12.5 22.5 5.9 11.5 41 4.5 13.5 15 15.5 19<br />
BOD 1.2 5.4 1.6 4.2 2.1 1.2 4.0 0.1 2.4 1.4 1.4 0.7<br />
COD 9.64 3.1 2.7 9.08 13.0 21.8 39.1 35.2 39.4 19.5 31.5 24.9<br />
Conductivity (ms) .487 .329 .341 .368 .425 .424 .344 .329 .408 .504 .431 .393<br />
Salinity (ppt) .5 .4 .3 .3 .3 .4 .4 .3 .3 .5 .4 .5<br />
Total Dissolved Solids (mg/L) .241 .165 .172 .187 .211 .211 .222 .167 .206 .251 .221 .239<br />
the observations <strong>of</strong> Sarwar et al. (1998); Dutta et al. (1995b,<br />
2002, 2009 and 2010), Slathia et al. (2001) and Gupta et al.<br />
(2009).<br />
<strong>An</strong>nual difference <strong>of</strong> turbidity at spring sites (4.0 NTU) and at<br />
sites away from springs (11.0 NTU) is low in comparison to<br />
the findings <strong>of</strong> Sharma and Verma (2003) from some springs<br />
(0-40 NTU) at Hamirpur, Himachal Pradesh. This may be<br />
attributed to low discharge and turbulence <strong>of</strong> spring water.<br />
Agitation and suspension <strong>of</strong> sediments during water flow, after<br />
its discharge from springs, qualitative and quantitative<br />
229
S. P. S. DUTTA AND N. JANDIAL<br />
Table 5: Monthly mean variation in physico-chemical parameters at spring sites I & II, Nagrota, Jammu (January, 2003 - December, 2003)<br />
Parameters Jan. Feb. Mar. Apr. May Jun. Jul. Aug. Sep. Oct. Nov. Dec.<br />
Air Temperature ( 0 C) 15.3 19.0 26.5 36.0 39.0 30.0 34.0 22.0 29.7 29.2 24.0 16.8<br />
Water Temperature ( 0 C) 21.1 19.8 21.8 25.3 25.5 27.5 28.5 27.7 27.0 27.0 25.0 22.0<br />
Turbidity (NTU) 5.00 3.00 2.50 4.25 3.00 2.50 3.00 4.50 2.75 5.25 1.25 2.50<br />
pH 7.20 7.24 6.97 7.00 6.92 6.90 7.06 6.76 6.83 7.04 7.19 7.11<br />
Free CO 2<br />
(mg/L) 19.6 21.9 27.9 28.8 34.0 34.3 21.9 34.3 35.0 24.1 17.6 21.05<br />
Dissolved Oxygen (mg/L) 5.0 7.8 6.1 5.2 1.2 1.6 4.4 2.17 4.05 7.1 10.0 3.45<br />
Bicarbonate (mg/L) 340.2 326.1 223.1 292.9 320.8 325.3 334.8 323.0 322.8 429.9 335.45 409.35<br />
Chloride (mg/L) 26.4 30.1 26.1 30.0 30.2 23.7 19.65 15.3 21.9 28.0 30.05 15.00<br />
Calcium (mg/L) 101.2 106.2 157.0 86.1 75.4 20.2 91.0 73.0 74.15 38.0 60.1 101.4<br />
Magnesium (mg/L) 29.2 25.4 18.3 26.3 25.6 21.4 26.5 21.9 40.5 21.3 15.4 16.1<br />
Total Hardness (mg/L) 313.45 369.7 505.7 323.3 294.1 139.2 338.0 271.2 352.0 184.05 189.5 319.2<br />
Potassium (mg/L) 1.75 2.25 3.25 2.25 3.00 2.50 3.00 1.25 1.75 2.50 3.50 2.50<br />
Sodium (mg/L) 25.7 26.7 27.0 27.2 30.2 29.0 33.7 20.2 19.70 29.0 32.0 35.75<br />
Silicate (mg/L) 1.50 5.85 9.45 9.70 1.90 13.00 5.95 3.80 7.85 10.25 6.60 8.45<br />
Nitrate (mg/L) 2.75 3.87 1.67 3.00 2.87 8.00 7.00 5.12 1.50 3.75 0.22 1.75<br />
Phosphate (mg/L) 0.07 0.02 0.08 0.10 0.04 0.07 0.13 0.05 0.13 0.07 0.13 0.15<br />
Sulphate (mg/L) 13.0 26.0 28.5 45.0 30.3 18.0 31.0 5.25 14.00 20.00 25.00 17.00<br />
BOD 0.55 2.10 0.50 2.20 0.30 0.20 2.70 0.475 1.45 1.30 2.35 0.95<br />
COD 9.64 13.60 7.30 13.60 16.20 10.90 13.80 22.00 13.60 26.00 27.50 29.00<br />
Conductivity (ms) 0.510 0.370 0.400 0.380 0.332 0.445 0.400 0.341 0.362 0.481 0.424 0.443<br />
Salinity (ppt) 0.55 0.40 0.35 0.35 0.35 0.40 0.35 0.35 0.35 0.45 0.40 0.50<br />
Total Dissolved Solids (mg/L) 0.262 0.193 0.184 0.195 0.222 0.225 0.203 0.173 0.267 0.246 0.223 0.236<br />
Table 6: Monthly mean variation in physico-chemical parameters at sites away from spring I & II, Nagrota, Jammu (January, 2003 - December,<br />
2003)<br />
Parameters Jan. Feb. Mar. Apr. May Jun. Jul. Aug. Sep. Oct. Nov. Dec.<br />
Air Temperature ( 0 C) 15.8 19.0 26.2 35.5 38.7 30.0 32.2 21.7 31.2 28.7 23.2 17.1<br />
Water Temperature ( 0 C) 20.5 19.5 22.5 25.0 27.0 27.7 28.3 28.5 28.0 27.5 24.5 22.5<br />
Turbidity (NTU) 3.0 2.5 12.5 7.75 6.0 12.5 10.6 5.0 6.75 5.25 1.25 2.75<br />
pH 7.02 7.36 7.10 7.23 7.16 7.09 7.23 6.99 6.81 7.18 7.35 7.24<br />
Free CO 2<br />
(mg/L) 19.4 16.2 19.7 18.7 18.7 26.6 21.4 23.4 33.5 18.7 19.6 18.2<br />
Dissolved Oxygen (mg/L) 6.50 9.10 7.30 5.90 2.10 2.15 5.40 1.72 4.10 4.00 9.20 4.45<br />
Bicarbonate (mg/L) 284.5 306.8 271.6 299.3 320.8 337.0 328.3 309.7 334.8 410.5 337.5 382.4<br />
Chloride (mg/L) 26.9 27.3 26.9 27.6 31.6 24.7 15.4 15.7 21.9 26.9 27.6 14.8<br />
Calcium (mg/L) 96.5 104.9 152.0 68.5 70.4 22.9 99.3 80.3 95.0 43.3 60.1 108.6<br />
Magnesium (mg/L) 27.07 27.1 25.7 36.1 29.2 23.0 19.2 17.2 37.2 16.9 10.4 20.3<br />
Total Hardness (mg/L) 352.3 373.2 522.6 320.0 296.2 153.9 327.1 269.0 390.3 179.5 203.0 355.1<br />
Potassium (mg/L) 1.50 2.00 3.00 2.00 2.50 2.25 3.50 0.52 1.00 2.25 2.75 2.25<br />
Sodium (mg/L) 26.2 28.7 27.5 26.7 30.7 26.0 24.2 16.7 19.0 26.7 31.0 35.2<br />
Silicate (mg/L) 3.75 2.85 9.05 1.85 3.40 12.45 7.45 3.25 5.80 5.42 6.80 12.20<br />
Nitrate (mg/L) 2.37 2.26 2.00 3.50 2.87 6.25 7.75 3.75 1.62 6.37 0.37 5.50<br />
Phosphate (mg/L) .04 .03 .05 .10 .02 .05 .08 .07 .01 .04 .12 .05<br />
Sulphate (mg/L) 19.1 20.7 13.0 31.5 27.4 18.2 35.8 10.0 10.0 15.25 15.50 16.0<br />
BOD 14.46 3.10 7.00 6.79 9.76 17.1 32.2 30.8 29.9 35.8 23.6 29.05<br />
COD 2.2 5.4 1.7 3.60 1.6 2.0 4.5 0.77 1.8 0.8 2.8 0.9<br />
Conductivity (ms) 0.522 0.268 0.330 0.366 0.441 0.438 0.341 0.331 0.369 0.489 0.412 0.351<br />
Salinity (ppt) 0.55 0.40 0.35 0.35 0.35 0.40 0.35 0.30 0.35 0.45 0.40 0.50<br />
Total Dissolved Solids (mg/L) .263 .186 .180 .189 .222 .223 .204 .250 .207 .240 .219 .241<br />
planktonic richness in the segments between spring sites and<br />
at sites away from springs may explain comparatively higher<br />
records <strong>of</strong> turbidity at sites before water discharge into Nagrota<br />
nullah.<br />
Turbidity, at spring sites, recorded January, April, August and<br />
October increase. At sites, before water discharge into Nagrota<br />
nullah, it observed bimodal viz. March and June increase.<br />
Increased water discharge and agitation may explain August<br />
(Monsoon) and October (Post-Monsoon) increase in turbidity<br />
at spring sites. Presence <strong>of</strong> dead algal mats, in the segments<br />
230
WATER QUALITY AT TWO SPRING SITES<br />
Figure 1a: Shows origin <strong>of</strong> spring site 1<br />
Figure 2b: General view <strong>of</strong> spring 1 before spring water discharge<br />
into Nagrota nullah<br />
Figure 1b: General view <strong>of</strong> spring site 2<br />
Figure 2a: General view <strong>of</strong> spring 2 before water discharge into<br />
Nagrota nullah<br />
between springs sites and at sites before water discharge into<br />
Nagrota nullah, may explain March and June rise in turbidity<br />
(Fig. 2c).<br />
Chemical parameters<br />
pH, at spring sites and at sites before water discharge into<br />
Nagrota nullah, recorded narrow annual mean variation<br />
between 6.9-7.24 and 6.81-7.36, respectively and coincided<br />
with perennial free CO 2<br />
presence and carbonate absence<br />
(Welch, 1952; Reid and Wood, 1976; Cole, 1975; Jhingran,<br />
1991 and Wetzel, 2001).<br />
Figure 2c: General view <strong>of</strong> segment between spring site 1 and before<br />
water discharge into Nagrota nullah<br />
Present annual mean range <strong>of</strong> free CO 2<br />
at spring sites (17.6<br />
mg/L, November 2003 to 35.0 mg/L, September, 2003) and at<br />
sites before water discharge into Nagrota nullah(16.2 mg/L,<br />
February, 2003 to 33.5 mg/L, May, 2003) is low in comparison<br />
to the earlier observations <strong>of</strong> Tanti and Saha (1992), from<br />
thermal springs <strong>of</strong> Rajgir (92 - 116 ppm), Bihar, Patralekh<br />
(1994), from hot springs <strong>of</strong> Kharagpur (31.6 - 133 ppm), Bihar,<br />
Slathia et al. (2001) from Rehtari Spring (68.82 - 99.97 mg/L),<br />
Udhampur, Jammu, Dutta et al. (2002), from Bhillan spring<br />
(64.85 - 94.28 mg/L), Udhampur, Jammu, Kumar (2002), from<br />
Tatoi thermal spring (61 - 75 mg/L), Pargand district, Jharkhand<br />
and Bhat and Yousuf (2002), from seven springs (22 - 46 mg/<br />
L), Kashmir. This has its correlation with shallowness,<br />
reheocrene nature <strong>of</strong> springs, low deposits <strong>of</strong> dead organic<br />
matter and calcareous rocks presence in catchment area <strong>of</strong><br />
Nagrota springs.<br />
Present record <strong>of</strong> free CO 2<br />
at sites before water discharge into<br />
Nagrota stream is low as compared to spring sites. Rapid fall in<br />
free CO 2<br />
, along a rheocrene spring gradient, has also been<br />
reported by Saha (1993) and Kumar (2002) and is due to:<br />
i) Water agitation and rapid diffusion <strong>of</strong> free CO 2<br />
.<br />
ii) Release <strong>of</strong> pressure as the water comes out <strong>of</strong> fissure, and<br />
iii) Utilization <strong>of</strong> CO 2<br />
during photosynthesis by algal mats<br />
present in the intermediate segments.<br />
Effect <strong>of</strong> rains may explain monsoon (June – September)<br />
231
S. P. S. DUTTA AND N. JANDIAL<br />
comparatively higher record <strong>of</strong> free CO 2<br />
in spring water (Tables<br />
1-6).<br />
At spring sites and at sites away from springs, DO recorded an<br />
annual difference <strong>of</strong> 9.7 mg/L and 7.5 mg/L, respectively.<br />
Shallowness and rheocrene nature <strong>of</strong> springs may account<br />
for wide variation in DO in comparison to the early observation<br />
<strong>of</strong> Dutta et al. (2002) from Bhillan Spring (1.9 - 4.8 mg/L),<br />
Udhampur, Jammu, Kumar (2002) from thermal springs <strong>of</strong><br />
Tantoi, Jharkhand (0.8 - 2.5 mg/L), Dutta et al. (2009) from two<br />
springs adjacent to chatha nullah, (1.77-3.75mg/L), Jammu<br />
and Gupta et al. (2009) from a spring adjacent to river Tawi,<br />
Near Nagrota, Bye Pass, (4.64 - 8.71 mg/L), Jammu.<br />
Record <strong>of</strong> DO, at site before water discharge into Nagrota<br />
stream is higher in comparison to the spring sites. This is in<br />
agreement with the findings <strong>of</strong> Saha (1993) and Kumar (2002)<br />
and has its correlation with<br />
i) Physical aeration <strong>of</strong> water,<br />
ii) Rich diversity and density <strong>of</strong> phytoplankton seen in the<br />
segments away from springs, and<br />
iii) Low record <strong>of</strong> free CO 2<br />
.<br />
Seasonally, at spring sites and at sites away from springs, DO<br />
recorded trimodal viz. February, July and November increase<br />
and May, June and August trough. Its highest and lowest valve<br />
is seen in the month <strong>of</strong> November and May, respectively at<br />
spring sites. At sites away from springs, DO recorded<br />
November highest and August lowest record. Post-Monsoon<br />
increased turbulence, due to high water discharge, may explain<br />
November highest record <strong>of</strong> DO at both the experimental<br />
sites.<br />
BOD and COD, at spring sites and at sites before water<br />
discharge into Nagrota stream, varied between 0.2-2.7 mg/L<br />
and 0.77-5.4 mg/L and 7.3-29.0 mg/L and 3.1-35.8 mg/L,<br />
respectively. Present analysis has revealed comparatively a<br />
high record <strong>of</strong> BOD and COD in water sample collected at<br />
sites away from springs, in comparison to spring sites, and<br />
may be attributed to the presence <strong>of</strong> algal mats in segments<br />
between two experimental sites (Patel and Sinha, 1998).<br />
Seasonally, BOD recorded February, April, July and November<br />
increase, at both the experimental sites. Highest record <strong>of</strong><br />
BOD is seen in July at spring sites and in December at sites<br />
away from springs. July rise in BOD, at both these experimental<br />
sites, is most probably caused by monsoon showers, when<br />
large quantities <strong>of</strong> dead organic matter infiltrate from top soil.<br />
Monsoon highest value <strong>of</strong> BOD may also explain the highest<br />
biological activity at high temperature (Agarwal et al., 1976;<br />
Bhargava, 1985).<br />
Seasonally COD recorded tetra modal increase both at spring<br />
sites (February, May, August and December) and at sites before<br />
water discharge into Nagrota stream (January, July, October<br />
and December). At spring sites, it recorded December highest<br />
and March lowest record. Whereas, its highest record is<br />
noticed in the month <strong>of</strong> October and lowest in the month <strong>of</strong><br />
February at sites away from springs (Tables 5-6).<br />
Bicarbonate, calcium, magnesium and total hardness at spring<br />
sites, recorded an annual mean difference <strong>of</strong> 206.8 mg/L, 136.8<br />
mg/L, 25.1 mg/L and 366.5 mg/L, respectively. At sites away<br />
from the springs, these showed an annual mean difference <strong>of</strong><br />
138.9 mg/L, 129.1 mg/L, 26.8 mg/L and 368.7 mg/L,<br />
respectively. These observations are different from the earlier<br />
records <strong>of</strong> Tanti and Saha (1992) from thermal springs <strong>of</strong> Rajgir<br />
(bicarbonate: 56-189 mg/L), Bihar, Patralekh (1994) in hot<br />
springs (calcium: 3-4.5 mg/L, magnesium: 0.12-1.6 mg/L, total<br />
hardness: 10-16.4 mg/L), Kharagpur, Bihar, Slathia et al. (2001),<br />
from Rehtari Spring (bicarbonate: 78.18 – 109.6 mg/L, calcium:<br />
41-93 – 57.03 mg/L, magnesium 10.58 – 15.95 mg/L and<br />
total hardness 148.10 – 196.92 mg/L), Udhampur, Jammu,<br />
Dutta et al. (2002) from Bhillan Spring (bicarbonate: 78.18 –<br />
130.46 mg/L, calcium: 36.15-61-41 mg/L, magnesium 4.62-<br />
19.9 mg/L, total hardness 122.7 – 201.7 mg/L), Udhampur,<br />
Jammu, Dutta et al. (2009) (bicarbonate: 342.8-390.35mg/L,<br />
calcium: 51.68-99.92mg/L, magnesium: 17.46-35.36mg/L,<br />
total hardness 128.87-394.82mg/L) from two springs adjacent<br />
to chatha nullah, Jammu and Gupta et al. (2009) (bicarbonate:<br />
87.48 – 253.61 mg/L, calcium: 21.31 – 54.48 mg/L,<br />
magnesium 5.85 – 18.23 mg/L, total hardness 83.92 – 206.5<br />
mg/L) from a spring adjacent to river Tawi, Nagrota, Jammu.<br />
Bicarbonate, calcium, magnesium and total hardness<br />
enrichment in these springs, as compared to the findings <strong>of</strong><br />
some earlier workers, (op cit.) may be attributed, to the flow <strong>of</strong><br />
subsurface water through calcareous rocks and perennial free<br />
CO 2<br />
presence converting insoluble marls into soluble<br />
bicarbonate:<br />
CO 2<br />
+ H 2<br />
O H 2<br />
CO 3<br />
CaCO 3<br />
+ H 2<br />
CO 3<br />
→ Ca (HCO 3<br />
) 2<br />
Presence <strong>of</strong> algal mats in the segments between springs and<br />
sites away from springs may explain low record <strong>of</strong> these<br />
nutrients at latter sites.<br />
Potassium and sodium, at spring sites, recorded an annual<br />
mean variation <strong>of</strong> 1.25 – 3.5 mg/L and 19.7 – 35.7 mg/L,<br />
respectively. At sites away from springs, sodium observed an<br />
annual variation <strong>of</strong> 16.7 – 35.2 mg/L, whereas potassium<br />
showed an annual fluctuation <strong>of</strong> 0.52 – 3.5 mg/L.<br />
<strong>An</strong> observation <strong>of</strong> Tables 5 and 6 reveal wide variation and<br />
low record <strong>of</strong> sodium and potassium at sites before water<br />
discharge into Nagrota nullah in comparison to spring sites.<br />
Rich phytophanktonic diversity and density in segment<br />
between two experimental sites (Mickle and Wetzel, 1978a<br />
and Barko, 1982) may explain present low record <strong>of</strong> sodium<br />
and postassium (Fig. 2c).<br />
Sodium showed its lowest and highest valve in the month <strong>of</strong><br />
August and December at both the experimental sites. Dilution<br />
caused by monsoon, due to increased flush from springs may<br />
explain August lowest observation <strong>of</strong> sodium and potassium.<br />
Silicate, phosphate and nitrate at spring sites and at down<br />
stream recorded an annual variation <strong>of</strong> 1.5 – 13.0 mg/L and<br />
2.85 – 12.45 mg/L, 0.02 – 0.15 mg/L and 0.01 – 0.12 mg/L,<br />
0.22 – 8 mg/L and 0.37 – 7.75 mg/L, respectively. This range<br />
<strong>of</strong> silicate and phosphate is high in comparison to the<br />
observation <strong>of</strong> Jamwal (1998), from a spring (silicate: 0.036 –<br />
0.136 mg/L, phosphate: 0.000068 – 0.0092 mg/L) near village<br />
Chatha, Jammu, Sarin (1998) from a spring (silicate: 0.03-0.136<br />
mg/L, phosphate: 0.0007-0.064 mg/L) adjacent to Behllol<br />
nullah, Jammu and Dutta et al. (2009), from two springs<br />
adjacent to chatha nullah, (silicate: 0.016-3.021mg/L, nitrate:<br />
0.024-3.94mg/L, phosphate: 0.004-0.0077mg/L). Present<br />
232
WATER QUALITY AT TWO SPRING SITES<br />
observations are, however, low, when compared to the<br />
findings <strong>of</strong> Jana (1973), from the thermal springs <strong>of</strong> Bakreshwar<br />
(silicate: 12-40 ppm, phosphate: 0.02 – 1.50 ppm), Birbhum,<br />
India.<br />
Presence <strong>of</strong> algal mats in the segment between these two<br />
experimental sites may account for low record <strong>of</strong> silica,<br />
phosphorous and nitrate in water samples collected at sites<br />
before water discharge into Nagrota stream, as compared to<br />
spring sites and is in agreement with the findings <strong>of</strong> Saha (1993)<br />
and Kumar (2002).<br />
<strong>An</strong> observation <strong>of</strong> Tables 5 and 6 reveals April, June, October<br />
and December rise in silicate at spring sites. It recorded June<br />
highest and January lowest observation. In the water sample<br />
collected at sites before spring water discharge into Nagrota<br />
stream silicate recorded March, June, September and<br />
December increase. Lowest and highest record <strong>of</strong> silicate is<br />
seen in the month <strong>of</strong> February and June, respectively (Tables<br />
5 and 6). June highest record <strong>of</strong> silica coincided with<br />
premonsoon rains. Silicate enrichment during rains has also<br />
been earlier reported by Saha (1993), Kumar (2002) and Dutta<br />
et al. (2009).<br />
Seasonally, at sites before water discharge into Nagrota nullah,<br />
phosphate highest and lowest record is seen in the month <strong>of</strong><br />
November and and September, respectively. At spring sites,<br />
phosphate highest record is seen during July, September and<br />
November and lowest in February (Table 5 and 6).<br />
Nitrate, seasonally, recorded February, April, July, October<br />
and December increase in water samples collected at sites<br />
before water discharge into Nagrota nullah. At spring sites,<br />
nitrate observed, February, June, August and October increase.<br />
At both the experimental sites, highest and lowest record <strong>of</strong><br />
nitrate is seen in the month <strong>of</strong> June and November, respectively.<br />
June highest record <strong>of</strong> nitrate may be due to the effect <strong>of</strong> premonsoon<br />
showers. Nitrate enrichment due to rains has also<br />
been reported by Singh et al. (2000), Wetzel (2000) and Dutta<br />
et al. (2009). Effects <strong>of</strong> rains may also explain July/August rise<br />
in nitrate, seen during the present analysis. October rise in<br />
nitrate, at both the experimental sites, has its correlation with<br />
post-monsoon increased flush from springs.<br />
Sulphate, at spring sites and at sites away from springs,<br />
recorded an annual mean variation <strong>of</strong> 5.25-45.0 mg/L and<br />
10.0-35.8 mg/L, respectively. These observations <strong>of</strong> sulphate<br />
are high in comparison to the earlier findings <strong>of</strong> Negi et al.<br />
(2001), from Himalayan Springs (1.7-7.0 mg/L), Almora,<br />
Uttaranchal. Absence <strong>of</strong> any type <strong>of</strong> pollution (industrial,<br />
Sewage etc.) and low deposits <strong>of</strong> sulphate in catchment rocks<br />
may explain present low record <strong>of</strong> sulphate, as compared to<br />
the observations <strong>of</strong> some earlier workers (op cit).<br />
Seasonally, sulphate recorded trimodal increase, both at spring<br />
sites (April, July and November) and at sites before spring<br />
water discharge into Nagrota Stream (February, April and July).<br />
It recorded April highest and August lowest record at spring<br />
sites. At sites away from springs, sulphate recorded July highest<br />
and August and September lowest record. Present water<br />
analysis has revealed low record <strong>of</strong> sulphate at sites before<br />
water discharge into Nagrota Stream as compared to spring<br />
sites and is because <strong>of</strong> sulphate consuming phytoplankton<br />
present between two experimental sites (Schwoerbel, 1991).<br />
Electrical conductivity, at both spring sites and at sites away<br />
from springs, recorded an annual mean variation between<br />
0.332-0.510 mS and 0.268-0.522 mS, respectively. High<br />
record <strong>of</strong> electrical conductivity is seen at spring sites as<br />
compared to the sites before water discharge into Nagrota<br />
stream. This may be due to the presence <strong>of</strong> high ionic<br />
constituents like sodium, potassium, calcium, magnesium etc.<br />
at spring sites.<br />
Seasonally, conductivity recorded January highest value both<br />
at spring sites and at sites before spring water discharge into<br />
Nagrota stream. Lowest record <strong>of</strong> conductivity is seen in the<br />
month <strong>of</strong> May at spring sites and in the month <strong>of</strong> August in<br />
water samples collected at sites before water discharge into<br />
Nagrota nullah (Tables 5 and 6).<br />
Salinity revealed an annual mean variation between 0.35-0.55<br />
ppt and 0.3 – 0.55 ppt, respectively, at spring sites and at sites<br />
before water discharge into Nagrota nullah (Tables 5 and 6).<br />
Seasonally, at spring sites and at sites away from springs, salinity<br />
recorded January highest record. Reduced water discharge,<br />
due to winter low temperature, may explain December and<br />
January rise in salinity, with January highest record.<br />
Total dissolved solids at spring sites and at sites away from<br />
springs recorded an annual mean variation from 0.173-0.267<br />
ppt and 0.180-0.263 ppt, respectively. Total dissolved solids<br />
record is higher at spring sites. This may be due to high record<br />
<strong>of</strong> salinity, conductivity, calcium, magnesium, sodium and<br />
potassium in comparison to their findings at sites away from<br />
springs. Consumption <strong>of</strong> various salts by growing algae present<br />
in the segment between spring sites and at sites before water<br />
discharge into Nagrota nullah may account for low record <strong>of</strong><br />
TDS at sites away from springs.<br />
Seasonally, TDS recorded a high record in the month <strong>of</strong><br />
September at spring sites and, in the month <strong>of</strong> January at sites<br />
away from springs. These observed low record <strong>of</strong> TDS in the<br />
month <strong>of</strong> March and August at spring sites and at sites away<br />
from spring.<br />
REFERENCES<br />
Agarwal, D. K., Gaur, S. D., Tiwari, I. C., Naraganaswami, M. S. and<br />
Harwai, S. N. 1976. Physico-chemical character’s <strong>of</strong> the Ganga at<br />
Varanasi India. J. Env. Hlth. 18: 201 - 206.<br />
APHA. 1998. Standard method for the examination <strong>of</strong> waste water<br />
(20 th Edn.). Amer. Publ. Hlth. Assoc. Inc. Washington.<br />
Barko, J. W. 1982. Influence <strong>of</strong> potassium source (sediment vs. open<br />
water) and sediment composition on the growth and nutrition <strong>of</strong> a<br />
submerged fresh water macrophyte (Hydrilla verticillata) (L. f.).<br />
Bhargava, D. S. 1985. Variations in the equality in the Ganges. Effluent<br />
and Water Treatment J. pp. 33 - 41.<br />
Bhat, F. A. and Yousuf, A. R. 2002. Ecology <strong>of</strong> periphytic community<br />
<strong>of</strong> seven springs <strong>of</strong> Kashmir. J. Res. Dev. 2: 47 - 59.<br />
Buist, G. 1851. Notes on hot springs <strong>of</strong> India. Trans. Bombay Geogr.<br />
Soc. 10: 63 - 65.<br />
Cole, G. A. 1975. A textbook <strong>of</strong> limnology. The C. V. Mosby Company,<br />
Sain Louis.<br />
Dutta, S. P. S., Malhotra, Y. R., Sharma, K. and Kumar, S. 1995a.<br />
Diel variations in physico – chemical characterstics <strong>of</strong> spring water<br />
adjacent to river Tawi, near Nagrota bye pass, Jammu. Ibid. 78: 196.<br />
Dutta, S. P. S., Khullar, M. and Sharma, J. 1995b. physico – chemical<br />
233
S. P. S. DUTTA AND N. JANDIAL<br />
characterstics <strong>of</strong> spring water near chatha, Jammu.Nat.symp.Recent<br />
Advances in Bio-sciences Nov 3-5,1985. Rohtak Univ. Haryana. 38: 197.<br />
Dutta, S. P. S., Slathia, D., Gupta, S. C. and Charak, V. 2002. Ecology<br />
<strong>of</strong> zooplankton in Bhillan spring, Udhampur, Jammu. J. Aqua. Biol.<br />
18(2): 11-16.<br />
Dutta, S. P. S., Khullar, M. and Sharma, J. 2009. Limnology <strong>of</strong> two<br />
springs adjacent to Chatha nullah, Jammu Part1. Water chemistry.<br />
The Ecoscan. 3(3-4): 241 - 246.<br />
Dutta, S. P. S., Sharma, J. and Gupta, S. C. 2010. Water quality <strong>of</strong><br />
some springs in Udhampur and Jammu districts there conservation<br />
and management. Ro<strong>of</strong> top rain water harvesting and spring recharge.<br />
Workshop volume. CGWB. p. 157.<br />
Gupta, C. S., Dalpatia, M. and Dutta, S. P. S. 2009. Water quality<br />
and Zooplankton <strong>of</strong> a spring adjacent to river Tawi,near Nagrota bye<br />
pass, Jammu. The Ecoscan. 3(3 and4): 303 - 306.<br />
Jamwal, A. 1998. Limnology <strong>of</strong> a spring near village Chatha, Jammu<br />
with reference to zooplankton. M.Sc. Dissertation, Univ. <strong>of</strong> Jammu,<br />
Jammu.<br />
Jana. 1973. The thermal springs <strong>of</strong> Bakreswar, India, physic-chemical<br />
conditions, flora and fauna. Hydrobiol. 41(3): 291 - 307.<br />
Jhingran, V. G. 1991. Fish and fisheries <strong>of</strong> India. Hindustan Publishing<br />
Corporation, India. p. 954.<br />
Kumar, A. 2002. The ecology <strong>of</strong> equatic biota in thermal springs. In:<br />
Ecology and Ethology <strong>of</strong> Aquatic Biota. Daya Publishing House, Delhi.<br />
11: 1 - 53.<br />
Macpherson, J. 1855. Mineral springs in British India, with a few<br />
remarks. Indian <strong>An</strong>n. Sci. 2: 205 - 221.<br />
Mickle, A. M. and Wetzel, R. G. 1978a. Effectiveness <strong>of</strong> submerged<br />
angiosperm-epiphyte complexes on exchange <strong>of</strong> nutrients and organic<br />
carbon in littoral systems-I: Inorganic Nutrients. Aquat. Bot. 4: 303 -<br />
316.<br />
Negi, G. C. S., Kumar, K., Joshi, V., Panda, Y. S. and Satyal, G. S.<br />
2001. Water yield and water quality <strong>of</strong> some aquifers in the Himalaya.<br />
Int. J. Eco. and Env. Sc. 27: 55 - 59.<br />
Newbold, T. J. 1848. On the thermal springs <strong>of</strong> Calwa and Mahanadi<br />
in the Kurnool Province, Madras. J. Lit. Sci. 15: 160 - 162.<br />
Patel, N. K. and Sinha, B. K. 1998. Study <strong>of</strong> the pollution load in the<br />
ponds <strong>of</strong> Burla area near Hirakund Dam <strong>of</strong> Orissa. J. Env. Poll. 5(2):<br />
157 - 160.<br />
Patralekh, L. N. 1994. Comparative account <strong>of</strong> physic-chemical<br />
properties <strong>of</strong> three fresh water ecosystem. J. Fresh Water Biol. 6(2):<br />
115 - 119.<br />
Reid, G. K. and Wood, R. D. 1976. Ecology <strong>of</strong> inland waters and<br />
estuaries. D. Van Norstrand Company, New York. p. 485.<br />
Saha, S. K. 1993. Limnology <strong>of</strong> thermal springs. Narendra Publishing<br />
House, Delhi. pp. 1 - 176.<br />
Sarin. 1998. Limnology <strong>of</strong> a spring adjacent to Balol nullah, Jammu<br />
with reference to zooplankton. M.Sc. Dissertation, Univ. <strong>of</strong> Jammu,<br />
Jammu.<br />
Sarwar, S. S., Kundanagar, M. R. D. and Waheed, A. 1998. Physicochemical<br />
environment <strong>of</strong> some springs <strong>of</strong> Kashmir. Geobios (New<br />
Reports). 7: 187 - 189.<br />
Schlagistweit, R. 1862. Enumeration <strong>of</strong> the hot springs <strong>of</strong> India and<br />
Asia. J. Asiatic Soc. Bengal. 33: 49 - 56.<br />
Schowerbel, J. 1991. Limnology. Scientific Publishers, Jodhpur.<br />
Singh, S. K., Chauhan, M. P., Swaroop, V. T. and Yadav, P. N. 2000.<br />
Seasonal variation in ground water quality <strong>of</strong> Agra city. Ind. J. Env.<br />
Hlth. 42(2): 59 - 69.<br />
Slathia, D., Gupta, S. C. and Dutta, S. P. S. 2001. Limnobiotic<br />
studies <strong>of</strong> Rehtari spring, Udhampur, Jammu, with special reference<br />
to zooplankton. J. Natcon. 13(2): 297 - 306.<br />
Tanti, K. D. and Saha, S. K. 1992. Limnobiotic studies <strong>of</strong> thermal<br />
springs <strong>of</strong> Rajgir. J. Freshwater Biol. 4(11): 31 - 38.<br />
Welch, P. S. 1952. Limnology. Mc Graw Hill Book Co. Inc., New<br />
York. p. 539.<br />
Wetzel, R. S. 2001. Limnology. W.B. Saunders Co. Philadelphia.<br />
*Original not seen<br />
234