Download a PDF of this issue - Field Exchange - Emergency ...
Download a PDF of this issue - Field Exchange - Emergency ...
Download a PDF of this issue - Field Exchange - Emergency ...

Create successful ePaper yourself
Turn your PDF publications into a flip-book with our unique Google optimized e-Paper software.
<strong>Field</strong> Article<br />
Valid International, India<br />
Managing severe<br />
acute malnutrition<br />
in India:<br />
prospects and<br />
challenges<br />
By Biraj Patnaik<br />
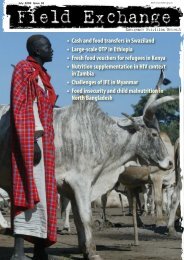
Self Help Group outsde their facility for making<br />
blended food for children under 3 years<br />
Biraj Patnaik is the Principal Adviser to<br />
the Commissioners <strong>of</strong> the Supreme<br />
Court <strong>of</strong> India in the right to food case.<br />
He is also associated with the Right to<br />
Food Campaign in India. This paper<br />
reflects his personal views.<br />
This article is based on a case study and presentation delivered by Biraj Patnaik for the<br />
Addis Ababa Conference on CMAM scale up in November 2011. He describes the scale <strong>of</strong><br />
nutritional problems in India, current institutional mechanisms, and challenges in addressing<br />
the SAM burden in particular. Jamie Lee and Bernadette Feeney (Valid International) were<br />
invited by the India delegation to describe a number <strong>of</strong> developments in India since the<br />
conference around CMAM that are shared in a postscript.<br />
The context<br />
Despite being the second fastest growing economy<br />
in the world, India continues to harbour<br />
some <strong>of</strong> the worst social sector indicators. India<br />
has the highest burden <strong>of</strong> child malnutrition in<br />
the world, with 42.7% <strong>of</strong> children under 5 years<br />
<strong>of</strong> age (U5s) classified as underweight (low<br />
weight for age). Twenty per cent <strong>of</strong> children<br />
under five years <strong>of</strong> age are wasted (low weight<br />
for height). The child prevalence <strong>of</strong> malnutrition<br />
in India is twice that <strong>of</strong> Sub-Saharan Africa<br />
and more than one third <strong>of</strong> the world’s children<br />
who are wasted live in India. Forty eight per<br />
cent <strong>of</strong> U5s (61 million children) are (low height<br />
for age) due to chronic undernutrition, accounting<br />
for more than 3 out <strong>of</strong> every 10 stunted<br />
children in the world 1 .<br />
According to the most recent National<br />
Family Health Survey (NFHS 3, 2005-06), one<br />
Table 1: National Family Health Survey:<br />
a comparative account<br />
Status <strong>of</strong> children under six years NFHS-2 NFHS-3<br />
<strong>of</strong> age<br />
Infant Mortality Rate<br />
68 57<br />
(deaths/1,000 live births)<br />
Children under three years who 19.7 22.9<br />
are wasted (%)<br />
Children under three years who 42.7 40.4<br />
are underweight (%)<br />
Percentage <strong>of</strong> children 12-23 43.5 42<br />
months who received all<br />
recommended vaccines (%)<br />
Children with diarrhoea in the last 26.2 26.9<br />
two weeks who received ORS (%)<br />
Children age 0-5 months<br />
46.3 40.8<br />
exclusively breastfed (%)<br />
Children age 6-35 months who are 78.9 69.4<br />
anaemic (%)<br />
Children age 3-5 years who are<br />
attending a pre-school (%) (NSS,<br />
2004-05) (%)<br />
34.4<br />
Note: The figures here are based on NCHS data to facilitate<br />
comparison between NFHS-2 and NCHS-3. Figures for NFHS-<br />
3 based on 2006 WHO Growth Standards are available at<br />
http://www.nfhsindia.org/nfhs3.html and are reflected in<br />
subsequent tables in <strong>this</strong> article.<br />
third <strong>of</strong> children are born with a low birth<br />
weight. The percentage <strong>of</strong> under three year olds<br />
(U3s) who are anaemic has actually increased<br />
from 74.2 per cent to 79.2 per cent and immunisation<br />
coverage has decreased slightly from<br />
26.9 per cent to 26.2 per cent. A recent survey by<br />
the National Nutrition Monitoring Bureau<br />
(NNMB 2007) shows that there is a daily deficit<br />
<strong>of</strong> over 500 calories in the intakes <strong>of</strong> children in<br />
the age group <strong>of</strong> 1-3 years and about 700 calories<br />
in children in the age group 3-6 years.<br />
The fact that these figures are the most<br />
“updated” and that data on malnutrition is not<br />
compiled more regularly, is in itself reflective <strong>of</strong><br />
the failure <strong>of</strong> the country’s policymakers to<br />
appreciate the seriousness and scale <strong>of</strong> the problem<br />
<strong>of</strong> child malnutrition in India. What is even<br />
more worrying is the lack <strong>of</strong> progress in tackling<br />
child malnutrition. In 1999, NFHS 2 had estimated<br />
the child malnutrition rate at 47%. Only a<br />
one percent reduction in the intervening six<br />
years, between NFHS 2 and NFHS 3, points to a<br />
Figure 1: Indian States in the Global Hunger Index<br />
(Source: IFPRI, Global Hunger Index 2010)<br />
serious crisis in tackling malnutrition. Table 1<br />
(NFHS 3) reflects the indicators at the national<br />
level on a range <strong>of</strong> nutritional indicators.<br />
While the problem <strong>of</strong> malnutrition is<br />
endemic across the country, some states bear a<br />
more than disproportionate burden <strong>of</strong> hunger<br />
and malnutrition. Figure 1 (IFPRI, Global<br />
Hunger Index, 2010) classifies all the<br />
states/union territories with respect to three<br />
indicators <strong>of</strong> child malnutrition, infant mortality<br />
and percentage <strong>of</strong> persons consuming less<br />
than 1700 calories per day. The map demonstrates<br />
how the regional distribution <strong>of</strong><br />
malnutrition in the country varies widely, with<br />
Madhya Pradesh having the highest proportion<br />
<strong>of</strong> malnourished U3 children (60%) and<br />
Mizoram with the lowest percentage (19.9%).<br />
There has been uneven progress in the<br />
reduction <strong>of</strong> malnutrition in India, in terms <strong>of</strong><br />
regional variations. Table 2 summarises the<br />
performance <strong>of</strong> the best performing States<br />
between the two NFHS surveys (1999 and<br />
2006). Sixteen states reported a reduction in<br />
child malnutrition between 1999 and 2006.<br />
However, 13 states reported an increase in child<br />
malnutrition, in the corresponding period.<br />
Even Kerala, which is also by far the best state<br />
in India with respect to most social indicators,<br />
showed a marginal increase in child malnutrition<br />
rates. Table 3 summarises the worst<br />
performing states. Ironically, some states with<br />
the highest per capita income in country,<br />
including Punjab, Haryana and Gujarat,<br />
showed an increase in the child malnutrition<br />
rates.<br />
The causes <strong>of</strong> malnutrition in India are due<br />
to a variety <strong>of</strong> factors, including low birth<br />
weight <strong>of</strong> babies, early marriage and pregnancy,<br />
low status <strong>of</strong> women and lack <strong>of</strong> access to quality<br />
health care at the primary level. India has<br />
the highest rate <strong>of</strong> open defecation in the world<br />
1<br />
Source <strong>of</strong> prevalence figures: UNICEF, accessed June 2012<br />
http://www.unicef.org/india/nutrition.html<br />
85