Union Pacific Corporation 2002 Annual Report
Union Pacific Corporation 2002 Annual Report Union Pacific Corporation 2002 Annual Report
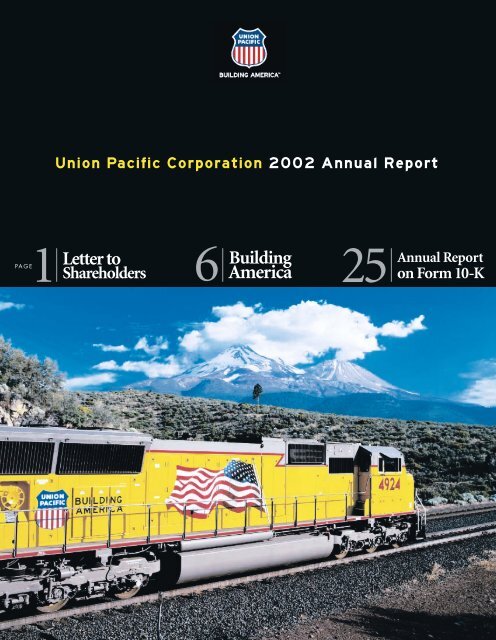
Union Pacific Corporation 2002 Annual Report PAGE 1 Letter to 6 Building 25 Shareholders America Annual Report on Form 10-K
- Page 2 and 3: FINANCIAL HIGHLIGHTS Millions of Do
- Page 4 and 5: LETTER TO SHAREHOLDERS 2 Union Paci
- Page 6 and 7: LETTER TO SHAREHOLDERS 4 Revenues g
- Page 8 and 9: UNION PACIFIC 6 building value Unio
- Page 10 and 11: BUILDING VALUE 8 Working with allia
- Page 12 and 13: UNION PACIFIC 10 BUILDING SERVICE U
- Page 14 and 15: BUILDING SERVICE 12 By focusing on
- Page 16 and 17: UNION PACIFIC 14 BUILDING REPUTATIO
- Page 18 and 19: UNION PACIFIC 16 BUILDING COMMUNITI
- Page 20 and 21: UNION PACIFIC 18 BUILDING PRIDE Wit
- Page 22 and 23: UNION PACIFIC 20 BUILDING NETWORKS
- Page 24 and 25: UNION PACIFIC 22 U N I O N P A C I
- Page 26 and 27: UNION PACIFIC 24 DIRECTORS AND OFFI
- Page 28 and 29: Documents Incorporated by Reference
- Page 30 and 31: Rail Operations - The Railroad is a
- Page 32 and 33: cleanup or further assessment. Amon
- Page 34 and 35: illion in capital expenditures duri
- Page 36 and 37: Chowchilla and Sacramento, Californ
- Page 38 and 39: Item 4. Submission of Matters to a
- Page 40 and 41: PART II Item 5. Market for the Regi
- Page 42 and 43: the reported amounts of revenues, e
- Page 44 and 45: Non-Operating Items - Interest expe
- Page 46 and 47: Salaries, Wages and Employee Benefi
- Page 48 and 49: Operating Expenses - Operating expe
- Page 50 and 51: Energy - Energy commodity revenue i
<strong>Union</strong> <strong>Pacific</strong> <strong>Corporation</strong> <strong>2002</strong> <strong>Annual</strong> <strong>Report</strong><br />
PAGE<br />
1<br />
Letter to<br />
6<br />
Building<br />
25<br />
Shareholders<br />
America<br />
<strong>Annual</strong> <strong>Report</strong><br />
on Form 10-K
FINANCIAL HIGHLIGHTS<br />
Millions of Dollars, Except Ratios and Per Share Amounts <strong>2002</strong> 2001 2000 [a]<br />
For the Year<br />
Operating Revenue . . . . . . . . . . . . . . . . . . . . . . . . . . . . . . . . . . $12,491 $11,973 $11,878<br />
Operating Income . . . . . . . . . . . . . . . . . . . . . . . . . . . . . . . . . . 2,324 2,072 1,903<br />
Net Income . . . . . . . . . . . . . . . . . . . . . . . . . . . . . . . . . . . . . . . . 1,341 966 842<br />
Net Income Per Share - Basic . . . . . . . . . . . . . . . . . . . . . . . . . 5.32 3.90 3.42<br />
Net Income Per Share - Diluted . . . . . . . . . . . . . . . . . . . . . . . 5.05 3.77 3.34<br />
Dividends Per Share . . . . . . . . . . . . . . . . . . . . . . . . . . . . . . . . . 0.83 0.80 0.80<br />
Operating Cash Flow . . . . . . . . . . . . . . . . . . . . . . . . . . . . . . . . 2,250 1,992 2,053<br />
Capital Investments . . . . . . . . . . . . . . . . . . . . . . . . . . . . . . . . . 1,887 1,736 1,783<br />
At Year-End<br />
Total Assets . . . . . . . . . . . . . . . . . . . . . . . . . . . . . . . . . . . . . . . . $32,764 $31,551 $30,917<br />
Total Debt . . . . . . . . . . . . . . . . . . . . . . . . . . . . . . . . . . . . . . . . . 7,704 8,080 8,351<br />
Common Shareholders’ Equity . . . . . . . . . . . . . . . . . . . . . . . . 10,651 9,575 8,662<br />
Equity Per Common Share . . . . . . . . . . . . . . . . . . . . . . . . . . . 41.99 38.26 35.09<br />
Financial Ratios (%)<br />
Operating Margin . . . . . . . . . . . . . . . . . . . . . . . . . . . . . . . . . . . 18.6 17.3 16.0<br />
Operating Ratio . . . . . . . . . . . . . . . . . . . . . . . . . . . . . . . . . . . . 81.4 82.7 84.0<br />
Debt to Capital Employed [b] . . . . . . . . . . . . . . . . . . . . . . . . . . 38.8 42.2 45.1<br />
Return on Average Common Shareholders’ Equity . . . . . . . . 13.3 10.6 10.1<br />
[a]2000 operating income and net income included a work force reduction charge of $115 million pre-tax and $72 million after-tax<br />
(see note 13 to the Consolidated Financial Statements in Form 10-K).<br />
[b]Debt to capital employed is computed as follows: total debt divided by debt plus equity plus convertible preferred securities.<br />
Operating Revenues<br />
$ MILLIONS<br />
$12,491<br />
Operating Income<br />
$ MILLIONS<br />
$2,324<br />
Net Income<br />
$ MILLIONS<br />
$1,341<br />
<strong>2002</strong> Stock Price<br />
Comparison<br />
+5%<br />
-17% -23%<br />
$11,973<br />
$11,878<br />
$1,804 $1,903 $2,072<br />
$810<br />
$914*<br />
$842<br />
$966<br />
$11,237<br />
99 00 01 02<br />
<strong>Union</strong> <strong>Pacific</strong> <strong>Corporation</strong><br />
99 00 01 02<br />
<strong>Union</strong> <strong>Pacific</strong> <strong>Corporation</strong><br />
99 00 01 02<br />
<strong>Union</strong> <strong>Pacific</strong> <strong>Corporation</strong><br />
*excluding $72 million after-tax<br />
work force reduction charge<br />
DOW<br />
S&P<br />
UNP
1 UNION PACIFIC<br />
FELLOW SHAREHOLDERS<br />
In <strong>2002</strong>, <strong>Union</strong> <strong>Pacific</strong> raised the bar – celebrating our 140th<br />
anniversary with a record performance. We remained true to<br />
our corporate vision and, as a result, we had a tremendous year.<br />
Our annual report will detail the<br />
accomplishments of <strong>2002</strong>, but let<br />
me share some of the highlights:<br />
Commitments Made and Kept<br />
Our targets for <strong>2002</strong> were to<br />
achieve 1 to 3 percent revenue<br />
growth, a rail-operating ratio below<br />
80 percent, free cash flow of $350<br />
million to $450 million, and<br />
improved returns. I’m pleased to<br />
report <strong>Union</strong> <strong>Pacific</strong> met every goal.<br />
‚ Revenues grew 4 percent to a<br />
record $12.5 billion, with solid<br />
increases at both the railroad<br />
and Overnite.<br />
‚ Excluding Overnite, the company<br />
lowered its operating ratio to<br />
79.8 percent – the first year<br />
we’ve been below 80 percent<br />
since the SP merger.<br />
‚ Free cash flow after dividends<br />
totaled $528 million.<br />
‚ Return on total capital improved.<br />
These achievements resulted in<br />
record net income of $1.34 billion<br />
or $5.05 diluted earnings per share.<br />
Even excluding land sales to the<br />
Utah Transit Authority and Santa<br />
Clara Valley Transportation<br />
Authority, as well as various tax<br />
adjustments, diluted earnings per<br />
share rose by 14 percent. We are<br />
building value for our shareholders<br />
From left, Leo Suggs, chairman, Overnite <strong>Corporation</strong>, Dick Davidson, chairman<br />
and chief executive officer, <strong>Union</strong> <strong>Pacific</strong> <strong>Corporation</strong>, and Ike Evans, president and<br />
chief operating officer, <strong>Union</strong> <strong>Pacific</strong> Railroad.<br />
by using increased profits to<br />
reduce debt levels and raise our<br />
dividend by 15 percent.<br />
The stock market was turbulent<br />
in <strong>2002</strong>, buffeted by the sluggish<br />
economy and several inexcusable<br />
instances of corporate fraud. Still,<br />
<strong>Union</strong> <strong>Pacific</strong>’s stock price<br />
increased for the third straight year<br />
– rising 5 percent from $57 to nearly<br />
$60 per share, compared to a 23<br />
percent decrease in the S&P 500.<br />
Defining the Yield Strategy<br />
<strong>Union</strong> <strong>Pacific</strong>’s revenue growth<br />
has outpaced the nation’s Gross<br />
Domestic Product (GDP) every<br />
year since 1999. The key has been<br />
the implementation of our Yield<br />
Strategy. The strategy’s major<br />
components are simple:<br />
‚ provide premium service for a<br />
premium price,<br />
‚ achieve a mix of business that<br />
maximizes profitability,<br />
‚ leverage volume across the system,<br />
‚ increase productivity by working<br />
smarter, and<br />
‚ maximize asset utilization.<br />
(continued on page 2)
LETTER TO SHAREHOLDERS<br />
2<br />
<strong>Union</strong> <strong>Pacific</strong>’s stock price increased for the third straight<br />
year – rising 5 percent from $57 to nearly $60 per share,<br />
compared to a 23 percent decrease in the S&P 500.<br />
In all, our yield strategy is leveraging<br />
greater value and improved<br />
returns from our superior rail<br />
franchise.<br />
Service Reliability and Efficiency<br />
Service reliability and efficiency<br />
are the linchpins of the yield<br />
strategy. Through a combination<br />
of new product development,<br />
corridor initiatives and alliances,<br />
we’re building service reliability<br />
in an effort to capture market<br />
share from trucks. The economies<br />
of rail beat truck almost every<br />
time. Our challenge is to provide<br />
“truck-like” service and reliability.<br />
We continually work to improve<br />
reliability. We’re narrowing the<br />
service gap and customers are<br />
rewarding us with their business.<br />
Some of the statistics we use to<br />
evaluate our service reached<br />
record levels for the “new” <strong>Union</strong><br />
<strong>Pacific</strong> in <strong>2002</strong>: Service Delivery<br />
Employee Productivity<br />
GTM (MIL) PER EMPLOYEE<br />
17.3<br />
18.7<br />
99 00<br />
<strong>Union</strong> <strong>Pacific</strong> Railroad<br />
20.0<br />
01<br />
21.4<br />
02<br />
UP’s Energy business generated 22 percent of all revenue. In <strong>2002</strong>, UP hauled 241<br />
million tons of coal, an all-time best.<br />
Index, Train Plan Compliance,<br />
Customer Satisfaction Index and<br />
To/From Industry Compliance.<br />
Our record service performance<br />
was coupled with record business<br />
volumes – transporting 6.1 million<br />
vehicles, 1.5 billion board feet of<br />
lumber, 241 million tons of coal,<br />
32.3 million tons of rock, and nearly<br />
1.6 million international steamship<br />
containers. And, in keeping with<br />
our great history of productivity<br />
improvements, these volumes<br />
were moved with fewer resources.<br />
During a time of increased carloadings,<br />
cycle-time improvements<br />
actually enabled a 7,000-car<br />
reduction in freight cars on line.<br />
Quality Focus<br />
We’re building our reputation<br />
as a quality service provider.<br />
During <strong>2002</strong>, we became a threetime<br />
winner of Toyota’s<br />
President’s Logistics Award and<br />
DaimlerChrysler’s Gold Award.<br />
UPS Autogistics named us<br />
“Carrier of the Year” for our service<br />
to Ford, and we won GM’s Mark<br />
of Excellence Award and Supplier<br />
of the Year Award. In early 2003,<br />
GM recognized <strong>Union</strong> <strong>Pacific</strong> as<br />
one of only eight suppliers, worldwide,<br />
for outstanding service.<br />
Through our Cost of Quality<br />
program, we proactively monitor<br />
the cost of not doing things right<br />
the first time (failure costs). We<br />
work daily to eliminate these<br />
unnecessary expenses. Using<br />
quality and process improvements,<br />
we identified failure cost<br />
savings of $133 million in <strong>2002</strong> –<br />
furthering our belief that it costs<br />
less to run a quality company. And,<br />
our quality efforts were recognized<br />
by our selection as a finalist for<br />
the Malcolm Baldrige National<br />
Quality Award for the second<br />
straight year.<br />
Corporate Responsibility<br />
Not only are we raising the bar<br />
operationally, <strong>Union</strong> <strong>Pacific</strong> is<br />
also setting itself apart in the corporate<br />
governance arena. Over<br />
the past several years, we’ve<br />
adopted corporate governance<br />
“best practices” and we will continue<br />
to examine our policies to<br />
promote effective governance.<br />
(continued on page 4)
PREMIER RAIL FRANCHISE LEVERAGES GROWTH<br />
<strong>Union</strong> <strong>Pacific</strong> is North America’s largest railroad, covering the western two-thirds of the<br />
United States. This premier rail franchise serves large Gulf Coast chemical-producing and western<br />
coal-producing areas, all major West Coast ports and gateways to Mexico and Canada.
LETTER TO SHAREHOLDERS<br />
4<br />
Revenues grew 4 percent to a record $12.5 billion,<br />
free cash flow after dividends totaled $528 million<br />
and return on total capital improved.<br />
We are setting ourselves apart<br />
as a corporate leader – building<br />
communities in a small way<br />
through our Principals’<br />
Partnership program. This new<br />
program, focused on secondary<br />
education leaders working in our<br />
service territory, has already<br />
received an overwhelming<br />
response. As we continue to roll<br />
out the program across our system,<br />
we’re reinforcing a vital link to our<br />
communities and to our future.<br />
World-Class Employees<br />
I’ve been privileged to work for<br />
<strong>Union</strong> <strong>Pacific</strong> for 43 years. I enjoy<br />
meeting with employees and discussing<br />
our company’s future. This<br />
year, members of our senior team<br />
visited every service unit, talking to<br />
employees about their jobs and<br />
their ideas. We saw firsthand the<br />
building pride within the UP<br />
family. As a company, our bench<br />
strength has never been greater.<br />
We’ve promoted talented individuals<br />
from within and recruited<br />
great folks from other industries to<br />
provide fresh perspectives.<br />
Overnite <strong>Corporation</strong><br />
Overnite also had a tremendous<br />
<strong>2002</strong> despite tough market conditions.<br />
Leveraging its expanded<br />
service area, Overnite is building<br />
networks.It’s accessing new markets<br />
with great success – attaining<br />
revenue and net income levels<br />
that haven’t been seen since 1994.<br />
The year also marked the end of<br />
the Teamsters’ three-year strike<br />
against Overnite and a competitor’s<br />
forced closure provided new<br />
business opportunities.<br />
Looking Ahead<br />
<strong>Union</strong> <strong>Pacific</strong>’s future has never<br />
been brighter. Our unparalleled<br />
franchise cannot be replicated,<br />
and our yield strategy will help us<br />
achieve continued success.<br />
Undoubtedly, 2003 will have<br />
challenges. The economic picture<br />
remains cloudy, threats of war<br />
continue to loom and investor<br />
confidence remains shaken. We<br />
cannot control these factors, but<br />
we can control our focus – margin<br />
improvement, increased returns<br />
and strong free cash flow.<br />
Free Cash Flow (After Dividends)<br />
$ MILLIONS<br />
$57<br />
$217<br />
$250<br />
$528<br />
99 00 01 02<br />
<strong>Union</strong> <strong>Pacific</strong> <strong>Corporation</strong><br />
We will build on our strong<br />
tradition of total quality<br />
management, recognizing that<br />
quality processes are vital to the<br />
cycles of improvement making<br />
<strong>Union</strong> <strong>Pacific</strong> a better company,<br />
one where:<br />
Customers want to do business,<br />
Employees are proud to work, and<br />
Shareholder value is created. n<br />
Dick Davidson, Chairman and Chief Executive Officer
PERFORMANCE ENHANCES SHAREHOLDER VALUE<br />
By raising its dividend 15 percent, <strong>Union</strong> <strong>Pacific</strong> has signaled its confidence in the future.<br />
<strong>Union</strong> <strong>Pacific</strong> employees, such as Welder John Pribyl, left, Chairman Dick Davidson and Welder<br />
George Lawton, are proud of their role in keeping the nation’s economy on track.
UNION PACIFIC<br />
6<br />
building value<br />
<strong>Union</strong> <strong>Pacific</strong>’s Yield Strategy is Building Value for shareholders.<br />
The strategy focuses on growing revenue faster than GDP,<br />
controlling costs and improving asset turns. Expanding markets,<br />
increased market share and higher<br />
prices are driving revenue growth.<br />
For customers, UP is building<br />
value with breakthrough service<br />
levels, allowing the railroad to<br />
compete with trucks in more<br />
service-sensitive and profitable<br />
markets. By creating new products<br />
and using quality processes<br />
to improve service reliability, UP<br />
is delivering value.<br />
Outdated<br />
locomotives have<br />
been replaced<br />
by new, more<br />
reliable models<br />
that reduce<br />
maintenance<br />
costs.<br />
The company is promoting<br />
industry alliances that give customers<br />
seamless service to all<br />
parts of North America.<br />
For example, in <strong>2002</strong> <strong>Union</strong><br />
<strong>Pacific</strong> introduced new intermodal<br />
train service to Mexico for shippers<br />
in the eastern United States.<br />
Partnering with Norfolk Southern<br />
(NS) and Canadian National<br />
(CN), the new expedited service<br />
trims up to three days from previous<br />
rail transit times. NS and CN<br />
hand off eastern shipments to UP<br />
at Memphis for delivery to Laredo,<br />
Texas, Mexico City and other<br />
major Mexican markets.<br />
To improve efficiency, UP is<br />
working with U.S. Customs and<br />
the Mexican railroads –<br />
Ferrocarril Mexicano (FXE) and<br />
Transportacion Ferroviaria<br />
Mexicana (TFM) – to streamline<br />
border crossings. For their part,<br />
FXE and TFM continue modernizing<br />
their systems.<br />
With the Automated Manifest<br />
System now in place at the six<br />
UP/Mexico gateways, U.S.<br />
Customs can electronically review<br />
documentation from carriers and<br />
brokers before rail cars reach the<br />
Brakeman Mike Gonzalez operates a<br />
remote-control switch to realign track<br />
and permit smooth train operations in<br />
the rail yard.<br />
border. This replaces a slower,<br />
labor-intensive paper process that<br />
did not allow for pre-clearance.<br />
Service breakthroughs depend<br />
on productivity and technology<br />
improvements. For example, a key<br />
(continued on page 8)
BUSINESS MIX PROVIDES STRENGTH<br />
<strong>Union</strong> <strong>Pacific</strong>’s balanced and diverse traffic mix is a real strength that helps<br />
the railroad weather tough times. By creating new products and using quality processes<br />
to improve service reliability, UP is delivering value to its customers.<br />
<strong>2002</strong> REVENUE<br />
A GRICULTURAL<br />
14 %<br />
AUTOMOTIVE<br />
11 % ENERGY<br />
22 %<br />
CHEMICAL<br />
15 % INDUSTRIAL<br />
19 %<br />
INTERMODAL<br />
19 %
BUILDING VALUE<br />
8<br />
Working with alliance partners, <strong>Union</strong> <strong>Pacific</strong> introduced<br />
new intermodal train service to Mexico for shippers in the eastern<br />
United States that trims up to three days from previous<br />
rail transit times.<br />
part of the yield strategy is<br />
improving locomotive and car<br />
utilization.<br />
Outdated, inefficient locomotives<br />
have been retired and replaced by<br />
new, more reliable models, helping<br />
to reduce maintenance costs.<br />
UP has reduced<br />
installation<br />
costs for rail<br />
and ties by using<br />
quality processes<br />
and technology<br />
for planning,<br />
scheduling and<br />
installation.<br />
UP is developing a long-range<br />
“Freight Car of the Future” strategy<br />
that would standardize freight car<br />
types and increase carrying<br />
capacity, resulting in more reload<br />
opportunities, lower inventory<br />
requirements and reduced costs.<br />
In addition, UP has reduced<br />
installation costs for rail and ties<br />
by using quality processes and<br />
technology for planning, scheduling<br />
and installation. More than<br />
offsetting inflationary increases,<br />
unit costs for rail have declined 6<br />
percent since 1999, with concrete<br />
and wood tie costs down 12 percent<br />
and 13 percent, respectively.<br />
Efficiency is another yield strategy<br />
driver, made possible through<br />
evolving technology.<br />
Intermodal’s container business is a growth opportunity, aimed at tapping into the truck<br />
transportation market.<br />
In <strong>2002</strong>, <strong>Union</strong> <strong>Pacific</strong> began<br />
using remote-control locomotive<br />
technology in rail yard switching<br />
operations. Employees on the<br />
ground use radio signals to direct<br />
onboard computers that control<br />
locomotive movements. This<br />
proven technology increases safety<br />
and productivity.<br />
Web-based technology is<br />
enabling UP customers to perform<br />
Secured Web Transactions<br />
1,626,911<br />
3,178,748<br />
00 01<br />
<strong>Union</strong> <strong>Pacific</strong> Railroad<br />
5,756,572<br />
02<br />
all business transactions and shipment<br />
inquiries in a secure, online<br />
environment.<br />
UP Customer Service<br />
Representatives remain available<br />
to assist with routine transactions,<br />
but Web-site applications offer<br />
customers more flexibility.<br />
Customers performed nearly 6<br />
million secured Web transactions<br />
in <strong>2002</strong>, more than doubling year<br />
2000 levels. Customer phone calls<br />
to the National Customer Service<br />
Center have declined by 40 percent<br />
during the same time frame, giving<br />
its representatives more time<br />
to personalize customer service<br />
for those who need it.<br />
Improvements made in <strong>2002</strong> to<br />
“MyUPRR.com,” a customized<br />
business applications portal,<br />
include: expanded price inquiries,<br />
bill of lading correction capabilities,<br />
rail car switching schedules,<br />
and voice recognition for ordering<br />
or releasing rail cars. n
TECHNOLOGY STREAMLINES LOCOMOTIVE OPERATIONS<br />
Switchman Scott Thomason uses radio signals to direct onboard computers<br />
controlling locomotive movements in rail yard switching operations. This remote-control<br />
locomotive technology is proven to increase safety and productivity.
UNION PACIFIC<br />
10<br />
BUILDING SERVICE<br />
Using its premier rail franchise efficiently and effectively,<br />
<strong>Union</strong> <strong>Pacific</strong> is Building Service for customers. By retooling<br />
transportation plans and improving asset utilization in critical<br />
rail corridors, <strong>Union</strong> <strong>Pacific</strong> is<br />
strengthening performance across<br />
the entire rail network.<br />
For example, the I-5 Corridor<br />
linking Seattle to Los Angeles was<br />
<strong>Union</strong> <strong>Pacific</strong>’s “proof of concept”<br />
for improving service performance<br />
corridor by corridor. By focusing<br />
I-5 Corridor<br />
Mid-America and Gulf Coast Corridor<br />
Overland Corridor<br />
on pick-up and delivery service at<br />
customers’ facilities, over-the-road<br />
performance and critical car connections<br />
in terminals, transit times<br />
have been reduced by days. As a<br />
result, customer satisfaction<br />
reached a seven-year high and customers<br />
continue to reward UP with<br />
more of their business.<br />
<strong>Union</strong> <strong>Pacific</strong> has rail alliances<br />
with CSX, Norfolk Southern,<br />
Canadian <strong>Pacific</strong> and Canadian<br />
National, plus Mexican railroads<br />
FXE and TFM. These alliances are<br />
improving overall transit times<br />
while expanding market reach and<br />
creating new business opportunities.<br />
Each of <strong>Union</strong> <strong>Pacific</strong>’s six businesses<br />
– Agricultural Products,<br />
Automotive,Chemicals,<br />
Energy, Industrial Products<br />
and Intermodal – benefits<br />
from these alliances and key<br />
corridor initiatives.<br />
Agricultural Products, for example,<br />
achieved 14 percent revenue<br />
growth in <strong>2002</strong> on “Express Lane,”<br />
its food and perishables service.<br />
Operated jointly with CSX, Express<br />
Lane uses the Overland Corridor<br />
from Roseville, California, to<br />
Chicago and St. Louis and then to<br />
points east.<br />
UP is working closely with auto<br />
manufacturers on their “fast to<br />
(continued on page 12)
SERVICE FORGES CUSTOMER PARTNERSHIPS<br />
Responding to <strong>Union</strong> <strong>Pacific</strong>’s local customer satisfaction survey, Ag Processing’s<br />
Jack Hochard, right, recognized UP’s Gary Nowlin and other railroad managers and switch<br />
crews for providing excellent service at AGP’s St. Joseph, Missouri, plant.
BUILDING SERVICE<br />
12<br />
By focusing on service performance corridor by corridor,<br />
<strong>Union</strong> <strong>Pacific</strong> has reduced transit times by days. As satisfaction<br />
levels improved in <strong>2002</strong>, customers continued to<br />
reward <strong>Union</strong> <strong>Pacific</strong> with more of their business.<br />
market” strategies. Using integrated<br />
technology, UP provides realtime<br />
data on the status of new<br />
vehicles from the time they leave<br />
the plant until they arrive on the<br />
showroom floor.<br />
UP’s Mid-America and Gulf<br />
Coast corridors realigned operations<br />
to maximize service performance<br />
and asset productivity, particularly<br />
for Chemical traffic in the<br />
southern and central regions.<br />
The result is a better service<br />
product provided at lower cost<br />
using fewer assets.<br />
Transporting<br />
80 percent of<br />
all new vehicles<br />
in the western<br />
United States,<br />
<strong>Union</strong> <strong>Pacific</strong><br />
is offering<br />
customers reduced<br />
cycle times.<br />
For the Energy group, the<br />
Overland Corridor track capacity<br />
expansion has increased daily reliability<br />
for coal trains departing<br />
Wyoming’s southern Powder<br />
River Basin. The railroad and its<br />
Energy customers are using a new<br />
Web-based, UP-designed “Bulk<br />
Train Planner” computer application<br />
to better manage daily unit<br />
train operations. Use of this same<br />
technology also has expanded to<br />
The International Rail Bridge at Laredo, Texas, is one of four rail bridges UP uses to<br />
cross the Rio Grande River to and from Mexico. In <strong>2002</strong>, revenues from UP’s Mexico<br />
business totaled $873 million.<br />
manage Agricultural customers’<br />
grain shuttle trains.<br />
The combination of service and<br />
technology has improved the<br />
Service Delivery Index (performance<br />
against commitment) for<br />
coal cycles from 87 in 1999 to 99<br />
in <strong>2002</strong>.<br />
Service enhancements in the<br />
West and South boosted Industrial<br />
Products’ lumber and aggregates<br />
revenues. A faster I-5 Corridor<br />
contributed to lumber revenue<br />
growth of 9 percent in <strong>2002</strong> vs.<br />
2001. Local rail car switching<br />
improvements in the South<br />
helped rock revenues grow by 7<br />
percent for the year. Since railroads<br />
move less than 10 percent<br />
of the aggregates transportation<br />
market, the economies and efficiencies<br />
of unit rock trains –<br />
competing directly against trucks<br />
on quick-turn, short-haul business<br />
– have great potential.<br />
The Intermodal group contributed<br />
top-line growth of nearly<br />
5 percent year over year. Intermodal<br />
is one of UP’s top growth opportunities,<br />
aimed at tapping into the<br />
long-haul truck transportation<br />
market. <strong>Union</strong> <strong>Pacific</strong> rebounded<br />
quickly from October’s West Coast<br />
ports lock-out, processing and<br />
loading containers as quickly as<br />
steamship customers could clear<br />
the backlog. n
REAL-TIME DATA IMPROVES TRAIN MANAGEMENT<br />
<strong>Union</strong> <strong>Pacific</strong> managers Katy Henrichsen and Tyler Adamson access Web-focused, decision-support<br />
tools to better use assets and improve cycle times for 2,500 daily trains.
UNION PACIFIC<br />
14<br />
BUILDING REPUTATION<br />
<strong>Union</strong> <strong>Pacific</strong> is Building Reputation for reliable transportation and<br />
attention to quality, winning numerous customer service awards for<br />
its efforts. <strong>Union</strong> <strong>Pacific</strong> follows rigorous quality standards to eliminate<br />
rework and failure costs and<br />
improve customer service.<br />
The company’s Total Quality<br />
Management System provides an<br />
unrelenting focus on customers.<br />
The 15-year relationship between<br />
managing quality and improving<br />
customer service is proven – as<br />
costs linked to failures and rework<br />
go down, customer satisfaction<br />
goes up.<br />
Total Quality Management<br />
incorporates Six Sigma tools to<br />
reduce failures. A recent Six<br />
Sigma project resolved a rail car<br />
<strong>Union</strong> <strong>Pacific</strong>’s excellent service earned<br />
top awards from automakers<br />
DaimlerChrysler, General Motors,<br />
Toyota and UPS Autogistics, network<br />
manager for Ford.<br />
ride problem affecting auto parts.<br />
Working through the customer<br />
satisfaction issue won <strong>Union</strong> <strong>Pacific</strong><br />
additional business.<br />
<strong>Union</strong> <strong>Pacific</strong> continues to<br />
maintain its full certification to<br />
the ISO (International<br />
Organization for Standardization)<br />
9001:2000 standard. First certified<br />
in 1998, ISO examiners regularly<br />
check UP’s processes to ensure<br />
accreditation.<br />
The railroad has qualified as a<br />
finalist for the Malcolm Baldrige<br />
National Quality Award, the<br />
country’s premier honor for<br />
organizations demonstrating<br />
excellence in quality and results.<br />
Customers have taken notice.<br />
In <strong>2002</strong>, the top automotive<br />
companies in North America<br />
honored <strong>Union</strong> <strong>Pacific</strong> for its<br />
performance.<br />
DaimlerChrysler, General<br />
Motors, Toyota and UPS<br />
Autogistics (network manager for<br />
Ford) all named UP as their top<br />
Failure Costs<br />
% OF REVENUE<br />
15.3%<br />
13.9%<br />
99 00<br />
<strong>Union</strong> <strong>Pacific</strong> Railroad<br />
12.5%<br />
01<br />
11.3%<br />
02<br />
carrier. It was the third year in a<br />
row <strong>Union</strong> <strong>Pacific</strong> earned both the<br />
DaimlerChrysler and the Toyota<br />
honors.<br />
Other customers, including<br />
Frito Lay, ExxonMobil and<br />
General Electric, all recognized<br />
UP’s superior service in <strong>2002</strong>. n
INGENUITY UNDERSCORES QUALITY AND EFFICIENCY<br />
Chicago Machinist George Ahlert’s idea, which saved <strong>Union</strong> <strong>Pacific</strong> $275,000<br />
annually, replaced a labor-intensive, customized welding process with an easy-to-install,<br />
green plastic wear pad that protects locomotive couplers.
UNION PACIFIC<br />
16<br />
BUILDING COMMUNITIES<br />
When ground was broken December 2, 1863, to begin construction<br />
of <strong>Union</strong> <strong>Pacific</strong> Railroad, the historic event marked the company’s<br />
involvement in Building Communities throughout the West.<br />
Transporting the settlers who<br />
built towns and cities along its<br />
tracks, <strong>Union</strong> <strong>Pacific</strong> was one of<br />
the nation’s earliest corporate citizens.<br />
Today, <strong>Union</strong> <strong>Pacific</strong>’s evolving<br />
philanthropic role includes<br />
financial support for civic organizations,<br />
a new program for high<br />
school principals, public/private<br />
partnerships to improve city<br />
transportation and facilities, and<br />
safety initiatives that prevent<br />
highway-rail crossing accidents.<br />
The <strong>Union</strong> <strong>Pacific</strong> Foundation<br />
administers traditional grantgiving<br />
to local groups supporting<br />
UP Foundation grants support many local<br />
organizations such as Harvesters, Kansas<br />
City’s only food bank. From left are<br />
Harvesters employees Nathan Walden,<br />
Executive Director Karen Haren and<br />
Jim Funderburke.<br />
Chairman Dick Davidson attends a<br />
ceremony marking completion of a $185<br />
million sale of <strong>Union</strong> <strong>Pacific</strong> track and<br />
land to the Utah Transit Authority for<br />
a project that will increase passenger<br />
rail service.<br />
educational and cultural development,<br />
plus human services, in<br />
areas where UP employees live and<br />
work.In 2001, the Foundation<br />
began sponsoring “The Principals’<br />
Partnership,” a personalized, threeyear<br />
leadership program that supports<br />
public high school principals<br />
as they seek to educate America’s<br />
future work force.<br />
In yet another facet of community<br />
service, <strong>Union</strong> <strong>Pacific</strong> often<br />
works with federal, state and local<br />
entities to help cities grow, reduce<br />
traffic congestion, and improve<br />
commuter rail service and freight<br />
operations.<br />
<strong>Union</strong> <strong>Pacific</strong> is a rail industry<br />
leader in public safety. The company<br />
has trained nearly 150,000<br />
emergency response personnel<br />
since 1979 on handling hazardous<br />
materials accidents and other<br />
emergencies. UP supports many<br />
highway-rail crossing safety and<br />
awareness programs, such as<br />
Operation Lifesaver. In <strong>2002</strong>, UP<br />
volunteers gave 7,000 Operation<br />
Lifesaver safety presentations<br />
reaching nearly 450,000 people. n<br />
Opposite Page: Principals’ Partnership<br />
Chicago Design Team members include:<br />
Dr. Ingrid Carney, senior executive<br />
director, Chicago Leadership Academies<br />
for Supporting Success (CLASS); Phylis<br />
Hammond, principal, Tilden Career<br />
Community Academy; Dr. Lona Bibbs,<br />
principal, Westinghouse Career Academy;<br />
Janice Ollarvia, principal, Fenger High<br />
School; Katherine Smith, principal, Gage<br />
Park High School; Patricia Anderson,<br />
director, CLASS; Melver Scott, principal,<br />
Crane Tech Prep Common School; Edward<br />
Klunk, deputy officer, Office of High<br />
School Development; and John Butterfield,<br />
principal, Mather High School.
PHILANTHROPY FOCUSES ON EDUCATION<br />
Supporting high school principals as they educate America’s future work force,<br />
<strong>Union</strong> <strong>Pacific</strong> Foundation is sponsoring “The Principals’ Partnership,” a personalized leadership<br />
program, in addition to its traditional grant-giving to local charitable organizations.
UNION PACIFIC<br />
18<br />
BUILDING PRIDE<br />
With generations of employees Building Pride into every aspect of the<br />
business, <strong>Union</strong> <strong>Pacific</strong> is reinventing success, decade after decade.<br />
Productivity has increased at a compound annual rate of 7 percent since<br />
1984, with no sign of slowing.<br />
Technology and quality processes<br />
enable employees to best use these<br />
critical resources – locomotives,<br />
freight cars, and track and terminal<br />
capacity.<br />
Productivity is equally important<br />
in maintenance activities. For<br />
example, in <strong>2002</strong> UP’s concrete tie<br />
gang set a record for the number<br />
of ties installed – 22,131 in a fourday<br />
period – using technologically<br />
advanced machines and teamwork.<br />
Safety and productivity<br />
improvements are at the heart of<br />
UP’s voluntary employee involvement<br />
process. In <strong>2002</strong>, employees’<br />
ideas saved nearly $5 million and<br />
generated an additional $2 million<br />
in revenue. Chicago’s locomotive<br />
shop employees used<br />
quality processes to identify a<br />
new, less expensive replacement<br />
part that saved $600,000 in one<br />
year. In <strong>2002</strong>, the employee<br />
involvement process migrated to<br />
the Web, providing greater access<br />
for employees and additional cost<br />
savings.<br />
Safety is a top priority for all<br />
47,000 employees, who reduced<br />
year-over-year reportable injuries<br />
by 17 percent in <strong>2002</strong>, continuing<br />
a three-year trend. Leading the<br />
way is Beverly Washington, who<br />
received the company’s highest<br />
honor, the Kenefick Safety Award.<br />
A fireman/oiler at the Los Angeles<br />
Locomotive Shop, Washington<br />
represented <strong>Union</strong> <strong>Pacific</strong> in May<br />
Executives meet with employees to<br />
discuss company goals. Barb Schaefer,<br />
senior vice president-Human Resources,<br />
joins Laredo, Texas, employees, from<br />
left, Daniel Sosa, Sr., Joe Ortiz and<br />
Ramiro Sandoval, Jr.<br />
Beverly Washington received the company’s<br />
highest honor, the Kenefick Safety Award,<br />
for her exemplary efforts to maintain a<br />
safe workplace at the Los Angeles<br />
Locomotive Shop.<br />
<strong>2002</strong> at the E.H. Harriman Award<br />
Institute in Washington, D.C.<br />
Safety’s importance is underscored<br />
in overall business<br />
discussions led by executive<br />
team members, who review<br />
company goals with employees<br />
in large conferences, in smaller<br />
personal field visits, and in<br />
monthly e-mails. The dialogue<br />
helps employees understand<br />
how their work contributes to<br />
<strong>Union</strong> <strong>Pacific</strong>’s success. n
TEAMWORK BRINGS RECORD RESULTS<br />
Trackmen Zane Morris, left, and Eugene Stevens are members of <strong>Union</strong> <strong>Pacific</strong>’s concrete<br />
tie gang, which uses teamwork and high-tech machines to enhance safety and improve productivity.<br />
Employees have reduced injury rates for the past three years.
UNION PACIFIC<br />
20<br />
BUILDING NETWORKS<br />
Building Networks in <strong>2002</strong>, Overnite <strong>Corporation</strong> set eight-year<br />
highs in both revenue and income, writing another chapter in what<br />
already has been called one of the greatest financial turnarounds<br />
in trucking industry history.<br />
In addition, a series of events<br />
helped secure Overnite’s future<br />
for years to come. A three-year<br />
strike by the International<br />
Brotherhood of Teamsters<br />
abruptly ended October 24, <strong>2002</strong>,<br />
with the union’s leadership urging<br />
its members to return to work.<br />
Employees in several service<br />
centers once represented by the<br />
Teamsters voted to end their affiliation<br />
with the union by year’s<br />
end, with further decertification<br />
votes coming in 2003.<br />
Overnite increased its revenue<br />
over the previous 12 months and<br />
finished the year as the nation’s<br />
fifth largest less-than-truckload<br />
carrier, despite an uncertain economy<br />
that forced closure of the<br />
nation’s third largest less-thantruckload<br />
carrier.<br />
The year’s highlights included<br />
an industry-leading, on-time<br />
service standard exceeding 97<br />
percent for combined regional,<br />
inter-regional and long-haul<br />
freight. And, a major initiative to<br />
speed billing and collections culminated<br />
in an efficient, electronic,<br />
customer-friendly cash application<br />
system. It bills 98 percent of<br />
customers for transportation<br />
services within 72 hours of<br />
freight movement.<br />
Improved transit times on more<br />
than 4,000 lanes, coupled with the<br />
unveiling of a new division –<br />
OMC Logistics – opened the door<br />
to a new generation of regional<br />
and truckload customers.<br />
Finally, the company’s expansion<br />
into all Canadian provinces and<br />
the integration between Overnite<br />
Transportation Company and<br />
western regional partner Motor<br />
Cargo allowed for seamless traffic<br />
between the two subsidiaries and<br />
significantly improved Overnite’s<br />
geographic coverage. Combined,<br />
the companies bring more than<br />
150 years of over-the-road<br />
experience to customers. n<br />
Service Performance<br />
% ON-TIME SERVICE PERFORMANCE<br />
NUMBER OF TRANSIT-TIME LANE IMPROVEMENTS<br />
4,841<br />
4,841<br />
Operating Ratios<br />
98.1%<br />
Operating Revenue<br />
$ MILLIONS<br />
$1,332<br />
96%<br />
97% 97%<br />
3,602<br />
3,113<br />
97%<br />
95.2% 95.3%<br />
94.7%<br />
$1,062<br />
$1,113<br />
$1,143<br />
99 00 01 02<br />
Overnite <strong>Corporation</strong>*<br />
*data reflects acquisition of Motor Cargo as of Nov. 30, 2001<br />
99 00 01 02<br />
Overnite <strong>Corporation</strong>*<br />
99 00<br />
Overnite <strong>Corporation</strong>*<br />
01<br />
02
O VERNITE SETS SERVICE STANDARD<br />
Overnite set an industry-leading, on-time service standard exceeding 97 percent for<br />
combined regional, inter-regional and long-haul freight, improving transit times on more than<br />
4,000 lanes. Overnite increased its revenue over the previous 12 months,<br />
despite an uncertain economy.
UNION PACIFIC<br />
22<br />
U N I O N P A C I F I C
F R A N C H I S E<br />
23 UNION PACIFIC
UNION PACIFIC<br />
24<br />
DIRECTORS AND OFFICERS<br />
Board of Directors<br />
Philip F. Anschutz 1 Chair,4,5<br />
Chairman<br />
Anschutz Company<br />
Richard K. Davidson 1<br />
Chairman, President and<br />
Chief Executive Officer<br />
<strong>Union</strong> <strong>Pacific</strong> <strong>Corporation</strong><br />
Chairman and<br />
Chief Executive Officer<br />
<strong>Union</strong> <strong>Pacific</strong> Railroad Company<br />
Thomas J. Donohue 1, 2 Chair, 3<br />
President and<br />
Chief Executive Officer<br />
U.S. Chamber of Commerce<br />
Archie W. Dunham 2, 5<br />
Chairman<br />
ConocoPhillips<br />
Spencer F. Eccles 2, 3<br />
Chairman<br />
Wells Fargo Intermountain<br />
Banking Region<br />
Ivor J. Evans<br />
President and<br />
Chief Operating Officer<br />
<strong>Union</strong> <strong>Pacific</strong> Railroad Company<br />
Elbridge T. Gerry, Jr. 1, 4 Chair, 5<br />
Partner<br />
Brown Brothers Harriman & Co.<br />
Judith Richards Hope 1, 3 Chair, 4<br />
Partner<br />
Paul, Hastings, Janofsky & Walker<br />
Richard J. Mahoney 1, 4, 5 Chair<br />
Retired Chairman and<br />
Chief Executive Officer<br />
Monsanto Company<br />
Steven R. Rogel 2, 3<br />
Chairman, President and<br />
Chief Executive Officer<br />
Weyerhaeuser Company<br />
Ernesto Zedillo Ponce de Leon 4<br />
Director<br />
Yale Center for the Study of<br />
Globalization<br />
Board Committees<br />
1. Executive 2. Compensation and Benefits 3. Audit 4. Finance 5. Corporate Governance and Nominating<br />
Officers<br />
Richard K. Davidson<br />
Chairman, President and<br />
Chief Executive Officer<br />
<strong>Union</strong> <strong>Pacific</strong> <strong>Corporation</strong><br />
Chairman and Chief Executive Officer<br />
<strong>Union</strong> <strong>Pacific</strong> Railroad Company<br />
Ivor J. Evans<br />
President and Chief Operating Officer<br />
<strong>Union</strong> <strong>Pacific</strong> Railroad Company<br />
Leo H. Suggs<br />
Chairman<br />
Overnite <strong>Corporation</strong><br />
James V. Dolan<br />
Vice Chairman<br />
<strong>Union</strong> <strong>Pacific</strong> Railroad Company<br />
L. Merill Bryan, Jr.<br />
Senior Vice President and<br />
Chief Information Officer<br />
<strong>Union</strong> <strong>Pacific</strong> <strong>Corporation</strong><br />
Dennis J. Duffy<br />
Executive Vice President - Operations<br />
<strong>Union</strong> <strong>Pacific</strong> Railroad Company<br />
Charles R. Eisele<br />
Senior Vice President -<br />
Strategic Planning<br />
<strong>Union</strong> <strong>Pacific</strong> <strong>Corporation</strong><br />
Bernard R. Gutschewski<br />
Vice President - Taxes<br />
<strong>Union</strong> <strong>Pacific</strong> <strong>Corporation</strong><br />
Mary Sanders Jones<br />
Vice President and Treasurer<br />
<strong>Union</strong> <strong>Pacific</strong> <strong>Corporation</strong><br />
R. Bradley King<br />
Executive Vice President -<br />
Network Design and Integration<br />
<strong>Union</strong> <strong>Pacific</strong> Railroad Company<br />
Robert M. Knight, Jr.<br />
Senior Vice President - Finance<br />
<strong>Union</strong> <strong>Pacific</strong> <strong>Corporation</strong><br />
John J. Koraleski<br />
Executive Vice President -<br />
Marketing and Sales<br />
<strong>Union</strong> <strong>Pacific</strong> Railroad Company<br />
Mary E. McAuliffe<br />
Vice President - External Relations<br />
<strong>Union</strong> <strong>Pacific</strong> <strong>Corporation</strong><br />
Richard J. Putz<br />
Vice President and Controller<br />
<strong>Union</strong> <strong>Pacific</strong> <strong>Corporation</strong><br />
Barbara W. Schaefer<br />
Senior Vice President -<br />
Human Resources<br />
<strong>Union</strong> <strong>Pacific</strong> <strong>Corporation</strong><br />
Robert W. Turner<br />
Senior Vice President -<br />
Corporate Relations<br />
<strong>Union</strong> <strong>Pacific</strong> <strong>Corporation</strong><br />
Carl W. von Bernuth<br />
Senior Vice President,<br />
General Counsel and Secretary<br />
<strong>Union</strong> <strong>Pacific</strong> <strong>Corporation</strong><br />
James R. Young<br />
Executive Vice President - Finance<br />
Chief Financial Officer<br />
<strong>Union</strong> <strong>Pacific</strong> <strong>Corporation</strong>
(Mark One)<br />
[X]<br />
UNITED STATES<br />
SECURITIES AND EXCHANGE COMMISSION<br />
WASHINGTON, D.C. 20549<br />
FORM 10-K<br />
ANNUAL REPORT PURSUANT TO SECTION 13 OR 15(d) OF THE<br />
SECURITIES EXCHANGE ACT OF 1934<br />
For the fiscal year ended December 31, <strong>2002</strong><br />
[ ] TRANSITION REPORT PURSUANT TO SECTION 13 OR 15(d) OF THE<br />
SECURITIES EXCHANGE ACT OF 1934<br />
For the transition period from __________ to ____________<br />
OR<br />
Commission File Number 1-6075<br />
UNION PACIFIC CORPORATION<br />
(Exact name of registrant as specified in its charter)<br />
UTAH 13-2626465<br />
(State or other jurisdiction of<br />
(I.R.S. Employer<br />
incorporation or organization)<br />
Identification No.)<br />
Securities registered pursuant to Section 12(b) of the Act:<br />
1416 DODGE STREET, OMAHA, NEBRASKA<br />
(Address of principal executive offices)<br />
68179<br />
(Zip Code)<br />
(402) 271-5777<br />
(Registrant’s telephone number, including area code)<br />
Title of each Class<br />
Common Stock (Par Value $2.50 per share)<br />
Name of each exchange on which registered<br />
New York Stock Exchange, Inc.<br />
Indicate by check mark whether the registrant (1) has filed all reports required to be filed by Section 13 or 15(d) of the<br />
Securities Exchange Act of 1934 during the preceding 12 months (or for such shorter period that the registrant was required<br />
to file such reports), and (2) has been subject to such filing requirements for the past 90 days.<br />
Yes X No<br />
Indicate by check mark if disclosure of delinquent filers pursuant to Item 405 of Regulation S-K is not contained herein,<br />
and will not be contained, to the best of the registrant’s knowledge, in definitive proxy or information statements<br />
incorporated by reference in Part III of this Form 10-K or any amendment to this Form 10-K. [ ].<br />
Indicate by check mark whether the registrant is an accelerated filer (as defined in Rule 12b-2 of the Act).<br />
Yes X No<br />
As of January 31, 2003, the aggregate market value of the registrant’s Common Stock held by non-affiliates (using the<br />
New York Stock Exchange closing price) was approximately $14,162,321,688.<br />
The number of shares outstanding of the registrant’s Common Stock as of January 31, 2003, was 253,834,768.
Documents Incorporated by Reference – Portions of the registrant’s definitive Proxy Statement for the annual meeting of<br />
shareholders to be held on April 18, 2003, have been incorporated by reference into Part III of this Form 10-K.<br />
TABLE OF CONTENTS<br />
UNION PACIFIC CORPORATION<br />
PART I<br />
Item 1. Business .................................................................................................................................................... 3<br />
Risk Factors .............................................................................................................................................. 6<br />
Item 2. Properties.................................................................................................................................................. 7<br />
Item 3. Legal Proceedings..................................................................................................................................... 9<br />
Item 4. Submission of Matters to a Vote of Security Holders............................................................................ 12<br />
Executive Officers of the Registrant and Principal Executive Officers of Subsidiaries........................ 12<br />
PART II<br />
Item 5. Market for the Registrant’s Common Stock and Related Shareholder Matters................................... 14<br />
Item 6. Selected Financial Data............................................................................................................................ 14<br />
Item 7. Management’s Discussion and Analysis of Financial Condition and Results of Operations.............. 15<br />
Cautionary Information .......................................................................................................................... 33<br />
Item 7A. Quantitative and Qualitative Disclosures about Market Risk............................................................... 34<br />
Item 8. Financial Statements and Supplementary Data ..................................................................................... 35<br />
Item 9. Changes in and Disagreements with Accountants on Accounting and Financial Disclosure............ 60<br />
PART III<br />
Item 10. Directors and Executive Officers of the Registrant................................................................................ 61<br />
Item 11. Executive Compensation ......................................................................................................................... 61<br />
Item 12. Security Ownership of Certain Beneficial Owners and Management.................................................. 61<br />
Item 13. Certain Relationships and Related Transactions.................................................................................... 62<br />
Item 14. Controls and Procedures ......................................................................................................................... 62<br />
PART IV<br />
Item 15. Exhibits, Financial Statement Schedules and <strong>Report</strong>s on Form 8-K .................................................... 63<br />
Signatures ................................................................................................................................................. 64<br />
Certifications ............................................................................................................................................ 65
PART I<br />
Item 1. Business<br />
CORPORATE STRUCTURE<br />
<strong>Union</strong> <strong>Pacific</strong> <strong>Corporation</strong> (UPC or the <strong>Corporation</strong>) was incorporated in Utah in 1969. The <strong>Corporation</strong>’s principal<br />
executive offices are located at 1416 Dodge Street, Room 1230, Omaha, NE 68179. The telephone number at that address<br />
is (402) 271-5777. The <strong>Corporation</strong>’s common stock is listed on the New York Stock Exchange under the symbol “UNP”.<br />
A copy of this <strong>Annual</strong> <strong>Report</strong> on Form 10-K, as well as the <strong>Corporation</strong>’s Quarterly <strong>Report</strong>s on Form 10-Q, Current<br />
<strong>Report</strong>s on Form 8-K and any amendments to such reports are available, free of charge, on the Internet at the <strong>Corporation</strong>’s<br />
website www.up.com/investors. The reference to the <strong>Corporation</strong>’s website address does not constitute incorporation by<br />
reference of the information contained on the website and should not be considered part of this document.<br />
The <strong>Corporation</strong> operates primarily in the areas of rail transportation, through its indirect wholly owned subsidiary<br />
<strong>Union</strong> <strong>Pacific</strong> Railroad Company (UPRR or the Railroad), and trucking, which includes Overnite Transportation Company<br />
(OTC) and Motor Cargo Industries, Inc. (Motor Cargo) as of November 30, 2001, both operating as separate and distinct<br />
subsidiaries of Overnite <strong>Corporation</strong> (Overnite), an indirect wholly owned subsidiary of UPC. The details of strategic<br />
transactions in recent years are as follows:<br />
Southern <strong>Pacific</strong> – During 2001, UPC completed its integration of Southern <strong>Pacific</strong>’s rail operations. UPC consummated<br />
the acquisition of Southern <strong>Pacific</strong> in September 1996 for $4.1 billion. Sixty percent of the outstanding Southern <strong>Pacific</strong><br />
common shares was converted into UPC common stock and the remaining 40% of the outstanding shares was acquired for<br />
cash. UPC initially funded the cash portion of the acquisition with credit facility borrowings, all of which have been<br />
subsequently refinanced with other borrowings. The acquisition of Southern <strong>Pacific</strong> has been accounted for using the<br />
purchase method of accounting and was fully consolidated into UPC results beginning October 1996.<br />
Mexican Railway Concession – During 1997, the Railroad and a consortium of partners were granted a 50-year concession<br />
to operate the <strong>Pacific</strong>-North and Chihuahua <strong>Pacific</strong> lines in Mexico and a 25% stake in the Mexico City Terminal Company<br />
at a price of $525 million. The consortium assumed operational control of both lines in 1998. In March 1999, the Railroad<br />
purchased an additional 13% ownership interest for $87 million from one of its partners. The Railroad currently holds a<br />
26% ownership share in the consortium. This investment is accounted for using the equity method of accounting.<br />
Motor Cargo – The <strong>Corporation</strong> entered into an Agreement and Plan of Merger, dated October 15, 2001 (the Agreement),<br />
with Motor Cargo, a Utah corporation, and Motor Merger Co., a Utah corporation and wholly owned subsidiary of UPC,<br />
pursuant to which, the <strong>Corporation</strong> agreed to offer to exchange for each share of Motor Cargo common stock, no par value<br />
(Motor Cargo Stock), at the election of the holder, either 0.26 of a share of common stock, par value $2.50 per share, of the<br />
<strong>Corporation</strong> or $12.10 in cash. As a result of the exchange offer, UPC acquired 99.7% of Motor Cargo Stock as of November<br />
30, 2001, and therefore, Motor Cargo’s results of operations were consolidated with the <strong>Corporation</strong> subsequent to<br />
November 30, 2001. The <strong>Corporation</strong> utilized approximately 1.7 million shares of UPC common stock in the exchange. In<br />
February <strong>2002</strong>, the <strong>Corporation</strong> completed the acquisition of the remaining shares of Motor Cargo Stock, and Motor Merger<br />
Co. was merged with Motor Cargo leaving Motor Cargo as the surviving corporation. After completion of the merger, the<br />
trucking segment of the <strong>Corporation</strong> now includes OTC and Motor Cargo operating as separate and distinct companies<br />
under Overnite. Under the purchase method of accounting, the purchase price was approximately $90 million, including<br />
assumed liabilities.<br />
OPERATIONS<br />
<strong>Union</strong> <strong>Pacific</strong> <strong>Corporation</strong> consists of two reportable segments, rail and trucking, as well as UPC’s other product lines<br />
(Other). The rail segment includes the operations of UPRR and UPRR’s subsidiaries and rail affiliates (collectively, the<br />
Railroad). The trucking segment includes OTC and Motor Cargo, as of November 30, 2001, both operating as separate and<br />
distinct subsidiaries of Overnite. The <strong>Corporation</strong>’s other product lines are comprised of the corporate holding company<br />
(which largely supports the Railroad), self-insurance activities, technology companies and all appropriate consolidating<br />
entries (see note 1 to the Consolidated Financial Statements, Item 8).<br />
3
Rail<br />
Operations – The Railroad is a Class I railroad that operates in the United States. It has over 33,000 route miles linking<br />
<strong>Pacific</strong> Coast and Gulf Coast ports to the Midwest and eastern United States gateways and providing several north/south<br />
corridors to key Mexican gateways. The Railroad serves the western two-thirds of the country and maintains coordinated<br />
schedules with other carriers for the handling of freight to and from the Atlantic Coast, the <strong>Pacific</strong> Coast, the Southeast, the<br />
Southwest, Canada and Mexico. Export and import traffic is moved through Gulf Coast and <strong>Pacific</strong> Coast ports and across<br />
the Mexican and Canadian borders. Railroad freight is comprised of six commodity lines: agricultural, automotive,<br />
chemicals, energy, industrial products and intermodal. The Railroad continues to focus on utilization of its capital asset base<br />
to meet current operating needs and to introduce innovative rail services across every commodity line.<br />
The Railroad is subject to price and service competition from other railroads, motor carriers and barge operators. The<br />
Railroad’s main competitor is Burlington Northern Santa Fe <strong>Corporation</strong>. Its rail subsidiary, The Burlington Northern and<br />
Santa Fe Railway Company (BNSF), operates parallel routes in many of the Railroad’s main traffic corridors. In addition,<br />
the Railroad’s operations are conducted in corridors served by other competing railroads and by motor carriers. Motor<br />
carrier competition is particularly strong for intermodal traffic. Because of the proximity of the Railroad’s routes to major<br />
inland and Gulf Coast waterways, barge competition can be particularly pronounced, especially for grain and bulk<br />
commodities.<br />
Employees – Approximately 87% of the Railroad’s nearly 47,000 employees are represented by 14 major rail unions. National<br />
negotiations under the Railway Labor Act to revise the national labor agreements for all crafts began in late 1999. In May 2001,<br />
the Brotherhood of Maintenance of Way Employees (BMWE) ratified a five-year agreement, which included provisions for<br />
an annual wage increase (based on the consumer price index) and progressive health and welfare cost sharing. In August <strong>2002</strong>,<br />
the carriers reached a five year agreement with the United Transportation <strong>Union</strong> (UTU) for annual wage increases as follows:<br />
4.0% July <strong>2002</strong>, 2.5% July 2003, and 3.0% July 2004. The agreement also established a process for resolving the health and<br />
welfare cost sharing issue through arbitration and also provided for the operation of remote control locomotives by trainmen.<br />
The Brotherhood of Locomotive Engineers (BLE) challenged the remote control feature of the UTU Agreement and a recent<br />
arbitration decision held that operation of remote control by UTU members in terminals does not violate the BLE agreement.<br />
In November <strong>2002</strong>, the International Brotherhood of Boilermakers and Blacksmiths (IBB) reached a five year agreement<br />
following the UTU wage pattern. In January 2003, an arbitration award was rendered establishing wage increases and health<br />
and welfare employee cost sharing for the Transportation Communications International <strong>Union</strong> (TCU). Contract discussions<br />
with the remaining unions are either in negotiation or mediation. Also during <strong>2002</strong>, the National Mediation Board ruled<br />
against the UTU on its petition for a single operating craft on the Kansas City Southern Railroad. The BLE is now working<br />
on a possible merger with the International Brotherhood of Teamsters (Teamsters).<br />
Trucking<br />
Operations – The trucking segment includes the operations of OTC and Motor Cargo. OTC is a major interstate trucking<br />
company specializing in less-than-truckload (LTL) shipments. OTC serves all 50 states and portions of Canada and Mexico<br />
through 170 service centers located throughout the United States providing regional, inter-regional and long haul service.<br />
OTC transports a variety of products including machinery, tobacco, textiles, plastics, electronics and paper products. Motor<br />
Cargo is a western regional LTL carrier that provides comprehensive service throughout 10 western states. Motor Cargo<br />
transports general commodities including consumer goods, packaged foodstuffs, industrial and electronic equipment and<br />
auto parts. OTC and Motor Cargo experience intense service and price competition from regional, inter-regional and<br />
national LTL carriers and, to a lesser extent, from truckload carriers, railroads and overnight delivery companies. Major<br />
competitors include US Freightways and CNF Inc. OTC and Motor Cargo believe they are able to compete effectively in their<br />
markets by providing high quality, customized service at competitive prices.<br />
Employees – During <strong>2002</strong>, OTC continued to oppose the efforts of the Teamsters to unionize OTC service centers. On<br />
February 11, <strong>2002</strong>, the United States Court of Appeals for the Fourth Circuit, sitting as a full panel, refused to enforce four<br />
bargaining orders issued by the National Labor Relations Board (NLRB) that would have required OTC to bargain with the<br />
Teamsters, even though the Teamsters lost secret ballot elections. Subsequently, the NLRB moved for a judgment against<br />
itself to reverse the seven other bargaining orders it had issued, and the Fourth Circuit entered that judgment. On October<br />
11, <strong>2002</strong>, the NLRB’s General Counsel dismissed a charge the Teamsters had filed in August 2001 alleging that OTC had been<br />
bargaining in bad faith. OTC has not reached any collective bargaining agreement with the Teamsters. On October 24, <strong>2002</strong>,<br />
the Teamsters ended the national strike they had called against OTC three years earlier.<br />
4
The Teamsters’ eight-year campaign to organize OTC’s service centers has become almost entirely dormant, and since<br />
October <strong>2002</strong>, the Teamsters have lost rights to represent 41% of the approximately 2,100 employees they had organized. The<br />
Teamsters had become the bargaining representative of the employees at 26 of OTC’s 170 service centers, but the employees<br />
at 17 of these locations recently have voted to decertify the Teamsters, and the NLRB has officially approved the votes in 14<br />
of those locations. Decertification petitions are pending at four other service centers. Only a single representation petition<br />
currently is pending, but due to strike violence charges pending against the Teamsters, the NLRB has blocked the Teamsters’<br />
efforts to precipitate an election. In all, the Teamsters currently represent approximately 10% of OTC’s 12,534 employees.<br />
Employees at two Motor Cargo service centers located in North Salt Lake, Utah and Reno, Nevada, representing<br />
approximately 11% of Motor Cargo’s total work force at 33 service centers, are covered by two separate collective bargaining<br />
agreements with unions affiliated with the Teamsters. Although the agreements cover most of the employees at these two<br />
facilities, less than half of these covered employees are actual members of unions.<br />
Other Product Lines<br />
Other – Included in the other product lines are the results of the corporate holding company, self-insurance activities,<br />
technology companies and all appropriate consolidating entries.<br />
OTHER INFORMATION<br />
Additional information regarding UPC’s operations is presented within Selected Financial Data, Item 6, and the<br />
Consolidated Financial Statements, Item 8.<br />
Governmental Regulation – UPC’s operations are currently subject to a variety of federal, state and local regulations (see<br />
also the discussion of certain regulatory proceedings in Legal Proceedings, Item 3).<br />
The operations of the Railroad and trucking segment are subject to the regulatory jurisdiction of the Surface<br />
Transportation Board (STB) of the United States Department of Transportation (DOT) and other federal and state agencies.<br />
The operations of the Railroad are also subject to the regulations of the Federal Railroad Administration of the DOT. The<br />
STB has jurisdiction over rates charged on certain regulated rail traffic; freight car compensation; transfer, extension or<br />
abandonment of rail lines; and acquisition of control of rail common carriers.<br />
The DOT and the Occupational Safety and Health Administration, along with other federal agencies, have jurisdiction<br />
over certain aspects of safety, movement of hazardous materials, movement and disposal of hazardous waste and equipment<br />
standards. Various state and local agencies have jurisdiction over disposal of hazardous waste and seek to regulate movement<br />
of hazardous materials in areas not otherwise preempted by federal law.<br />
Environmental Regulation – UPC and its subsidiaries are subject to various environmental statutes and regulations,<br />
including the Resource Conservation and Recovery Act (RCRA), the Comprehensive Environmental Response,<br />
Compensation and Liability Act of 1980 (CERCLA) and the Clean Air Act (CAA).<br />
RCRA applies to hazardous waste generators and transporters, as well as to persons engaged in treatment and disposal of<br />
hazardous waste, and specifies standards for storage areas, treatment units and land disposal units. All generators of<br />
hazardous waste are required to label shipments in accordance with detailed regulations and to prepare a detailed manifest<br />
identifying the material and stating its destination before waste can be released for offsite transport. The transporter must<br />
deliver the hazardous waste in accordance with the manifest and only to a treatment, storage or disposal facility qualified for<br />
RCRA interim status or having a final RCRA permit.<br />
The Environmental Protection Agency (EPA) regulations under RCRA have established a comprehensive system for the<br />
management of hazardous waste. These regulations identify a wide range of industrial by-products and residues as<br />
hazardous waste, and specify requirements for management of such waste from the time of generation through the time of<br />
disposal and beyond. States that have adopted hazardous waste management programs with standards at least as stringent<br />
as those promulgated by the EPA may be authorized by the EPA to administer all or part of RCRA on behalf of the EPA.<br />
CERCLA was designed to establish a strategy for cleaning up facilities at which hazardous waste or other hazardous<br />
substances have created actual or potential environmental hazards. The EPA has designated certain facilities as requiring<br />
5
cleanup or further assessment. Among other things, CERCLA authorizes the federal government either to clean up such<br />
facilities itself or to order persons responsible for the situation to do so. The act created a multi-billion dollar fund to be<br />
used by the federal government to pay for such cleanup efforts. In the event the federal government pays for such cleanup,<br />
it will seek reimbursement from private parties upon which CERCLA imposes liability.<br />
CERCLA imposes strict liability on the owners and operators of facilities in which hazardous waste and other hazardous<br />
substances are deposited or from which they are released or are likely to be released into the environment. It also imposes<br />
strict liability on the generators of such waste and the transporters of the waste who select the disposal or treatment sites.<br />
Liability may include cleanup costs incurred by third persons and damage to publicly owned natural resources. The<br />
<strong>Corporation</strong> is subject to potential liability under CERCLA as an owner or operator of facilities at which hazardous<br />
substances have been disposed of or as a generator or a transporter of hazardous substances disposed of at other locations.<br />
Some states have enacted, and other states are considering enacting, legislation similar to CERCLA. Certain provisions of<br />
these acts are more stringent than CERCLA. States that have passed such legislation are currently active in designating more<br />
facilities as requiring cleanup and further assessment.<br />
The operations of the <strong>Corporation</strong> are subject to the requirements of the CAA. The 1990 amendments to the CAA include<br />
a provision under Title V requiring that certain facilities obtain operating permits. EPA regulations require all states to develop<br />
federally-approvable permit programs. Affected facilities must submit air operating permit applications to the respective states<br />
within one year of the EPA’s approval of the state programs. Certain of the <strong>Corporation</strong>’s facilities may be required to obtain<br />
such permits. In addition, in December 1997, the EPA issued final regulations which require that certain purchased and<br />
remanufactured locomotives meet stringent emissions criteria. While the cost of meeting these requirements may be<br />
significant, expenditures are not expected to materially affect the <strong>Corporation</strong>’s financial condition or results of operations.<br />
The operations of the <strong>Corporation</strong> are also subject to other laws protecting the environment, including permit<br />
requirements for wastewater discharges pursuant to the National Pollutant Discharge Elimination System and storm-water<br />
runoff regulations under the Federal Water Pollution Control Act.<br />
Information concerning environmental claims and contingencies and estimated remediation costs is set forth in<br />
Management’s Discussion and Analysis of Financial Condition and Results of Operations – Other Matters – Environmental<br />
Costs, Item 7, and in note 10 to the Consolidated Financial Statements, Item 8.<br />
RISK FACTORS<br />
Competition – The <strong>Corporation</strong> is subject to price and service competition from other railroads, which operate parallel<br />
routes in many of UPRR’s traffic corridors, in addition to operations providing other modes of transportation, including<br />
motor carriers, ships, barges and pipelines. Competition is based primarily upon the rate charged and the transit time<br />
required, as well as the quality and reliability of the service provided. While the Railroad must build or acquire and maintain<br />
its rail system, trucks and barges are able to use public rights-of-way maintained by public entities. Any future improvements<br />
or expenditures materially increasing the quality of these alternative modes of transportation in the locations in which the<br />
Railroad operates, or legislation granting materially greater latitude for motor carriers with respect to size or weight<br />
limitations, could have a material adverse effect on the results of operations, financial condition and liquidity.<br />
Governmental Regulation – The <strong>Corporation</strong> is subject to governmental regulation by a significant number of federal, state<br />
and local regulatory authorities with respect to both the railroad and trucking operations and a variety of health, safety,<br />
labor, environmental and other matters. Failure to comply with applicable laws and regulations could have a material<br />
adverse effect on the financial statements. Regulatory authorities may change the legislative framework within which the<br />
<strong>Corporation</strong> operates without providing the <strong>Corporation</strong> any recourse for any adverse effects that the change may have on<br />
the business. Also, some of the regulations require the <strong>Corporation</strong> to obtain and maintain various licenses, permits and<br />
other authorizations, and the <strong>Corporation</strong> cannot assure that it will continue to be able to do so.<br />
Environmental Laws and Regulations – The <strong>Corporation</strong>’s operations are subject to extensive federal, state and local<br />
environmental laws and regulations concerning, among other things, emissions to the air, discharges to water and the<br />
handling, storage, transportation and disposal of waste and other materials and cleanup of hazardous material or petroleum<br />
releases. Environmental liability can extend to previously owned or operated properties, leased properties and properties<br />
owned by third parties, as well as to properties currently owned and used. Environmental liabilities may also arise from<br />
claims asserted by adjacent landowners or other third parties in toxic tort litigation. The <strong>Corporation</strong> may be subject to<br />
6
allegations or findings to the effect that it has violated, or is strictly liable under, these laws or regulations. The <strong>Corporation</strong><br />
could incur significant costs as a result of any of the foregoing and may be required to incur significant expenses to<br />
investigate and remediate environmental contamination.<br />
Fuel Costs – Fuel costs constitute a significant portion of transportation expenses. Diesel fuel prices are subject to dramatic<br />
fluctuations. Significant price increases may have a material adverse effect on the <strong>Corporation</strong>’s operating results.<br />
Additionally, fuel prices and supplies are influenced significantly by international political and economic circumstances. If a<br />
fuel supply shortage were to arise from OPEC production curtailments, a disruption of oil imports or otherwise, higher fuel<br />
prices and any subsequent price increases would materially affect the <strong>Corporation</strong>’s results of operations, financial condition<br />
and liquidity.<br />
Labor <strong>Union</strong>s – The <strong>Corporation</strong> is a party to collective bargaining agreements and ongoing negotiations with various labor<br />
unions in the United States. Disputes with regard to the terms of these agreements or the <strong>Corporation</strong>’s potential inability<br />
to negotiate acceptable contracts with these unions could result in, among other things, strikes, work stoppages or other<br />
slowdowns by the affected workers. If the unionized workers were to engage in a strike, work stoppage or other slowdown,<br />
or other employees were to become unionized or the terms and conditions in future labor agreements were renegotiated, the<br />
<strong>Corporation</strong> could experience a significant disruption of its operations and higher ongoing labor costs.<br />
General Economic Conditions – Several of the commodities transported by both the Railroad and trucking segments come<br />
from industries with cyclical business operations. As a result, prolonged negative changes in domestic and global economic<br />
conditions affecting the producers and consumers of the commodities carried by the <strong>Corporation</strong> may have an adverse effect<br />
on the results of operations, financial condition and liquidity.<br />
Weather – Severe weather conditions and other natural phenomena, including earthquakes and floods, may cause significant<br />
business interruptions and result in increased costs and liabilities and decreased revenues, which could have an adverse effect<br />
on the results of operations, financial condition and liquidity.<br />
Supplier Risk – The <strong>Corporation</strong> is dependent on two key suppliers of locomotives. Due to the capital intensive nature and<br />
sophistication of this equipment, there are strong barriers of entry to new suppliers. Therefore, if one of these suppliers<br />
would no longer produce locomotives, the <strong>Corporation</strong> could realize a significant increase in the cost and the potential for<br />
reduced availability of the locomotives that are necessary to its operations.<br />
Claims and Lawsuits – The nature of the <strong>Corporation</strong>’s business exposes it to the potential for various claims and litigation<br />
related to labor and employment, personal injury and occupational illness, property damage, environmental and other<br />
matters. Therefore, the <strong>Corporation</strong> may be subject to claims or litigation that could involve significant expenditures.<br />
Future Acts of Terrorism or War or Risk of War – Terrorist attacks, such as those that occurred on September 11, 2001, any<br />
government response thereto and war or risk of war may adversely affect the <strong>Corporation</strong>’s results of operations, financial<br />
condition, the ability to raise capital or the <strong>Corporation</strong>’s future growth. The <strong>Corporation</strong>’s rail lines and facilities could be<br />
direct targets or indirect casualties of an act or acts of terror, which could cause significant business interruption and result<br />
in increased costs and liabilities and decreased revenues, which could have an adverse effect on the operating results and<br />
financial condition. Any act of terror, retaliatory strike, sustained military campaign or war or risk of war may have an<br />
adverse impact on the operating results and financial condition by causing or resulting in unpredictable operating or<br />
financial conditions, including disruptions of rail lines, volatility or sustained increase of fuel prices, fuel shortages, general<br />
economic decline and instability or weakness of financial markets which could restrict the <strong>Corporation</strong>’s ability to raise<br />
capital. In addition, insurance premiums charged for some or all of the coverages currently maintained by the <strong>Corporation</strong><br />
could increase dramatically or certain coverages may not be available in the future.<br />
Item 2. Properties<br />
The <strong>Corporation</strong>’s primary real estate, equipment and other property (properties) are owned or leased to support its rail and<br />
trucking operations. The <strong>Corporation</strong> believes that its properties are in good condition and adequate for current operations.<br />
The rail and trucking segments operate facilities and equipment designated for both the maintenance and repair of their<br />
respective property, including locomotives, rail cars, tractors and trailers and other equipment, and for monitoring such<br />
maintenance and repair work. The facilities include rail yards, intermodal ramps and maintenance shops throughout the<br />
rail system and service centers operated by the trucking segment. Additionally, the <strong>Corporation</strong> had approximately $1.9<br />
7
illion in capital expenditures during <strong>2002</strong> for, among other things, building and maintaining track, structures and<br />
infrastructure, upgrading and augmenting equipment and implementing new technologies. See the capital expenditures<br />
table in Item 7.<br />
Certain of the <strong>Corporation</strong>’s properties are subject to federal, state and local provisions involving the protection of the<br />
environment. See discussion of environmental issues in Other Information, Item 1, Management’s Discussion and Analysis<br />
of Financial Condition and Results of Operations – Other Matters – Environmental Costs, Item 7, and in note 10 to the<br />
Consolidated Financial Statements, Item 8. See also notes 1, 3, 5 and 6 to the Consolidated Financial Statements, Item 8, for<br />
additional information regarding the <strong>Corporation</strong>’s properties.<br />
Rail Operations<br />
Track – The <strong>Corporation</strong>’s rail operations utilize over 33,000 main line and branch line route miles in 23 states in the western<br />
two-thirds of the United States. The <strong>Corporation</strong> owns 27,400 route miles with the remainder of route miles operated under<br />
trackage rights or leases. As of and for the years ending December 31, <strong>2002</strong>, 2001, and 2000, route miles operated and track<br />
miles installed and replaced are as follows:<br />
Miles <strong>2002</strong> 2001 2000<br />
Main line.......................................................................................................... 27,504 27,553 26,914<br />
Branch line....................................................................................................... 5,637 6,033 6,121<br />
Yards, sidings and other main lines................................................................ 21,760 21,669 21,564<br />
Total.................................................................................................................. 54,901 55,255 54,599<br />
Track miles of rail installed and replaced:<br />
New ............................................................................................................. 783 857 943<br />
Used ............................................................................................................ 330 388 242<br />
Ties installed and replaced (000).................................................................... 4,531 3,648 3,332<br />
Equipment – The <strong>Corporation</strong>’s primary rail equipment as of and for the years ending December 31, <strong>2002</strong>, 2001 and 2000,<br />
consisted of the following:<br />
Equipment <strong>2002</strong> 2001 2000<br />
Owned or leased at year-end:<br />
Locomotives..................................................................................................... 7,094 6,886 7,007<br />
Freight cars:<br />
Covered hoppers ........................................................................................ 30,602 33,901 37,607<br />
Boxcars........................................................................................................ 15,040 15,561 18,342<br />
Open-top hoppers...................................................................................... 15,891 17,202 18,683<br />
Gondolas..................................................................................................... 14,793 15,431 17,480<br />
Other........................................................................................................... 14,551 14,681 16,557<br />
Work Equipment............................................................................................. 6,950 6,950 6,616<br />
Purchased or leased during the year:<br />
Locomotives ............................................................................................... 530 500 451<br />
Freight cars ................................................................................................. 3,823 793 1,082<br />
Average age of equipment (years):<br />
Locomotives ............................................................................................... 14.4 14.9 14.9<br />
Freight cars ................................................................................................. 21.9 22.5 20.9<br />
8
Trucking Operations<br />
Properties related to trucking operations consist primarily of service centers and tractor and trailer equipment. The<br />
following table provides the number of tractors, trailers and service centers owned or leased within the trucking operations:<br />
Equipment and Service Centers <strong>2002</strong> 2001 2000<br />
Owned or leased at year-end:<br />
Tractors....................................................................................................... 6,085 5,816 5,408<br />
Trailers ........................................................................................................ 21,597 21,504 18,586<br />
Straight trucks............................................................................................ 147 138 74<br />
Automobiles and service units .................................................................. 198 191 166<br />
Service centers ............................................................................................ 203 199 166<br />
Average age of equipment (years):<br />
Tractors....................................................................................................... 6.4 6.4 6.6<br />
Trailers ........................................................................................................ 10.5 9.7 10.1<br />
Item 3. Legal Proceedings<br />
Shareholder Litigation<br />
As previously reported, a purported derivative action was filed by nine individuals, seven of whom are members of the<br />
Teamsters, on behalf of the <strong>Corporation</strong> on June 21, 2001, in the Chancery Court of Shelby County, Tennessee, naming as<br />
defendants current and certain former directors of the <strong>Corporation</strong> and various present and former officers and employees<br />
of OTC, as well as OTC, and, as a nominal defendant, the <strong>Corporation</strong>. The derivative action alleged, among other things,<br />
that the named defendants breached their fiduciary duties to the <strong>Corporation</strong>, wasted its assets and mismanaged OTC by<br />
opposing the efforts of the Teamsters to organize the employees of OTC. Plaintiffs claimed that the “anti-union” campaign<br />
allegedly waged by the defendants cost millions of dollars and caused a substantial decline in the value of OTC. On July 31,<br />
2001, the defendants filed a motion to dismiss the action on various grounds, and on July 1, <strong>2002</strong>, the court granted the<br />
defendants’ motion and dismissed the derivative action on procedural grounds. The plaintiffs have filed an appeal with the<br />
Tennessee Court of Appeals. The <strong>Corporation</strong> and the defendents will vigorously defend this appeal and any other efforts<br />
by the plaintiffs.<br />
Environmental Matters<br />
As previously reported in the <strong>Corporation</strong>’s Quarterly <strong>Report</strong> on Form 10-Q for the quarter ended June 30, 2000, a UPRR<br />
train carrying hazardous materials derailed on May 27, 2000 near Eunice, Louisiana, resulting in the evacuation of<br />
approximately 3,500 residents of the surrounding area and numerous claims for personal injury, property damage and<br />
business interruption. Following the incident, forty lawsuits were filed in various courts, and thirty-eight of those cases were<br />
consolidated in the United States District Court for the District of Western Louisiana. The remaining two cases were filed<br />
in the State District Court in Baton Rouge, Louisiana, and are being coordinated with the federal cases. After the federal<br />
District Court certified a class of over 20,000 potential claimants, the Railroad appealed to the Unites States Court of Appeals<br />
for the Fifth Circuit. The plaintiffs agreed to stay the appeal to facilitate settlement negotiations, which are ongoing. While<br />
it is not possible to predict the ultimate outcome of these proceedings, the Railroad believes it has substantial defenses.<br />
Although losses exceed the self-insured retention amounts, the Railroad believes its insurance coverage is adequate to cover<br />
material damage claims or settlement amounts.<br />
As previously reported in the <strong>Corporation</strong>’s <strong>Annual</strong> <strong>Report</strong> on Form 10-K for 2001, on January 30, <strong>2002</strong>, the Louisiana<br />
Department of Environmental Quality (LDEQ) issued to the Railroad a notice of a proposed penalty assessment in the<br />
amount of $195,700 in connection with the release of water potentially impacted by the derailment of a train near Eunice,<br />
Louisiana, as discussed above. The Railroad previously met with the LDEQ regarding this matter to present documentation<br />
indicating that no penalty should be assessed. The Railroad has filed suit against the LDEQ in Louisiana State District Court<br />
challenging the penalty.<br />
As previously reported in the <strong>Corporation</strong>’s Quarterly <strong>Report</strong> on Form 10-Q for the quarter ended June 30, <strong>2002</strong>, the<br />
District Attorneys of Merced, Madera and Stanislaus counties in the State of California threatened to file criminal charges<br />
against the Railroad in connection with the release of calcium oxide (lime), which leaked from an unidentified railcar between<br />
9
Chowchilla and Sacramento, California, on December 27, 2001, and another incident in which lime leaked from a railcar<br />
between Chowchilla and Stockton, California, on February 21, <strong>2002</strong>. On December 20, <strong>2002</strong>, the District Attorney of<br />
Stanislaus county filed criminal charges against the Railroad, and on December 23, <strong>2002</strong>, the District Attorneys of Merced and<br />
Madera counties filed criminal charges against the Railroad relating to these incidents. They contend that criminal violations<br />
occurred by virtue of the alleged failure by the Railroad to timely report the release of a hazardous material, its alleged disposal<br />
of hazardous waste and the alleged release of material into the waters of the State of California. The District Attorneys of San<br />
Joaquin and Sacramento Counties are still evaluating these incidents, as well as other alleged releases. The Railroad disputes<br />
both the factual and legal bases for these claims and intends to vigorously defend any action that might be filed.<br />
As previously reported in the <strong>Corporation</strong>’s Quarterly <strong>Report</strong> on Form 10-Q for the quarter ended September 30, <strong>2002</strong>,<br />
the United States Environmental Protection Agency, Region 9, has filed two administrative complaints against UPRR, the<br />
first of which alleges that the Railroad violated the Clean Water Act in 1997 by discharging dredged or fill materials into the<br />
Carpenteria Salt Marsh in Santa Barbara County, California, and seeks civil penalties from the Railroad in an amount up to<br />
$137,500. The second complaint alleges that the Railroad violated the Clean Water Act in 1999 by discharging dredged or<br />
fill materials into Laguna Creek, in Santa Barbara County, California, without a Section 404 permit and likewise seeks civil<br />
penalties up to $137,500. UPRR disputes the allegations set forth in these complaints and intends to defend the matters in<br />
any subsequent administrative proceedings.<br />
As previously reported in the <strong>Corporation</strong>’s Quarterly <strong>Report</strong> on Form 10-Q for the quarter ended September 30, <strong>2002</strong>,<br />
the South Coast Air Quality Management District has filed an action against the Railroad in the Los Angeles County<br />
Superior Court, in which it seeks civil penalties in an amount up to $225,000 from the Railroad. The complaint alleges that<br />
the Railroad has violated certain provisions of the California Health and Safety Code and District rules, as a result of air<br />
emissions from idling diesel locomotives in Los Angeles, California. The complaint further alleges that the Railroad has<br />
violated the California Health and Safety Code and District rules as a result of fugitive dust emissions from railroad property<br />
located in Colton, California. The Railroad disputes the allegations of the complaint and maintains that the claims relating<br />
to idling locomotives are preempted by federal law. The Railroad has reached an agreement to settle these claims for a<br />
payment of $25,500 in penalties.<br />
As previously reported in the <strong>Corporation</strong>’s Quarterly <strong>Report</strong> on Form 10-Q for the quarter ended March 31, <strong>2002</strong>, on<br />
April 26, <strong>2002</strong>, UPRR received written notice of a proposed $250,000 penalty from the Illinois Environmental Protection<br />
Agency relating to a collision between trains from Conrail and the Railroad. The collision occurred near Momence, Illinois,<br />
on March 23, 1999 when an eastbound Conrail train failed to stop at a signal and struck a UPRR train that was properly<br />
occupying a crossing. The collision resulted in a release of diesel fuel from the fuel tanks of a <strong>Union</strong> <strong>Pacific</strong> locomotive,<br />
which was promptly reported and remediated. The Railroad received notice in January 2003 that the amount of the<br />
proposed penalty, including oversight costs has been reduced to $127,000. The Railroad will vigorously oppose this<br />
proposed penalty.<br />
The <strong>Corporation</strong> and its affiliates have received notices from the EPA and state environmental agencies alleging that they<br />
are or may be liable under certain federal or state environmental laws for remediation costs at various sites throughout the<br />
United States, including sites which are on the Superfund National Priorities List or state superfund lists. Although specific<br />
claims have been made by the EPA and state regulators with respect to some of these sites, the ultimate impact of these<br />
proceedings and suits by third parties cannot be predicted at this time because of the number of potentially responsible<br />
parties involved, the degree of contamination by various wastes, the scarcity and quality of volumetric data related to many<br />
of the sites, and/or the speculative nature of remediation costs. Nevertheless, at many of the superfund sites, the <strong>Corporation</strong><br />
believes it will have little or no exposure because no liability should be imposed under applicable law, one or more other<br />
financially able parties generated all or most of the contamination, or a settlement of the <strong>Corporation</strong>’s exposure has been<br />
reached although regulatory proceedings at the sites involved have not been formally terminated.<br />
Information concerning environmental claims and contingencies and estimated remediation costs is set forth in<br />
Management’s Discussion and Analysis of Financial Condition and Results of Operations – Other Matters – Environmental<br />
Costs, Item 7, and in note 10 to the Consolidated Financial Statements, Item 8.<br />
Other Matters<br />
As previously reported, Western Resources, Inc. (Western) filed a complaint on January 24, 2000 in the U.S. District Court<br />
for the District of Kansas alleging that UPRR and The Burlington Northern and Santa Fe Railway Company (BNSF)<br />
10
materially breached their service obligations under the transportation contract to deliver coal in a timely manner to<br />
Western’s Jeffrey Energy Center. The original complaint sought recovery of consequential damages and termination of the<br />
contract, excusing Western from further performance. In an amended complaint filed September 1, 2000, Western claimed<br />
the right to retroactive termination and added a claim for restitution. The matter went to trial before a jury on August 20,<br />
<strong>2002</strong>. On September 12, <strong>2002</strong>, the jury returned a verdict finding that the contract had not been breached by the railroads,<br />
and the judgment dismissing the case was entered by the court on September 16, <strong>2002</strong>. Western filed a motion for new trial<br />
on September 30, <strong>2002</strong>, which the railroads believe will be unsuccessful. UPRR and BNSF filed a response opposing the<br />
motion for a new trial on October 15, <strong>2002</strong>, and Western filed its reply on October 28, <strong>2002</strong>. UPRR and BNSF will vigorously<br />
defend this and all other post-trial efforts by Western to overturn the jury verdict.<br />
11
Item 4. Submission of Matters to a Vote of Security Holders<br />
No matters were submitted to a vote of security holders during the fourth quarter of the year ended December 31, <strong>2002</strong>.<br />
Executive Officers of the Registrant and Principal Executive Officers of Subsidiaries<br />
Business<br />
Experience<br />
During Past Five<br />
Name Position Age Years<br />
Richard K. Davidson Chairman, President and Chief Executive Officer of UPC 61 Current Position<br />
and Chairman and Chief Executive Officer of the Railroad<br />
James R. Young Executive Vice President–Finance of UPC and 50 (1)<br />
Chief Financial Officer of the Railroad<br />
L. Merill Bryan, Jr. Senior Vice President and Chief Information Officer 58 Current Position<br />
Charles R. Eisele Senior Vice President–Strategic Planning 53 (2)<br />
Robert M. Knight, Jr. Senior Vice President–Finance 45 (3)<br />
Barbara W. Schaefer Senior Vice President–Human Resources 49 Current Position<br />
Robert W. Turner Senior Vice President–Corporate Relations 53 (4)<br />
Carl W. von Bernuth Senior Vice President, General Counsel and Secretary 59 Current Position<br />
Bernard R. Gutschewski Vice President–Taxes 52 (5)<br />
Mary E. McAuliffe Vice President–External Relations 57 Current Position<br />
Richard J. Putz Vice President and Controller 55 (6)<br />
Mary Sanders Jones Vice President and Treasurer 50 (7)<br />
Ivor J. Evans President and Chief Operating Officer of the Railroad 60 (8)<br />
James V. Dolan Vice Chairman of the Board of the Railroad 64 (9)<br />
Dennis J. Duffy Executive Vice President–Operations of the Railroad 52 (10)<br />
John J. Koraleski Executive Vice President–Marketing and Sales of the Railroad 52 (11)<br />
R. Bradley King Executive Vice President–Network Design and 54 (12)<br />
Integration of the Railroad<br />
Leo H. Suggs Chairman of Overnite and Chairman and 63 (13)<br />
Chief Executive Officer of OTC<br />
12
Executive Officers of the Registrant and Principal Executive Officers of Subsidiaries<br />
(Continued)<br />
(1) Mr. Young was elected Executive Vice President–Finance of UPC and Chief Financial Officer of the Railroad<br />
effective December 1, 1999. He was elected Controller of UPC and Senior Vice President–Finance of the Railroad<br />
effective March 1999 and Senior Vice President–Finance of UPC effective June 1998. He served as Treasurer of the<br />
Railroad from June 1998 to March 1999. He was Vice President–Customer Service Planning and Quality of the<br />
Railroad from April 1998 to June 1998 and Vice President–Quality and Operations Planning prior thereto.<br />
(2) Mr. Eisele was elected to his current position effective October 1, 2001. He was Vice President–Strategic Planning<br />
and Administration from March 1999 to October 2001 and Vice President–Strategic Planning for the Railroad<br />
prior thereto.<br />
(3) Mr. Knight was elected to his current position effective February 1, <strong>2002</strong>. He was Vice President and General<br />
Manager Autos for the Railroad from June 2000 to February 1, <strong>2002</strong>, Vice President and General Manager Energy<br />
for the Railroad from March 1999 to June 2000 and Vice President Quality and Administration for UPC prior<br />
thereto.<br />
(4) Mr. Turner was elected to his current position effective August 2000. Prior thereto, he was Vice President–Public<br />
Affairs of Champion International <strong>Corporation</strong>, a paper and forest products company.<br />
(5) Mr. Gutschewski was elected Vice President–Taxes effective August 1998. Prior thereto, he was Assistant Vice<br />
President–Tax and Financial Management of the Railroad.<br />
(6) Mr. Putz was elected Vice President and Controller of UPC and Chief Accounting Officer and Controller of the<br />
Railroad effective December 1, 1999. Prior thereto, he was Assistant Vice President and Controller of the Railroad.<br />
(7) Ms. Sanders Jones was elected to her current position effective March 1999. She served as Vice President–Investor<br />
Relations from June 1998 to March 1999. Prior thereto, she was Assistant Vice President–Treasury and Assistant<br />
Treasurer of UPC.<br />
(8) Mr. Evans was elected to his current position effective September 1998. Prior thereto, he was Senior Vice President<br />
of Emerson Electric Company, a company engaged in the design, manufacture and sale of electrical,<br />
electromechanical, and electronic products and systems.<br />
(9) Mr. Dolan was elected to his current position effective September 1, <strong>2002</strong>. Prior thereto he was Vice President-Law<br />
of the Railroad.<br />
(10) Mr. Duffy was elected to his current position effective September 1998. He was Senior Vice President–Safety<br />
Assurance and Compliance Process prior thereto.<br />
(11) Mr. Koraleski was elected to his current position effective March 1999. He served as Controller of UPC from<br />
August 1998 to March 1999 and prior thereto as Executive Vice President–Finance of the Railroad.<br />
(12) Mr. King was elected to his current position effective September 1998. He was Executive Vice President–Operations<br />
prior thereto.<br />
(13) Mr. Suggs was elected Chairman of Overnite effective February 14, <strong>2002</strong>. He continues to serve as Chairman and<br />
Chief Executive Officer of OTC.<br />
13
PART II<br />
Item 5. Market for the Registrant’s Common Equity and Related Shareholder Matters<br />
The common stock of the <strong>Corporation</strong> is traded on the New York Stock Exchange under the symbol “UNP”. The following<br />
table sets forth, for the quarters indicated, the dividends declared and the high and low sales prices of the <strong>Corporation</strong>’s<br />
common stock.<br />
<strong>2002</strong> - Dollars Per Share Mar. 31 June 30 Sep. 30 Dec. 31<br />
Dividends................................................................................ $0.20 $0.20 $0.20 $0.23<br />
Common stock price:<br />
High ................................................................................... 65.15 64.97 64.87 62.15<br />
Low..................................................................................... 56.01 54.54 53.00 54.95<br />
2001 - Dollars Per Share<br />
Dividends................................................................................ $0.20 $0.20 $0.20 $0.20<br />
Common stock price:<br />
High ................................................................................... 57.10 60.70 58.24 57.50<br />
Low..................................................................................... 48.81 50.00 43.75 44.60<br />
At January 31, 2003, there were 253,834,768 shares of outstanding common stock and approximately 34,184 common<br />
shareholders of record. At that date, the closing price of the common stock on the New York Stock Exchange was $57.06.<br />
The <strong>Corporation</strong> has paid dividends to its common shareholders during each of the past 103 years. In the fourth quarter of<br />
<strong>2002</strong>, the Board of Directors voted to increase the quarterly dividends by 15% to 23 cents per share. The <strong>Corporation</strong><br />
declared dividends of $210 million in <strong>2002</strong> and $199 million in 2001. The <strong>Corporation</strong> is subject to certain restrictions<br />
related to the payment of cash dividends. The amount of retained earnings available for dividends under the most restrictive<br />
test was $5.2 billion and $4.1 billion at December 31, <strong>2002</strong> and 2001, respectively.<br />
Item 6. Selected Financial Data<br />
The following table presents, as of and for the years ended December 31, selected financial data for the <strong>Corporation</strong> for each<br />
of the last 10 years. The selected financial data should be read in conjunction with Management’s Discussion and Analysis<br />
of Financial Condition and Results of Operations, Item 7, and with the Consolidated Financial Statements and notes thereto,<br />
Item 8. The information below is not necessarily indicative of the results of future operations.<br />
Millions of Dollars, Except Per Share Amounts, Ratios and Employee Statistics<br />
<strong>2002</strong>[b] 2001 2000[c] 1999 1998[d] 1997 1996 1995 1994[e] 1993[f]<br />
For the Year Ended December 31[a]<br />
Operating revenue........................ 12,491 11,973 11,878 11,237 10,514 11,079 8,786 7,486 6,492 6,002<br />
Operating income (loss) .............. 2,324 2,072 1,903 1,804 (171) 1,144 1,432 1,242 1,145 1,015<br />
Income (loss) [g].......................... 1,341 966 842 783 (633) 432 733 619 568 412<br />
Net income (loss)........................ 1,341 966 842 810 (633) 432 904 946 546 530<br />
Per share – basic:<br />
Income (loss) [g]..................... 5.32 3.90 3.42 3.17 (2.57) 1.76 3.38 3.02 2.77 2.01<br />
Net income (loss).................... 5.32 3.90 3.42 3.28 (2.57) 1.76 4.17 4.62 2.66 2.59<br />
Per share – diluted:<br />
Income (loss) [g]..................... 5.05 3.77 3.34 3.12 (2.57) 1.74 3.36 3.01 2.76 2.00<br />
Net income (loss).................... 5.05 3.77 3.34 3.22 (2.57) 1.74 4.14 4.60 2.66 2.58<br />
Dividends per share ..................... 0.83 0.80 0.80 0.80 0.80 1.72 1.72 1.72 1.66 1.54<br />
Operating cash flow ..................... 2,250 1,992 2,053 1,869 565 1,600 1,657 1,454 1,079 975<br />
At December 31[a]<br />
Total assets .................................... 32,764 31,551 30,917 30,192 29,590 28,860 27,990 19,500 14,543 13,797<br />
Total debt ...................................... 7,704 8,080 8,351 8,640 8,692 8,518 8,027 6,364 4,479 4,105<br />
Common shareholders’ equity .... 10,651 9,575 8,662 8,001 7,393 8,225 8,225 6,364 5,131 4,885<br />
Equity per common share ........... 41.99 38.26 35.09 32.29 29.88 33.30 33.35 30.96 24.92 23.81<br />
14
Millions of Dollars, Except Per Share Amounts, Ratios and Employee Statistics<br />
<strong>2002</strong>[b] 2001 2000[c] 1999 1998[d] 1997 1996 1995 1994[e] 1993[f]<br />
Additional Data[a]<br />
Rail commodity revenue.............. 10,663 10,391 10,270 9,851 9,072 9,712 7,419 6,105 5,216 4,873<br />
Trucking revenue.......................... 1,332 1,143 1,113 1,062 1,034 946 961 976 1,037 939<br />
Rail carloads (000) ....................... 9,131 8,916 8,901 8,556 7,998 8,453 6,632 5,568 4,991 4,619<br />
Trucking shipments (000) ........... 9,482 7,981 7,495 7,708 7,789 7,506 8,223 8,332 8,593 8,206<br />
Rail operating margin (%) .......... 21.0 19.3 17.7 18.0 4.6 12.6 20.9 21.9 22.1 20.9<br />
Rail operating ratio (%) .............. 79.0 80.7 82.3 82.0 95.4 87.4 79.1 78.1 77.9 79.1<br />
Trucking operating margin (%)[h] 5.3 4.7 4.8 1.9 5.2 3.2 (4.9) (3.0) 8.7 9.8<br />
Trucking operating ratio (%)[h]. 94.7 95.3 95.2 98.1 94.8 96.8 104.9 103.0 91.3 90.2<br />
Average employees (000)[i] ......... 60.9 61.1 61.8 64.2 65.1 65.6 54.8 49.5 45.5 44.0<br />
Revenue per employee (000) ....... 205.1 196.0 192.2 175.0 161.5 168.9 160.3 151.2 142.7 136.4<br />
Financial Ratios (%)[a]<br />
Debt to capital employed [j] ....... 38.8 42.2 45.1 47.6 49.4 50.9 49.4 50.0 46.6 45.7<br />
Return on equity [k] .................... 13.3 10.6 10.1 10.5 (8.1) 5.3 12.4 16.5 10.9 11.1<br />
[a] Data included the effects of the acquisitions of Motor Cargo as of November 30, 2001, Southern <strong>Pacific</strong> Rail <strong>Corporation</strong> as of October<br />
1, 1996, Chicago and North Western Transportation Company as of May 1, 1995, and Skyway Freight Systems, Inc. as of May 31, 1993,<br />
and reflects the disposition of the <strong>Corporation</strong>’s natural resources subsidiary in 1996, waste management subsidiary in 1995 and logistics<br />
subsidiary in 1998.<br />
[b] <strong>2002</strong> net income includes $214 million pre-tax ($133 million after-tax) gains on asset dispositions. In addition, net income included a<br />
reduction of income tax expense of $67 million related to tax adjustments for prior years’ income tax examinations.<br />
[c] 2000 operating income and net income included $115 million pre-tax ($72 million after-tax) work force reduction charge (see note 13<br />
to the Consolidated Financial Statements, Item 8).<br />
[d] 1998 operating loss and net loss included a $547 million pre-and after-tax charge for the revaluation of OTC goodwill.<br />
[e] 1994 net income included a net after-tax loss of $404 million from the sale of the <strong>Corporation</strong>’s waste management operations.<br />
[f] 1993 net income included a net after-tax charge for the adoption of changes in accounting methods for income taxes, postretirement<br />
benefits other than pensions and revenue recognition, and a one-time charge for the deferred tax effect of the Omnibus Budget<br />
Reconciliation Act of 1993.<br />
[g] Based on results from continuing operations.<br />
[h] Excluded goodwill amortization in all years, and the revaluation of goodwill in 1998.<br />
[i] Overnite changed its method of reporting full-time employee equivalents, resulting in a 1% increase in employee counts beginning in 2001.<br />
[j] Debt to capital employed is as follows: total debt divided by debt plus equity plus convertible preferred securities.<br />
[k] Based on average common shareholders’ equity.<br />
Item 7. Management’s Discussion and Analysis of Financial Condition and Results of Operations<br />
The following discussion should be read in conjunction with the Consolidated Financial Statements and applicable notes to<br />
the Consolidated Financial Statements, Item 8, and other information included in this Form 10-K.<br />
As stated in Item 1, <strong>Union</strong> <strong>Pacific</strong> <strong>Corporation</strong> (UPC or the <strong>Corporation</strong>) consists of two reportable segments, rail and<br />
trucking, as well as UPC’s other product lines (Other). The rail segment includes the operations of <strong>Union</strong> <strong>Pacific</strong> Railroad<br />
and its subsidiaries and rail affiliates (UPRR or the Railroad). The trucking segment includes Overnite Transportation<br />
Company (OTC) and Motor Cargo Industries, Inc. (Motor Cargo) as of November 30, 2001, both operating as separate and<br />
distinct subsidiaries of Overnite <strong>Corporation</strong> (Overnite), an indirect wholly owned subsidiary of UPC. The <strong>Corporation</strong>’s<br />
other product lines are comprised of the corporate holding company (which largely supports the Railroad), self-insurance<br />
activities, technology companies and all appropriate consolidating entries (see note 1 to the Consolidated Financial<br />
Statements, Item 8).<br />
CRITICAL ACCOUNTING POLICIES<br />
The <strong>Corporation</strong>’s discussion and analysis of its financial condition and results of operations are based upon its<br />
Consolidated Financial Statements, which have been prepared in accordance with accounting principles generally accepted<br />
in the United States of America. The preparation of these financial statements requires estimation and judgment that affect<br />
15
the reported amounts of revenues, expenses, assets, and liabilities. The <strong>Corporation</strong> bases its estimates on historical<br />
experience and on various other assumptions that are believed to be reasonable under the circumstances, the results of which<br />
form the basis for making judgments about the carrying values of assets and liabilities that are not readily apparent from<br />
other sources. The following are the <strong>Corporation</strong>’s critical accounting policies that affect significant areas of the<br />
<strong>Corporation</strong>’s operations and involve judgment and estimates. If these estimates differ materially from actual results, the<br />
impact on the Consolidated Financial Statements may be material.<br />
Depreciation – Provisions for depreciation are computed principally on the straight-line method based on estimated service<br />
lives of depreciable property. The cost (net of salvage) of depreciable rail property retired or replaced in the ordinary course<br />
of business is charged to accumulated depreciation. Various methods are used to estimate useful lives for each group of<br />
depreciable property. Due to the capital intensive nature of the business and the large base of depreciable assets, variances<br />
to those estimates could have a material effect on the <strong>Corporation</strong>’s Consolidated Financial Statements.<br />
Environmental – The <strong>Corporation</strong> generates and transports hazardous and non-hazardous waste in its current and former<br />
operations, and is subject to federal, state and local environmental laws and regulations. The <strong>Corporation</strong> has identified<br />
approximately 433 sites at which it is or may be liable for remediation costs associated with alleged contamination or for<br />
violations of environmental requirements. This includes 52 sites that are the subject of actions taken by the U.S. government,<br />
27 of which are currently on the Superfund National Priorities List. Certain federal legislation imposes joint and several<br />
liability for the remediation of identified sites; consequently, the <strong>Corporation</strong>’s ultimate environmental liability may include<br />
costs relating to activities of other parties, in addition to costs relating to its own activities at each site.<br />
When an environmental issue has been identified with respect to the property owned, leased or otherwise used in the<br />
conduct of the <strong>Corporation</strong>’s business, the <strong>Corporation</strong> and its consultants perform environmental assessments on such<br />
property. The <strong>Corporation</strong> expenses the cost of the assessments as incurred. The <strong>Corporation</strong> accrues the cost of<br />
remediation where its obligation is probable and such costs can be reasonably estimated.<br />
The liability includes future costs for remediation and restoration of sites, as well as for ongoing monitoring costs, but<br />
excludes any anticipated recoveries from third parties. Cost estimates are based on information available for each site,<br />
financial viability of other potentially responsible parties, and existing technology, laws and regulations. The <strong>Corporation</strong><br />
believes that it has adequately accrued for its ultimate share of costs at sites subject to joint and several liability. However,<br />
the ultimate liability for remediation is difficult to determine because of the number of potentially responsible parties<br />
involved, site-specific cost sharing arrangements with other potentially responsible parties, the degree of contamination by<br />
various wastes, the scarcity and quality of volumetric data related to many of the sites, and/or the speculative nature of<br />
remediation costs.<br />
Income Taxes – The <strong>Corporation</strong> accounts for income taxes in accordance with Statement of Financial Accounting<br />
Standards No. 109, “Accounting for Income Taxes” (FAS 109). The objectives of accounting for income taxes are to recognize<br />
the amount of taxes payable or refundable for the current year and deferred tax liabilities and assets for the future tax<br />
consequences of events that have been recognized in an entity’s financial statements or tax returns. These expected future<br />
tax consequences are measured based on provisions of tax law as currently enacted; the effects of future changes in tax laws<br />
are not anticipated. Future tax law changes, such as a change in the corporate tax rate, could have a material impact on the<br />
<strong>Corporation</strong>’s financial position or its results of operations.<br />
Pension and Postretirement Benefits – The <strong>Corporation</strong> incurs certain employment-related expenses associated with<br />
pensions and postretirement health benefits. In order to measure the expense associated with these benefits, management<br />
must make various estimates and assumptions, including discount rates used to value liabilities, assumed rates of return on<br />
plan assets, compensation increases, employee turnover rates, anticipated mortality rates and expected future healthcare<br />
costs. The estimates used by management are based on the <strong>Corporation</strong>’s historical experience as well as current facts and<br />
circumstances. The <strong>Corporation</strong> uses third-party actuaries to assist management in properly measuring the expense and<br />
liability associated with these benefits. Actual future results that vary from the previously mentioned assumptions could<br />
have a material impact on the Consolidated Financial Statements.<br />
Recent declines in the equity markets have caused the market value of the plan assets to decrease. As a result, a minimum<br />
pension liability adjustment of $225 million, net of tax, was recorded in the fourth quarter of <strong>2002</strong> as a reduction to<br />
shareholders’ equity (see note 7 to the Consolidated Financial Statements, Item 8). Also, during <strong>2002</strong>, the <strong>Corporation</strong><br />
decreased its assumed long-term rate of return on pension plan assets from 10% to 9%. This assumption change resulted<br />
16
in a $22 million increase to <strong>2002</strong> pension expense. While the interest rate and asset return environment have significantly<br />
impacted the funded status of the <strong>Corporation</strong>’s plans, the <strong>Corporation</strong> does not have any minimum pension funding<br />
requirements, as set forth in employee benefit and tax laws.<br />
Personal Injury and Occupational Illness – The cost of injuries to employees and others related to Railroad activities or in<br />
accidents involving the trucking segment is charged to expense based on actuarial estimates of the ultimate cost and number<br />
of incidents each year. Compensation for Railroad work-related accidents is governed by the Federal Employers’ Liability<br />
Act (FELA). Under FELA, damages are assessed based on a finding of fault through litigation or out-of-court settlements.<br />
The Railroad offers a comprehensive variety of services and rehabilitation programs for employees who are injured at work.<br />
Changes in estimates can vary due to evolving trends in litigation related to personal injury and occupational illness cases<br />
based on large jury awards and public pressures associated with certain occupational related injuries.<br />
<strong>2002</strong> COMPARED TO 2001 RESULTS OF OPERATIONS<br />
Consolidated<br />
Net Income – The <strong>Corporation</strong> reported net income of $1.34 billion ($5.32 per basic share and $5.05 per diluted share) in<br />
<strong>2002</strong> compared to $966 million ($3.90 per basic share and $3.77 per diluted share) in 2001. The increase in net income<br />
resulted from double digit operating income growth, lower interest costs, two large asset sale transactions (one with the Utah<br />
Transit Authority (UTA) for $141 million pre-tax and one with the Santa Clara Valley Transportation Authority (VTA) for<br />
$73 million pre-tax) and tax adjustments of $67 million for prior years’ income tax examinations. Operating income<br />
improved as revenue growth, lower fuel prices and productivity gains offset the effects of wage and benefit inflation and<br />
higher volume-related costs. Productivity is measured by both gross ton miles per inflation-adjusted expense dollar and<br />
gross ton miles per employee.<br />
Operating Revenues – Operating revenues increased $518 million (4%) to a record $12.5 billion in <strong>2002</strong>, reflecting 3%<br />
growth at the Railroad and 17% growth in the trucking segment including the impact of the Motor Cargo acquisition.<br />
Excluding Motor Cargo, revenue growth was 5% in the trucking segment. The <strong>Corporation</strong> recognizes transportation<br />
revenues on a percentage-of-completion basis as freight moves from origin to destination. Other revenue is recognized as<br />
service is performed or contractual obligations are met.<br />
Operating Expenses – Operating expenses increased $266 million (3%) to $10.2 billion in <strong>2002</strong> from $9.9 billion in 2001.<br />
Excluding Motor Cargo in <strong>2002</strong> and 2001, operating expenses increased $144 million (1%). The increase in expenses reflects<br />
wage and benefit inflation, higher equipment rents and depreciation expenses and increased purchased services and other<br />
costs. These increases were partially offset by a 3% reduction in employment levels at the Railroad, lower fuel prices and cost<br />
control efforts. Lower fuel prices for the Railroad of 73 cents per gallon in <strong>2002</strong> versus 88 cents per gallon in 2001, reduced<br />
fuel expense by $198 million in <strong>2002</strong>.<br />
Salaries, wages and employee benefits increased $225 million (5%) compared to 2001. Excluding Motor Cargo, expenses<br />
increased $156 million (4%) compared to 2001 as wage and benefit inflation and volume costs exceeded savings from lower<br />
employment levels and improved productivity. Equipment and other rents expense increased $59 million (5%) as a result<br />
of a 2% increase in carloads, additional locomotive lease expense and higher contract maintenance costs recognized at<br />
Overnite. Depreciation expense increased $32 million (3%) as a result of the Railroad’s capital spending in recent years<br />
which has increased the total value of the <strong>Corporation</strong>’s assets subject to depreciation. Fuel and utilities costs were down<br />
$183 million (14%) compared to 2001 due to lower fuel prices and a lower fuel consumption rate, partially offset by higher<br />
gross ton miles at the Railroad. Materials and supplies expense decreased $7 million (1%) primarily due to reduced<br />
locomotive repairs partly offset by increased freight car repairs. Casualty costs increased $38 million (10%) over 2001 due<br />
to higher personal injury and increased insurance costs. Purchased services and other costs increased $102 million (11%)<br />
primarily due to an increase in outsourcing of locomotive contract maintenance services, as well as an increase in jointly<br />
owned facility expenses and state and local taxes.<br />
Operating Income – Operating income increased $252 million (12%) to a record $2.3 billion in <strong>2002</strong>, as revenue growth,<br />
productivity gains and lower fuel prices more than offset inflation, increased depreciation expense and higher rail costs due<br />
to increased rail volume.<br />
17
Non-Operating Items – Interest expense decreased $68 million (10%) compared to 2001 due to lower weighted-average debt<br />
levels and weighted-average interest rates in <strong>2002</strong>. In <strong>2002</strong>, the <strong>Corporation</strong>’s weighted-average debt level (including the<br />
Convertible Preferred Securities) decreased from $9,980 million in 2001 to $9,525 million in <strong>2002</strong>. The <strong>Corporation</strong>’s<br />
weighted-average interest rate was 6.7% in <strong>2002</strong> as compared to 7.0% in 2001. Other income increased $163 million in <strong>2002</strong><br />
compared to 2001 due primarily to the asset sale transactions with the UTA and VTA. Income tax expense increased $108<br />
million (19%) in <strong>2002</strong> over 2001 as a result of higher pre-tax income levels in <strong>2002</strong> which was partially offset by tax<br />
adjustments for prior years.<br />
Key Measures – Net income as a percentage of operating revenues increased to 10.7% in <strong>2002</strong> from 8.1% in 2001. Return<br />
on average common shareholders’ equity was 13.3% in <strong>2002</strong>, up from 10.6% in 2001. The <strong>Corporation</strong>’s operating margin<br />
was 18.6% in <strong>2002</strong> compared to 17.3% in 2001. The <strong>Corporation</strong>’s operating margin, excluding Overnite for <strong>2002</strong> was 20.2%<br />
compared to 18.6% in 2001.<br />
Rail Segment<br />
Net Income – Rail operations reported net income of $1.37 billion in <strong>2002</strong> compared to $1.06 billion in 2001, up 30%. The<br />
increase in earnings resulted from stronger operating results, the asset sale transactions with the UTA and VTA, lower interest<br />
costs, and a tax adjustment for prior years’ income tax examinations. Higher operating revenue and lower fuel expense<br />
combined with productivity gains and cost control efforts offset inflation and higher volume-related costs.<br />
Operating Revenues – Operating revenue is comprised of commodity revenue and other revenues. Other revenues<br />
primarily include subsidiary revenue from various non-railroad companies that are wholly owned or majority owned by the<br />
Railroad, revenue from the Chicago commuter rail operations and accessorial revenue earned due to customer detainment<br />
of railroad owned or controlled equipment. Rail operating revenues increased $303 million (3%) over 2001 to a record $11.1<br />
billion. Revenue carloads increased 2% primarily driven by growth in the automotive, intermodal and chemicals commodity<br />
groups. Other revenue increased $31 million (8%) due to increased passenger, subsidiary, and accessorial revenues.<br />
The following tables summarize the year-over-year changes in rail commodity revenue, revenue carloads and average<br />
revenue per car by commodity type:<br />
Commodity Revenue in Millions of Dollars <strong>2002</strong> 2001 Change<br />
Agricultural...................................................................................................... $ 1,506 $ 1,454 4%<br />
Automotive ...................................................................................................... 1,209 1,118 8<br />
Chemicals......................................................................................................... 1,575 1,545 2<br />
Energy .............................................................................................................. 2,343 2,399 (2)<br />
Industrial Products.......................................................................................... 2,035 1,970 3<br />
Intermodal ....................................................................................................... 1,995 1,905 5<br />
Total.................................................................................................................. $ 10,663 $ 10,391 3%<br />
Revenue Carloads in Thousands <strong>2002</strong> 2001 Change<br />
Agricultural...................................................................................................... 881 876 1%<br />
Automotive ...................................................................................................... 818 763 7<br />
Chemicals......................................................................................................... 904 879 3<br />
Energy .............................................................................................................. 2,164 2,161 -<br />
Industrial Products.......................................................................................... 1,413 1,405 1<br />
Intermodal ....................................................................................................... 2,951 2,832 4<br />
Total.................................................................................................................. 9,131 8,916 2%<br />
Average Revenue Per Car <strong>2002</strong> 2001 Change<br />
Agricultural...................................................................................................... $ 1,709 $ 1,660 3%<br />
Automotive ...................................................................................................... 1,477 1,465 1<br />
Chemicals......................................................................................................... 1,742 1,756 (1)<br />
Energy .............................................................................................................. 1,083 1,111 (3)<br />
Industrial Products.......................................................................................... 1,440 1,402 3<br />
Intermodal ....................................................................................................... 676 673 -<br />
Total.................................................................................................................. $ 1,168 $ 1,165 -%<br />
18
Agricultural – Revenue increased 4%, due to a 1% increase in carloads coupled with a 3% increase in average revenue per<br />
car. Meals and oils carloads increased due to strong export demand and more shipments to Mexico. Corn shipments to<br />
Mexico also increased. Revenue gains were also achieved through increased shipments of cottonseed, ethanol used as a fuel<br />
additive and frozen french fries. Average revenue per car increased due to a higher average length of haul, resulting from<br />
fewer short-haul empty storage moves and corn processor shipments combined with increased long-haul meals and oils and<br />
animal feed shipments.<br />
Automotive – Revenue increased 8%, as a result of a 7% increase in carloads and a 1% increase in average revenue per car.<br />
Volume growth resulted from market share gains for finished vehicles, where carloads were up 11% despite a decline in U.S.<br />
light vehicle sales. Materials shipments declined 1%, due primarily to reduced production in Mexico. Market share gains<br />
partially offset the decline. Average revenue per car increased due to a shift in mix of carloads shipped, resulting from<br />
increased higher average revenue per car vehicles shipments and a decline in lower average revenue per car materials<br />
shipments. In addition, average length of haul for vehicle shipments increased.<br />
Chemicals – Revenue increased 2%, as a result of a 3% increase in carloads and a 1% decrease in average revenue per car.<br />
Volume increased for liquid and dry chemicals due to relatively higher economic demand from industrial manufacturers.<br />
Plastics shipments rose as a result of increased demand for consumer durables. Revenue also increased due to higher<br />
domestic demand for fertilizer and demand for domestic and export soda ash shipments. Average revenue per car declined<br />
due to changes in customer contract terms.<br />
Energy – Energy commodity revenue decreased 2% as average revenue per car declined 3%. Records were set for total<br />
carloads and coal trains loaded per day in the Southern Powder River Basin in Wyoming. Results were achieved through<br />
favorable weather conditions and improved cycle times. Offsetting the volume increase were reduced West Coast export<br />
shipments originating from the Colorado and Utah mining regions. Average revenue per car declined due to the impact of<br />
contract price negotiations on expiring long-term contracts with certain major customers.<br />
Industrial Products – Revenue increased 3%, due to a slight increase in carloads coupled with a 3% increase in average<br />
revenue per car. Increased lumber shipments were the primary growth driver, due to strong housing construction and<br />
greater production in the <strong>Pacific</strong> Northwest region. Stone shipments increased due to strong building and road construction<br />
activity in the South. Revenue also increased for paper and newsprint commodities due to higher general demand. Reduced<br />
shipments of steel and metallic shipments in the first three quarters partially offset these increases. However, steel shipments<br />
rebounded in the fourth quarter as new U.S. tariffs made domestic producers more price-competitive with foreign<br />
producers. Average revenue per car increased due to price increases and a greater mix of longer average length of haul.<br />
Intermodal – Revenue increased 5%, primarily due to a 4% increase in carloads. Volumes increased due to higher<br />
international shipments, resulting from strong import demand and market share gains in some segments. These gains were<br />
partially offset by the labor dispute between the International Longshoreman and Warehouse <strong>Union</strong> (ILWU) and the <strong>Pacific</strong><br />
Maritime Association, which had a significant impact on intermodal volumes during the fourth quarter, primarily in<br />
October. Revenue declined for domestic shipments, due to soft market demand and the voluntary action of shedding lowmargin<br />
trailer business in favor of higher-margin containers. The slight increase in average revenue per car was the result of<br />
price increases, offset by the mix impact of more lower revenue per car international shipments.<br />
Mexico Business – In <strong>2002</strong> and 2001, respectively, UPRR generated $873 million and $860 million of revenues from rail traffic<br />
with businesses located in Mexico, which is included in the rail commodity revenue reported above. Shipments increased<br />
for agricultural products, chemicals, and industrial products commodity groups. Increased revenue for agricultural<br />
products resulted from higher corn and meal exports as well as increased beer imports. Increased chemicals business<br />
consisted of plastics exports, in addition to higher imports and exports of liquid and dry chemicals. The increase in<br />
industrial products resulted from higher imports and exports of steel and scrap and exports of pulp and paper products.<br />
Reduced automobile production partially offset these gains resulting in fewer shipments of parts and finished vehicles.<br />
Operating Expenses – Operating expenses increased $51 million (1%) to $8.8 billion in <strong>2002</strong>. The increase in expense is<br />
primarily due to inflation, increased volume-related costs, contract services, casualty and depreciation expense, partially<br />
offset by savings from lower employee force levels, cost control efforts and significantly lower fuel prices.<br />
19
Salaries, Wages and Employee Benefits – Salaries, wages and employee benefits increased $76 million (2%) in <strong>2002</strong> to $3.6<br />
billion. Increases were driven by inflation and volume-related costs related to a 4% increase in gross ton miles. A 3%<br />
reduction in employee force levels in conjunction with worker productivity improvements partially offset the inflation and<br />
higher volume-related costs.<br />
Equipment and Other Rents – Equipment and other rents primarily includes rental expense the Railroad pays for freight cars<br />
owned by other railroads or private companies; freight car, intermodal and locomotive leases; other specialty equipped<br />
vehicle leases; and office and other rentals. Expenses increased $24 million (2%) compared to 2001 due primarily to higher<br />
locomotive leases and volume-related costs, partially offset by savings from lower car cycle times (the average number of<br />
accumulated days per load or cycle that loaded and empty cars from other railroads spend on UPRR’s system) and rental<br />
prices for private cars. The higher locomotive lease expense is due to the Railroad’s increased leasing of new, more reliable<br />
and fuel efficient locomotives. These new locomotives replaced older, non-leased models in the fleet, which helped reduce<br />
expenses for depreciation, labor, materials and fuel during the year. The increase in volume costs is primarily due to<br />
increased shipments of finished autos that almost exclusively utilize rented freight cars. The reduction in car cycle times is<br />
attributable to increased volume demand and better car utilization.<br />
Depreciation – The majority of depreciation relates to track structure, including rail, ties and other track material.<br />
Depreciation expense increased $19 million (2%) over 2001 as a result of higher capital spending in recent years. Capital<br />
spending totaled $1.8 billion in <strong>2002</strong> and $1.7 billion in 2001.<br />
Fuel and Utilities – Fuel and utilities is comprised of locomotive fuel, utilities other than telephone, and gasoline and other<br />
fuels. Expenses declined $184 million (15%) in <strong>2002</strong>. The decrease was driven by lower fuel prices and a record low fuel<br />
consumption rate, as measured by gallons consumed per thousand gross ton miles. Fuel prices averaged 73 cents per gallon<br />
in <strong>2002</strong> compared to 88 cents per gallon in 2001 (including taxes, transportation costs and regional pricing spreads). The<br />
Railroad hedged approximately 42% of its fuel consumption for the year, which decreased fuel costs by $55 million. As of<br />
December 31, <strong>2002</strong>, expected fuel consumption for 2003 is 7% hedged at 58 cents per gallon excluding taxes, transportation<br />
costs and regional pricing spreads (see note 2 to the Consolidated Financial Statements, Item 8).<br />
Materials and Supplies – Materials used for the maintenance of the Railroad’s track, facilities and equipment is the principal<br />
component of materials and supplies expense. Office, small tools and other supplies and the costs of freight services<br />
purchased to ship company materials are also included. Expenses decreased $9 million (2%), primarily reflecting a reduction<br />
in the number of locomotives overhauled. Materials expense for locomotive overhauls decreased due to the use of new,<br />
more-reliable locomotives during the past several years, the sale of older units, which required higher maintenance, and<br />
increased outsourcing of locomotive maintenance. Partially offsetting the reductions in locomotive overhauls was an<br />
increase in cost for freight car repairs.<br />
Casualty Costs – The largest component of casualty costs is personal injury expense. Freight and property damage, insurance,<br />
environmental matters and occupational illness expense are also included in casualty costs. Costs increased $32 million (10%)<br />
compared to 2001, as higher personal injury and insurance costs were partially offset by lower costs for freight damage.<br />
Purchased Services and Other Costs – Purchased services and other costs include the costs of services purchased from outside<br />
contractors, state and local taxes, net costs of operating facilities jointly used by UPRR and other railroads, transportation<br />
and lodging for train crew employees, trucking and contracting costs for intermodal containers, leased automobile<br />
maintenance expenses, telephone and cellular expense, employee travel expense and computer and other general expenses.<br />
Expenses increased $93 million (11%) compared to 2001 primarily due to increased spending for contract services, jointly<br />
operated facilities and state and local taxes.<br />
Operating Income – Operating income increased $252 million (12%) to a record $2.3 billion in <strong>2002</strong>. The operating margin<br />
for <strong>2002</strong> was 21.0%, compared to 19.3% in 2001.<br />
Non-Operating Items – Interest expense decreased $43 million (7%) as a result of lower average debt levels and lower<br />
weighted-average interest rates in <strong>2002</strong>. Other income increased $147 million (84%) due to the sale transactions with the<br />
UTA and VTA. Income taxes increased $126 million (21%) in <strong>2002</strong> compared to 2001 resulting from higher pre-tax income<br />
levels in <strong>2002</strong> partially offset by a tax adjustment for prior years’ income tax examinations.<br />
20
Trucking Segment<br />
Operating Revenues – In <strong>2002</strong>, trucking revenues rose $189 million (17%) to $1.33 billion. Excluding Motor Cargo in <strong>2002</strong><br />
and 2001, revenue increased $57 million (5%) due to an increase in volume of 5%, yield improvements, and higher revenue<br />
for special services, partially offset by lower fuel surcharge revenue as a result of lower fuel prices in <strong>2002</strong>. Included in the<br />
volume improvement was additional business realized as a result of the forced closure of Consolidated Freightways in<br />
September <strong>2002</strong>.<br />
Operating Expenses – Trucking operating expenses rose $172 million (16%) to $1.26 billion in <strong>2002</strong>. Excluding Motor<br />
Cargo in <strong>2002</strong> and 2001, expenses increased $50 million (5%). Salaries, wages and employee benefits increased $117 million<br />
(17%). Excluding Motor Cargo in <strong>2002</strong> and 2001, expenses increased $48 million (7%) due to wage and benefit inflation<br />
and increased volume costs partially offset by productivity improvements and a 2% reduction in the number of employees.<br />
Productivity is measured as total costs related to local, dock, and linehaul operations relative to the total volume shipped.<br />
Equipment and other rents increased $33 million (35%). Excluding Motor Cargo in <strong>2002</strong> and 2001, expenses increased $18<br />
million (20%) due primarily to the increased use of linehaul rail and contract transportation to handle the additional<br />
business of the former Consolidated Freightways. Depreciation expense increased $11 million (23%) compared to 2001.<br />
Excluding Motor Cargo in <strong>2002</strong> and 2001, expense increased $2 million (5%) due to purchases of new equipment. Fuel and<br />
utilities costs increased $1 million (1%). Excluding Motor Cargo in <strong>2002</strong> and 2001, expenses decreased $7 million (11%) as<br />
a result of lower fuel prices during the year (74 cents per gallon average in <strong>2002</strong> compared to 82 cents per gallon average in<br />
2001, including transportation costs but excluding taxes), and by a 3% decrease in gallons consumed. For the year ended<br />
December 31, <strong>2002</strong>, Overnite hedged approximately 14% of its fuel consumed for <strong>2002</strong>, which decreased fuel prices by $1.2<br />
million. As of December 31, <strong>2002</strong>, expected fuel consumption for 2003 is 5% hedged at 58 cents per gallon excluding taxes,<br />
transportation costs and regional pricing spreads. Materials and supplies expense increased $4 million (8%) compared to<br />
2001. Excluding Motor Cargo in <strong>2002</strong> and 2001, expenses decreased $2 million (4%) due to lower maintenance and<br />
operating supplies expense as a result of cost control measures. Casualty costs increased $8 million (17%). Excluding Motor<br />
Cargo in <strong>2002</strong> and 2001, expenses increased $6 million (12%) due to higher personal injury and insurance expenses.<br />
Purchased services and other costs decreased $2 million (2%). Excluding Motor Cargo in <strong>2002</strong> and 2001, expenses decreased<br />
$15 million (16%) due to lower general supplies expense, a favorable legal settlement in the second quarter, insourcing of<br />
contract programmers, and other cost control measures.<br />
Operating Income – Trucking operations generated operating income of $71 million in <strong>2002</strong>, an increase of $17 million over<br />
2001. Excluding Motor Cargo in <strong>2002</strong> and 2001, operating income increased $8 million (14%). The operating margin was<br />
5.3% compared to 4.7% in 2001. Motor Cargo improved the operating margin by 0.2 percentage points in <strong>2002</strong>.<br />
Other Product Lines<br />
Other – Operating losses increased $17 million in <strong>2002</strong> compared to 2001. Operating revenues increased $26 million year<br />
over year resulting from operations of a new logistics subsidiary created in the latter part of 2001 and increased external<br />
revenues from two technology subsidiaries. Operating expenses increased $43 million primarily due to increased incentive<br />
compensation expense, pension and retiree benefit costs in <strong>2002</strong>, as well as asset write-offs at two technology subsidiaries.<br />
2001 COMPARED TO 2000 RESULTS OF OPERATIONS<br />
Consolidated<br />
Net Income – The <strong>Corporation</strong> reported net income of $966 million ($3.90 per basic share and $3.77 per diluted share) in<br />
2001 compared to $842 million ($3.42 per basic share and $3.34 per diluted share) in 2000. Excluding the effect of a $115<br />
million pre-tax ($72 million after-tax) charge in 2000 related to a work force reduction plan at the Railroad, 2000 net income<br />
was $914 million ($3.71 per basic share and $3.61 per diluted share). The increase in net income excluding the work force<br />
reduction charge in 2000 was due primarily to revenue growth, productivity gains and cost control, lower non-operating<br />
expense and lower fuel prices.<br />
Operating Revenues – Operating revenues increased $95 million (1%) to $12.0 billion in 2001, reflecting 1% growth at the<br />
Railroad and 3% growth in the trucking segment. The <strong>Corporation</strong> recognizes transportation revenues on a percentage-ofcompletion<br />
basis as freight moves from origin to destination. Other revenue is recognized as service is performed or<br />
contractual obligations are met.<br />
21
Operating Expenses – Operating expenses decreased $74 million (1%) to $9.9 billion in 2001 from $10.0 billion in 2000.<br />
Excluding the effect of the work force reduction charge in 2000, operating expenses increased $41 million compared to 2000<br />
reflecting wage and benefit inflation and higher equipment rents and depreciation expenses. These increases were partially<br />
offset by a 4% reduction in employment levels at the Railroad, lower fuel prices and cost control efforts. Lower fuel prices<br />
in 2001 versus 2000 reduced fuel expense by $35 million in 2001.<br />
Salaries, wages and employee benefits decreased $35 million compared to 2000. Excluding the work force reduction<br />
charge, salaries, wages and employee benefits increased $80 million (2%), as wage and benefit inflation and volume costs<br />
exceeded savings from lower employment levels and improved productivity. Equipment and other rents expense increased<br />
$26 million (2%) as a result of additional locomotive lease expense and longer car cycle times, which indicates that cars spent<br />
more time on the rail system between shipments. Partially offsetting these increases were lower costs due to declines in rail<br />
traffic requiring rental of freight cars. In addition, the Railroad experienced lower rental rates, and Overnite experienced<br />
lower contract transportation costs. Depreciation expense increased $34 million (3%) as a result of the Railroad’s capital<br />
spending in recent years which increased the total value of the <strong>Corporation</strong>’s assets subject to depreciation (see note 1 to the<br />
Consolidated Financial Statements, Item 8). Fuel and utilities costs were down $34 million (3%) compared to 2000 due to<br />
lower fuel prices and a lower fuel consumption rate, partially offset by higher gross ton miles at the Railroad and losses on<br />
fuel hedging activity (see note 2 to the Consolidated Financial Statements, Item 8). Materials and supplies expense decreased<br />
$56 million (9%) primarily due to reduced locomotive repairs and cost control actions. Casualty costs increased $16 million<br />
(4%) over 2000 due to higher insurance, bad debts and environmental expenses. Other costs decreased $25 million (3%) as<br />
productivity and cost control efforts more than offset higher state and local taxes.<br />
Operating Income – Operating income increased $169 million (9%) to $2.1 billion in 2001. Excluding the effect of the $115<br />
million work force reduction charge in 2000, 2001 operating income increased $54 million (3%) as revenue growth,<br />
productivity gains and lower fuel prices more than offset inflation, increased depreciation expense and higher rail costs due<br />
to increased rail volume.<br />
Non-Operating Items – Interest expense decreased $22 million (3%) compared to 2000 due to lower weighted-average debt<br />
levels and weighted-average interest rates in 2001. In 2001, the <strong>Corporation</strong>’s weighted-average debt level decreased from<br />
$10,044 million in 2000 to $9,980 million in 2001. The <strong>Corporation</strong>’s weighted-average interest rate was 7.0% in 2001 as<br />
compared to 7.2% in 2000. Other income increased $32 million (25%) in 2001 compared to 2000 due primarily to higher<br />
real estate sales. Income tax expense increased $99 million (21%) in 2001 over 2000. Excluding the effect of the $115 million<br />
work force reduction charge on income tax expense in 2000, income taxes for 2001 increased $56 million (11%) over 2000.<br />
The increase was a result of higher pre-tax income levels in 2001 and an increase in the effective tax rate from 35.7% in 2000<br />
to 37.0% in 2001.<br />
Key Measures – Net income as a percentage of operating revenues increased to 8.1% in 2001 from 7.1% in 2000. Net income<br />
as a percentage of operating revenues in 2000, excluding the work force reduction charge, was 7.7%. Return on average<br />
common shareholders’ equity was 10.6% in 2001, up from 10.1% in 2000. Excluding the charge in 2000, return on average<br />
common shareholders’ equity was 10.9% in 2000. The <strong>Corporation</strong>’s operating margin was 17.3% in 2001 compared to 16.0%<br />
in 2000 and, excluding the work force reduction charge in 2000, 17.0%. Excluding Overnite, the <strong>Corporation</strong>’s operating<br />
margin was 18.6% in 2001 compared to 17.2% in 2000 and, excluding the work force reduction charge in 2000, 18.3%.<br />
Rail Segment<br />
Net Income – Rail operations reported net income of $1.1 billion in 2001 compared to net income of $926 million in 2000,<br />
up 14%. Excluding the work force reduction charge in 2000, net income was $998 million. The increase in earnings resulted<br />
from higher commodity revenue and real estate sales combined with lower fuel expense, interest expense and materials and<br />
supplies expense. These improvements were partially offset by inflation, lower other revenue and higher equipment rent and<br />
depreciation expenses.<br />
22
Operating Revenues – Rail operating revenues increased $69 million (1%) over 2000 to $10.8 billion. Revenue carloads were<br />
flat with an increase in the energy and agricultural commodity groups offset by decreases in the other four commodity<br />
groups. The decrease in other revenue was the result of lower switching, subsidiary and accessorial revenues.<br />
The following tables summarize the year-over-year changes in rail commodity revenue, revenue carloads and average<br />
revenue per car by commodity type:<br />
Commodity Revenue in Millions of Dollars 2001 2000 Change<br />
Agricultural...................................................................................................... $ 1,454 $ 1,400 4%<br />
Automotive ...................................................................................................... 1,118 1,182 (5)<br />
Chemicals......................................................................................................... 1,545 1,640 (6)<br />
Energy .............................................................................................................. 2,399 2,154 11<br />
Industrial Products.......................................................................................... 1,970 1,985 (1)<br />
Intermodal ....................................................................................................... 1,905 1,909 -<br />
Total.................................................................................................................. $ 10,391 $ 10,270 1%<br />
Revenue Carloads in Thousands 2001 2000 Change<br />
Agricultural...................................................................................................... 876 873 -%<br />
Automotive ...................................................................................................... 763 815 (6)<br />
Chemicals......................................................................................................... 879 936 (6)<br />
Energy .............................................................................................................. 2,161 1,930 12<br />
Industrial Products.......................................................................................... 1,405 1,431 (2)<br />
Intermodal ....................................................................................................... 2,832 2,916 (3)<br />
Total.................................................................................................................. 8,916 8,901 -%<br />
Average Revenue Per Car 2001 2000 Change<br />
Agricultural...................................................................................................... $ 1,660 $ 1,604 3%<br />
Automotive ...................................................................................................... 1,465 1,450 1<br />
Chemicals......................................................................................................... 1,756 1,752 -<br />
Energy .............................................................................................................. 1,111 1,116 -<br />
Industrial Products.......................................................................................... 1,402 1,387 1<br />
Intermodal ....................................................................................................... 673 655 3<br />
Total.................................................................................................................. $ 1,165 $ 1,154 1%<br />
Agricultural – Revenue increased 4%, due primarily to a 3% increase in average revenue per car. Carloads were flat, as higher<br />
corn shipments and meals and oils exports were offset by a decrease in demand for domestic and export wheat shipments<br />
and a poor sugar-beet harvest. Revenue gains were also achieved through increased beer imports from Mexico, wine<br />
shipments from California to eastern markets, express service of fresh and frozen products and increased demand for<br />
cottonseed. Average revenue per car increased due to a longer average length of haul, resulting from fewer short-haul wheat<br />
and sweetener shipments combined with increased long-haul domestic and Mexico corn shipments.<br />
Automotive – Revenue declined 5% as a result of a 6% decrease in carloads and a 1% increase in average revenue per car.<br />
Materials volumes declined 16%, as the soft economy and a decline in vehicle sales led to high inventories, low industry<br />
production and auto plant shutdowns. Total finished vehicle shipments declined only 1%, as industry weakness was<br />
mitigated by market share gains. Consumer incentives in the fourth quarter stimulated vehicle sales and helped offset<br />
weakness early in the year. Average revenue per car increased due to a shift in mix of materials shipped, resulting from fewer<br />
shipments of materials with lower average revenue per car. Additionally, more materials were shipped in boxcars rather than<br />
containers, which yield higher average revenue per car than containers.<br />
Chemicals – Revenue declined 6%, due to a 6% decrease in carloads. Volume declines were the result of the soft economy,<br />
as reduced demand for consumer durables led to high manufacturer inventories and weak demand for plastics. Reduced<br />
industrial manufacturing also depressed demand for liquid and dry chemicals. Fertilizer and phosphate rock revenues<br />
decreased as high energy costs early in the year reduced the market for these commodities. Average revenue per car was flat,<br />
as the positive impact of fewer low average revenue per car phosphate rock shipments was offset by a decrease in average<br />
revenue per car for soda ash shipments.<br />
23
Energy – Energy commodity revenue increased 11% compared to 2000, due to a 12% increase in carloads. Records were set<br />
in 2001 for total carloads, revenue and coal trains loaded per day in the Southern Powder River Basin in Wyoming and in<br />
the coal mining regions of Colorado and Utah. These increases were driven by strong utility demand caused by severe winter<br />
weather in late 2000 and the first quarter of 2001. In the first half of the year, demand for coal also increased due to the high<br />
cost of alternative fuels, such as natural gas, fuel oil and higher-priced eastern-sourced coal. Carloads also increased due to<br />
gains in market share.<br />
Industrial Products – Revenue decreased 1%, as a 2% decline in carloads was partially offset by a 1% increase in average<br />
revenue per car. The decline was mainly the result of the economic slowdown, which had a negative effect on many<br />
economically sensitive commodities including steel and paper markets. Steel producers were additionally impacted by high<br />
levels of low-cost imported steel, which forced plant shutdowns and bankruptcies. Newsprint and fiber revenue declined<br />
due to lack of demand for printed advertising. Partially offsetting these declines were increases in construction-related<br />
commodities, led by stone and cement, as strong building and road construction activity continued in the South and<br />
Southwestern regions of the country. Lumber volumes increased due to strong housing construction and uncertainty<br />
surrounding restrictions on Canadian lumber imports. Average revenue per car increased due to price increases and a<br />
greater mix of longer average length of haul business. These gains were partially offset by the impact of increased shipments<br />
of stone, which generates lower average revenue per car.<br />
Intermodal – Revenue was flat, as a 3% decline in carloads was offset by a 3% increase in average revenue per car. The volume<br />
decrease was primarily the result of soft economic demand for domestic shipments. In addition, the voluntary action of<br />
shedding low-margin trailer business in favor of higher-margin containers contributed to the decline. Partially offsetting the<br />
domestic declines were increases in international shipments, the result of higher import demand. The increase in average<br />
revenue per car was primarily the result of price increases.<br />
Operating Expenses – Operating expenses decreased $109 million (1%) to $8.7 billion in 2001. Excluding the $115 million<br />
work force reduction charge in 2000, operating expenses were essentially flat. Higher expenses as a result of inflation, higher<br />
equipment rents expense and depreciation were offset by savings from lower force levels, productivity gains and cost control<br />
efforts and lower fuel prices.<br />
Salaries, Wages and Employee Benefits – Salaries, wages and employee benefits decreased $83 million (2%) in 2001 to $3.5<br />
billion. Excluding the $115 million work force reduction charge in 2000, salaries, wages and employee benefits expense<br />
increased $32 million (1%). The primary driver of the increase was wage and employee benefits inflation. A 3% gross ton<br />
mile increase also added volume costs. A 4% reduction in employee force levels as a result of the work force reduction plan<br />
offset a significant portion of these higher costs.<br />
Equipment and Other Rents – Expenses increased $32 million (3%) compared to 2000 due primarily to higher locomotive<br />
lease expense and longer car cycle times. The higher locomotive lease expense is due to the Railroad’s increased leasing of<br />
new, more reliable and fuel efficient locomotives. These new locomotives replaced older, non-leased models in the fleet,<br />
which helped reduce expenses for depreciation, labor, materials and fuel during the year. The increase in car cycle times is<br />
partially attributable to a decline in automotive shipments earlier in the year, which resulted in excess freight cars being<br />
stored at assembly plants and unloading facilities. Partially offsetting the increases in expenses were lower volume costs,<br />
lower car leases and lower prices for equipment. The decrease in volume costs was attributable to a decline in carloads in<br />
commodity groups such as industrial products and intermodal that utilize a high percentage of rented freight cars.<br />
Depreciation – Depreciation expense increased $31 million (3%) over 2000, resulting from capital spending in recent years.<br />
Capital spending totaled $1.7 billion in 2001 and in 2000 and $1.8 billion in 1999.<br />
Fuel and Utilities – Expenses decreased $30 million (2%). The decrease was driven by lower fuel prices and a record low fuel<br />
consumption rate, as measured by gallons consumed per thousand gross ton miles. Fuel prices averaged 88 cents per gallon<br />
in 2001 compared to 90 cents per gallon in 2000, including taxes, transportation costs and regional pricing spreads of 17<br />
cents and 13 cents in 2001 and 2000, respectively. The Railroad hedged approximately 32% of its fuel consumption for the<br />
year, which increased fuel costs by $20 million. As of December 31, 2001, expected fuel consumption for <strong>2002</strong> is 44% hedged<br />
at 56 cents per gallon excluding taxes, transportation costs and regional pricing spreads and for 2003 is 5% hedged at 56 cents<br />
per gallon excluding taxes, transportation costs and regional pricing spreads (see note 2 to the Consolidated Financial<br />
Statements, Item 8).<br />
24
Materials and Supplies – Expenses decreased $71 million (13%), reflecting locomotive overhaul reductions and productivity<br />
improvements and cost control measures. Locomotive overhauls decreased due to acquisition of new, more-reliable<br />
locomotives during the year and the sale of older units, which required higher maintenance. Materials and supplies expenses<br />
related to car maintenance also declined due to lower business levels in the industrial products and automotive commodity<br />
groups. The cars utilized in these commodity groups normally require more maintenance than the cars utilized within the<br />
other commodity groups.<br />
Casualty Costs – Costs increased $9 million (3%) compared to 2000, as higher insurance, bad debt and environmental<br />
expenses were partially offset by lower personal injury costs and lower costs for damaged freight cars.<br />
Other Costs – Expenses increased $3 million (flat) compared to 2000 primarily due to higher state and local taxes.<br />
Operating Income – Operating income increased $178 million (9%) to $2.1 billion. Excluding the $115 million work force<br />
reduction charge in 2000, operating income increased $63 million (3%) in 2001. The operating margin for 2001 was 19.3%,<br />
compared to 17.7% in 2000. Excluding the work force reduction charge, the operating margin for 2000 was 18.8%.<br />
Non-Operating Items – Non-operating expense decreased $56 million (12%) compared to 2000. Real estate sales and net<br />
other income increased $48 million (38%). Interest expense decreased $8 million (1%) as a result of lower weighted-average<br />
debt levels in 2001. Income taxes increased $102 million (20%) in 2001 compared to 2000. Excluding the work force<br />
reduction charge in 2000, income tax expense increased $59 million (11%). The increase was a result of higher pre-tax<br />
income levels in 2001 and an increase in the effective tax rate from 35.6% in 2000 to 36.7% in 2001.<br />
Trucking Segment<br />
Operating Revenues – In 2001, trucking revenues rose $30 million (3%) to $1,143 million. The growth resulted from rate<br />
increases, new services and $10 million in incremental revenue due to the acquisition of Motor Cargo. Tonnage for the year<br />
was flat compared to 2000.<br />
Operating Expenses – Trucking operating expenses rose $29 million (3%) to $1,089 million in 2001. Salaries, wages and<br />
employee benefits increased $40 million (6%) due to a 4% increase in employees as well as wage and benefit inflation and<br />
enhancements. Fuel and utilities costs decreased $5 million (7%), as a result of lower fuel prices during the year (82 cents<br />
per gallon average in 2001 compared to 90 cents per gallon average in 2000, including transportation costs and regional<br />
pricing spreads, and excluding taxes), partially offset by a 1% increase in gallons consumed. Overnite did not hedge any fuel<br />
volume for the year ended December 31, 2001. However, as of December 31, 2001, Overnite had hedged approximately 16%<br />
of its expected fuel consumption for <strong>2002</strong> at an average of 58 cents per gallon, excluding taxes, transportation costs and<br />
regional pricing spreads and had hedged approximately 5% of its expected fuel consumption for 2003 at an average of 58<br />
cents per gallon excluding taxes, transportation costs and regional pricing spreads. Equipment and other rents decreased $4<br />
million (4%) due to decreased use of contract transportation during the year. High utilization of contract transportation in<br />
2000 was necessary due to the Teamsters related work stoppage. Casualty costs increased $7 million (18%) due to higher<br />
bad debt, insurance and cargo loss and damage expenses. Other costs decreased $11 million (10%) due to lower expenses<br />
related to decreased security (related to Teamsters’ matters), legal and employee travel expenses in 2001.<br />
Operating Income – Trucking operations generated operating income of $54 million in 2001, compared to $53 million for<br />
2000. The operating ratio increased to 95.3%, compared to 95.2% in 2000.<br />
Other Product Lines<br />
Other – Operating losses increased $10 million in 2001 compared to 2000. Operating revenues declined $4 million year over<br />
year. Operating expenses increased $6 million due to increased spending at the technology companies to develop new<br />
products and services.<br />
LIQUIDITY AND CAPITAL RESOURCES<br />
As of December 31, <strong>2002</strong>, the <strong>Corporation</strong>’s principal sources of liquidity included cash, cash equivalents, the sale of<br />
receivables, and revolving credit facilities, as well as issuance of commercial paper and other sources of financing through<br />
the capital markets. The <strong>Corporation</strong> had $1.875 billion of credit facilities available, of which there were no borrowings<br />
25
outstanding as of December 31, <strong>2002</strong>. The sale of receivables program is subject to certain requirements including the<br />
maintenance of an investment grade bond rating. If the <strong>Corporation</strong>’s bond rating were to deteriorate, it could have an<br />
adverse impact on the liquidity of the <strong>Corporation</strong>. Receivables sold as of December 31, <strong>2002</strong> were $600 million. Access to<br />
commercial paper is dependent on market conditions. Deterioration of the <strong>Corporation</strong>’s operating results or financial<br />
condition due to internal or external factors could negatively impact the <strong>Corporation</strong>’s ability to utilize commercial paper as<br />
a source of liquidity. Liquidity through the capital markets is also dependent on the financial stability of the <strong>Corporation</strong>.<br />
Financial Condition<br />
Cash from operations was $2.3 billion, $2.0 billion and $2.1 billion in <strong>2002</strong>, 2001 and 2000, respectively. The increase from<br />
2001 to <strong>2002</strong> is the result of higher net income, partially offset by pension plan funding. The decrease from 2000 to 2001 was<br />
primarily due to the timing of large cash payments, including the payments for the work force reduction plan in 2001.<br />
Cash used in investing activities was $1.5 billion in <strong>2002</strong> and in 2001 and $1.6 billion in 2000. The amount remained<br />
essentially flat from 2001 to <strong>2002</strong> as higher real estate sales, a warranty refund from a vendor and a dividend from an affiliate<br />
in <strong>2002</strong> were offset by higher capital spending. The decrease from 2000 to 2001 was due to reduced capital spending and<br />
higher asset sales in 2001, partially offset by the receipt of cash dividends in 2000.<br />
The following table details capital expenditures for the years ended December 31, <strong>2002</strong>, 2001 and 2000:<br />
Capital Expenditures<br />
Millions <strong>2002</strong> 2001 2000<br />
Track................................................................................................................. $1,200 $1,125 $1,066<br />
Locomotives..................................................................................................... 187 176 250<br />
Freight cars ...................................................................................................... 11 27 55<br />
Facilities and other .......................................................................................... 489 408 412<br />
Total.................................................................................................................. $1,887 $1,736 $1,783<br />
Cash used in financing activities was $473 million, $440 million and $486 million in <strong>2002</strong>, 2001 and 2000, respectively.<br />
The increase from 2001 to <strong>2002</strong> reflects lower financings ($775 million in <strong>2002</strong> versus $925 million in 2001), partly offset by<br />
an increase in the proceeds from the exercise of stock options ($150 million in <strong>2002</strong> versus $52 million in 2001). The decrease<br />
from 2000 to 2001 reflects higher financings in 2001 ($925 million in 2001 versus $506 million in 2000) and an increase in<br />
stock option proceeds ($52 million in 2001 versus $3 million in 2000), partially offset by higher debt repayments ($1.2 billion<br />
in 2001 versus $796 million in 2000).<br />
Including the convertible preferred securities (see note 5 to the Consolidated Financial Statements, Item 8) as an equity<br />
instrument, the ratio of debt to total capital employed was 38.8%, 42.2% and 45.1% at December 31, <strong>2002</strong>, 2001 and 2000,<br />
respectively.<br />
For the years ended December 31, <strong>2002</strong>, 2001, and 2000, the <strong>Corporation</strong>’s ratio of earnings to fixed charges was 3.9, 3.0<br />
and 2.5, respectively. The ratio of earnings to fixed charges has been computed on a consolidated basis. Earnings represent<br />
net income less equity in undistributed earnings of unconsolidated affiliates, plus fixed charges and income taxes. Fixed<br />
charges represent interest charges, amortization of debt discount, and the estimated amount representing the interest<br />
portion of rental charges.<br />
Contractual Obligations and Commercial Commitments<br />
As described in the notes to the Consolidated Financial Statements, Item 8, as referenced in the tables below, the <strong>Corporation</strong><br />
has contractual obligations and commercial commitments that may affect the financial condition of the <strong>Corporation</strong>.<br />
However, based on management’s assessment of the underlying provisions and circumstances of the material contractual<br />
obligations and commercial commitments of the <strong>Corporation</strong>, including material sources of off-balance sheet and<br />
structured finance arrangements, there is no known trend, demand, commitment, event or uncertainty that is reasonably<br />
likely to occur which would have a material adverse effect on the <strong>Corporation</strong>’s consolidated results of operations, financial<br />
condition or liquidity. In addition, the commercial obligations, financings and commitments made by the <strong>Corporation</strong> are<br />
customary transactions which are similar to those of other comparable industrial corporations, particularly within the<br />
transportation industry.<br />
26
The following tables identify material obligations and commitments as of December 31, <strong>2002</strong>:<br />
Payments Due by Period<br />
Contractual Obligations Less Than After<br />
Millions of Dollars Total 1 Year 2-3 Years 4-5 Years 5 Years<br />
Debt (note 5)[a] ............................................ $ 6,194 $ 169 $ 1,144 $ 1,259 $ 3,622<br />
Operating leases (note 6).............................. 3,301 444 761 577 1,519<br />
Capital lease obligations (note 6)................. 2,446 210 407 360 1,469<br />
Unconditional purchase obligations<br />
(note 10)[b].............................................. 404 224 180 - -<br />
Total contractual obligations ........................ $12,345 $1,047 $ 2,492 $ 2,196 $ 6,610<br />
[a]<br />
[b]<br />
Excludes capital lease obligations of $1,458 million and market value adjustments for debt with qualifying hedges that are recorded as<br />
assets on the Consolidated Statements of Financial Position.<br />
Unconditional purchase obligations represent multi-year contractual commitments to purchase assets at fixed prices and fixed volumes.<br />
These commitments are made in order to take advantage of pricing opportunities and to insure availability of assets to meet quality and<br />
operational requirements. Excluded are annual contracts made in the normal course of business for performance of routine services, as<br />
well as commitments where contract provisions allow for cancellation.<br />
Amount of Commitment Expiration<br />
Per Period<br />
Total<br />
Other Commercial Commitments Amounts Less Than After<br />
Millions of Dollars Committed 1 Year 2-3 Years 4-5 Years 5 Years<br />
Credit facilities (note 5)................................ $ 1,875 $ 875 $ 1,000 $ - $ -<br />
Convertible preferred securities (note 5)..... 1,500 - - - 1,500<br />
Sale of receivables (note 2) ........................... 600 600 - - -<br />
Guarantees (note 10)[a]................................ 368 14 22 13 319<br />
Standby letters of credit (note 10) ............... 76 69 7 - -<br />
Total commercial commitments .................. $ 4,419 $ 1,558 $ 1,029 $ 13 $ 1,819<br />
[a]<br />
Includes guaranteed obligations of affiliated operations.<br />
Financing Activities<br />
Credit Facilities – The <strong>Corporation</strong> had no commercial paper borrowings outstanding as of December 31, <strong>2002</strong>.<br />
Commercial paper is issued from time to time for working capital needs and is supported by $1.875 billion in credit facilities,<br />
of which $875 million expires in March 2003, with the remaining $1.0 billion expiring in 2005. The credit facility for $875<br />
million includes $825 million that was entered into during March <strong>2002</strong> and $50 million entered into during June <strong>2002</strong>. The<br />
$1.0 billion credit facility was entered into during March 2000. The <strong>Corporation</strong> has the option to hold higher cash balances<br />
in addition to or in replacement of the credit facilities to support commercial paper. These credit facilities also allow for<br />
borrowings at floating (LIBOR-based) rates, plus a spread, depending upon the <strong>Corporation</strong>’s senior unsecured debt ratings.<br />
The credit facilities are designated for general corporate purposes, and none of the credit facilities were used as of December<br />
31, <strong>2002</strong>. Commitment fees and interest rates payable under the facilities are similar to fees and rates available to comparably<br />
rated investment-grade borrowers. The <strong>Corporation</strong> is reviewing rollover options for the credit facility that expires in March<br />
2003.<br />
Shelf Registration Statement – During January <strong>2002</strong>, under an existing shelf registration statement, the <strong>Corporation</strong> issued<br />
$300 million of 6-1/8% fixed rate debt with a maturity of January 15, 2012. The proceeds from the issuance were used for<br />
repayment of debt and other general corporate purposes. In April <strong>2002</strong>, the <strong>Corporation</strong> called its $150 million, 8-5/8%<br />
debentures due May 15, 2022 for redemption in May <strong>2002</strong>. The <strong>Corporation</strong> issued $350 million of 6-1/2% fixed rate debt<br />
with a maturity of April 15, 2012, in order to fund the redemption. The <strong>Corporation</strong> used the remaining proceeds to repay<br />
other debt and for other general corporate purposes. On May 17, <strong>2002</strong>, the <strong>Corporation</strong> issued the remaining $50 million<br />
of debt under the existing shelf registration statement. The debt carries a fixed rate of 5-3/4% with a maturity of October<br />
15, 2007. The proceeds from the issuance were used for repayment of debt and other general corporate purposes.<br />
27
The <strong>Corporation</strong> filed a $1.0 billion shelf registration statement, which became effective in July <strong>2002</strong>. Under the shelf<br />
registration statement, the <strong>Corporation</strong> may issue, from time to time, any combination of debt securities, preferred stock,<br />
common stock or warrants for debt securities or preferred stock in one or more offerings. At December 31, <strong>2002</strong>, the<br />
<strong>Corporation</strong> had $1.0 billion remaining for issuance under the shelf registration. The <strong>Corporation</strong> has no immediate plans<br />
to issue equity securities.<br />
Other Significant Financings – During June <strong>2002</strong>, UPRR entered into a capital lease covering new locomotives. The related<br />
capital lease obligation totaled approximately $126 million and is included in the Consolidated Statements of Financial<br />
Position as debt (see note 5 to the Consolidated Financial Statements, Item 8).<br />
In December 2001, the Railroad entered into a synthetic operating lease arrangement to finance a new headquarters<br />
building, which will be constructed in Omaha, Nebraska. The expected completion date of the building is mid-2004. It will<br />
total approximately 1.1 million square feet with approximately 3,800 office workspaces. The cost to construct the new<br />
headquarters, including capitalized interest, is approximately $260 million. The <strong>Corporation</strong> has guaranteed all of the<br />
Railroad’s obligation under this lease.<br />
UPRR is the construction agent for the lessor during the construction period. The Railroad has guaranteed, in the event<br />
of a loss caused by or resulting from its actions or failures to act as construction agent, 89.9% of the building related<br />
construction costs incurred up to that point during the construction period. Total building related costs incurred and drawn<br />
from the lease funding commitments as of December 31, <strong>2002</strong>, were approximately $50 million. Accordingly, the Railroad’s<br />
guarantee at December 31, <strong>2002</strong>, was approximately $45 million. As construction continues and additional costs are<br />
incurred, this guarantee will increase accordingly.<br />
After construction is complete, UPRR will lease the building under an initial term of five years with provisions for renewal<br />
for an extended period subject to agreement between the Railroad and lessor. At any time during the lease, the Railroad may,<br />
at its option, purchase the building at approximately the amount expended by the lessor to construct the building. If the<br />
Railroad elects not to purchase the building or renew the lease, the building is returned to the lessor for remarketing, and<br />
the Railroad has guaranteed a residual value equal to 85% of the total construction related costs. The guarantee will be<br />
approximately $220 million.<br />
OTHER MATTERS<br />
Personal Injury and Occupational Illness – The cost of injuries to employees and others related to Railroad activities or in<br />
accidents involving the trucking segment is charged to expense based on actuarial estimates of the ultimate cost and number<br />
of incidents each year. During <strong>2002</strong>, the Railroad’s reported number of work-related injuries that resulted in lost job time<br />
decreased 5% compared to the number of injuries reported during 2001, and accidents at grade crossings decreased 16%<br />
compared to 2001. <strong>Annual</strong> expenses for the <strong>Corporation</strong>’s personal injury-related events were $259 million in <strong>2002</strong>, $227<br />
million in 2001 and $226 million in 2000. As of December 31, <strong>2002</strong> and 2001, the <strong>Corporation</strong> had a liability of $724 million<br />
and $743 million, respectively, accrued for future personal injury costs, of which $304 million and $295 million were recorded<br />
in current liabilities as accrued casualty costs. The Railroad has additional amounts accrued for claims related to certain<br />
occupational illnesses. Compensation for Railroad work-related accidents is governed by the Federal Employers’ Liability Act<br />
(FELA). Under FELA, damages are assessed based on a finding of fault through litigation or out-of-court settlements. The<br />
Railroad offers a comprehensive variety of services and rehabilitation programs for employees who are injured at work.<br />
Environmental Costs – The <strong>Corporation</strong> generates and transports hazardous and non-hazardous waste in its current and<br />
former operations, and is subject to federal, state and local environmental laws and regulations. The <strong>Corporation</strong> has<br />
identified approximately 433 sites at which it is or may be liable for remediation costs associated with alleged contamination<br />
or for violations of environmental requirements. This includes 52 sites that are the subject of actions taken by the U.S.<br />
government, 27 of which are currently on the Superfund National Priorities List. Certain federal legislation imposes joint<br />
and several liability for the remediation of identified sites; consequently, the <strong>Corporation</strong>’s ultimate environmental liability<br />
may include costs relating to activities of other parties, in addition to costs relating to its own activities at each site.<br />
When an environmental issue has been identified with respect to the property owned, leased or otherwise used in the<br />
conduct of the <strong>Corporation</strong>’s business, the <strong>Corporation</strong> and its consultants perform environmental assessments on such<br />
property. The <strong>Corporation</strong> expenses the cost of the assessments as incurred. The <strong>Corporation</strong> accrues the cost of<br />
remediation where its obligation is probable and such costs can be reasonably estimated.<br />
28
As of December 31, <strong>2002</strong> and 2001, the <strong>Corporation</strong> had a liability of $189 million and $172 million, respectively, accrued<br />
for future environmental costs, of which $72 million and $71 million were recorded in current liabilities as accrued casualty<br />
costs. The liability includes future costs for remediation and restoration of sites, as well as for ongoing monitoring costs, but<br />
excludes any anticipated recoveries from third parties. Cost estimates are based on information available for each site,<br />
financial viability of other potentially responsible parties, and existing technology, laws and regulations. The <strong>Corporation</strong><br />
believes that it has adequately accrued for its ultimate share of costs at sites subject to joint and several liability. However,<br />
the ultimate liability for remediation is difficult to determine because of the number of potentially responsible parties<br />
involved, site-specific cost sharing arrangements with other potentially responsible parties, the degree of contamination by<br />
various wastes, the scarcity and quality of volumetric data related to many of the sites, and/or the speculative nature of<br />
remediation costs. The <strong>Corporation</strong> expects to pay out the majority of the December 31, <strong>2002</strong>, environmental liability over<br />
the next five years, funded by cash generated from operations.<br />
Remediation of identified sites previously used in operations, used by tenants or contaminated by former owners<br />
required cash spending of $68 million in <strong>2002</strong>, $63 million in 2001, and $62 million in 2000. The <strong>Corporation</strong> is also<br />
engaged in reducing emissions, spills and migration of hazardous materials, and spent cash of $6 million, $5 million and $8<br />
million in <strong>2002</strong>, 2001, and 2000, respectively, for control and prevention. In 2003, the <strong>Corporation</strong> anticipates spending $65<br />
million for remediation and $9 million for control and prevention. The impact of current obligations is not expected to have<br />
a material adverse effect on the liquidity of the <strong>Corporation</strong>.<br />
Labor Matters<br />
Rail – Approximately 87% of the Railroad’s nearly 47,000 employees are represented by 14 major rail unions. National<br />
negotiations under the Railway Labor Act to revise the national labor agreements for all crafts began in late 1999. In May 2001,<br />
the Brotherhood of Maintenance of Way Employees (BMWE) ratified a five-year agreement, which included provisions for<br />
an annual wage increase (based on the consumer price index) and progressive health and welfare cost sharing. In August <strong>2002</strong>,<br />
the carriers reached a five year agreement with the United Transportation <strong>Union</strong> (UTU) for annual wage increases as follows:<br />
4.0% July <strong>2002</strong>, 2.5% July 2003, and 3.0% July 2004. The agreement also established a process for resolving the health and<br />
welfare cost sharing issue through arbitration and also provided for the operation of remote control locomotives by trainmen.<br />
The Brotherhood of Locomotive Engineers (BLE) challenged the remote control feature of the UTU Agreement and a recent<br />
arbitration decision held that operation of remote control by UTU members in terminals does not violate the BLE agreement.<br />
In November <strong>2002</strong>, the International Brotherhood of Boilermakers and Blacksmiths (IBB) reached a five year agreement<br />
following the UTU wage pattern. In January 2003, an arbitration award was rendered establishing wage increases and health<br />
and welfare employee cost sharing for the Transportation Communications International <strong>Union</strong> (TCU). Contract discussions<br />
with the remaining unions are either in negotiation or mediation. Also during <strong>2002</strong>, the National Mediation Board ruled<br />
against the UTU on its petition for a single operating craft on the Kansas City Southern Railroad. The BLE is now working<br />
on a possible merger with the International Brotherhood of Teamsters (Teamsters).<br />
Trucking – During <strong>2002</strong>, OTC continued to oppose the efforts of the Teamsters to unionize OTC service centers. On<br />
February 11, <strong>2002</strong>, the United States Court of Appeals for the Fourth Circuit, sitting as a full panel, refused to enforce four<br />
bargaining orders issued by the National Labor Relations Board (NLRB) that would have required OTC to bargain with the<br />
Teamsters, even though the Teamsters lost secret ballot elections. Subsequently, the NLRB moved for a judgment against<br />
itself to reverse the seven other bargaining orders it had issued, and the Fourth Circuit entered that judgment. On October<br />
11, <strong>2002</strong>, the NLRB’s General Counsel dismissed a charge the Teamsters had filed in August 2001 alleging that OTC had been<br />
bargaining in bad faith. OTC has not reached any collective bargaining agreement with the Teamsters. On October 24, <strong>2002</strong>,<br />
the Teamsters ended the national strike they had called against OTC three years earlier.<br />
The Teamsters’ eight-year campaign to organize OTC’s service centers has become almost entirely dormant, and since<br />
October <strong>2002</strong>, the Teamsters have lost rights to represent 41% of the approximately 2,100 employees they had organized. The<br />
Teamsters had become the bargaining representative of the employees at 26 of OTC’s 170 service centers, but the employees<br />
at 17 of these locations recently have voted to decertify the Teamsters, and the NLRB has officially approved the votes in 14<br />
of those locations. Decertification petitions are pending at four other service centers. Only a single representation petition<br />
currently is pending, but due to strike violence charges pending against the Teamsters, the NLRB has blocked the Teamsters’<br />
efforts to precipitate an election. In all, the Teamsters currently represent approximately 10% of OTC’s 12,534 employees.<br />
Employees at two Motor Cargo service centers located in North Salt Lake, Utah and Reno, Nevada, representing<br />
approximately 11% of Motor Cargo’s total work force at 33 service centers, are covered by two separate collective bargaining<br />
29
agreements with unions affiliated with the Teamsters. Although the agreements cover most of the employees at these two<br />
facilities, less than half of these covered employees are actual members of unions.<br />
Inflation – The cumulative effect of long periods of inflation has significantly increased asset replacement costs for capitalintensive<br />
companies such as the Railroad, OTC and Motor Cargo. As a result, depreciation charges on an inflation-adjusted<br />
basis, assuming that all operating assets are replaced at current price levels, would be substantially greater than historically<br />
reported amounts.<br />
Derivative Financial Instruments – The <strong>Corporation</strong> and its subsidiaries use derivative financial instruments in limited<br />
instances for other than trading purposes to manage risk related to changes in fuel prices and to achieve the <strong>Corporation</strong>’s<br />
interest rate objectives. The <strong>Corporation</strong> uses swaps, futures and/or forward contracts to mitigate the downside risk of<br />
adverse price movements and hedge the exposure to variable cash flows. The use of these instruments also limits future gains<br />
from favorable movements. The <strong>Corporation</strong> uses interest rate swaps to manage its exposure to interest rate changes. The<br />
purpose of these programs is to protect the <strong>Corporation</strong>’s operating margins and overall profitability from adverse fuel price<br />
changes or interest rate fluctuations.<br />
The <strong>Corporation</strong> may also use swaptions to secure near-term swap prices. Swaptions are swaps that are extendable past<br />
their base period at the option of the counterparty. Swaptions do not qualify for hedge accounting treatment and are<br />
marked-to-market through the Consolidated Statements of Income.<br />
Market and Credit Risk – The <strong>Corporation</strong> addresses market risk related to derivative financial instruments by selecting<br />
instruments with value fluctuations that highly correlate with the underlying item being hedged. Credit risk related to<br />
derivative financial instruments, which is minimal, is managed by requiring high credit standards for counterparties and<br />
periodic settlements. At December 31, <strong>2002</strong>, the <strong>Corporation</strong> has not been required to provide collateral, nor has UPC<br />
received collateral relating to its hedging activities.<br />
In addition, the <strong>Corporation</strong> enters into secured financings in which the debtor has pledged collateral. The collateral is<br />
based upon the nature of the financing and the credit risk of the debtor. The <strong>Corporation</strong> generally is not permitted to sell<br />
or repledge the collateral unless the debtor defaults.<br />
Determination of Fair Value – The fair values of the <strong>Corporation</strong>’s derivative financial instrument positions at December 31,<br />
<strong>2002</strong> and 2001, were determined based upon current fair values as quoted by recognized dealers or developed based upon<br />
the present value of expected future cash flows discounted at the applicable U.S. Treasury rate, London Interbank Offered<br />
Rates (LIBOR) or swap spread.<br />
Sensitivity Analyses – The sensitivity analyses that follow illustrate the economic effect that hypothetical changes in interest<br />
rates or fuel prices could have on the <strong>Corporation</strong>’s financial instruments. These hypothetical changes do not consider other<br />
factors that could impact actual results.<br />
Interest Rates – The <strong>Corporation</strong> manages its overall exposure to fluctuations in interest rates by adjusting the proportion<br />
of fixed and floating rate debt instruments within its debt portfolio over a given period. The mix of fixed and floating rate<br />
debt is largely managed through the issuance of targeted amounts of each as debt matures or as incremental borrowings are<br />
required. Derivatives are used as one of the tools to obtain the targeted mix. In addition, the <strong>Corporation</strong> also obtains<br />
flexibility in managing interest costs and the interest rate mix within its debt portfolio by evaluating the issuance of and<br />
managing outstanding callable fixed-rate debt securities.<br />
At December 31, <strong>2002</strong> and 2001, the <strong>Corporation</strong> had variable-rate debt representing approximately 12% of its total debt.<br />
If variable interest rates average 10% higher in 2003 than the <strong>Corporation</strong>’s December 31, <strong>2002</strong> variable rate, which was<br />
approximately 3%, the <strong>Corporation</strong>’s interest expense would increase by less than $5 million after tax. If variable interest rates<br />
had averaged 10% higher in <strong>2002</strong> than the <strong>Corporation</strong>’s December 31, 2001 variable rate, the <strong>Corporation</strong>’s interest expense<br />
would have increased by less than $5 million after tax. These amounts were determined by considering the impact of the<br />
hypothetical interest rates on the balances of the <strong>Corporation</strong>’s variable-rate debt at December 31, <strong>2002</strong> and 2001, respectively.<br />
Swaps allow the <strong>Corporation</strong> to convert debt from fixed rates to variable rates and thereby hedge the risk of changes in<br />
the debt’s fair value attributable to the changes in the benchmark interest rate (LIBOR). The swaps have been accounted for<br />
using the short-cut method as allowed by Financial Accounting Standard (FAS) 133; therefore, no ineffectiveness has been<br />
30
ecorded within the <strong>Corporation</strong>’s Consolidated Financial Statements. In January <strong>2002</strong>, the <strong>Corporation</strong> entered into an<br />
interest rate swap on $250 million of debt with a maturity date of December 2006. In May <strong>2002</strong>, the <strong>Corporation</strong> entered<br />
into an interest rate swap on $150 million of debt with a maturity date of February 2023. This swap contained a call option<br />
that matches the call option of the underlying hedged debt, as allowed by FAS 133. In January 2003, the swap’s counterparty<br />
exercised their option to cancel the swap, effective February 1, 2003. Similarly, the <strong>Corporation</strong> has exercised its option to<br />
redeem the underlying debt. As of December 31, <strong>2002</strong> and 2001, the <strong>Corporation</strong> had approximately $898 million and $598<br />
million of interest rate swaps, respectively. The effect of a 10% interest rate increase or decrease in 2003 over the December<br />
31, <strong>2002</strong> rates is included in the preceding and succeeding paragraph disclosure, respectively.<br />
Market risk for fixed-rate debt is estimated as the potential increase in fair value resulting from a hypothetical 10%<br />
decrease in interest rates as of December 31, <strong>2002</strong>, and amounts to approximately $203 million at December 31, <strong>2002</strong>. Market<br />
risk resulting from a hypothetical 10% decrease in interest rates as of December 31, 2001, amounted to approximately $226<br />
million at December 31, 2001. The fair values of the <strong>Corporation</strong>’s fixed-rate debt were estimated by considering the impact<br />
of the hypothetical interest rates on quoted market prices and current borrowing rates.<br />
Fuel – Fuel costs are a significant portion of the <strong>Corporation</strong>’s total operating expenses. As a result of the significance of fuel<br />
costs and the historical volatility of fuel prices, the <strong>Corporation</strong>’s transportation subsidiaries periodically use swaps, futures<br />
and/or forward contracts to mitigate the impact of adverse fuel price changes. The <strong>Corporation</strong> at times may use swaptions<br />
to secure more favorable swap prices.<br />
As of December 31, <strong>2002</strong>, expected rail fuel consumption for 2003 is 7% hedged at 58 cents per gallon, excluding taxes,<br />
transportation costs and regional pricing spreads. As of December 31, <strong>2002</strong>, the Railroad has no outstanding hedges for<br />
2004. Based on annualized fuel consumption during <strong>2002</strong>, and excluding the impact of the hedging program, each one-cent<br />
increase in the price of fuel would have resulted in approximately $8.2 million of additional fuel expense, after tax.<br />
As of December 31, 2001, the <strong>Corporation</strong> had hedged approximately 44% of its forecasted <strong>2002</strong> fuel consumption and 5%<br />
of its forecasted 2003 fuel consumption at 56 cents per gallon, excluding taxes, transportation costs and regional pricing spreads.<br />
As of December 31, <strong>2002</strong>, expected trucking fuel consumption for 2003 is 5% hedged at 58 cents per gallon, excluding<br />
taxes, transportation costs and regional pricing spreads. As of December 31, <strong>2002</strong>, there are no outstanding hedges for 2004.<br />
Based on annualized fuel consumption during <strong>2002</strong>, and excluding the impact of the hedging program, each one-cent<br />
increase in the price of fuel would have resulted in approximately $400,000 of additional fuel expense, after tax.<br />
As of December 31, 2001, the <strong>Corporation</strong> had hedged approximately 16% of its forecasted <strong>2002</strong> trucking fuel<br />
consumption and 5% of its forecasted 2003 fuel consumption at 58 cents per gallon, excluding taxes, transportation costs<br />
and regional pricing spreads.<br />
Accounting Pronouncements – In August 2001, the FASB issued Statement No. 143, “Accounting for Asset Retirement<br />
Obligations” (FAS 143). FAS 143 is effective for the <strong>Corporation</strong> beginning January 1, 2003. FAS 143 requires that the<br />
<strong>Corporation</strong> record a liability for the fair value of an asset retirement obligation when the <strong>Corporation</strong> has a legal obligation<br />
to remove the asset. The standard will affect the way the <strong>Corporation</strong> accounts for track structure removal costs, but will<br />
have no impact on liquidity. The <strong>Corporation</strong> is currently evaluating the impact of this statement on the <strong>Corporation</strong>'s<br />
Consolidated Financial Statements. Any impact resulting from the adoption of this statement will be recorded as a<br />
cumulative effect of a change in accounting principle in the first quarter of 2003.<br />
In June <strong>2002</strong>, the FASB issued Statement No. 146, “Accounting for Costs Associated with Exit or Disposal Activites” (FAS<br />
146). FAS 146 requires that a liability for a cost associated with an exit or disposal activity is recognized at fair value when<br />
the liability is incurred and is effective for exit or disposal activities that are initiated after December 31, <strong>2002</strong>. Management<br />
believes that FAS 146 will not have a material impact on the <strong>Corporation</strong>’s Consolidated Financial Statements.<br />
In November <strong>2002</strong>, the FASB issued Interpretation No. 45, “Guarantor’s Accounting and Disclosure Requirements for<br />
Guarantees, Including Guarantees of Indebtedness of Others” (FIN 45). FIN 45 is effective for guarantees issued or modified<br />
after December 31, <strong>2002</strong>. The disclosure requirements were effective for the year ending December 31, <strong>2002</strong>, which expand the<br />
disclosures required by a guarantor about its obligations under a guarantee. FIN 45 also requires the <strong>Corporation</strong> to recognize,<br />
at the inception of a guarantee, a liability for the fair value of the obligation undertaken in the issuance of the guarantee.<br />
Management does not believe that FIN 45 will have a material impact on the <strong>Corporation</strong>’s Consolidated Financial Statements.<br />
31
In December <strong>2002</strong>, the FASB issued Statement No. 148, “Accounting for Stock-Based Compensation – Transition and<br />
Disclosure” (FAS 148). FAS 148 provides alternative methods of transition for voluntary changes to the fair value based<br />
method of accounting for stock-based employee compensation, and amends the disclosure requirements including a<br />
requirement for interim disclosures. The <strong>Corporation</strong> currently discloses the effects of stock-based employee compensation<br />
and does not intend to voluntarily change to the alternative accounting principle.<br />
In January 2003, the FASB issued Interpretation No. 46, “Consolidation of Variable Interest Entities” (FIN 46). FIN 46<br />
requires a variable interest entity to be consolidated by a company if that company is subject to a majority of the risk of loss<br />
from the variable interest entity’s activities or entitled to receive a majority of the entity’s residual returns or both. FIN 46 also<br />
requires disclosures about variable interest entities that a company is not required to consolidate but in which it has a<br />
significant variable interest. The consolidation requirements of FIN 46 apply immediately to variable interest entities created<br />
after January 31, 2003. The consolidation requirements apply to existing entities in the first fiscal year or interim period<br />
beginning after June 15, 2003. Certain of the disclosure requirements apply in all financial statements issued after January 31,<br />
2003, regardless of when the variable interest entity was established. As described in note 10 to the Consolidated Financial<br />
Statements, Item 8, the Railroad has a synthetic operating lease arrangement to finance a new headquarters building, which<br />
falls within the guidance of FIN 46. In accordance with FIN 46, the Railroad will either consolidate, restructure or refinance<br />
the synthetic lease prior to July 1, 2003. The <strong>Corporation</strong> does not expect FIN 46 to have any impact on the treatment of the<br />
Sale of Receivables program as described in note 2 to the Consolidated Financial Statements, Item 8.<br />
Commitments and Contingencies – There are various claims and lawsuits pending against the <strong>Corporation</strong> and certain of its<br />
subsidiaries. The <strong>Corporation</strong> is also subject to various federal, state and local environmental laws and regulations, pursuant<br />
to which it is currently participating in the investigation and remediation of various sites. A discussion of certain claims,<br />
lawsuits, contingent liabilities and guarantees is set forth in note 10 to the Consolidated Financial Statements, Item 8.<br />
Pensions – During the second quarter of <strong>2002</strong>, the <strong>Corporation</strong> decreased its assumed rate of return on pension plan assets<br />
from 10% to 9%. This assumption change resulted in an increase to <strong>2002</strong> pension expense of $22 million. In addition, due<br />
to declines on plan assets, a minimum pension liability adjustment was recorded during the fourth quarter of <strong>2002</strong>. This<br />
adjustment resulted in a reduction of common shareholders’ equity. The reduction in equity totaled $225 million, after tax<br />
(approximately 2% of total equity).<br />
OTC voluntarily contributed $125 million to its pension plan during <strong>2002</strong>. The Railroad voluntarily contributed $100 million<br />
to its pension plan during the fourth quarter of <strong>2002</strong>. The <strong>Corporation</strong> currently does not have any minimum funding<br />
requirements, as set forth in employee benefit and tax laws; however, UPC plans to voluntarily contribute approximately $75 million<br />
during 2003. Required contributions subsequent to 2003 are dependent on asset returns, current discount rates and a number of<br />
other factors; however, the <strong>Corporation</strong> expects to continue discretionary funding to help manage any potential required funding<br />
in the future. Future contributions are expected to be funded primarily by cash generated from operating activities.<br />
Dividend Receivable – The Railroad owns a 26% interest in Grupo Ferroviario Mexicano, S.A. de C.V. (GFM). GFM operates<br />
a major railway system in Mexico. During the third quarter of <strong>2002</strong>, the Railroad recorded a dividend from GFM of<br />
approximately $118 million. As of December 31, <strong>2002</strong>, the dividend is reflected as a receivable in the <strong>Corporation</strong>’s<br />
Consolidated Statements of Financial Position. The dividend is accounted for as a reduction to investments in and advances<br />
to affiliated companies in the Consolidated Statements of Financial Position as of December 31, <strong>2002</strong> and creates no effect on<br />
the <strong>Corporation</strong>’s Consolidated Statements of Income. During the fourth quarter <strong>2002</strong>, the Railroad received approximately<br />
$20 million of the dividend receivable, and anticipates it will receive the remainder of the dividend during 2003.<br />
West Coast Port Disruption – During September of <strong>2002</strong>, the labor dispute between the International Longshoreman and<br />
Warehouse <strong>Union</strong> (ILWU) and the <strong>Pacific</strong> Maritime Association escalated and resulted in work slow-downs and a lockout<br />
of the ILWU dockworkers for four days at the end of the third quarter and continued for nine days into the fourth quarter<br />
of <strong>2002</strong>. The estimated impact on fourth quarter earnings is approximately 10 cents per share, resulting mainly from<br />
international intermodal shipments diverted to trucks and suspended shipments due to vessel scheduling disruptions.<br />
Railroad Retirement Reform – On December 21, 2001, The Railroad Retirement and Survivors’ Improvement Act of 2001<br />
(the Act) was signed into law. The Act was a result of historic cooperation between rail management and labor, and provides<br />
improved railroad retirement benefits for employees and reduced payroll taxes for employers. The estimated savings to the<br />
Railroad during <strong>2002</strong> from passage of the Act was $36 million, pre-tax, in reduced employer payroll taxes. Incremental<br />
savings are expected in 2003 as the employer tax rate is further reduced by 1.4 percentage points from 15.6% to 14.2%.<br />
32
Work Force Reduction – During 2003, the <strong>Corporation</strong> is planning to reduce approximately 1,000 administrative positions,<br />
through a combination of attrition and involuntary severance. The estimated 2003 severance cost is $45 million, pre-tax,<br />
the majority of which should occur in the first quarter of 2003.<br />
A LOOK FORWARD<br />
2003 Business Outlook<br />
Rail – The Railroad expects to build on the positive momentum generated in the past several years and continue to grow<br />
revenue, operating income and free cash flow. Free cash flow is defined as cash provided by operating activities less cash used<br />
in investing activities and dividends paid. Year-over-year revenue growth is projected in all commodity groups with the<br />
largest percentage increases projected in the intermodal, agricultural and industrial groups. Revenue derived from chemical<br />
and energy shipments is expected to increase steadily over 2003. Automotive revenue is also expected to increase slightly<br />
from last year’s record setting pace, thereby continuing as a strong revenue provider. The Railroad will continue to focus on<br />
improving service performance while developing new, innovative rail service offerings to meet the changing needs of its<br />
customers. While operating expenses will likely increase for such items as insurance, pension, operating taxes and minimum<br />
guaranteed payments to union employees, cost controls and continuing improvements in productivity will remain a focus<br />
to drive the operating ratio lower. Fuel price will remain susceptible to near term volatile price swings. To help reduce the<br />
impact of fuel price volatility on earnings, the Railroad will continue to look for opportunities to use hedge contracts.<br />
Trucking – Overnite expects financial performance to further improve upon its positive <strong>2002</strong> results. Solid revenue growth<br />
is projected, in part due to additional business resulting from the forced closure of Consolidated Freightways. Cost controls<br />
and productivity improvements are projected to positively impact operating expenses, which will mitigate the impact of<br />
inflationary pressures and volatile fuel prices. Overnite will continue to offer reliable on-time performance and quality<br />
service, which should enable Overnite to maintain profitable margins.<br />
2003 Capital Investments<br />
The <strong>Corporation</strong>’s 2003 capital expenditures and debt service requirements are expected to be funded through cash<br />
generated from operations, additional debt financings and the sale or lease of various operating and non-operating<br />
properties. The <strong>Corporation</strong> expects that these sources will continue to provide sufficient funds to meet cash requirements<br />
in the foreseeable future. In 2003, the <strong>Corporation</strong> expects to spend approximately $1.8 to $2.0 billion on capital<br />
expenditures. These capital expenditures will be used to maintain track and structures, continue capacity expansions on the<br />
Railroad’s main lines, upgrade and augment equipment to better meet customer needs, build infrastructure and develop and<br />
implement new technologies. OTC and Motor Cargo will continue to maintain their truck fleet, expand service centers and<br />
enhance technology.<br />
CAUTIONARY INFORMATION<br />
Certain statements in this report are, and statements in other material filed or to be filed with the Securities and Exchange<br />
Commission (as well as information included in oral statements or other written statements made or to be made by the<br />
<strong>Corporation</strong>) are, or will be, forward-looking statements as defined by the Securities Act of 1933 and the Securities Exchange<br />
Act of 1934. These forward-looking statements include, without limitation, statements regarding: expectations as to<br />
operational improvements; expectations as to cost savings, revenue growth and earnings; the time by which certain objectives<br />
will be achieved; estimates of costs relating to environmental remediation and restoration; proposed new products and<br />
services; expectations that claims, lawsuits, environmental costs, commitments, contingent liabilities, labor negotiations or<br />
agreements, or other matters will not have a material adverse effect on the <strong>Corporation</strong>’s consolidated financial position,<br />
results of operations or liquidity; and statements concerning projections, predictions, expectations, estimates or forecasts as<br />
to the <strong>Corporation</strong>’s and its subsidiaries’ business, financial and operational results, and future economic performance,<br />
statements of management’s goals and objectives and other similar expressions concerning matters that are not historical facts.<br />
Forward-looking statements should not be read as a guarantee of future performance or results, and will not necessarily<br />
be accurate indications of the times that, or by which, such performance or results will be achieved. Forward-looking<br />
information is based on information available at the time and/or management’s good faith belief with respect to future<br />
events, and is subject to risks and uncertainties that could cause actual performance or results to differ materially from those<br />
expressed in the statements.<br />
33
Important factors that could affect the <strong>Corporation</strong>’s and its subsidiaries’ future results and could cause those results or<br />
other outcomes to differ materially from those expressed or implied in the forward-looking statements include, but are not<br />
limited to:<br />
• whether the <strong>Corporation</strong> and its subsidiaries are fully successful in implementing their financial and<br />
operational initiatives;<br />
• industry competition, conditions, performance and consolidation;<br />
• legislative and regulatory developments, including possible enactment of initiatives to re-regulate the rail<br />
industry;<br />
• natural events such as severe weather, fire, floods and earthquakes;<br />
• the effects of adverse general economic conditions, both within the United States and globally;<br />
• any adverse economic or operational repercussions from terrorist activities and any governmental response<br />
thereto;<br />
• war or risk of war;<br />
• changes in fuel prices;<br />
• changes in labor costs;<br />
• labor stoppages; and<br />
• the outcome of claims and litigation, including those related to environmental contamination, personal injuries,<br />
and occupational illnesses arising from hearing loss, repetitive motion and exposure to asbestos and diesel<br />
fumes.<br />
Forward-looking statements speak only as of the date the statement was made. The <strong>Corporation</strong> assumes no obligation<br />
to update forward-looking information to reflect actual results, changes in assumptions or changes in other factors affecting<br />
forward-looking information. If the <strong>Corporation</strong> does update one or more forward-looking statements, no inference should<br />
be drawn that the <strong>Corporation</strong> will make additional updates with respect thereto or with respect to other forward-looking<br />
statements.<br />
Item 7A. Quantitative and Qualitative Disclosures about Market Risk<br />
Information concerning market risk sensitive instruments is set forth under Management’s Discussion and Analysis of<br />
Financial Condition and Results of Operations – Other Matters, Item 7.<br />
****************************************<br />
34
Item 8. Financial Statements and Supplementary Data<br />
Index to Consolidated Financial Statements<br />
Page<br />
Independent Auditors’ <strong>Report</strong>...................................................................................................................... 36<br />
Consolidated Statements of Income<br />
For the Years Ended December 31, <strong>2002</strong>, 2001 and 2000 ................................................................... 37<br />
Consolidated Statements of Financial Position<br />
At December 31, <strong>2002</strong> and 2001........................................................................................................... 38<br />
Consolidated Statements of Cash Flows<br />
For the Years Ended December 31, <strong>2002</strong>, 2001 and 2000 ................................................................... 39<br />
Consolidated Statements of Changes in Common Shareholders’ Equity<br />
For the Years Ended December 31, <strong>2002</strong>, 2001 and 2000 ................................................................... 40<br />
Notes to the Consolidated Financial Statements......................................................................................... 41<br />
35
INDEPENDENT AUDITORS’ REPORT<br />
<strong>Union</strong> <strong>Pacific</strong> <strong>Corporation</strong>, its Directors and Shareholders:<br />
We have audited the accompanying consolidated statements of financial position of <strong>Union</strong> <strong>Pacific</strong> <strong>Corporation</strong> and<br />
Subsidiary Companies (the <strong>Corporation</strong>) as of December 31, <strong>2002</strong> and 2001, and the related consolidated statements of<br />
income, changes in common shareholders’ equity and cash flows for each of the three years in the period ended December<br />
31, <strong>2002</strong>. Our audits also included the consolidated financial statement schedule listed in the Table of Contents at Part IV,<br />
Item 15. These consolidated financial statements and consolidated financial statement schedule are the responsibility of the<br />
<strong>Corporation</strong>’s management. Our responsibility is to express an opinion on these consolidated financial statements and<br />
consolidated financial statement schedule based on our audits.<br />
We conducted our audits in accordance with auditing standards generally accepted in the United States of America. Those<br />
standards require that we plan and perform the audit to obtain reasonable assurance about whether the financial statements<br />
are free of material misstatement. An audit includes examining, on a test basis, evidence supporting the amounts and<br />
disclosures in the financial statements. An audit also includes assessing the accounting principles used and significant<br />
estimates made by management, as well as evaluating the overall financial statement presentation. We believe that our audits<br />
provide a reasonable basis for our opinion.<br />
In our opinion, such consolidated financial statements present fairly, in all material respects, the financial position of<br />
<strong>Union</strong> <strong>Pacific</strong> <strong>Corporation</strong> and Subsidiary Companies at December 31, <strong>2002</strong> and 2001, and the results of their operations<br />
and their cash flows for each of the three years in the period ended December 31, <strong>2002</strong>, in conformity with accounting<br />
principles generally accepted in the United States of America. Also, in our opinion, such consolidated financial statement<br />
schedule, when considered in relation to the basic consolidated financial statements taken as a whole, presents fairly in all<br />
material respects the information set forth therein.<br />
Omaha, Nebraska<br />
January 22, 2003<br />
36
CONSOLIDATED STATEMENTS OF INCOME<br />
<strong>Union</strong> <strong>Pacific</strong> <strong>Corporation</strong> and Subsidiary Companies<br />
Millions, Except Per Share Amounts,<br />
for the Years Ended December 31, <strong>2002</strong> 2001 2000<br />
Operating Revenues Rail, trucking and other ......................................... $ 12,491 $ 11,973 $ 11,878<br />
Operating Expenses Salaries, wages and employee benefits................... 4,501 4,276 4,311<br />
Equipment and other rents.................................... 1,366 1,307 1,281<br />
Depreciation ........................................................... 1,206 1,174 1,140<br />
Fuel and utilities ..................................................... 1,133 1,316 1,350<br />
Materials and supplies............................................ 530 537 593<br />
Casualty costs.......................................................... 414 376 360<br />
Purchased services and other costs........................ 1,017 915 940<br />
Total......................................................................... 10,167 9,901 9,975<br />
Income Operating income .................................................. 2,324 2,072 1,903<br />
Other income.......................................................... 325 162 130<br />
Interest expense ...................................................... (633) (701) (723)<br />
Income before income taxes .................................. 2,016 1,533 1,310<br />
Income taxes ........................................................... (675) (567) (468)<br />
Net income ............................................................. $ 1,341 $ 966 $ 842<br />
Share and Per Share Basic - earnings per share ...................................... $ 5.32 $ 3.90 $ 3.42<br />
Diluted - earnings per share .................................. $ 5.05 $ 3.77 $ 3.34<br />
Weighted average number of shares (basic) ......... 252.1 248.0 246.5<br />
Weighted average number of shares (diluted)...... 276.8 271.9 269.5<br />
Dividends ................................................................ $ 0.83 $ 0.80 $ 0.80<br />
The accompanying notes are an integral part of these Consolidated Financial Statements.<br />
37
CONSOLIDATED STATEMENTS OF FINANCIAL POSITION<br />
<strong>Union</strong> <strong>Pacific</strong> <strong>Corporation</strong> and Subsidiary Companies<br />
Assets<br />
Millions of Dollars, as of December 31, <strong>2002</strong> 2001<br />
Current Assets Cash and temporary investments ............................................ $ 369 $ 113<br />
Accounts receivable, net ........................................................... 696 604<br />
Inventories................................................................................. 288 265<br />
Current deferred income taxes................................................. 557 400<br />
Other current assets.................................................................. 242 160<br />
Total ........................................................................................... 2,152 1,542<br />
Investments Investments in and advances to affiliated companies............. 649 725<br />
Other investments..................................................................... 50 61<br />
Total ........................................................................................... 699 786<br />
Properties Cost............................................................................................ 37,838 36,436<br />
Accumulated depreciation........................................................ (8,333) (7,644)<br />
Net ............................................................................................. 29,505 28,792<br />
Other Other assets ............................................................................... 408 431<br />
Total assets................................................................................. $ 32,764 $ 31,551<br />
Liabilities and Common Shareholders’ Equity<br />
Current Liabilities Accounts payable....................................................................... $ 483 $ 567<br />
Accrued wages and vacation .................................................... 412 394<br />
Accrued casualty costs .............................................................. 461 452<br />
Income and other taxes ............................................................ 236 286<br />
Dividends and interest.............................................................. 253 255<br />
Debt due within one year......................................................... 276 194<br />
Other current liabilities ............................................................ 580 598<br />
Total ........................................................................................... 2,701 2,746<br />
Other Liabilities and Debt due after one year ............................................................ 7,428 7,886<br />
Common Shareholders’ Deferred income taxes .............................................................. 8,478 7,882<br />
Equity Accrued casualty costs .............................................................. 682 696<br />
Retiree benefits obligation........................................................ 938 812<br />
Other long-term liabilities........................................................ 386 454<br />
Company-obligated mandatorily redeemable convertible<br />
preferred securities .............................................................. 1,500 1,500<br />
Commitments and contingencies<br />
Common shareholders’ equity................................................. 10,651 9,575<br />
Total liabilities and common shareholders’ equity ................. $ 32,764 $ 31,551<br />
The accompanying notes are an integral part of these Consolidated Financial Statements.<br />
38
CONSOLIDATED STATEMENTS OF CASH FLOWS<br />
<strong>Union</strong> <strong>Pacific</strong> <strong>Corporation</strong> and Subsidiary Companies<br />
Millions of Dollars, for the Years<br />
Ended December 31, <strong>2002</strong> 2001 2000<br />
Operating Activities Net income ........................................................................ $1,341 $ 966 $ 842<br />
Adjustments to reconcile net income to net<br />
cash provided by operating activities:<br />
Depreciation................................................................. 1,206 1,174 1,140<br />
Deferred income taxes................................................. 573 424 447<br />
Cash paid to fund pension plan.................................. (225) - -<br />
Other, net ..................................................................... (321) (379) (398)<br />
Changes in current assets and liabilities, net ............. (324) (193) 22<br />
Cash provided by operating activities.............................. 2,250 1,992 2,053<br />
Investing Activities Capital investments........................................................... (1,887) (1,736) (1,783)<br />
Proceeds from asset sales .................................................. 417 318 211<br />
Other investing activities, net........................................... (51) (126) (65)<br />
Cash used in investing activities....................................... (1,521) (1,544) (1,637)<br />
Financing Activities Dividends paid .................................................................. (201) (198) (199)<br />
Debt repaid........................................................................ (1,197) (1,219) (796)<br />
Cash received from exercise of stock options.................. 150 52 3<br />
Financings, net .................................................................. 775 925 506<br />
Cash used in financing activities...................................... (473) (440) (486)<br />
Net change in cash and temporary investments ............. 256 8 (70)<br />
Cash and temporary investments at<br />
beginning of year ......................................................... 113 105 175<br />
Cash and temporary investments at end of year ............ $ 369 $ 113 $ 105<br />
Changes in Current Accounts receivable, net.................................................... $ (92) $ 10 $ (16)<br />
Assets and Inventories......................................................................... (23) 96 (23)<br />
Liabilities, net Other current assets.......................................................... (82) (50) (24)<br />
Accounts, wages and vacation payable ............................ (66) (112) 73<br />
Other current liabilities .................................................... (61) (137) 12<br />
Total ................................................................................... $ (324) $ (193) $ 22<br />
Supplemental cash flow information:<br />
Cash paid during the year for:<br />
Interest .................................................................... $ 653 $ 722 $ 756<br />
Income taxes, net.................................................... 184 77 25<br />
Non-cash transaction:<br />
Acquisition of Motor Cargo Industries, Inc......... - 80 -<br />
The accompanying notes are an integral part of these Consolidated Financial Statements.<br />
39
CONSOLIDATED STATEMENTS OF CHANGES IN COMMON SHAREHOLDERS’ EQUITY<br />
<strong>Union</strong> <strong>Pacific</strong> <strong>Corporation</strong> and Subsidiary Companies<br />
Accumulated Other<br />
Comprehensive Income (Loss)<br />
Minimum Foreign<br />
[a] [b] Pension Currency<br />
Common Paid-in- Retained Treasury Liability Translation Derivative<br />
Millions of Dollars Shares Surplus Earnings Stock Adjustments Adjustments Adjustments Total Total<br />
Balance at January 1, 2000 ........... $691 $4,019 $5,053 $(1,756) $ (2) $ (4) $ - $ (6) $8,001<br />
Net income.................................... - - 842 - - - - - 842<br />
Other comprehensive<br />
income [d]............................... - - - - - 6 - 6 6<br />
Comprehensive income................ 848<br />
Conversion, exercises of stock<br />
options, forfeitures and<br />
other - net (1,060,242) shares<br />
in 2000 ..................................... (3) 5 - 7 - - - - 9<br />
Dividends declared<br />
($0.80 per share) ..................... - - (196) - - - - - (196)<br />
Balance at December 31, 2000..... 688 4,024 5,699 (1,749) (2) 2 - - 8,662<br />
Net income.................................... - - 966 - - - - - 966<br />
Other comprehensive<br />
income (loss)[d]...................... - - - - (5) 1 (7) (11) (11)<br />
Comprehensive income................ 955<br />
Conversion, exercises of stock<br />
options, forfeitures and<br />
other - net 265,112 shares<br />
in 2001[c] ................................ 1 (44) - 200 - - - - 157<br />
Dividends declared<br />
($0.80 per share) ..................... - - (199) - - - - - (199)<br />
Balance at December 31, 2001..... 689 3,980 6,466 (1,549) (7) 3 (7) (11) 9,575<br />
Net income.................................... - - 1,341 - - - - - 1,341<br />
Other comprehensive income<br />
(loss)[d]................................... - - - - (225) (12) 14 (223) (223)<br />
Comprehensive income................ 1,118<br />
Conversion, exercises of stock<br />
options, forfeitures and<br />
other - net 80,280 shares<br />
in <strong>2002</strong> ..................................... - (34) - 202 - - - - 168<br />
Dividends declared<br />
($0.83 per share) ..................... - - (210) - - - - - (210)<br />
Balance at December 31, <strong>2002</strong>..... $689 $3,946 $7,597 $(1,347) $(232) $ (9) $ 7 $(234) $10,651<br />
[a] Common stock $2.50 par value; 500,000,000 shares authorized; 275,579,367 shares issued at the end of <strong>2002</strong>; 275,499,087<br />
shares issued at the end of 2001; 275,233,975 shares issued at the end of 2000.<br />
[b] Balance at end of year, shares at cost: 21,920,238 in <strong>2002</strong>; 25,208,819 in 2001; 28,413,483 in 2000.<br />
[c] The <strong>Corporation</strong> utilized approximately 1.7 million shares of treasury stock in the acquisition of Motor Cargo Industries, Inc.<br />
[d] Other comprehensive income (loss), net of tax of $(134), $(6) and $3 in <strong>2002</strong>, 2001 and 2000, respectively.<br />
The accompanying notes are an integral part of these Consolidated Financial Statements.<br />
40
NOTES TO THE CONSOLIDATED FINANCIAL STATEMENTS<br />
<strong>Union</strong> <strong>Pacific</strong> <strong>Corporation</strong> and Subsidiary Companies<br />
Significant Accounting Policies<br />
Principles of Consolidation – The Consolidated Financial Statements include the accounts of <strong>Union</strong> <strong>Pacific</strong> <strong>Corporation</strong><br />
(UPC or the <strong>Corporation</strong>) and all of its subsidiaries. Investments in affiliated companies (20% to 50% owned) are<br />
accounted for using the equity method of accounting. All significant intercompany transactions are eliminated.<br />
Cash and Temporary Investments – Temporary investments are stated at cost which approximates fair value and consist of<br />
investments with original maturities of three months or less.<br />
Inventories – Inventories consist of materials and supplies carried at the lower of average cost or market.<br />
Property and Depreciation – Properties are carried at cost. Provisions for depreciation are computed principally on the<br />
straight-line method based on estimated service lives of depreciable property. The cost (net of salvage) of depreciable rail<br />
property retired or replaced in the ordinary course of business is charged to accumulated depreciation. A gain or loss is<br />
recognized in other income for all other property upon disposition. The cost of internally developed software is capitalized<br />
and amortized over a five-year period. An obsolescence review of capitalized software is performed on a periodic basis.<br />
Impairment of Long-lived Assets – The <strong>Corporation</strong> reviews long-lived assets, including identifiable intangibles, for<br />
impairment when events or changes in circumstances indicate that the carrying amount of an asset may not be recoverable.<br />
If impairment indicators are present and the estimated future undiscounted cash flows are less than the carrying value of the<br />
long-lived assets, the carrying value is reduced to the estimated fair value as measured by the discounted cash flows.<br />
Revenue Recognition – The <strong>Corporation</strong> recognizes transportation revenues on a percentage-of-completion basis as freight<br />
moves from origin to destination. Other revenue is recognized as service is performed or contractual obligations are met.<br />
Translation of Foreign Currency – The <strong>Corporation</strong>’s portion of the assets and liabilities related to foreign investments are<br />
translated into U.S. dollars at the exchange rates in effect at the balance sheet date. Revenues and expenses are translated at<br />
the average rates of exchange prevailing during the year. The resulting translation adjustments are reflected within<br />
shareholders’ equity as accumulated other comprehensive income or loss. Transaction gains and losses related to<br />
intercompany accounts are not significant.<br />
Financial Instruments – The carrying value of the <strong>Corporation</strong>’s non-derivative financial instruments approximates fair<br />
value. The fair value of financial instruments is generally determined by reference to market values as quoted by recognized<br />
dealers or developed based upon the present value of expected future cash flows discounted at the applicable U.S. Treasury<br />
rate,London Interbank Offered Rates (LIBOR) or swap spread.<br />
The <strong>Corporation</strong> periodically uses derivative financial instruments, for other than trading purposes, to manage risk<br />
related to changes in fuel prices and interest rates.<br />
Stock-Based Compensation – At December 31, <strong>2002</strong>, the <strong>Corporation</strong> has several stock-based employee compensation<br />
plans, which are described more fully in note 8. The <strong>Corporation</strong> accounts for those plans under the recognition and<br />
measurement principles of APB Opinion No. 25, “Accounting for Stock Issued to Employees”, and related Interpretations.<br />
No stock-based employee compensation expense, related to stock option grants, is reflected in net income as all options<br />
granted under those plans had an exercise price equal to the market value of the underlying common stock on the date of<br />
grant. Stock-based employee compensation expense related to restricted stock and other incentive plans is reflected in net<br />
income. The following table illustrates the effect on net income and earnings per share if the <strong>Corporation</strong> had applied the<br />
fair value recognition provisions of FASB Statement No. 123, “Accounting for Stock-Based Compensation”, to stock-based<br />
employee compensation.<br />
41
Year Ended December 31,<br />
Millions of Dollars, Except Per Share Amounts <strong>2002</strong> 2001 2000<br />
Net income, as reported.................................................................................. $ 1,341 $ 966 $ 842<br />
Stock-based employee compensation expense included in reported net<br />
income, net of tax ...................................................................................... 31 11 11<br />
Total stock-based employee compensation expense determined under<br />
fair value based method for all awards, net of tax ................................... (52) (33) (40)<br />
Pro forma net income..................................................................................... $ 1,320 $ 944 $ 813<br />
EPS – basic, as reported .................................................................................. $ 5.32 $3.90 $3.42<br />
EPS – basic, pro forma.................................................................................... $ 5.24 $3.81 $3.30<br />
EPS – diluted, as reported............................................................................... $ 5.05 $3.77 $3.34<br />
EPS – diluted, pro forma ................................................................................ $ 4.98 $3.69 $3.23<br />
Earnings Per Share – Basic earnings per share (EPS) is calculated on the weighted-average number of common shares<br />
outstanding during each period. Diluted earnings per share include shares issuable upon exercise of outstanding stock<br />
options, stock-based awards and the potential conversion of the preferred securities where the conversion of such<br />
instruments would be dilutive.<br />
Use of Estimates – The Consolidated Financial Statements of the <strong>Corporation</strong> include estimates and assumptions regarding<br />
certain assets, liabilities, revenues and expenses and the disclosure of certain contingent assets and liabilities. Actual future<br />
results may differ from such estimates.<br />
Income Taxes – The <strong>Corporation</strong> accounts for income taxes in accordance with Statement of Financial Accounting<br />
Standards No. 109, “Accounting for Income Taxes” (FAS 109). The objectives of accounting for income taxes are to recognize<br />
the amount of taxes payable or refundable for the current year and deferred tax liabilities and assets for the future tax<br />
consequences of events that have been recognized in an entity’s financial statements or tax returns. These expected future<br />
tax consequences are measured based on provisions of tax law as currently enacted; the effects of future changes in tax laws<br />
are not anticipated. Future tax law changes, such as a change in the corporate tax rate, could have a material impact on the<br />
<strong>Corporation</strong>’s financial position or its results of operations.<br />
Pension and Postretirement Benefits – The <strong>Corporation</strong> incurs certain employment-related expenses associated with<br />
pensions and postretirement health benefits. In order to measure the expense associated with these benefits, management<br />
must make various estimates including discount rates used to value certain liabilities, assumed rates of return on plan assets<br />
used to fund these expenses, compensation increases, employee turnover rates, anticipated mortality rates and expected<br />
future healthcare costs. The estimates used by management are based on the <strong>Corporation</strong>’s historical experience as well as<br />
current facts and circumstances. The <strong>Corporation</strong> uses third-party actuaries to assist management in properly measuring<br />
the expense associated with these benefits. Actual results that vary from the previously mentioned assumptions could have<br />
a material impact on the <strong>Corporation</strong>’s results of operations, financial position or liquidity.<br />
Personal Injury – The cost of injuries to employees and others on <strong>Union</strong> <strong>Pacific</strong> Railroad Company (UPRR) property or in<br />
accidents involving the trucking segment is charged to expense based on actuarial estimates of the ultimate cost and number<br />
of incidents each year.<br />
Environmental – When environmental issues have been identified with respect to the property owned, leased or otherwise<br />
used in the conduct of the <strong>Corporation</strong>’s business, the <strong>Corporation</strong> and its consultants perform environmental assessments<br />
on such property. The <strong>Corporation</strong> expenses the cost of the assessments as incurred. The <strong>Corporation</strong> accrues the cost of<br />
remediation where its obligation is probable and such costs can be reasonably estimated.<br />
Change in Presentation – Certain prior year amounts have been reclassified to conform to the <strong>2002</strong> Consolidated Financial<br />
Statement presentation. These reclassifications had no effect on previously reported operating income or net income.<br />
1. Operations and Segmentation<br />
<strong>Union</strong> <strong>Pacific</strong> <strong>Corporation</strong> consists of two reportable segments, rail and trucking, as well as UPC’s other product lines<br />
(Other). The rail segment includes the operations of the <strong>Corporation</strong>’s indirect wholly owned subsidiary, UPRR and UPRR’s<br />
subsidiaries and rail affiliates (collectively, the Railroad). The trucking segment includes Overnite Transportation Company<br />
42
(OTC) and Motor Cargo Industries, Inc. (Motor Cargo) as of November 30, 2001, both operating as separate and distinct<br />
subsidiaries of Overnite <strong>Corporation</strong> (Overnite), an indirect wholly owned subsidiary of UPC. The <strong>Corporation</strong>’s other<br />
product lines are comprised of the corporate holding company (which largely supports the Railroad), self-insurance activities,<br />
technology companies, and all appropriate consolidating entries.<br />
Rail Segment<br />
Operations – The Railroad is a Class I railroad that operates in the United States. As of October 1, 1996, the Railroad<br />
included Southern <strong>Pacific</strong> Rail <strong>Corporation</strong> (Southern <strong>Pacific</strong> or SP). In addition, during 1997, the Railroad and a<br />
consortium of partners were granted a 50-year concession to operate the <strong>Pacific</strong>-North and Chihuahua <strong>Pacific</strong> lines in<br />
Mexico. The Railroad made an additional investment in the consortium in 1999. During 2001, UPC completed its<br />
integration of Southern <strong>Pacific</strong>’s rail operations.<br />
The Railroad has over 33,000 route miles linking <strong>Pacific</strong> Coast and Gulf Coast ports to the Midwest and eastern United<br />
States gateways and providing several north/south corridors to key Mexican gateways. The Railroad serves the western twothirds<br />
of the country and maintains coordinated schedules with other carriers for the handling of freight to and from the<br />
Atlantic Coast, the <strong>Pacific</strong> Coast, the Southeast, the Southwest, Canada and Mexico. Export and import traffic is moved<br />
through Gulf Coast and <strong>Pacific</strong> Coast ports and across the Mexican and Canadian borders. Railroad freight is comprised of<br />
six commodity lines: agricultural, automotive, chemicals, energy, industrial products and intermodal. The Railroad<br />
continues to focus on utilization of its capital asset base to meet current operating needs and to introduce innovative rail<br />
services across every commodity line.<br />
The Railroad is subject to price and service competition from other railroads, motor carriers and barge operators. The<br />
Railroad’s main competitor is Burlington Northern Santa Fe <strong>Corporation</strong>. Its rail subsidiary, The Burlington Northern and<br />
Santa Fe Railway Company, operates parallel routes in many of the Railroad’s main traffic corridors. In addition, the<br />
Railroad’s operations are conducted in corridors served by other competing railroads and by motor carriers. Motor carrier<br />
competition is particularly strong for intermodal traffic. Because of the proximity of the Railroad’s routes to major inland<br />
and Gulf Coast waterways, barge competition can be particularly pronounced, especially for grain and bulk commodities.<br />
The Railroad is dependent on two key suppliers of locomotives. Due to the capital intensive nature and sophistication of<br />
this equipment, there are strong barriers of entry to new suppliers. Therefore, if one of these suppliers would no longer<br />
produce locomotives, the Railroad could realize a significant increase in the cost and the potential for reduced availability of<br />
the locomotives that are necessary to its operations.<br />
Employees – Approximately 87% of the Railroad’s nearly 47,000 employees are represented by 14 major rail unions. National<br />
negotiations under the Railway Labor Act to revise the national labor agreements for all crafts began in late 1999. In May<br />
2001, the Brotherhood of Maintenance of Way Employees (BMWE) ratified a five-year agreement, which included<br />
provisions for an annual wage increase (based on the consumer price index) and progressive health and welfare cost sharing.<br />
In August <strong>2002</strong>, the carriers reached a five year agreement with the United Transportation <strong>Union</strong> (UTU) for annual wage<br />
increases as follows: 4.0% July <strong>2002</strong>, 2.5% July 2003, and 3.0% July 2004. The agreement also established a process for<br />
resolving the health and welfare cost sharing issue through arbitration and also provided for the operation of remote control<br />
locomotives by trainmen. The Brotherhood of Locomotive Engineers (BLE) challenged the remote control feature of the<br />
UTU Agreement and a recent arbitration decision held that operation of remote control by UTU members in terminals does<br />
not violate the BLE agreement. In November <strong>2002</strong>, the International Brotherhood of Boilermakers and Blacksmiths (IBB)<br />
reached a five year agreement following the UTU wage pattern. In January 2003, an arbitration award was rendered<br />
establishing wage increases and health and welfare employee cost sharing for the Transportation Communications<br />
International <strong>Union</strong> (TCU). Contract discussions with the remaining unions are either in negotiation or mediation. Also<br />
during <strong>2002</strong>, the National Mediation Board ruled against the UTU on its petition for a single operating craft on the Kansas<br />
City Southern Railroad. The BLE is now working on a possible merger with the International Brotherhood of Teamsters<br />
(Teamsters).<br />
Trucking Segment<br />
Operations – The trucking segment includes the operations of OTC and Motor Cargo. OTC is a major interstate trucking<br />
company specializing in less-than-truckload (LTL) shipments. OTC serves all 50 states and portions of Canada and Mexico<br />
through 170 service centers located throughout the United States providing regional, inter-regional and long haul service.<br />
43
OTC transports a variety of products including machinery, tobacco, textiles, plastics, electronics and paper products. Motor<br />
Cargo is a western regional LTL carrier that provides comprehensive service throughout 10 western states. Motor Cargo<br />
transports general commodities, including consumer goods, packaged foodstuffs, industrial and electronic equipment and<br />
auto parts. OTC and Motor Cargo experience intense service and price competition from regional, inter-regional and<br />
national LTL carriers and, to a lesser extent, from truckload carriers, railroads and overnight delivery companies. Major<br />
competitors include US Freightways and CNF Inc. OTC and Motor Cargo believe they are able to compete effectively in their<br />
markets by providing high quality, customized service at competitive prices.<br />
Employees – During <strong>2002</strong>, OTC continued to oppose the efforts of the Teamsters to unionize OTC service centers. On<br />
February 11, <strong>2002</strong>, the United States Court of Appeals for the Fourth Circuit, sitting as a full panel, refused to enforce four<br />
bargaining orders issued by the National Labor Relations Board (NLRB) that would have required OTC to bargain with the<br />
Teamsters, even though the Teamsters lost secret ballot elections. Subsequently, the NLRB moved for a judgment against<br />
itself to reverse the seven other bargaining orders it had issued, and the Fourth Circuit entered that judgment. On October<br />
11, <strong>2002</strong>, the NLRB’s General Counsel dismissed a charge the Teamsters had filed in August 2001 alleging that OTC had been<br />
bargaining in bad faith. OTC has not reached any collective bargaining agreement with the Teamsters. On October 24, <strong>2002</strong>,<br />
the Teamsters ended the national strike they had called against OTC three years earlier.<br />
The Teamsters’ eight-year campaign to organize OTC’s service centers has become almost entirely dormant, and since<br />
October <strong>2002</strong>, the Teamsters have lost rights to represent 41% of the approximately 2,100 employees they had organized. The<br />
Teamsters had become the bargaining representative of the employees at 26 of OTC’s 170 service centers, but the employees<br />
at 17 of these locations recently have voted to decertify the Teamsters, and the NLRB has officially approved the votes in 14<br />
of those locations. Decertification petitions are pending at four other service centers. Only a single representation petition<br />
currently is pending, but due to strike violence charges pending against the Teamsters, the NLRB has blocked the Teamsters’<br />
efforts to precipitate an election. In all, the Teamsters currently represent approximately 10% of OTC’s 12,534 employees.<br />
Employees at two Motor Cargo service centers located in North Salt Lake, Utah and Reno, Nevada, representing<br />
approximately 11% of Motor Cargo’s total work force at 33 service centers, are covered by two separate collective bargaining<br />
agreements with unions affiliated with the Teamsters. Although the agreements cover most of the employees at these two<br />
facilities, less than half of these covered employees are actual members of unions.<br />
Other Product Lines<br />
Other – Included in the other product lines are the results of the corporate holding company, self-insurance activities,<br />
technology companies, and all appropriate consolidating entries.<br />
44
The following table details reportable financial information for the <strong>Corporation</strong>’s segments and other product lines for<br />
the years ended December 31, <strong>2002</strong>, 2001 and 2000:<br />
Millions of Dollars <strong>2002</strong> 2001 2000<br />
Operating revenues:[a]<br />
Rail .............................................................................................................. $ 11,103 $ 10,800 $10,731<br />
Trucking...................................................................................................... 1,332 1,143 1,113<br />
Other........................................................................................................... 56 30 34<br />
Consolidated .............................................................................................. $ 12,491 $ 11,973 $ 11,878<br />
Depreciation:<br />
Rail .............................................................................................................. $ 1,139 $ 1,120 $ 1,089<br />
Trucking...................................................................................................... 59 48 48<br />
Other........................................................................................................... 8 6 3<br />
Consolidated .............................................................................................. $ 1,206 $ 1,174 $ 1,140<br />
Operating income (loss):<br />
Rail .............................................................................................................. $ 2,333 $ 2,081 $ 1,903<br />
Trucking...................................................................................................... 71 54 53<br />
Other........................................................................................................... (80) (63) (53)<br />
Consolidated .............................................................................................. $ 2,324 $ 2,072 $ 1,903<br />
Interest expense:<br />
Rail .............................................................................................................. $ 541 $ 584 $ 592<br />
Trucking...................................................................................................... 1 1 1<br />
Other........................................................................................................... 91 116 130<br />
Consolidated .............................................................................................. $ 633 $ 701 $ 723<br />
Income tax expense (benefit):<br />
Rail .............................................................................................................. $ 739 $ 613 $ 511<br />
Trucking...................................................................................................... 1 29 28<br />
Other........................................................................................................... (65) (75) (71)<br />
Consolidated .............................................................................................. $ 675 $ 567 $ 468<br />
Earnings of nonconsolidated affiliates:[b]<br />
Rail .............................................................................................................. $ 76 $ 78 $ 78<br />
Trucking...................................................................................................... - - -<br />
Other........................................................................................................... - - -<br />
Consolidated .............................................................................................. $ 76 $ 78 $ 78<br />
Net income (loss):<br />
Rail .............................................................................................................. $ 1,374 $ 1,058 $ 926<br />
Trucking...................................................................................................... 89 46 43<br />
Other........................................................................................................... (122) (138) (127)<br />
Consolidated .............................................................................................. $ 1,341 $ 966 $ 842<br />
Investments in nonconsolidated affiliates:[b]<br />
Rail .............................................................................................................. $ 649 $ 725 $ 644<br />
Trucking...................................................................................................... - - -<br />
Other........................................................................................................... - - -<br />
Consolidated .............................................................................................. $ 649 $ 725 $ 644<br />
Assets:<br />
Rail .............................................................................................................. $ 31,314 $ 30,563 $29,993<br />
Trucking...................................................................................................... 775 751 677<br />
Other........................................................................................................... 675 237 247<br />
Consolidated .............................................................................................. $ 32,764 $ 31,551 $ 30,917<br />
Capital investments:<br />
Rail .............................................................................................................. $ 1,817 $ 1,687 $ 1,735<br />
Trucking...................................................................................................... 66 40 33<br />
Other........................................................................................................... 4 9 15<br />
Consolidated .............................................................................................. $ 1,887 $ 1,736 $ 1,783<br />
[a]<br />
[b]<br />
The <strong>Corporation</strong> has no significant intercompany sales activities.<br />
The Railroad has equity interests in several railroad-related businesses.<br />
45
2. Financial Instruments<br />
Adoption of Standard - Effective January 1, 2001, the <strong>Corporation</strong> adopted Financial Accounting Standards Board Statement<br />
(FASB) No. 133, “Accounting for Derivative Instruments and Hedging Activities” (FAS 133) and FASB No. 138, “Accounting for<br />
Certain Derivative Instruments and Certain Hedging Activities” (FAS 138). FAS 133 and FAS 138 require that the changes in<br />
fair value of all derivative financial instruments the <strong>Corporation</strong> uses for fuel or interest rate hedging purposes be recorded in<br />
the <strong>Corporation</strong>’s Consolidated Statements of Financial Position. In addition, to the extent fuel hedges are ineffective due to<br />
pricing differentials resulting from the geographic dispersion of the <strong>Corporation</strong>’s operations, income statement recognition of<br />
the ineffective portion of the hedge position is required. Also, derivative instruments that do not qualify for hedge accounting<br />
treatment per FAS 133 and FAS 138 require income statement recognition. The adoption of FAS 133 and FAS 138 resulted in<br />
the recognition of a $2 million asset on January 1, 2001.<br />
Strategy and Risk – The <strong>Corporation</strong> and its subsidiaries use derivative financial instruments in limited instances for other<br />
than trading purposes to manage risk related to changes in fuel prices and to achieve the <strong>Corporation</strong>’s interest rate<br />
objectives. The <strong>Corporation</strong> uses swaps, futures and/or forward contracts to mitigate the downside risk of adverse price<br />
movements and hedge the exposure to variable cash flows. The use of these instruments also limits future gains from<br />
favorable movements. The <strong>Corporation</strong> uses interest rate swaps to manage its exposure to interest rate changes. The purpose<br />
of these programs is to protect the <strong>Corporation</strong>’s operating margins and overall profitability from adverse fuel price changes<br />
or interest rate fluctuations.<br />
The <strong>Corporation</strong> may also use swaptions to secure near-term swap prices. Swaptions are swaps that are extendable past<br />
their base period at the option of the counterparty. Swaptions do not qualify for hedge accounting treatment and are<br />
marked-to-market through the Consolidated Statements of Income.<br />
Market and Credit Risk – The <strong>Corporation</strong> addresses market risk related to derivative financial instruments by selecting<br />
instruments with value fluctuations that highly correlate with the underlying item being hedged. Credit risk related to<br />
derivative financial instruments, which is minimal, is managed by requiring high credit standards for counterparties and<br />
periodic settlements. At December 31, <strong>2002</strong>, the <strong>Corporation</strong> has not been required to provide collateral, nor has UPC<br />
received collateral relating to its hedging activities.<br />
In addition, the <strong>Corporation</strong> enters into secured financings in which the debtor has pledged collateral. The collateral is<br />
based upon the nature of the financing and the credit risk of the debtor. The <strong>Corporation</strong> generally is not permitted to sell<br />
or repledge the collateral unless the debtor defaults.<br />
Determination of Fair Value – The fair values of the <strong>Corporation</strong>’s derivative financial instrument positions at December<br />
31, <strong>2002</strong> and 2001, were determined based upon current fair values as quoted by recognized dealers or developed based upon<br />
the present value of expected future cash flows discounted at the applicable U.S. Treasury rate, London Interbank Offered<br />
Rates (LIBOR) or swap spread.<br />
Interest Rate Strategy – The <strong>Corporation</strong> manages its overall exposure to fluctuations in interest rates by adjusting the<br />
proportion of fixed and floating rate debt instruments within its debt portfolio over a given period. The mix of fixed and<br />
floating rate debt is largely managed through the issuance of targeted amounts of each as debt matures or as incremental<br />
borrowings are required. Derivatives are used as one of the tools to obtain the targeted mix. In addition, the <strong>Corporation</strong><br />
also obtains flexibility in managing interest costs and the interest rate mix within its debt portfolio by evaluating the issuance<br />
of and managing outstanding callable fixed-rate debt securities.<br />
Swaps allow the <strong>Corporation</strong> to convert debt from fixed rates to variable rates and thereby hedge the risk of changes in<br />
the debt’s fair value attributable to the changes in the benchmark interest rate (LIBOR). The swaps have been accounted for<br />
using the short-cut method as allowed by Financial Accounting Standard (FAS) 133; therefore, no ineffectiveness has been<br />
recorded within the <strong>Corporation</strong>’s Consolidated Financial Statements. In January <strong>2002</strong>, the <strong>Corporation</strong> entered into an<br />
interest rate swap on $250 million of debt with a maturity date of December 2006. In May <strong>2002</strong>, the <strong>Corporation</strong> entered<br />
into an interest rate swap on $150 million of debt with a maturity date of February 2023. This swap contained a call option<br />
that matches the call option of the underlying hedged debt, as allowed by FAS 133. In January 2003, the swap’s counterparty<br />
exercised their option to cancel the swap, effective February 1, 2003. Similarly, the <strong>Corporation</strong> has exercised its option to<br />
redeem the underlying debt. As of December 31, <strong>2002</strong> and 2001, the <strong>Corporation</strong> had approximately $898 million and $598<br />
million of interest rate swaps, respectively.<br />
46
Fuel Strategy – As a result of the significance of the <strong>Corporation</strong>’s fuel costs and the historical volatility of fuel prices, the<br />
<strong>Corporation</strong>’s transportation subsidiaries periodically use swaps, futures and/or forward contracts to mitigate adverse fuel<br />
price changes. In addition, the <strong>Corporation</strong> at times may use fuel swaptions to secure more favorable swap prices. The<br />
following is a summary of the <strong>Corporation</strong>’s derivative financial instruments at December 31, <strong>2002</strong> and 2001:<br />
Millions, Except Percentages and Average Commodity Prices <strong>2002</strong> 2001<br />
Interest rate hedging:<br />
Amount of debt hedged ..................................................................................................... $898 $598<br />
Percentage of total debt portfolio ...................................................................................... 12% 7%<br />
Rail fuel hedging/swaptions:<br />
Number of gallons hedged for <strong>2002</strong>[a] ............................................................................. 552 567<br />
Average price of <strong>2002</strong> hedges (per gallon) [b] .................................................................. $0.56 $0.56<br />
Number of gallons hedged for 2003[c] ............................................................................. 88 63<br />
Average price of 2003 hedges outstanding (per gallon)[b] .............................................. $0.58 $0.56<br />
Trucking fuel hedging:<br />
Number of gallons hedged for <strong>2002</strong>[a] ............................................................................. 9 9<br />
Average price of <strong>2002</strong> hedges outstanding (per gallon)[b] .............................................. $0.58 $0.58<br />
Number of gallons hedged for 2003[c] ............................................................................. 3 3<br />
Average price of 2003 hedges outstanding (per gallon)[b] .............................................. $0.58 $0.58<br />
[a] Fuel hedges which were in effect during <strong>2002</strong>.<br />
[b] Excluded taxes, transportation costs and regional pricing spreads.<br />
[c] Fuel hedges which are in effect during 2003. These hedges expire December 31, 2003.<br />
The fair value asset and liability positions of the <strong>Corporation</strong>’s outstanding derivative financial instruments at December<br />
31, <strong>2002</strong> and 2001 were as follows:<br />
Millions of Dollars <strong>2002</strong> 2001<br />
Interest rate hedging:<br />
Gross fair value asset position............................................................................................ $ 52 $(13<br />
Gross fair value (liability) position .................................................................................... - -<br />
Rail fuel hedging:<br />
Gross fair value asset position............................................................................................ 12 -<br />
Gross fair value (liability) position .................................................................................... - (11)<br />
Rail fuel swaptions:<br />
Gross fair value asset position............................................................................................ - -<br />
Gross fair value (liability) position .................................................................................... - (24)<br />
Trucking fuel hedging:<br />
Gross fair value asset position............................................................................................ 1 -<br />
Gross fair value (liability) position .................................................................................... - -<br />
Total net fair value asset (liability) position, net.................................................................... $ 65 $(22)<br />
Fuel hedging positions will be reclassified from accumulated other comprehensive income (loss) to fuel expense over the<br />
life of the hedge as fuel is consumed. During 2003, the <strong>Corporation</strong> expects fuel expense to decrease $13 million from this<br />
reclassification.<br />
47
The <strong>Corporation</strong>’s use of derivative financial instruments had the following impact on pre-tax income for the years ended<br />
December 31, <strong>2002</strong>, 2001 and 2000:<br />
Millions of Dollars <strong>2002</strong> 2001 2000<br />
Decrease in interest expense from interest rate hedging .............................. $ 29 $ 4 $ -<br />
Decrease (increase) in fuel expense from rail fuel hedging.......................... 36 (14) 52<br />
Decrease (increase) in fuel expense from rail fuel swaptions....................... 19 (6) -<br />
Decrease in fuel expense from trucking fuel hedging................................... 1 - 2<br />
Decrease (increase) in operating expenses .................................................... 85 (16) 54<br />
Increase (decrease) in other income, net from rail fuel swaptions .............. 5 (18) -<br />
Increase (decrease) in pre-tax income ........................................................... $ 90 $(34) $ 54<br />
Fair Value of Debt Instruments – The fair value of the <strong>Corporation</strong>’s long- and short-term debt has been estimated using<br />
quoted market prices or current borrowing rates. At December 31, <strong>2002</strong> and 2001, the fair value of total debt exceeded the<br />
carrying value by approximately $991 million and $254 million, respectively. At December 31, <strong>2002</strong> and December 31, 2001,<br />
approximately $513 million and $850 million, respectively, of fixed-rate debt securities contain call provisions that allow the<br />
<strong>Corporation</strong> to retire the debt instruments prior to final maturity subject, in certain cases, to the payment of premiums.<br />
Sale of Receivables – The Railroad has sold, on a 364-day revolving basis, an undivided percentage ownership interest in a<br />
designated pool of accounts receivable to third parties through a bankruptcy-remote subsidiary. Receivables are sold at<br />
carrying value, which approximates fair value. The third parties have designated the Railroad to service the sold receivables.<br />
The amount of receivables sold fluctuates based upon the availability of the designated pool of receivables and is directly<br />
affected by changing business volumes and credit risks. Payments collected from sold receivables can be reinvested in new<br />
receivables on behalf of the buyers. Should the <strong>Corporation</strong>’s credit rating fall below investment grade, the amount of<br />
receivables sold would be reduced, and in certain cases, the buyers have the right to discontinue this reinvestment, thus<br />
requiring the Railroad to fund the receivables. At December 31, <strong>2002</strong> and 2001, accounts receivable are presented net of $600<br />
million of receivables sold.<br />
3. Properties<br />
At December 31, <strong>2002</strong> and 2001, major property accounts were as follows:<br />
Millions of Dollars <strong>2002</strong> 2001<br />
Railroad:<br />
Road and other.................................................................................................................... $29,370 $27,934<br />
Equipment........................................................................................................................... 7,451 7,507<br />
Total railroad ............................................................................................................................ 36,821 35,441<br />
Trucking.................................................................................................................................... 977 954<br />
Other ......................................................................................................................................... 40 41<br />
Total........................................................................................................................................... $37,838 $36,436<br />
At December 31, <strong>2002</strong> and 2001, major accumulated depreciation accounts were as follows:<br />
Millions of Dollars <strong>2002</strong> 2001<br />
Railroad:<br />
Road and other.................................................................................................................... $5,461 $4,910<br />
Equipment........................................................................................................................... 2,380 2,267<br />
Total railroad ............................................................................................................................ 7,841 7,177<br />
Trucking.................................................................................................................................... 476 453<br />
Other ......................................................................................................................................... 16 14<br />
Total........................................................................................................................................... $8,333 $7,644<br />
48
4. Income Taxes<br />
Components of income tax expense were as follows for the years ended December 31, <strong>2002</strong>, 2001 and 2000:<br />
Millions of Dollars <strong>2002</strong> 2001 2000<br />
Current:<br />
Federal ........................................................................................................ $ 94 $ 133 $ 18<br />
State............................................................................................................. 8 10 3<br />
Total current. ................................................................................................... 102 143 21<br />
Deferred:<br />
Federal ........................................................................................................ 508 374 423<br />
State............................................................................................................. 65 50 24<br />
Total deferred................................................................................................... 573 424 447<br />
Total.................................................................................................................. $ 675 $ 567 $ 468<br />
Deferred income tax liabilities (assets) were comprised of the following at December 31, <strong>2002</strong> and 2001:<br />
Millions of Dollars <strong>2002</strong> 2001<br />
Current liabilities...................................................................................................................... $ (346) $ (341)<br />
Alternative minimum tax credits ............................................................................................ (211) -<br />
Net operating loss..................................................................................................................... - (59)<br />
Net current deferred income tax asset .................................................................................... (557) (400)<br />
Excess tax over book depreciation .......................................................................................... 8,190 7,813<br />
State taxes, net .......................................................................................................................... 609 577<br />
Retirement benefits .................................................................................................................. (337) (287)<br />
Alternative minimum tax credits ............................................................................................ (140) (315)<br />
Net operating loss..................................................................................................................... - (96)<br />
Other ......................................................................................................................................... 156 190<br />
Net long-term deferred income tax liability........................................................................... 8,478 7,882<br />
Net deferred income tax liability............................................................................................. $ 7,921 $ 7,482<br />
For the years ending December 31, <strong>2002</strong>, 2001 and 2000, a reconciliation between statutory and effective tax rates of<br />
continuing operations is as follows:<br />
Percentages <strong>2002</strong> 2001 2000<br />
Statutory tax rate............................................................................................. 35.0% 35.0% 35.0%<br />
State taxes-net.................................................................................................. 2.3 2.5 1.4<br />
Dividend exclusion.......................................................................................... (0.6) (0.8) (1.1)<br />
Prior years’ income tax examinations ............................................................ (3.0) (0.1) -<br />
Other ................................................................................................................ (0.2) 0.4 0.4<br />
Effective tax rate .............................................................................................. 33.5% 37.0% 35.7%<br />
During <strong>2002</strong>, the <strong>Corporation</strong> made considerable progress on a number of significant income tax examination issues for<br />
prior tax years. Most of the <strong>Corporation</strong>’s tax issues relating to 1986 through 1994, as well as some issues for 1995 through<br />
1998, have now been substantially resolved, resulting in a decrease in income tax expense of $67 million in <strong>2002</strong>.<br />
All federal income tax years prior to 1986 are closed, and most issues for 1986 through 1994 have been resolved. Years<br />
1995 through 1998 are currently under examination by the IRS.<br />
The <strong>Corporation</strong> believes it has adequately reserved for federal and state income taxes.<br />
49
5. Debt<br />
Total debt as of December 31, <strong>2002</strong> and 2001, including interest rate swaps designated as hedges, is summarized below:<br />
Millions of Dollars <strong>2002</strong> 2001<br />
Notes and debentures, 2.0% to 8.4% due through 2054 [a] ................................................. $4,744 $4,682<br />
Capitalized leases, 5.4% to 12.8% due through 2024 ............................................................ 1,458 1,441<br />
Medium-term notes, 6.3% to 10.0% due through 2020 [a].................................................. 704 736<br />
Equipment obligations, 6.3% to 10.3% due through 2019 ................................................... 534 619<br />
Term floating-rate debt............................................................................................................ - 300<br />
Mortgage bonds, 4.3% to 4.8% due through 2030 ................................................................ 153 153<br />
Tax-exempt financings, 3.3% to 5.7% due through 2026...................................................... 168 168<br />
Commercial paper and bid notes, average of 2.9% in <strong>2002</strong> and 5.1% in 2001.................... - 34<br />
Unamortized discount ............................................................................................................. (57) (53)<br />
Total debt .................................................................................................................................. 7,704 8,080<br />
Less current portion................................................................................................................. (276) (194)<br />
Total long-term debt ................................................................................................................ $7,428 $7,886<br />
[a]<br />
<strong>2002</strong> and 2001 includes a collective write-up of $52 million and $13 million, respectively, due to market value adjustments for debt with<br />
qualifying hedges that are recorded as assets on the Consolidated Statements of Financial Position.<br />
Debt Maturities – Aggregate debt maturities as of December 31, <strong>2002</strong>, excluding market value adjustments, are as follows:<br />
Millions of Dollars<br />
2003.................................................................................................................................................................... $ 276<br />
2004.................................................................................................................................................................... 673<br />
2005.................................................................................................................................................................... 677<br />
2006.................................................................................................................................................................... 658<br />
2007.................................................................................................................................................................... 788<br />
Thereafter........................................................................................................................................................... 4,580<br />
Total debt ........................................................................................................................................................... $ 7,652<br />
In January 2003, the <strong>Corporation</strong> called its $150 million 7-7/8% debentures due February 1, 2023, for redemption in<br />
February 2003.<br />
Mortgaged Properties – At December 31, <strong>2002</strong> and 2001, approximately $9.5 billion and $9.4 billion, respectively, of<br />
Railroad properties secure outstanding equipment obligations and mortgage bonds.<br />
Credit Facilities – The <strong>Corporation</strong> had no commercial paper borrowings outstanding as of December 31, <strong>2002</strong>.<br />
Commercial paper is issued from time to time for working capital needs and is supported by $1.875 billion in revolving<br />
credit facilities, of which $875 million expires in March 2003, with the remaining $1.0 billion expiring in 2005. The credit<br />
facility for $875 million includes $825 million that was entered into during March <strong>2002</strong> and $50 million entered into during<br />
June <strong>2002</strong>. The $1.0 billion credit facility was entered into during March 2000. The <strong>Corporation</strong> has the option to hold<br />
higher cash balances in addition to or in replacement of the credit facilities to support commercial paper. These credit<br />
facilities also allow for borrowings at floating (LIBOR-based) rates, plus a spread, depending upon the <strong>Corporation</strong>’s senior<br />
unsecured debt ratings. The credit facilities are designated for general corporate purposes, and none of the credit facilities<br />
were used as of December 31, <strong>2002</strong>. Commitment fees and interest rates payable under the facilities are similar to fees and<br />
rates available to comparably rated investment-grade borrowers. The <strong>Corporation</strong> is reviewing rollover options for the credit<br />
facility that expires in March 2003. To the extent the <strong>Corporation</strong> has long-term credit facilities available, commercial paper<br />
borrowings and other current maturities of long-term debt of $188 million and $674 million as of December 31, <strong>2002</strong> and<br />
2001, respectively, have been reclassified as long-term debt maturing in the years 2004 and 2003, respectively. This<br />
reclassification reflects the <strong>Corporation</strong>’s intent to refinance these short-term borrowings and current maturities of longterm<br />
debt on a long-term basis through the issuance of additional commercial paper or new long-term financings, or by<br />
using the currently available long-term credit facility if alternative financing is not available.<br />
50
Convertible Preferred Securities – <strong>Union</strong> <strong>Pacific</strong> Capital Trust (the Trust), a statutory business trust sponsored and wholly<br />
owned by the <strong>Corporation</strong>, issued $1.5 billion aggregate liquidation amount of 6.25% Convertible Preferred Securities (the<br />
CPS) in April 1998. Each of the CPS has a stated liquidation amount of $50 and is convertible, at the option of the holder,<br />
into shares of UPC’s common stock, par value $2.50 per share (the Common Stock), at the rate of 0.7257 shares of Common<br />
Stock for each of the CPS, equivalent to a conversion price of $68.90 per share of Common Stock, subject to adjustment<br />
under certain circumstances. The CPS accrues and pays cash distributions quarterly in arrears at the annual rate of 6.25%<br />
of the stated liquidation amount. The <strong>Corporation</strong> owns all of the common securities of the Trust. The proceeds from the<br />
sale of the CPS and the common securities of the Trust were invested by the Trust in $1.5 billion aggregate principal amount<br />
of the <strong>Corporation</strong>’s 6.25% Convertible Junior Subordinated Debentures due April 1, 2028 (the Debentures). The<br />
Debentures represent the sole assets of the Trust. The principal amount of the Debentures held by the Trust at December<br />
31, <strong>2002</strong>, was $1.5 billion.<br />
The Debentures accrue and pay interest quarterly in arrears at the annual rate of 6.25%. The Debentures mature on April<br />
1, 2028, unless previously redeemed or repurchased in accordance with the terms of the indenture (the Indenture). The<br />
proceeds from the issuance of the Debentures were used by the <strong>Corporation</strong> for repayment of corporate borrowings.<br />
The <strong>Corporation</strong> has guaranteed, on a subordinated basis, distributions and other payments due on the CPS (the<br />
Guarantee). Considered together, the <strong>Corporation</strong>’s obligations under the Debentures, the Indenture, the Guarantee and the<br />
Amended and Restated Declaration of Trust governing the Trust provide a full and unconditional guarantee by the<br />
<strong>Corporation</strong> of the Trust’s obligations under the CPS.<br />
For financial reporting purposes, the <strong>Corporation</strong> has recorded distributions payable on the CPS as an interest charge to<br />
earnings in the Consolidated Statements of Income.<br />
Shelf Registration Statement and Other Significant Financings – During January <strong>2002</strong>, under an existing shelf registration<br />
statement, the <strong>Corporation</strong> issued $300 million of 6-1/8% fixed rate debt with a maturity of January 15, 2012. The proceeds<br />
from the issuance were used for repayment of debt and other general corporate purposes. In April <strong>2002</strong>, the <strong>Corporation</strong><br />
called its $150 million, 8-5/8% debentures due May 15, 2022 for redemption in May <strong>2002</strong>. The <strong>Corporation</strong> issued $350<br />
million of 6-1/2% fixed rate debt with a maturity of April 15, 2012, in order to fund the redemption. The <strong>Corporation</strong> used<br />
the remaining proceeds to repay other debt and for other general corporate purposes. On May 17, <strong>2002</strong>, the <strong>Corporation</strong><br />
issued the remaining $50 million of debt under the existing shelf registration statement. The debt carries a fixed rate of 5-<br />
3/4% with a maturity of October 15, 2007. The proceeds from the issuance were used for repayment of debt and other<br />
general corporate purposes.<br />
The <strong>Corporation</strong> filed a $1.0 billion shelf registration statement, which became effective in July <strong>2002</strong>. Under the shelf<br />
registration statement, the <strong>Corporation</strong> may issue, from time to time, any combination of debt securities, preferred stock,<br />
common stock or warrants for debt securities or preferred stock in one or more offerings. At December 31, <strong>2002</strong>, the<br />
<strong>Corporation</strong> had $1.0 billion remaining for issuance under the shelf registration. The <strong>Corporation</strong> has no immediate plans<br />
to issue equity securities.<br />
During June <strong>2002</strong>, UPRR entered into a capital lease covering new locomotives. The related capital lease obligation<br />
totaled approximately $126 million and is included in the Consolidated Statements of Financial Position as debt.<br />
Dividend Restrictions – The <strong>Corporation</strong> is subject to certain restrictions related to the payment of cash dividends. The<br />
amount of retained earnings available for dividends under the most restrictive test was $5.2 billion and $4.1 billion at<br />
December 31, <strong>2002</strong> and 2001, respectively. In the fourth quarter of <strong>2002</strong>, the Board of Directors voted to increase the<br />
quarterly dividend by 15% to 23 cents per share. The <strong>Corporation</strong> declared dividends of $210 million in <strong>2002</strong> and $199<br />
million in 2001.<br />
51
6. Leases<br />
The <strong>Corporation</strong> leases certain locomotives, freight cars, trailers and other property. Future minimum lease payments for<br />
operating and capital leases with initial or remaining non-cancelable lease terms in excess of one year as of December 31,<br />
<strong>2002</strong> were as follows:<br />
Operating Capital<br />
Millions of Dollars Leases Leases<br />
2003........................................................................................................................................... $ 444 $ 210<br />
2004........................................................................................................................................... 398 214<br />
2005........................................................................................................................................... 363 193<br />
2006........................................................................................................................................... 320 190<br />
2007........................................................................................................................................... 257 170<br />
Later Years................................................................................................................................. 1,519 1,469<br />
Total minimum lease payments .............................................................................................. $ 3,301 2,446<br />
Amount representing interest.................................................................................................. (988)<br />
Present value of minimum lease payments ............................................................................ $ 1,458<br />
Rent expense for operating leases with terms exceeding one month was $605 million in <strong>2002</strong>, $590 million in 2001 and<br />
$569 million in 2000. Contingent rentals and sub-rentals are not significant.<br />
7. Retirement Plans<br />
Thrift Plan – The <strong>Corporation</strong> provides a defined contribution plan (thrift plan) to eligible non-union employees. The<br />
<strong>Corporation</strong>’s contributions into the thrift plan are based on 50% of the participant’s contribution, limited to 3% of the<br />
participant’s base salary. <strong>Corporation</strong> thrift plan contributions were $21 million, $21 million and $20 million for the years<br />
ended December 31, <strong>2002</strong>, 2001, and 2000, respectively.<br />
Railroad Retirement System – All Railroad employees are covered by the Railroad Retirement System (the System). On<br />
December 21, 2001, The Railroad Retirement and Survivors’ Improvement Act of 2001 (the Act) was signed into law. The Act<br />
was a result of historic cooperation between rail management and labor, and provides improved railroad retirement benefits<br />
for employees and reduced payroll taxes for employers. Contributions made to the System are expensed as incurred and<br />
amounted to approximately $595 million in <strong>2002</strong>, $607 million in 2001 and $611 million in 2000.<br />
Other Postretirement Benefits – All non-union and certain of the <strong>Corporation</strong>’s union employees participate in defined<br />
contribution medical and life insurance programs for retirees. The <strong>Corporation</strong> also provides medical and life insurance<br />
benefits on a cost sharing basis for qualifying employees. These costs are funded as incurred.<br />
Pension Plans – The <strong>Corporation</strong> provides defined benefit retirement income to eligible non-union employees through<br />
qualified and non-qualified (supplemental) pension plans. Qualified and non-qualified pension benefits are based on years<br />
of service and the highest compensation during the latest years of employment. The qualified plans are funded based on the<br />
Projected Unit Credit actuarial funding method and are funded at not less than the minimum funding standards set forth<br />
in the Employee Retirement Income Security Act of 1974, as amended and not more than the maximum amount deductible<br />
for tax purposes. The <strong>Corporation</strong> has settled a portion of the non-qualified unfunded supplemental plan’s accumulated<br />
benefit obligation by purchasing annuities.<br />
52
Changes in the <strong>Corporation</strong>’s projected benefit obligation are as follows for the years ended December 31, <strong>2002</strong> and 2001:<br />
Pension<br />
Other Postretirement<br />
Benefits<br />
Benefits<br />
Millions of Dollars <strong>2002</strong> 2001 <strong>2002</strong> 2001<br />
Net benefit obligation at beginning of year.......................... $2,321 $2,121 $580 $438<br />
Service cost ............................................................................. 49 47 10 9<br />
Interest cost............................................................................. 166 158 43 36<br />
Plan amendments................................................................... (1) (19) (48) 2<br />
Actuarial loss .......................................................................... 99 82 117 135<br />
Acquisitions ............................................................................ - 7 - -<br />
Special termination benefits .................................................. - 59 - 1<br />
Gross benefits paid................................................................. (152) (134) (55) (41)<br />
Net benefit obligation at end of year .................................... $2,482 $2,321 $647 $580<br />
As part of the work force reduction plan, discussed in note 13, the <strong>Corporation</strong> reclassified $59 million for pension and<br />
$1 million for other postretirement benefits in 2001, from other current liabilities to retiree benefits obligation.<br />
Changes in the <strong>Corporation</strong>’s benefit plan assets are as follows for the years ended December 31, <strong>2002</strong> and 2001:<br />
Pension<br />
Other Postretirement<br />
Benefits<br />
Benefits<br />
Millions of Dollars <strong>2002</strong> 2001 <strong>2002</strong> 2001<br />
Fair value of plan assets at beginning of year....................... $1,931 $2,240 $ - $ -<br />
Actual return on plan assets .................................................. (211) (190) - -<br />
Voluntary funded pension plan contributions..................... 225 - - -<br />
Unfunded plan contributions................................................ 9 9 55 41<br />
Acquisitions ............................................................................ - 6 - -<br />
Gross benefits paid................................................................. (152) (134) (55) (41)<br />
Fair value of plan assets at end of year ................................. $1,802 $1,931 $ - $ -<br />
As of December 31, <strong>2002</strong>, the <strong>Corporation</strong> had pension plans with accumulated benefits that exceeded the fair value of<br />
plan assets. The accumulated benefit obligation for these plans was $2.4 billion while the fair value of the assets was $1.8<br />
billion at the end of <strong>2002</strong>.<br />
The components of the funded status of the benefit plans for the years ended December 31, <strong>2002</strong> and 2001 were as follows:<br />
Pension<br />
Other Postretirement<br />
Benefits<br />
Benefits<br />
Millions of Dollars <strong>2002</strong> 2001 <strong>2002</strong> 2001<br />
Funded status at end of year.................................................. $(680) $(390) $(647) $(580)<br />
Unrecognized net actuarial (gain) loss ................................. 487 (38) 204 92<br />
Unrecognized prior service cost (credit) .............................. 80 95 (57) (12)<br />
Unrecognized net transition obligation................................ (3) (5) - -<br />
Net liability recognized at end of year .................................. $(116) $(338) $(500) $(500)<br />
At December 31, <strong>2002</strong> and 2001, $53 million and $37 million, respectively, of the total pension and other postretirement<br />
liability were classified as a current liability.<br />
The <strong>Corporation</strong> decreased its assumed long-term rate of return on pension plan assets, during <strong>2002</strong>, from 10% to 9%.<br />
This assumption change resulted in an increase to <strong>2002</strong> pension expense of $22 million.<br />
During <strong>2002</strong>, actual asset returns for the <strong>Corporation</strong>’s pension plans were adversely impacted by continued deterioration<br />
in the equity markets. Actual return on pension plan assets was approximately negative 10% in <strong>2002</strong>. During the same time,<br />
corporate bond yields, which are used in determining the discount rate for future pension obligations, continued to decline.<br />
As a result of negative asset returns and lower discount rates, the <strong>Corporation</strong> was required to recognize an additional<br />
53
minimum pension liability. The liability was recorded as a $225 million after-tax reduction to common shareholders’ equity<br />
as part of accumulated other comprehensive income (loss). The equity reduction would be restored to the balance sheet in<br />
future periods when the fair value of plan assets exceeds the accumulated benefit obligations. Recognition of this reduction<br />
to equity does not affect net income or cash flow in <strong>2002</strong> and has no impact on compliance with debt covenants.<br />
While the interest rate and asset return environment has significantly impacted the funded status of the <strong>Corporation</strong>’s<br />
plans, the <strong>Corporation</strong> does not currently have minimum funding requirements, as set forth in employee benefit and tax<br />
laws. Even though no minimum funding is required, the <strong>Corporation</strong> voluntarily contributed $100 million to its <strong>Union</strong><br />
<strong>Pacific</strong> pension plan, and $125 million to OTC’s pension plan during <strong>2002</strong>.<br />
Amounts recognized for the benefit plan liabilities in the Consolidated Statements of Financial Position for December 31,<br />
<strong>2002</strong> and 2001 consisted of:<br />
Pension<br />
Other Postretirement<br />
Benefits<br />
Benefits<br />
Millions of Dollars <strong>2002</strong> 2001 <strong>2002</strong> 2001<br />
Prepaid benefit cost................................................................ $ 6 $ 5 $ - $ -<br />
Accrued benefit cost............................................................... (122) (343) (500) (500)<br />
Additional minimum liability ............................................... (454) (33) - -<br />
Intangible assets...................................................................... 80 22 - -<br />
Accumulated other comprehensive income ......................... 374 11 - -<br />
Net liability recognized at end of year .................................. $(116) $(338) $(500) $(500)<br />
The components of the <strong>Corporation</strong>’s net periodic pension and other postretirement costs (income) for the years ended<br />
December 31, <strong>2002</strong>, 2001 and 2000 were as follows:<br />
Pension<br />
Other Postretirement<br />
Benefits<br />
Benefits<br />
Millions of Dollars <strong>2002</strong> 2001 2000 <strong>2002</strong> 2001 2000<br />
Service cost ............................................................................. $ 49 $ 47 $ 38 $ 10 $ 9 $ 7<br />
Interest cost............................................................................. 166 158 150 43 36 32<br />
Expected return on assets ...................................................... (200) (213) (197) - - -<br />
Amortization of:<br />
Transition obligation ........................................................ (2) (4) (3) - - -<br />
Prior service cost (credit) ................................................. 14 17 16 (3) (3) (5)<br />
Actuarial loss (gain).......................................................... (15) (28) (31) 6 1 (3)<br />
Total net periodic benefit cost (income) .............................. $ 12 $ (23) $ (27) $ 56 $ 43 $ 31<br />
At December 31, <strong>2002</strong> and 2001, approximately 34% and 32%, respectively, of the funded plans’ assets each year were held<br />
in fixed-income and short-term securities, with the remainder in equity securities.<br />
The weighted-average actuarial assumptions for the years ended December 31, <strong>2002</strong>, 2001 and 2000 were as follows:<br />
Pension<br />
Other Postretirement<br />
Benefits<br />
Benefits<br />
Percentages <strong>2002</strong> 2001 2000 <strong>2002</strong> 2001 2000<br />
Discount rate .......................................................................... 6.75% 7.25% 7.50% 6.75% 7.25% 7.50%<br />
Expected return on plan assets.............................................. 9.0 10.0 10.0 N/A N/A N/A<br />
Rate of compensation increase.............................................. 3.75 4.25 4.50 3.75 4.25 4.50<br />
Health care cost trend:<br />
Current .............................................................................. N/A N/A N/A 10.00 7.70 7.70<br />
Level in 2008...................................................................... N/A N/A N/A 5.00 5.50 5.50<br />
54
Assumed health care cost trend rates have a significant effect on the amount reported for health care plans. A onepercentage<br />
point change in the assumed health care cost trend rates would have the following effects on other postretirement<br />
benefits:<br />
One % pt. One % pt.<br />
Millions of Dollars Increase Decrease<br />
Effect on total service and interest cost components............................................................. $ 6 $ (5)<br />
Effect on postretirement benefit obligation ........................................................................... 64 (56)<br />
8. Stock Options and Other Stock Plans<br />
The <strong>Corporation</strong> has no options outstanding under the 1988 Stock Option and Restricted Stock Plan of <strong>Union</strong> <strong>Pacific</strong><br />
<strong>Corporation</strong> (1988 Plan) and 11,146,185 options outstanding under the 1993 Stock Option and Retention Stock Plan of<br />
<strong>Union</strong> <strong>Pacific</strong> <strong>Corporation</strong> (1993 Plan). There are 1,585,709 retention shares and stock units (the right to receive shares of<br />
common stock) outstanding under the 1993 Plan. There are 10,710 restricted shares outstanding under the 1992 Restricted<br />
Stock Plan for Non-Employee Directors of <strong>Union</strong> <strong>Pacific</strong> <strong>Corporation</strong> (1992 Directors Plan). The <strong>Corporation</strong> no longer<br />
grants options or awards of restricted stock under the 1988 Plan, the 1993 Plan or the 1992 Directors Plan.<br />
The UP Shares Stock Option Plan of <strong>Union</strong> <strong>Pacific</strong> <strong>Corporation</strong> (UP Shares Plan) was approved by UPC’s Board of<br />
Directors on April 30, 1998. The UP Shares Plan reserved 12,000,000 shares of UPC common stock for issuance. The UP<br />
Shares Plan was a broad-based option program that granted eligible active employees on April 30, 1998 an option to<br />
purchase 200 shares of UPC common stock at $55.00 per share. All options granted were non-qualified options that became<br />
exercisable on May 1, 2001 and remain exercisable until April 30, 2008. If an optionee’s employment terminates for any<br />
reason, the option remains exercisable for a period of one year after the date of termination, but no option is exercisable after<br />
April 30, 2008. Pursuant to the terms of the UP Shares Plan, no options may be granted after April 30, 1998. As of December<br />
31, <strong>2002</strong>, there were 8,042,120 options outstanding under the UP Shares Plan.<br />
The <strong>Corporation</strong> adopted the Executive Stock Purchase Incentive Plan (ESPIP) effective October 1, 1999, in order to<br />
encourage and facilitate ownership of UPC common stock by officers and other key executives of the <strong>Corporation</strong> and its<br />
subsidiaries. Under the ESPIP, participants purchased a total of 1,008,000 shares of UPC common stock with the proceeds<br />
of 6.02% interest-bearing, full recourse loans from the <strong>Corporation</strong>. Loans totaled $47 million and have a final maturity<br />
date of January 31, 2006. Deferred cash payments were to be awarded to the participants to repay interest and the loan<br />
principal if certain performance and retention criteria were met within a 40-month period ending January 31, 2003.<br />
Dividends paid on the purchased shares were originally assigned to the <strong>Corporation</strong> to offset the accrued interest on the loan<br />
balance until March 2001 when the first performance criterion was satisfied and, accordingly thereafter, the dividends on the<br />
purchased shares were paid directly to the participants. Satisfaction of the first performance criterion also entitled<br />
participants to receive a cash payment equal to the net accrued interest on the outstanding principal balance of the loan.<br />
Satisfaction of the second performance criterion, in December <strong>2002</strong>, entitled participants to receive a cash payment equal to<br />
one-third of the outstanding principal balance of their loan, and satisfaction of the retention criterion of continued<br />
employment with the <strong>Corporation</strong> until January 31, 2003, entitled participants to receive an additional cash payment equal<br />
to one-third of the outstanding principal balance of their loan. Such payments shall be applied against the participants’<br />
outstanding loan balance pursuant to the terms of the ESPIP. The remaining balance of the loan is payable in three equal<br />
installments on January 31, 2004, January 31, 2005 and January 31, 2006.<br />
In April 2000, the shareholders approved the <strong>Union</strong> <strong>Pacific</strong> <strong>Corporation</strong> 2000 Directors Plan (Directors Plan) whereby<br />
550,000 shares of UPC common stock were reserved for issuance to non-employee directors of the <strong>Corporation</strong>. Under the<br />
Directors Plan, each non-employee director, upon his or her initial election to the Board of Directors, receives a grant of<br />
1,000 shares of restricted shares or restricted stock units. Additionally, each non-employee director receives annually an<br />
option to purchase a number of shares of UPC common stock, not to exceed 5,000 shares during any calendar year,<br />
determined by dividing 60,000 by 1/3 of the fair market value of one share of UPC common stock on the date of such Board<br />
of Directors meeting, with the resulting quotient rounded up or down to the nearest 50 shares. As of December 31, <strong>2002</strong>,<br />
there were 3,000 restricted shares outstanding under the Directors Plan and there were 72,050 options outstanding under<br />
the Directors Plan.<br />
In November 2000, the <strong>Corporation</strong> approved the 2001 Long Term Plan (LTP). Participants were awarded retention<br />
shares or stock units and cash awards subject to the attainment of certain performance targets and continued employment<br />
55
through January 31, 2004. The LTP performance criteria include three year (for fiscal years 2001, <strong>2002</strong> and 2003) cumulative<br />
earnings per share and stock price targets.<br />
The <strong>Union</strong> <strong>Pacific</strong> <strong>Corporation</strong> 2001 Stock Incentive Plan (2001 Plan) was approved by the shareholders in April 2001.<br />
The 2001 Plan reserved 12,000,000 shares of UPC common stock for issuance to eligible employees of the <strong>Corporation</strong> in<br />
the form of non-qualified options, incentive stock options, retention shares, stock units and incentive bonus awards. Awards<br />
and options under the 2001 Plan may be granted to employees of the <strong>Corporation</strong> and its subsidiaries. Non-employee<br />
directors are not eligible. As of December 31, <strong>2002</strong>, there were 854,931 retention shares and stock units outstanding under<br />
the 2001 Plan, and there were 2,074,950 options outstanding under the 2001 Plan.<br />
Pursuant to the above plans, 9,544,569, 12,461,025, and 6,089,561 shares of UPC common stock were available for grant<br />
at December 31, <strong>2002</strong>, 2001 and 2000, respectively.<br />
Options – Stock options are granted with an exercise price equal to the fair market value of the <strong>Corporation</strong>’s common stock<br />
as of the date of the grant. Options are granted with a 10-year term and are generally exercisable one to two years after the<br />
date of the grant. A summary of the stock options issued under the 1988 Plan, the 1993 Plan, the UP Shares Plan, the<br />
Directors Plan and the 2001 Plan, and changes during the years ending December 31 are as follows:<br />
Year Ended December 31,<br />
<strong>2002</strong> 2001 2000<br />
Weighted Weighted Weighted<br />
-Average -Average -Average<br />
Exercise Exercise Exercise<br />
Shares Price Shares Price Shares Price<br />
Outstanding, beginning of year 23,189,323 $51.12 25,342,300 $50.48 25,391,470 $50.41<br />
Granted 2,107,500 61.14 1,798,150 49.91 253,250 41.96<br />
Exercised (3,814,625) 45.99 (2,044,997) 38.63 (175,900) 30.05<br />
Forfeited (130,093) 54.99 (1,906,130) 54.82 (126,520) 48.64<br />
Outstanding, end of year 21,352,105 $53.00 23,189,323 $51.12 25,342,300 $50.48<br />
Options exercisable at year end 18,897,155 $52.04 21,053,773 $51.13 13,758,817 $47.00<br />
Weighted-average fair value of<br />
options granted during the year $17.78 $13.09 $11.84<br />
The following table summarizes information about the <strong>Corporation</strong>’s outstanding stock options as of December 31, <strong>2002</strong>:<br />
Options Outstanding<br />
Options Exercisable<br />
Weighted-Average Weighted- Weighted-<br />
Range of Number Remaining Average Number Average<br />
Exercise Prices Outstanding Contractual Life Execise Price Exercisable Exercise Price<br />
$20.60 - $41.91 1,224,249 2.82 $33.12 1,224,249 $33.12<br />
$42.87 - $52.53 5,133,671 6.02 47.78 5,130,671 47.78<br />
$52.88 - $62.40 14,994,185 5.34 56.42 12,542,235 55.62<br />
$20.60 - $62.40 21,352,105 5.36 $53.00 18,897,155 $52.04<br />
The fair value of each option grant was estimated on the date of grant using the Black-Scholes option-pricing model, with<br />
the following weighted-average assumptions for options granted in <strong>2002</strong>, 2001, and 2000, respectively: risk-free interest rates<br />
of 4.4%, 4.3% and 5.1%; dividend yield of 1.3%, 1.4% and 1.6%; expected lives of 5 years, 4 years and 4 years; and volatility<br />
of 28.8%, 29.5% and 31.4%.<br />
Restricted Stock and Other Incentive Plans – The <strong>Corporation</strong>’s plans provide for awarding retention shares of common<br />
stock or stock units to eligible employees. These awards are subject to forfeiture if employment terminates during the<br />
prescribed retention period, generally three or four years, or, in some cases, if a certain prescribed stock price or other<br />
financial criteria is not met. Restricted stock awards are issued to non-employee directors and are subject to forfeiture if<br />
certain service requirements are not met. During the year ended December 31, <strong>2002</strong>, 804,956 retention shares, stock units,<br />
and restricted shares were issued at a weighted-average fair value of $58.21. During 2001, 387,540 retention shares, stock<br />
units, and restricted shares were issued at a weighted-average fair value of $49.95. During 2000, 283,059 retention shares,<br />
56
stock units, and restricted shares were issued at a weighted-average fair value of $41.21. The cost of retention and restricted<br />
awards is amortized to expense over the retention period.<br />
Under the LTP, 11,900 performance retention stock units and 1,019,500 performance retention shares and stock units<br />
were issued at a weighted-average fair value of $60.97 and $50.07 during <strong>2002</strong> and 2001, respectively. The cost of the LTP is<br />
expensed over the performance period which ends January 31, 2004.<br />
The cost associated with the ESPIP retention criterion is amortized to expense over the 40-month period. The cost<br />
associated with the ESPIP first performance criterion is expensed over the life of the loan, and the cost associated with the<br />
second performance criterion was expensed in December <strong>2002</strong>.<br />
During the years ended December 31, <strong>2002</strong>, 2001 and 2000, UPC expensed $50 million, $18 million and $18 million,<br />
respectively, related to the other incentive plans described above.<br />
9. Earnings Per Share<br />
The following table provides a reconciliation between basic and diluted earnings per share for the years ended December 31,<br />
<strong>2002</strong>, 2001 and 2000:<br />
Millions, Except Per Share Amounts <strong>2002</strong> 2001 2000<br />
Net income available to common shareholders - basic ................................ $ 1,341 $ 966 $ 842<br />
Dilutive effect of interest associated with the CPS .................................. 58 58 58<br />
Net income available to common shareholders - diluted............................. $ 1,399 $ 1,024 $ 900<br />
Weighted-average number of shares outstanding:<br />
Basic ............................................................................................................ 252.1 248.0 246.5<br />
Dilutive effect of stock options ................................................................. 1.8 1.3 0.6<br />
Dilutive effect of retention shares, stock units and restricted shares...... 1.1 0.8 0.6<br />
Dilutive effect of CPS................................................................................. 21.8 21.8 21.8<br />
Diluted ............................................................................................................. 276.8 271.9 269.5<br />
Common stock options totaling 2.3 million, 12.8 million and 21.5 million shares for <strong>2002</strong>, 2001 and 2000, respectively<br />
were excluded from the computation of diluted EPS because the exercise prices of these options exceeded the average market<br />
price of the <strong>Corporation</strong>’s common stock for the respective periods, and the effect of their inclusion would be anti-dilutive.<br />
10. Commitments and Contingencies<br />
Unasserted Claims – There are various claims and lawsuits pending against the <strong>Corporation</strong> and certain of its subsidiaries.<br />
It is not possible at this time for the <strong>Corporation</strong> to determine fully the effect of all unasserted claims on its consolidated<br />
financial condition, results of operations or liquidity; however, to the extent possible, where unasserted claims can be<br />
estimated and where such claims are considered probable, the <strong>Corporation</strong> has recorded a liability. The <strong>Corporation</strong> does<br />
not expect that any known lawsuits, claims, environmental costs, commitments, contingent liabilities or guarantees will have<br />
a material adverse effect on its consolidated financial condition, results of operations or liquidity.<br />
Personal Injury and Occupational Illness – The cost of injuries to employees and others related to Railroad activities or in<br />
accidents involving the trucking segment is charged to expense based on actuarial estimates of the ultimate cost and number<br />
of incidents each year. During <strong>2002</strong>, the Railroad’s reported number of work-related injuries that resulted in lost job time<br />
decreased 5% compared to the number of injuries reported during 2001, and accidents at grade crossings decreased 16%<br />
compared to 2001. <strong>Annual</strong> expenses for the <strong>Corporation</strong>’s personal injury-related events were $259 million in <strong>2002</strong>, $227<br />
million in 2001 and $226 million in 2000. As of December 31, <strong>2002</strong> and 2001, the <strong>Corporation</strong> had a liability of $724 million<br />
and $743 million, respectively, accrued for future personal injury costs, of which $304 million and $295 million were<br />
recorded in current liabilities as accrued casualty costs. The Railroad has additional amounts accrued for claims related to<br />
certain occupational illnesses. Compensation for Railroad work-related accidents is governed by the Federal Employers’<br />
Liability Act (FELA). Under FELA, damages are assessed based on a finding of fault through litigation or out-of-court<br />
settlements. The Railroad offers a comprehensive variety of services and rehabilitation programs for employees who are<br />
injured at work.<br />
57
Environmental – The <strong>Corporation</strong> generates and transports hazardous and non-hazardous waste in its current and former<br />
operations, and is subject to federal, state and local environmental laws and regulations. The <strong>Corporation</strong> has identified<br />
approximately 433 sites at which it is or may be liable for remediation costs associated with alleged contamination or for<br />
violations of environmental requirements. This includes 52 sites that are the subject of actions taken by the U.S. government,<br />
27 of which are currently on the Superfund National Priorities List. Certain federal legislation imposes joint and several<br />
liability for the remediation of identified sites; consequently, the <strong>Corporation</strong>’s ultimate environmental liability may include<br />
costs relating to activities of other parties, in addition to costs relating to its own activities at each site.<br />
When an environmental issue has been identified with respect to the property owned, leased or otherwise used in the<br />
conduct of the <strong>Corporation</strong>’s business, the <strong>Corporation</strong> and its consultants perform environmental assessments on such<br />
property. The <strong>Corporation</strong> expenses the cost of the assessments as incurred. The <strong>Corporation</strong> accrues the cost of<br />
remediation where its obligation is probable and such costs can be reasonably estimated.<br />
As of December 31, <strong>2002</strong> and 2001, the <strong>Corporation</strong> had a liability of $189 million and $172 million, respectively, accrued<br />
for future environmental costs, of which $72 million and $71 million were recorded in current liabilities as accrued casualty<br />
costs. The liability includes future costs for remediation and restoration of sites, as well as for ongoing monitoring costs,<br />
but excludes any anticipated recoveries from third parties. Cost estimates are based on information available for each site,<br />
financial viability of other potentially responsible parties, and existing technology, laws and regulations. The <strong>Corporation</strong><br />
believes that it has adequately accrued for its ultimate share of costs at sites subject to joint and several liability. However,<br />
the ultimate liability for remediation is difficult to determine because of the number of potentially responsible parties<br />
involved, site-specific cost sharing arrangements with other potentially responsible parties, the degree of contamination by<br />
various wastes, the scarcity and quality of volumetric data related to many of the sites, and/or the speculative nature of<br />
remediation costs. The <strong>Corporation</strong> expects to pay out the majority of the December 31, <strong>2002</strong>, environmental liability over<br />
the next five years, funded by cash generated from operations. The impact of current obligations is not expected to have a<br />
material adverse effect on the results of operations or financial condition of the <strong>Corporation</strong>.<br />
Purchase Obligations and Guarantees – The <strong>Corporation</strong> and its subsidiaries periodically enter into financial and other<br />
commitments in connection with their businesses. The <strong>Corporation</strong> does not expect that these commitments or guarantees<br />
will have a material adverse effect on its consolidated financial condition, results of operations or liquidity.<br />
At December 31, <strong>2002</strong>, the <strong>Corporation</strong> had unconditional purchase obligations of $404 million for the purchase of<br />
locomotives as part of the <strong>Corporation</strong>’s multi-year capital asset acquisition plan. In addition, the <strong>Corporation</strong> was<br />
contingently liable for $368 million in guarantees and $76 million in letters of credit at December 31, <strong>2002</strong>. These contingent<br />
guarantees were entered into in the normal course of business and include guaranteed obligations of affiliated operations.<br />
None of the guarantees individually are significant, and no liability related to these guarantees exists as of December 31,<br />
<strong>2002</strong>. The final guarantee expires in 2022. The <strong>Corporation</strong> is not aware of any existing event of default, which would<br />
require it to satisfy these guarantees.<br />
Other – In December 2001, the Railroad entered into a synthetic operating lease arrangement to finance a new headquarters<br />
building which will be constructed in Omaha, Nebraska. The expected completion date of the building is mid-2004. It will<br />
total approximately 1.1 million square feet with approximately 3,800 office workspaces. The cost to construct the new<br />
headquarters, including capitalized interest, is approximately $260 million. The <strong>Corporation</strong> has guaranteed all of the<br />
Railroad’s obligation under this lease.<br />
UPRR is the construction agent for the lessor during the construction period. The Railroad has guaranteed, in the event<br />
of a loss caused by or resulting from its actions or failures to act as construction agent, 89.9% of the building related<br />
construction costs incurred up to that point during the construction period. Total building related costs incurred and drawn<br />
from the lease funding commitments as of December 31, <strong>2002</strong>, were approximately $50 million. Accordingly, the Railroad’s<br />
guarantee at December 31, <strong>2002</strong>, was approximately $45 million. As construction continues and additional costs are<br />
incurred, this guarantee will increase accordingly.<br />
After construction is complete, UPRR will lease the building under an initial term of five years with provisions for renewal for<br />
an extended period subject to agreement between the Railroad and lessor. At any time during the lease, the Railroad may, at its<br />
option, purchase the building at approximately the amount expended by the lessor to construct the building. If the Railroad elects<br />
not to purchase the building or renew the lease, the building is returned to the lessor for remarketing, and the Railroad has<br />
guaranteed a residual value equal to 85% of the total construction related costs. The guarantee will be approximately $220 million.<br />
58
11. Other Income<br />
Other income included the following:<br />
Millions of Dollars <strong>2002</strong> 2001 2000<br />
Net gain on non-operating asset dispositions............................................... $ 288 $ 133 $ 88<br />
Rental income.................................................................................................. 60 89 75<br />
Interest income................................................................................................ 14 12 11<br />
Fuel swaptions ................................................................................................. 5 (18) -<br />
Other, net......................................................................................................... (42) (54) (44)<br />
Total.................................................................................................................. $ 325 $ 162 $ 130<br />
Included in the <strong>2002</strong> gain on non-operating asset dispositions is a pre-tax gain of $141 million related to the sale of land,<br />
track, operating rights and facilities to the Utah Transit Authority (UTA) for $185 million, which included approximately<br />
175 miles of track that stretches from Brigham City, Utah, through Salt Lake City, Utah, south to Payson, Utah. The<br />
transaction contributed $88 million to the <strong>Corporation</strong>’s earnings on an after-tax basis. An additional $16 million of the pretax<br />
gain has been deferred pending successful completion of arrangements for the relocation of various existing facilities.<br />
Also included in the <strong>2002</strong> gain on non-operating asset dispositions is a pre-tax gain of $73 million related to the sale of<br />
land and track to the Santa Clara Valley Transportation Authority (VTA) for $80 million, which included approximately 15<br />
miles of track that stretches from William Street in San Jose, California, north to Paseo Padre Parkway in Fremont,<br />
California. The transaction contributed $45 million to the <strong>Corporation</strong>’s earnings on an after-tax basis.<br />
12. Accounting Pronouncements<br />
In August 2001, the FASB issued Statement No. 143, “Accounting for Asset Retirement Obligations” (FAS 143). FAS 143 is<br />
effective for the <strong>Corporation</strong> beginning January 1, 2003. FAS 143 requires that the <strong>Corporation</strong> record a liability for the fair<br />
value of an asset retirement obligation when the <strong>Corporation</strong> has a legal obligation to remove the asset. The standard will<br />
affect the way the <strong>Corporation</strong> accounts for track structure removal costs, but will have no impact on liquidity. The<br />
<strong>Corporation</strong> is currently evaluating the impact of this statement on the <strong>Corporation</strong>'s Consolidated Financial Statements.<br />
Any impact resulting from the adoption of this statement will be recorded as a cumulative effect of a change in accounting<br />
principle in the first quarter of 2003.<br />
In June <strong>2002</strong>, the FASB issued Statement No. 146, “Accounting for Costs Associated with Exit or Disposal Activities” (FAS<br />
146). FAS 146 requires that a liability for a cost associated with an exit or disposal activity is recognized at fair value when<br />
the liability is incurred and is effective for exit or disposal activities that are initiated after December 31, <strong>2002</strong>. Management<br />
believes that FAS 146 will not have a material impact on the <strong>Corporation</strong>’s Consolidated Financial Statements.<br />
In November <strong>2002</strong>, the FASB issued Interpretation No. 45, “Guarantor’s Accounting and Disclosure Requirements for<br />
Guarantees, Including Guarantees of Indebtedness of Others” (FIN 45). FIN 45 is effective for guarantees issued or modified<br />
after December 31, <strong>2002</strong>. The disclosure requirements were effective for the year ending December 31, <strong>2002</strong>, which expand<br />
the disclosures required by a guarantor about its obligations under a guarantee. FIN 45 also requires the <strong>Corporation</strong> to<br />
recognize, at the inception of a guarantee, a liability for the fair value of the obligation undertaken in the issuance of the<br />
guarantee. Management does not believe that FIN 45 will have a material impact on the <strong>Corporation</strong>’s Consolidated<br />
Financial Statements.<br />
In December <strong>2002</strong>, the FASB issued Statement No. 148, “Accounting for Stock-Based Compensation – Transition and<br />
Disclosure” (FAS 148). FAS 148 provides alternative methods of transition for voluntary changes to the fair value based<br />
method of accounting for stock-based employee compensation, and amends the disclosure requirements including a<br />
requirement for interim disclosures. The <strong>Corporation</strong> currently discloses the effects of stock-based employee compensation<br />
and does not intend to voluntarily change to the alternative accounting principle.<br />
In January 2003, the FASB issued Interpretation No. 46, “Consolidation of Variable Interest Entities” (FIN 46). FIN 46<br />
requires a variable interest entity to be consolidated by a company if that company is subject to a majority of the risk of loss<br />
from the variable interest entity’s activities or entitled to receive a majority of the entity’s residual returns or both. FIN 46<br />
also requires disclosures about variable interest entities that a company is not required to consolidate but in which it has a<br />
59
significant variable interest. The consolidation requirements of FIN 46 apply immediately to variable interest entities created<br />
after January 31, 2003. The consolidation requirements apply to existing entities in the first fiscal year or interim period<br />
beginning after June 15, 2003. Certain of the disclosure requirements apply in all financial statements issued after January<br />
31, 2003, regardless of when the variable interest entity was established. As described in note 10 to the Consolidated<br />
Financial Statements, Item 8, the Railroad has a synthetic operating lease arrangement to finance a new headquarters<br />
building, which falls within the guidance of FIN 46. In accordance with FIN 46, the Railroad will either consolidate,<br />
restructure or refinance the synthetic lease prior to July 1, 2003. The <strong>Corporation</strong> does not expect FIN 46 to have any impact<br />
on the treatment of the Sale of Receivables program as described in note 2 to the Consolidated Financial Statements.<br />
13. 2000 Work Force Reduction Plan<br />
The <strong>Corporation</strong>’s Board of Directors approved a work force reduction plan (the Plan) in the fourth quarter of 2000. The Plan<br />
called for the elimination of approximately 2,000 Railroad positions during 2001. The <strong>Corporation</strong> accrued $115 million pretax<br />
or $72 million after-tax in the fourth quarter of 2000 for costs related to the Plan. The expense was charged to salaries,<br />
wages and employee benefits in the <strong>Corporation</strong>’s 2000 Consolidated Statements of Income. Plan liability activity in 2001<br />
included $49 million paid in cash or reclassified to contractual liabilities for severance benefits to 571 employees; $60 million<br />
of subsidized early retirement benefits covering 480 employees; with the remaining $6 million charged back against salaries,<br />
wages and employee benefits in the <strong>Corporation</strong>’s Consolidated Statements of Income. In December 2001, the Plan was<br />
completed with positions eliminated through a combination of subsidized early retirements, involuntary layoffs and attrition.<br />
14. Selected Quarterly Data<br />
Selected unaudited quarterly data are as follows:<br />
Millions of Dollars, Except Per Share Amounts<br />
<strong>2002</strong> Mar. 31 June 30 Sep. 30 Dec. 31<br />
Operating revenues ................................................................ $2,967 $3,154 $3,199 $3,171<br />
Operating income .................................................................. 499 602 644 579<br />
Net income ............................................................................. 222 304 437 378<br />
Net income per share<br />
Basic ................................................................................... 0.89 1.21 1.73 1.49<br />
Diluted............................................................................... 0.86 1.15 1.63 1.41<br />
2001 Mar. 31 June 30 Sep. 30 Dec. 31<br />
Operating revenues ................................................................ $2,943 $2,998 $3,026 $3,006<br />
Operating income .................................................................. 439 494 574 565<br />
Net income ............................................................................. 181 243 267 275<br />
Net income per share<br />
Basic ................................................................................... 0.73 0.98 1.08 1.10<br />
Diluted............................................................................... 0.72 0.95 1.04 1.06<br />
****************************************<br />
Item 9. Changes in and Disagreements with Accountants on Accounting and Financial Disclosure<br />
None.<br />
60
PART III<br />
Item 10. Directors and Executive Officers of the Registrant<br />
(a)<br />
Directors of Registrant.<br />
Information as to the names, ages, positions and offices with UPC, terms of office, periods of service, business<br />
experience during the past five years and certain other directorships held by each director or person nominated to<br />
become a director of UPC is set forth in the Election of Directors segment of the Proxy Statement and is incorporated<br />
herein by reference.<br />
(b)<br />
Executive Officers of Registrant.<br />
Information concerning the executive officers of UPC and its subsidiaries is presented in Part I of this <strong>Report</strong> under<br />
Executive Officers of the Registrant and Principal Executive Officers of Subsidiaries.<br />
(c)<br />
Section 16(a) Compliance.<br />
Information concerning compliance with Section 16(a) of the Securities Exchange Act of 1934 is set forth in the<br />
Section 16(a) Beneficial Ownership <strong>Report</strong>ing Compliance segment of the Proxy Statement and is incorporated herein<br />
by reference.<br />
(d)<br />
Code of Ethics for Chief Executive Officer and Senior Financial Officers of Registrant.<br />
The Board of Directors of UPC adopted the UPC Code of Ethics for the Chief Executive Officer and Senior Financial<br />
Officers (the “Code”) on January 30, 2003. A copy of the Code may be found on the Internet at the <strong>Corporation</strong>’s<br />
website www.up.com/investors. The <strong>Corporation</strong> intends to disclose any amendments to the Code or any waiver from<br />
a provision of the Code on its website.<br />
Item 11. Executive Compensation<br />
Information concerning compensation received by UPC’s directors and certain executive officers is presented in the<br />
Compensation of Directors, <strong>Report</strong> on Executive Compensation, Summary Compensation Table, Security Ownership of<br />
Management, Option/SAR Grants Table, Aggregated Option/SAR Exercises in Last Fiscal Year and FY-End Option/SAR<br />
Values Table, Defined Benefit Plans and Change-in-Control Arrangements segments of the Proxy Statement and is<br />
incorporated herein by reference.<br />
Item 12. Security Ownership of Certain Beneficial Owners and Management<br />
Information as to the number of shares of UPC’s equity securities beneficially owned as of February 10, 2003, by each of its<br />
directors and nominees for director, its five most highly compensated executive officers, its directors and executive officers<br />
as a group and certain beneficial owners is set forth in the Election of Directors, Security Ownership of Management and<br />
Security Ownership of Certain Beneficial Owners segments of the Proxy Statement and is incorporated herein by reference.<br />
The following table summarizes the equity compensation plans under which <strong>Union</strong> <strong>Pacific</strong> <strong>Corporation</strong> common stock<br />
may be issued as of December 31, <strong>2002</strong>.<br />
61
Number of securities<br />
Number of securities Weighted-average remaining available for<br />
to be issued upon exercise price of future issuance under equity<br />
exercise of outstanding compensation plans<br />
outstanding options, options, warrants (excluding securities<br />
warrants and rights and rights reflected in column (a))<br />
Plan Category (a) (b) (c)<br />
Equity compensation plans<br />
approved by security holders ................. 13,309,985 $51.80 9,544,569<br />
Equity compensation plans not<br />
approved by security holders [1] [2]..... 8,042,120 $55.00 1,419,697 [3]<br />
Total .............................................................. 21,352,105 $53.00 10,964,266<br />
[1] The UP Shares Stock Option Plan of UPC (UP Shares Plan), the Overnite Transportation Company Employee Stock Purchase Plan<br />
(OTC ESPP) and the Motor Cargo Industries, Inc. Employee Stock Purchase Plan (Motor Cargo ESPP) are the only equity compensation<br />
plans of UPC not approved by shareholders. The UP Shares Plan was approved by UPC’s Board of Directors on April 30, 1998. The UP<br />
Shares Plan reserved 12,000,000 shares of UPC’s common stock for issuance. The UP Shares Plan was a broad-based option program<br />
that granted each eligible, active employee on April 30, 1998 an option to purchase 200 shares of UPC common stock at $55.00 per share.<br />
All options granted were non-qualified options that became exercisable on May 1, 2001 and remain exercisable until April 30, 2008. If<br />
an optionee’s employment terminates for any reason, the option remains exercisable for a period of one year after the date of termination,<br />
but no option is exercisable after April 30, 2008. Pursuant to the terms of the UP Shares Plan, no options may be granted after April 30,<br />
1998.<br />
[2] The OTC ESPP was approved by UPC’s Board of Directors on November 19, 1987 and the Motor Cargo ESPP was approved by UPC’s<br />
Board on November 21, <strong>2002</strong>. Both ESPPs are intended to qualify as an employee stock purchase plan under Section 423 of the Internal<br />
Revenue Code of 1986, as amended. The OTC ESPP initially reserved 1,000,000 shares for issuance and on November 21, 1991 UPC’s<br />
Board increased the number of shares available for issuance to 2,000,000. There are 300,000 shares of UPC’s common stock reserved for<br />
future issuance under the Motor Cargo ESPP. All employees of OTC and Motor Cargo are eligible to participate in their respective ESPP.<br />
Under the ESPPs, eligible employees are permitted to purchase shares of UPC common stock through payroll deductions. Each employee<br />
may subscribe annually to purchase up to 200 shares of UPC common stock, subject to maximum purchase limitations. The purchase<br />
price for the common stock purchased under the ESPPs is the lesser of 95% of the closing price of the common stock on the date that is<br />
seven business days prior to the first day of the applicable offering period (but not less than 85% of the fair market value of the common<br />
stock on the last day of the applicable offering period) or 95% of the closing price of the common stock on the last day of the applicable<br />
purchase period (but not less than 85% of the fair market value of the common stock on such date).<br />
[3] Of these shares, there are currently 1,119,697 shares of UPC’s common stock remaining for future issuance under the OTC ESPP and<br />
there are 300,000 shares of UPC’s common stock reserved for future issuance under the Motor Cargo ESPP.<br />
Item 13. Certain Relationships and Related Transactions<br />
Information on related transactions is set forth in the Certain Relationships and Related Transactions and Compensation<br />
Committee Interlocks and Insider Participation segments of the Proxy Statement and is incorporated herein by reference.<br />
The <strong>Corporation</strong> does not have any relationship with any outside third party which would enable such a party to negotiate<br />
terms of a material transaction that may not be available to, or available from, other parties on an arm’s-length basis.<br />
Item 14. Controls and Procedures<br />
Within 90 days prior to the date of this report, the <strong>Corporation</strong> carried out an evaluation, under the supervision and with<br />
the participation of the <strong>Corporation</strong>’s management, including the <strong>Corporation</strong>’s Chief Executive Officer (CEO) and<br />
Executive Vice President – Finance (EVP – Finance), of the effectiveness of the design and operation of the <strong>Corporation</strong>’s<br />
disclosure controls and procedures pursuant to Exchange Act Rule 13a-14. Based upon that evaluation, the CEO and the<br />
EVP - Finance concluded that the <strong>Corporation</strong>’s disclosure controls and procedures are effective in alerting them, in a timely<br />
manner, to material information relating to the <strong>Corporation</strong> (including its consolidated subsidiaries) required to be included<br />
in the <strong>Corporation</strong>’s periodic SEC filings.<br />
Additionally, the CEO and EVP – Finance determined that there were no significant changes in the <strong>Corporation</strong>’s internal<br />
controls or in other factors that could significantly affect the <strong>Corporation</strong>’s internal controls subsequent to the date of their<br />
most recent evaluation.<br />
62
PART IV<br />
Item 15. Exhibits, Financial Statement Schedules and <strong>Report</strong>s on Form 8-K<br />
(a)<br />
Financial Statements, Financial Statement Schedules and Exhibits:<br />
(1) Financial Statements<br />
The financial statements filed as part of this filing are listed on the index to Consolidated Financial<br />
Statements, Item 8, on page 35.<br />
(2) Financial Statement Schedules<br />
Schedule II – Valuation and Qualifying Accounts<br />
Schedules not listed above have been omitted because they are not applicable or not required or the information<br />
required to be set forth therein is included in the Consolidated Financial Statements, Item 8, or notes thereto.<br />
(3) Exhibits<br />
Exhibits are listed in the exhibit index on page 68. The exhibits include management contracts, compensatory<br />
plans and arrangements required to be filed as exhibits to the Form 10-K by Item 601 (10) (iii) of Regulation S-K.<br />
(b) <strong>Report</strong>s on Form 8-K<br />
On October 24, <strong>2002</strong>, UPC filed a Current <strong>Report</strong> on Form 8-K announcing UPC’s financial results for the<br />
third quarter of <strong>2002</strong>.<br />
On January 22, 2003, UPC filed a Current <strong>Report</strong> on Form 8-K announcing UPC’s financial results for the fourth<br />
quarter of <strong>2002</strong>.<br />
63
SIGNATURES<br />
Pursuant to the requirements of Section 13 or 15(d) of the Securities Exchange Act of 1934, the registrant has duly caused<br />
this report to be signed on its behalf by the undersigned, thereunto duly authorized, on this 21st day of February, 2003.<br />
UNION PACIFIC CORPORATION<br />
By<br />
/s/ Richard K. Davidson<br />
Richard K. Davidson, Chairman,<br />
President, Chief Executive<br />
Officer and Director<br />
Pursuant to the requirements of the Securities Exchange Act of 1934, this report has been signed below, on this 21st day of<br />
February, 2003, by the following persons on behalf of the registrant and in the capacities indicated.<br />
DIRECTORS:<br />
PRINCIPAL EXECUTIVE OFFICER<br />
AND DIRECTOR:<br />
PRINCIPAL FINANCIAL OFFICER:<br />
PRINCIPAL ACCOUNTING OFFICER:<br />
/s/ Richard K. Davidson<br />
Richard K. Davidson, Chairman,<br />
President, Chief Executive<br />
Officer and Director<br />
/s/ James R. Young<br />
James R. Young,<br />
Executive Vice President–Finance<br />
/s/ Richard J. Putz<br />
Richard J. Putz,<br />
Vice President and Controller<br />
Philip F. Anschutz*<br />
Thomas J. Donohue*<br />
Archie W. Dunham*<br />
Spencer F. Eccles*<br />
Ivor J. Evans*<br />
Elbridge T. Gerry, Jr.*<br />
Judith Richards Hope*<br />
Richard J. Mahoney*<br />
Steven R. Rogel*<br />
Ernesto Zedillo Ponce de Leon*<br />
* By /s/ Thomas E. Whitaker<br />
Thomas E. Whitaker, Attorney-in-fact<br />
64
CERTIFICATION OF PRINCIPAL EXECUTIVE OFFICER<br />
I, Richard K. Davidson, certify that:<br />
1. I have reviewed this annual report on Form 10-K of <strong>Union</strong> <strong>Pacific</strong> <strong>Corporation</strong>;<br />
2. Based on my knowledge, this annual report does not contain any untrue statement of a material fact or omit to state a<br />
material fact necessary to make the statements made, in light of the circumstances under which such statements were made,<br />
not misleading with respect to the period covered by this annual report;<br />
3. Based on my knowledge, the financial statements, and other financial information included in this annual report, fairly<br />
present in all material respects the financial condition, results of operations and cash flows of the registrant as of, and for,<br />
the periods presented in this annual report;<br />
4. The registrant’s other certifying officer and I are responsible for establishing and maintaining disclosure controls and<br />
procedures (as defined in Exchange Act Rules 13a-14 and 15d-14) for the registrant and have:<br />
a) designed such disclosure controls and procedures to ensure that material information relating to the registrant,<br />
including its consolidated subsidiaries, is made known to us by others within those entities, particularly during the<br />
period in which this annual report is being prepared;<br />
b) evaluated the effectiveness of the registrant’s disclosure controls and procedures as of a date within 90 days prior<br />
to the filing date of this annual report (the “Evaluation Date”); and<br />
c) presented in this annual report our conclusions about the effectiveness of the disclosure controls and procedures<br />
based on our evaluation as of the Evaluation Date;<br />
5. The registrant’s other certifying officers and I have disclosed, based on our most recent evaluation, to the registrant’s<br />
auditors and the audit committee of registrant’s board of directors (or persons performing the equivalent functions):<br />
a) all significant deficiencies in the design or operation of internal controls which could adversely affect the<br />
registrant’s ability to record, process, summarize and report financial data and have identified for the registrant’s<br />
auditors any material weaknesses in internal controls; and<br />
b) any fraud, whether or not material, that involves management or other employees who have a significant role in<br />
the registrant’s internal controls; and<br />
6. The registrant’s other certifying officer and I have indicated in this annual report whether there were significant changes<br />
in internal controls or in other factors that could significantly affect internal controls subsequent to the date of our most<br />
recent evaluation, including any corrective actions with regard to significant deficiencies and material weaknesses.<br />
Date: February 21, 2003<br />
/s/ Richard K. Davidson<br />
Richard K. Davidson<br />
Chairman, President and<br />
Chief Executive Officer<br />
65
CERTIFICATION OF PRINCIPAL FINANCIAL OFFICER<br />
I, James R. Young, certify that:<br />
1. I have reviewed this annual report on Form 10-K of <strong>Union</strong> <strong>Pacific</strong> <strong>Corporation</strong>;<br />
2. Based on my knowledge, this annual report does not contain any untrue statement of a material fact or omit to state a<br />
material fact necessary to make the statements made, in light of the circumstances under which such statements were made,<br />
not misleading with respect to the period covered by this annual report;<br />
3. Based on my knowledge, the financial statements, and other financial information included in this annual report, fairly<br />
present in all material respects the financial condition, results of operations and cash flows of the registrant as of, and for,<br />
the periods presented in this annual report;<br />
4. The registrant’s other certifying officer and I are responsible for establishing and maintaining disclosure controls and<br />
procedures (as defined in Exchange Act Rules 13a-14 and 15d-14) for the registrant and have:<br />
a) designed such disclosure controls and procedures to ensure that material information relating to the registrant,<br />
including its consolidated subsidiaries, is made known to us by others within those entities, particularly during the<br />
period in which this annual report is being prepared;<br />
b) evaluated the effectiveness of the registrant’s disclosure controls and procedures as of a date within 90 days prior<br />
to the filing date of this annual report (the “Evaluation Date”); and<br />
c) presented in this annual report our conclusions about the effectiveness of the disclosure controls and procedures<br />
based on our evaluation as of the Evaluation Date;<br />
5. The registrant’s other certifying officer and I have disclosed, based on our most recent evaluation, to the registrant’s<br />
auditors and the audit committee of registrant’s board of directors (or persons performing the equivalent functions):<br />
a) all significant deficiencies in the design or operation of internal controls which could adversely affect the<br />
registrant’s ability to record, process, summarize and report financial data and have identified for the registrant’s<br />
auditors any material weaknesses in internal controls; and<br />
b) any fraud, whether or not material, that involves management or other employees who have a significant role in<br />
the registrant’s internal controls; and<br />
6. The registrant’s other certifying officers and I have indicated in this annual report whether there were significant changes<br />
in internal controls or in other factors that could significantly affect internal controls subsequent to the date of our most<br />
recent evaluation, including any corrective actions with regard to significant deficiencies and material weaknesses.<br />
Date: February 21, 2003<br />
/s/ James R. Young<br />
James R. Young<br />
Executive Vice President–Finance<br />
66
SCHEDULE II – VALUATION AND QUALIFYING ACCOUNTS<br />
<strong>Union</strong> <strong>Pacific</strong> <strong>Corporation</strong> and Subsidiary Companies<br />
Millions of Dollars, for the Years Ended December 31, <strong>2002</strong> 2001 2000<br />
Allowance for doubtful accounts:<br />
Balance, beginning of period .................................................................... $ 150 $ 139 $ 135<br />
Charged to expense.................................................................................... 28 29 19<br />
Write-offs, net of recoveries ...................................................................... (37) (18) (15)<br />
Balance, end of period .................................................................................... $ 141 $ 150 $ 139<br />
Accrued casualty costs:<br />
Balance, beginning of period .................................................................... $ 1,148 $ 1,243 $ 1,319<br />
Charged to expense.................................................................................... 414 376 360<br />
Cash payments and other reductions ....................................................... (419) (471) (436)<br />
Balance, end of period .................................................................................... $ 1,143 $ 1,148 $ 1,243<br />
Accrued casualty costs are presented in the Consolidated<br />
Statements of Financial Position as follows:<br />
Current .................................................................................................. $ 461 $ 452 $ 442<br />
Long-term ............................................................................................. 682 696 801<br />
Balance, end of period .................................................................................... $ 1,143 $ 1,148 $ 1,243<br />
67
<strong>Union</strong> <strong>Pacific</strong> <strong>Corporation</strong><br />
Exhibit Index<br />
Exhibit No.<br />
Description<br />
Filed with this Statement<br />
3(a) By-laws of UPC, as amended, effective as of January 1, 2003.<br />
10(a) The Executive Stock Purchase Incentive Plan of UPC, as amended November 21, <strong>2002</strong>.<br />
10(b)<br />
Overnite Transportation Company Employee Stock Purchase Plan, as amended, effective as of<br />
November 19, 1998.<br />
12 Ratio of Earnings to Fixed Charges.<br />
21 List of the <strong>Corporation</strong>’s significant subsidiaries and their respective states of incorporation.<br />
23 Independent Auditors’ Consent.<br />
24 Powers of attorney executed by the directors of UPC.<br />
99 Certifications Pursuant to 18 U.S.C. Section 1350, as Adopted pursuant to Section 906 of the<br />
Sarbanes-Oxley Act of <strong>2002</strong> - Richard K. Davidson and James R. Young.<br />
Incorporated by Reference<br />
3(b)<br />
4(a)<br />
4(b)<br />
4(c)<br />
Revised Articles of Incorporation of UPC, as amended through April 25, 1996, are<br />
incorporated herein by reference to Exhibit 3 to the <strong>Corporation</strong>’s Quarterly <strong>Report</strong> on Form<br />
10-Q for the quarter ended March 31, 1996.<br />
Indenture, dated as of December 20, 1996, between UPC and Citibank, N.A., as Trustee, is<br />
incorporated herein by reference to Exhibit 4.1 to UPC’s Registration Statement on Form S-3<br />
(No. 333-18345).<br />
Indenture, dated as of April 1, 1999, between UPC and JP Morgan Chase Bank, formerly The<br />
Chase Manhattan Bank, as Trustee, is incorporated herein by reference to Exhibit 4.2 to UPC’s<br />
Registration Statement on Form S-3 (No. 333-75989).<br />
Form of Debt Security is incorporated herein by reference to Exhibit 4.3 to UPC’s Registration<br />
Statement on Form S-3 (No. 33-59323).<br />
Certain instruments evidencing long-term indebtedness of UPC are not filed as exhibits<br />
because the total amount of securities authorized under any single such instrument does not<br />
exceed 10% of the <strong>Corporation</strong>’s total consolidated assets. UPC agrees to furnish the<br />
Commission with a copy of any such instrument upon request by the Commission.<br />
10(c)<br />
Amended and Restated Anschutz Shareholders Agreement, dated as of July 12, 1996, among<br />
UPC, UPRR, The Anschutz <strong>Corporation</strong> (TAC), Anschutz Foundation (the Foundation) and<br />
Mr. Philip F. Anschutz, is incorporated herein by reference to Annex D to the Joint Proxy<br />
Statement/Prospectus included in Post-Effective Amendment No. 2 to UPC’s Registration<br />
Statement on Form S-4 (No. 33-64707).<br />
68
10(d)<br />
10(e)<br />
10(f)<br />
10(g)<br />
10(h)<br />
10(i)<br />
10(j)<br />
10(k)<br />
10(l)<br />
10(m)<br />
10(n)<br />
10(o)<br />
10(p)<br />
Amended and Restated Registration Rights Agreement, dated as of July 12, 1996, among UPC,<br />
TAC and the Foundation is incorporated herein by reference to Annex H to the Joint Proxy<br />
Statement/Prospectus included in Post-Effective Amendment No. 2 to UPC’s Registration<br />
Statement on Form S-4 (No. 33-64707).<br />
Amended and Restated Registration Rights Agreement, dated as of July 12, 1996, among UPC,<br />
UP Holding Company, Inc., <strong>Union</strong> <strong>Pacific</strong> Merger Co. and Southern <strong>Pacific</strong> Rail <strong>Corporation</strong><br />
(SP) is incorporated herein by reference to Annex J to the Joint Proxy Statement/Prospectus<br />
included in Post-Effective Amendment No. 2 to UPC’s Registration Statement on Form S-4<br />
(No. 33-64707).<br />
Agreement, dated September 25, 1995, among UPC, UPRR, Missouri <strong>Pacific</strong> Railroad<br />
Company (MPRR), SP, Southern <strong>Pacific</strong> Transportation Company (SPT), The Denver & Rio<br />
Grande Western Railroad Company (D&RGW), St. Louis Southwestern Railway Company<br />
(SLSRC) and SPCSL Corp. (SPCSL), on the one hand, and Burlington Northern Railroad<br />
Company (BN) and The Atchison, Topeka and Santa Fe Railway Company (Santa Fe), on the<br />
other hand, is incorporated by reference to Exhibit 10.11 to UPC’s Registration Statement on<br />
Form S-4 (No. 33-64707).<br />
Supplemental Agreement, dated November 18, 1995, between UPC, UPRR, MPRR, SP, SPT,<br />
D&RGW, SLSRC and SPCSL, on the one hand, and BN and Santa Fe, on the other hand, is<br />
incorporated herein by reference to Exhibit 10.12 to UPC’s Registration Statement on Form S-4<br />
(No. 33-64707).<br />
UPC 2001 Stock Incentive Plan, dated April 20, 2001, is incorporated herein by reference to<br />
Exhibit 99 to the UPC’s Current <strong>Report</strong> on Form 8-K dated March 8, 2001.<br />
UP Shares Stock Option Plan of UPC, effective April 30, 1998, is incorporated herein by<br />
reference to Exhibit 4.3 to UPC’s Registration Statement on Form S-8 (No. 333-57958).<br />
The Executive Incentive Plan of UPC, as amended May 31, 2001, is incorporated herein by<br />
reference to Exhibit 10(b) to the <strong>Corporation</strong>’s Quarterly <strong>Report</strong> on Form 10-Q for the<br />
quarter ended June 30, 2001.<br />
Written Description of Premium Exchange Program Pursuant to 1993 Stock Option and<br />
Retention Stock Plan of UPC is incorporated herein by reference to Exhibit 10(b) to the<br />
<strong>Corporation</strong>’s Quarterly <strong>Report</strong> on Form 10-Q for the quarter ended September 30, 1999.<br />
The Supplemental Pension Plan for Officers and Managers of UPC and Affiliates, as amended<br />
May 30, <strong>2002</strong>, is incorporated herein by reference to Exhibit 10(a) to the <strong>Corporation</strong>’s<br />
Quarterly <strong>Report</strong> on Form 10-Q for the quarter ended June 30, <strong>2002</strong>.<br />
The 1988 Stock Option and Restricted Stock Plan of UPC, as amended November 16, 2000, is<br />
incorporated herein by reference to Exhibit 10(l) to the <strong>Corporation</strong>’s <strong>Annual</strong> <strong>Report</strong> on Form<br />
10-K for the year ended December 31, 2000.<br />
The 1993 Stock Option and Retention Stock Plan of UPC, as amended May 30, <strong>2002</strong>, is<br />
incorporated herein by reference to Exhibit 10(b) to the <strong>Corporation</strong>’s Quarterly <strong>Report</strong> on<br />
Form 10-Q for the quarter ended June 30, <strong>2002</strong>.<br />
UPC 2000 Directors Stock Plan is incorporated herein by reference to Exhibit 99 to UPC’s<br />
Current <strong>Report</strong> on Form 8-K filed March 9, 2000.<br />
UPC Key Employee Continuity Plan dated November 16, 2000, is incorporated herein by<br />
reference to Exhibit 10(o) to the <strong>Corporation</strong>’s <strong>Annual</strong> <strong>Report</strong> on Form 10-K for the year<br />
ended December 31, 2000.<br />
69
10(q)<br />
10(r)<br />
10(s)<br />
10(t)<br />
10(u)<br />
The Pension Plan for Non-Employee Directors of UPC, as amended January 25, 1996, is<br />
incorporated herein by reference to Exhibit 10(w) to the <strong>Corporation</strong>’s <strong>Annual</strong> <strong>Report</strong> on<br />
Form 10-K for the year ended December 31, 1995.<br />
The Executive Life Insurance Plan of UPC, as amended October 1997, is incorporated herein<br />
by reference to Exhibit 10(t) to the <strong>Corporation</strong>’s <strong>Annual</strong> <strong>Report</strong> on Form 10-K for the year<br />
ended December 31, 1997.<br />
The UPC Stock Unit Grant and Deferred Compensation Plan for the Board of Directors, as<br />
amended May 27, 2001, is incorporated herein by reference to Exhibit 10(a) to the<br />
<strong>Corporation</strong>’s Quarterly <strong>Report</strong> on Form 10-Q for the quarter ended June 30, 2001.<br />
Charitable Contribution Plan for Non-Employee Directors of <strong>Union</strong> <strong>Pacific</strong> <strong>Corporation</strong> is<br />
incorporated herein by reference to Exhibit 10(z) to the <strong>Corporation</strong>’s <strong>Annual</strong> <strong>Report</strong> on Form<br />
10-K for the year ended December 31, 1995.<br />
Written Description of Other Executive Compensation Arrangements of <strong>Union</strong> <strong>Pacific</strong><br />
<strong>Corporation</strong> is incorporated herein by reference to Exhibit 10(q) to the <strong>Corporation</strong>’s <strong>Annual</strong><br />
<strong>Report</strong> on Form 10-K for the year ended December 31, 1998.<br />
10(v) Form of 2001 Long Term Plan Stock Unit and Cash Award Agreement dated January 25, 2001,<br />
is incorporated herein by reference to Exhibit 10(u) to the <strong>Corporation</strong>’s <strong>Annual</strong> <strong>Report</strong> of<br />
Form 10-K for the year ended December 31, 2000.<br />
10(w)<br />
Motor Cargo Industries, Inc. Employee Stock Purchase Plan, dated November 21, <strong>2002</strong>, is<br />
incorporated herein by reference to Exhibit 4 to UPC’s Registration Statement on Form S-8<br />
(No. 333-101430).<br />
70
Exhibit 12<br />
RATIO OF EARNINGS TO FIXED CHARGES<br />
<strong>Union</strong> <strong>Pacific</strong> <strong>Corporation</strong> and Subsidiary Companies<br />
Millions of Dollars, Except for Ratio <strong>2002</strong> 2001 2000 1999 1998<br />
Earnings from continuing operations.......... $ 1,341 $ 966 $ 842 $ 783 $ (633)<br />
Undistributed equity (earnings) loss ........... (34) (48) 24 (45) (44)<br />
Total earnings ........................................... 1,307 918 866 738 (677)<br />
Income taxes .................................................. 675 567 468 419 (63)<br />
Fixed charges:<br />
Interest expense including<br />
amortization of debt discount ........... 633 701 723 733 714<br />
Portion of rentals representing<br />
an interest factor ................................. 44 42 174 186 181<br />
Total fixed charges.................................... 677 743 897 919 895<br />
Earnings available for fixed charges ............. $ 2,659 $ 2,228 $ 2,231 $ 2,076 $ 155<br />
Ratio of earnings to fixed charges ................ 3.9 3.0 2.5 2.3 - [a]<br />
[a]<br />
1998 earnings were inadequate to cover fixed charges by $740 million.<br />
71
Exhibit 21<br />
SIGNIFICANT SUBSIDIARIES OF UNION PACIFIC CORPORATION<br />
Name of <strong>Corporation</strong><br />
<strong>Union</strong> <strong>Pacific</strong> Railroad Company ..............................................................................................<br />
Southern <strong>Pacific</strong> Rail <strong>Corporation</strong> ............................................................................................<br />
Overnite Transportation Company ...........................................................................................<br />
State of<br />
Incorporation<br />
Delaware<br />
Utah<br />
Virginia<br />
72
Exhibit 23<br />
INDEPENDENT AUDITORS’ CONSENT<br />
We consent to the incorporation by reference in Post-Effective Amendment No. 1 to Registration Statement No. 2-79663,<br />
Post-Effective Amendment No. 1 to Registration Statement No. 33-12513, Registration Statement No. 33-18877, Registration<br />
Statement No. 33-22106, Registration Statement No. 33-44236, Registration Statement No. 33-53968, Registration Statement<br />
No. 33-49785, Registration Statement No. 33-49849, Registration Statement No. 33-51071, Registration Statement No. 33-<br />
51735, Registration Statement No. 33-58563, Registration Statement No. 333-10797, Registration Statement No. 333-13115,<br />
Registration Statement No. 333-16563, Registration Statement No. 333-88225, Registration Statement No. 333-88709,<br />
Registration Statement No. 333-57958, Registration Statement No. 333-61856, Registration Statement No. 333-42768 and<br />
Registration Statement No. 333-101430 on Forms S-8 and Post-Effective Amendment No. 1 to Registration Statement No.<br />
333-51617, Registration Statement No. 333-88666 and Amendment No.1 to Registration Statement No. 333-88666 on Forms<br />
S-3 of our report dated January 22, 2003, appearing in this <strong>Annual</strong> <strong>Report</strong> on Form 10-K of <strong>Union</strong> <strong>Pacific</strong> <strong>Corporation</strong> for<br />
the year ended December 31, <strong>2002</strong>.<br />
/s/ Deloitte & Touche LLP<br />
DELOITTE & TOUCHE LLP<br />
Omaha, Nebraska<br />
February 21, 2003<br />
73
Exhibit 24<br />
UNION PACIFIC CORPORATION<br />
Powers of Attorney<br />
I, the undersigned, a director of <strong>Union</strong> <strong>Pacific</strong> <strong>Corporation</strong>, a Utah <strong>Corporation</strong> (the <strong>Corporation</strong>), do hereby appoint each<br />
of James R. Young, Carl W. von Bernuth and Thomas E. Whitaker my true and lawful attorney-in-fact and agent, to sign on<br />
my behalf the <strong>Corporation</strong>’s <strong>Annual</strong> <strong>Report</strong> on Form 10-K for the year ended December 31, <strong>2002</strong>, and any and all<br />
amendments thereto, and to file the same, with all exhibits thereto, with the Securities and Exchange Commission.<br />
IN WITNESS WHEREOF, I have executed this Power of Attorney as of January 30, 2003.<br />
/s/ PHILIP F. ANSCHUTZ<br />
Philip F. Anschutz<br />
I, the undersigned, a director of <strong>Union</strong> <strong>Pacific</strong> <strong>Corporation</strong>, a Utah <strong>Corporation</strong> (the <strong>Corporation</strong>), do hereby appoint each<br />
of James R. Young, Carl W. von Bernuth and Thomas E. Whitaker my true and lawful attorney-in-fact and agent, to sign on<br />
my behalf the <strong>Corporation</strong>’s <strong>Annual</strong> <strong>Report</strong> on Form 10-K for the year ended December 31, <strong>2002</strong>, and any and all<br />
amendments thereto, and to file the same, with all exhibits thereto, with the Securities and Exchange Commission.<br />
IN WITNESS WHEREOF, I have executed this Power of Attorney as of January 30, 2003.<br />
/s/ THOMAS J. DONOHUE<br />
Thomas J. Donohue<br />
I, the undersigned, a director of <strong>Union</strong> <strong>Pacific</strong> <strong>Corporation</strong>, a Utah <strong>Corporation</strong> (the <strong>Corporation</strong>), do hereby appoint each<br />
of James R. Young, Carl W. von Bernuth and Thomas E. Whitaker my true and lawful attorney-in-fact and agent, to sign on<br />
my behalf the <strong>Corporation</strong>’s <strong>Annual</strong> <strong>Report</strong> on Form 10-K for the year ended December 31, <strong>2002</strong>, and any and all<br />
amendments thereto, and to file the same, with all exhibits thereto, with the Securities and Exchange Commission.<br />
IN WITNESS WHEREOF, I have executed this Power of Attorney as of January 30, 2003.<br />
/s/ ARCHIE W. DUNHAM<br />
Archie W. Dunham<br />
I, the undersigned, a director of <strong>Union</strong> <strong>Pacific</strong> <strong>Corporation</strong>, a Utah <strong>Corporation</strong> (the <strong>Corporation</strong>), do hereby appoint each<br />
of James R. Young, Carl W. von Bernuth and Thomas E. Whitaker my true and lawful attorney-in-fact and agent, to sign on<br />
my behalf the <strong>Corporation</strong>’s <strong>Annual</strong> <strong>Report</strong> on Form 10-K for the year ended December 31, <strong>2002</strong>, and any and all<br />
amendments thereto, and to file the same, with all exhibits thereto, with the Securities and Exchange Commission.<br />
IN WITNESS WHEREOF, I have executed this Power of Attorney as of January 30, 2003.<br />
/s/ SPENCER F. ECCLES<br />
Spencer F. Eccles<br />
I, the undersigned, a director of <strong>Union</strong> <strong>Pacific</strong> <strong>Corporation</strong>, a Utah <strong>Corporation</strong> (the <strong>Corporation</strong>), do hereby appoint each<br />
of James R. Young, Carl W. von Bernuth and Thomas E. Whitaker my true and lawful attorney-in-fact and agent, to sign on<br />
my behalf the <strong>Corporation</strong>’s <strong>Annual</strong> <strong>Report</strong> on Form 10-K for the year ended December 31, <strong>2002</strong>, and any and all<br />
amendments thereto, and to file the same, with all exhibits thereto, with the Securities and Exchange Commission.<br />
IN WITNESS WHEREOF, I have executed this Power of Attorney as of January 30, 2003.<br />
/s/ IVOR J. EVANS<br />
Ivor J. Evans<br />
74
I, the undersigned, a director of <strong>Union</strong> <strong>Pacific</strong> <strong>Corporation</strong>, a Utah <strong>Corporation</strong> (the <strong>Corporation</strong>), do hereby appoint each<br />
of James R. Young, Carl W. von Bernuth and Thomas E. Whitaker my true and lawful attorney-in-fact and agent, to sign on<br />
my behalf the <strong>Corporation</strong>’s <strong>Annual</strong> <strong>Report</strong> on Form 10-K for the year ended December 31, <strong>2002</strong>, and any and all<br />
amendments thereto, and to file the same, with all exhibits thereto, with the Securities and Exchange Commission.<br />
IN WITNESS WHEREOF, I have executed this Power of Attorney as of January 30, 2003.<br />
/s/ ELBRIDGE T. GERRY, JR.<br />
Elbridge T. Gerry, Jr.<br />
I, the undersigned, a director of <strong>Union</strong> <strong>Pacific</strong> <strong>Corporation</strong>, a Utah <strong>Corporation</strong> (the <strong>Corporation</strong>), do hereby appoint each<br />
of James R. Young, Carl W. von Bernuth and Thomas E. Whitaker my true and lawful attorney-in-fact and agent, to sign on<br />
my behalf the <strong>Corporation</strong>’s <strong>Annual</strong> <strong>Report</strong> on Form 10-K for the year ended December 31, <strong>2002</strong>, and any and all<br />
amendments thereto, and to file the same, with all exhibits thereto, with the Securities and Exchange Commission.<br />
IN WITNESS WHEREOF, I have executed this Power of Attorney as of January 30, 2003.<br />
/s/ JUDITH RICHARDS HOPE<br />
Judith Richards Hope<br />
I, the undersigned, a director of <strong>Union</strong> <strong>Pacific</strong> <strong>Corporation</strong>, a Utah <strong>Corporation</strong> (the <strong>Corporation</strong>), do hereby appoint each<br />
of James R. Young, Carl W. von Bernuth and Thomas E. Whitaker my true and lawful attorney-in-fact and agent, to sign on<br />
my behalf the <strong>Corporation</strong>’s <strong>Annual</strong> <strong>Report</strong> on Form 10-K for the year ended December 31, <strong>2002</strong> and any and all<br />
amendments thereto, and to file the same, with all exhibits thereto, with the Securities and Exchange Commission.<br />
IN WITNESS WHEREOF, I have executed this Power of Attorney as of January 30, 2003.<br />
/s/ RICHARD J. MAHONEY<br />
Richard J. Mahoney<br />
I, the undersigned, a director of <strong>Union</strong> <strong>Pacific</strong> <strong>Corporation</strong>, a Utah <strong>Corporation</strong> (the <strong>Corporation</strong>), do hereby appoint each<br />
of James R. Young, Carl W. von Bernuth and Thomas E. Whitaker my true and lawful attorney-in-fact and agent, to sign on<br />
my behalf the <strong>Corporation</strong>’s <strong>Annual</strong> <strong>Report</strong> on Form 10-K for the year ended December 31, <strong>2002</strong>, and any and all<br />
amendments thereto, and to file the same, with all exhibits thereto, with the Securities and Exchange Commission.<br />
IN WITNESS WHEREOF, I have executed this Power of Attorney as of January 30, 2003.<br />
/s/ STEVEN R. ROGEL<br />
Steve R. Rogel<br />
I, the undersigned, a director of <strong>Union</strong> <strong>Pacific</strong> <strong>Corporation</strong>, a Utah <strong>Corporation</strong> (the <strong>Corporation</strong>), do hereby appoint each<br />
of James R. Young, Carl W. von Bernuth and Thomas E. Whitaker my true and lawful attorney-in-fact and agent, to sign on<br />
my behalf the <strong>Corporation</strong>’s <strong>Annual</strong> <strong>Report</strong> on Form 10-K for the year ended December 31, <strong>2002</strong>, and any and all<br />
amendments thereto, and to file the same, with all exhibits thereto, with the Securities and Exchange Commission.<br />
IN WITNESS WHEREOF, I have executed this Power of Attorney as of January 30, 2003.<br />
/s/ ERNESTO ZEDILLO PONCE DE LEON<br />
Ernesto Zedillo Ponce De Leon<br />
75
EXHIBIT 99<br />
CERTIFICATION OF CHIEF EXECUTIVE OFFICER PURSUANT TO<br />
18 U.S.C. SECTION 1350,<br />
AS ADOPTED PURSUANT TO<br />
SECTION 906 OF THE SARBANES-OXLEY ACT OF <strong>2002</strong><br />
In connection with the accompanying <strong>Annual</strong> <strong>Report</strong> of <strong>Union</strong> <strong>Pacific</strong> <strong>Corporation</strong> (the <strong>Corporation</strong>) on Form 10-K for<br />
the period ending December 31, <strong>2002</strong> as filed with the Securities and Exchange Commission on the date hereof (the <strong>Report</strong>),<br />
I, Richard K. Davidson, Chairman, President and Chief Executive Officer of the <strong>Corporation</strong>, certify, pursuant to 18 U.S.C.<br />
Section 1350, as adopted pursuant to Section 906 of the Sarbanes-Oxley Act of <strong>2002</strong>, to the best of my knowledge, that:<br />
(1) The <strong>Report</strong> fully complies with the requirements of Section 13(a) of the Securities Exchange Act of 1934;<br />
and<br />
(2) The information contained in the <strong>Report</strong> fairly presents, in all material respects, the financial condition<br />
and results of operations of the <strong>Corporation</strong>.<br />
By:<br />
/s/ Richard K. Davidson<br />
Richard K. Davidson<br />
Chairman, President and<br />
Chief Executive Officer<br />
<strong>Union</strong> <strong>Pacific</strong> <strong>Corporation</strong><br />
February 21, 2003<br />
CERTIFICATION OF CHIEF FINANCIAL OFFICER PURSUANT TO<br />
18 U.S.C. SECTION 1350,<br />
AS ADOPTED PURSUANT TO<br />
SECTION 906 OF THE SARBANES-OXLEY ACT OF <strong>2002</strong><br />
In connection with the accompanying <strong>Annual</strong> <strong>Report</strong> of <strong>Union</strong> <strong>Pacific</strong> <strong>Corporation</strong> (the <strong>Corporation</strong>) on Form 10-K for<br />
the period ending December 31, <strong>2002</strong> as filed with the Securities and Exchange Commission on the date hereof (the <strong>Report</strong>),<br />
I, James R. Young, Executive Vice President–Finance of the <strong>Corporation</strong>, certify, pursuant to 18 U.S.C. Section 1350, as<br />
adopted pursuant to Section 906 of the Sarbanes-Oxley Act of <strong>2002</strong>, to the best of my knowledge, that:<br />
(1) The <strong>Report</strong> fully complies with the requirements of Section 13(a) of the Securities Exchange Act of 1934;<br />
and<br />
(2) The information contained in the <strong>Report</strong> fairly presents, in all material respects, the financial condition<br />
and results of operations of the <strong>Corporation</strong>.<br />
By:<br />
/s/ James R. Young<br />
James R. Young<br />
Executive Vice President-Finance<br />
<strong>Union</strong> <strong>Pacific</strong> <strong>Corporation</strong><br />
February 21, 2003<br />
76
CORPORATE INFORMATION<br />
Corporate Headquarters<br />
<strong>Union</strong> <strong>Pacific</strong> <strong>Corporation</strong> <strong>Union</strong> <strong>Pacific</strong> Railroad Company Overnite <strong>Corporation</strong><br />
1416 Dodge Street, Room 1230 1416 Dodge Street 1000 Semmes Avenue<br />
Omaha, NE 68179 Omaha, NE 68179 P.O. Box 1216<br />
(402) 271-5777 www.up.com Richmond, VA 23218-1216<br />
www.up.com<br />
www.overnite.com<br />
www.motorcargo.com<br />
Transfer Agent and Registrar of Stock<br />
Computershare Investor Services, LLC<br />
For U.S. mail<br />
For express service delivery<br />
P.O. Box 1689<br />
2 North LaSalle Street<br />
Chicago, IL 60690 Chicago, IL 60602<br />
Most questions regarding your account may be answered by contacting the automated Computershare Investor<br />
Services Help Line at (800) 317-2512 from your touch-tone phone, 24 hours a day, 7 days a week. Service representatives<br />
are available on the Help Line from 8 a.m. to 5 p.m. Central Time, Monday through Friday. You may also write to<br />
Computershare at the appropriate address above, or you may contact Computershare online at www.computershare.com<br />
Stock Listing<br />
New York Stock Exchange<br />
Ticker Symbol: UNP<br />
<strong>Annual</strong> Meeting of Shareholders<br />
April 18, 2003, 8:30 a.m.<br />
Little America Hotel<br />
500 South Main Street<br />
Salt Lake City, UT<br />
Information Sources<br />
The contact for media and public relations inquiries is Corporate Relations at (402) 271-3475. Institutional investors<br />
and financial analysts can contact Investor Relations at (402) 271-4227 or (877) 547-7261. Written inquiries for<br />
Corporate or Investor Relations can be directed to the <strong>Corporation</strong>’s address listed above.<br />
Individual shareholder questions should be directed to the <strong>Corporation</strong>’s Transfer Agent at the above contact information.<br />
SEC Filings and Other Corporate Information<br />
<strong>Union</strong> <strong>Pacific</strong>’s Securities and Exchange Commission (SEC) filings, corporate governance materials (Board<br />
Committee charters, governance guidelines and policies, and codes of business conduct and ethics for directors,<br />
officers and employees), news releases, investor fact books and other general information about <strong>Union</strong> <strong>Pacific</strong> are all<br />
available on the Internet at UP’s Web site at www.up.com/investors<br />
Copies of the <strong>Corporation</strong>’s <strong>2002</strong> <strong>Annual</strong> <strong>Report</strong> and other corporate materials are also available, without charge,<br />
by writing to:<br />
Secretary<br />
<strong>Union</strong> <strong>Pacific</strong> <strong>Corporation</strong><br />
1416 Dodge Street, Room 1230<br />
Omaha, NE 68179<br />
<strong>Union</strong> <strong>Pacific</strong>’s SEC filings can also be viewed on the Internet at www.sec.gov<br />
Design: Muller + Co Cover Photo: Steve Crise Principal Photography: Darryl Bernstein


