

Monitor Vol 39 08_Final_Nov08.pdf - tips
Monitor Vol 39 08_Final_Nov08.pdf - tips
Monitor Vol 39 08_Final_Nov08.pdf - tips

You also want an ePaper? Increase the reach of your titles
YUMPU automatically turns print PDFs into web optimized ePapers that Google loves.
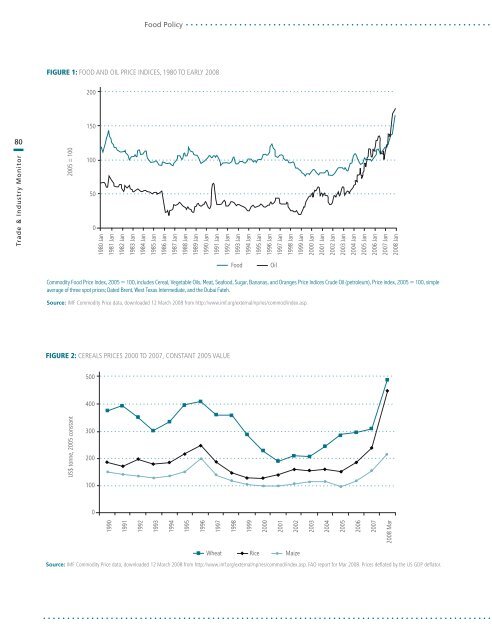
Food Policy<br />
Figure 1: Food and oil price indices, 1980 to early 20<strong>08</strong><br />
200<br />
150<br />
80<br />
Trade & Industry <strong>Monitor</strong><br />
2005 = 100<br />
100<br />
50<br />
0<br />
1980 Jan<br />
1981 Jan<br />
1982 Jan<br />
1983 Jan<br />
1984 Jan<br />
1985 Jan<br />
1986 Jan<br />
1987 Jan<br />
1988 Jan<br />
1989 Jan<br />
1990 Jan<br />
1991 Jan<br />
1992 Jan<br />
1993 Jan<br />
1994 Jan<br />
1995 Jan<br />
1996 Jan<br />
1997 Jan<br />
1998 Jan<br />
1999 Jan<br />
2000 Jan<br />
2001 Jan<br />
2002 Jan<br />
2003 Jan<br />
2004 Jan<br />
2005 Jan<br />
2006 Jan<br />
2007 Jan<br />
20<strong>08</strong> Jan<br />
Food<br />
Oil<br />
Commodity Food Price Index, 2005 = 100, includes Cereal, Vegetable Oils, Meat, Seafood, Sugar, Bananas, and Oranges Price Indices Crude Oil (petroleum), Price index, 2005 = 100, simple<br />
average of three spot prices; Dated Brent, West Texas Intermediate, and the Dubai Fateh.<br />
Source: IMF Commodity Price data, downloaded 12 March 20<strong>08</strong> from http://www.imf.org/external/np/res/commod/index.asp.<br />
Figure 2: Cereals prices 2000 to 2007, constant 2005 value<br />
500<br />
400<br />
300<br />
200<br />
100<br />
0<br />
1990<br />
1991<br />
1992<br />
1993<br />
1994<br />
1995<br />
1996<br />
1997<br />
1998<br />
1999<br />
2000<br />
2001<br />
2002<br />
2003<br />
2004<br />
2005<br />
2006<br />
2007<br />
20<strong>08</strong> Mar<br />
US$ tonne, 2005 constant<br />
Wheat Rice Maize<br />
Source: IMF Commodity Price data, downloaded 12 March 20<strong>08</strong> from http://www.imf.org/external/np/res/commod/index.asp. FAO report for Mar 20<strong>08</strong>. Prices deflated by the US GDP deflator.


