

Monitor Vol 39 08_Final_Nov08.pdf - tips
Monitor Vol 39 08_Final_Nov08.pdf - tips
Monitor Vol 39 08_Final_Nov08.pdf - tips

Create successful ePaper yourself
Turn your PDF publications into a flip-book with our unique Google optimized e-Paper software.
Trade Policy<br />
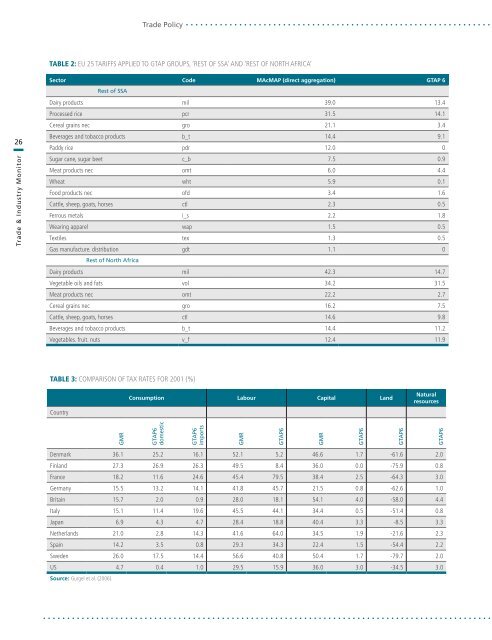
Table 2: EU 25 tariffs applied to GTAP groups, ‘Rest of SSA’ and ‘Rest of North Africa’<br />
Sector Code MAcMAP (direct aggregation) GTAP 6<br />
Rest of SSA<br />
26<br />
Trade & Industry <strong>Monitor</strong><br />
Dairy products mil <strong>39</strong>.0 13.4<br />
Processed rice pcr 31.5 14.1<br />
Cereal grains nec gro 21.1 3.4<br />
Beverages and tobacco products b_t 14.4 9.1<br />
Paddy rice pdr 12.0 0<br />
Sugar cane, sugar beet c_b 7.5 0.9<br />
Meat products nec omt 6.0 4.4<br />
Wheat wht 5.9 0.1<br />
Food products nec ofd 3.4 1.6<br />
Cattle, sheep, goats, horses ctl 2.3 0.5<br />
Ferrous metals i_s 2.2 1.8<br />
Wearing apparel wap 1.5 0.5<br />
Textiles tex 1.3 0.5<br />
Gas manufacture. distribution gdt 1.1 0<br />
Rest of North Africa<br />
Dairy products mil 42.3 14.7<br />
Vegetable oils and fats vol 34.2 31.5<br />
Meat products nec omt 22.2 2.7<br />
Cereal grains nec gro 16.2 7.5<br />
Cattle, sheep, goats, horses ctl 14.6 9.8<br />
Beverages and tobacco products b_t 14.4 11.2<br />
Vegetables. fruit. nuts v_f 12.4 11.9<br />
Table 3: Comparison of tax rates for 2001 (%)<br />
Country<br />
Consumption Labour Capital Land<br />
Natural<br />
resources<br />
GMR<br />
GTAP6<br />
domestic<br />
GTAP6<br />
imports<br />
GMR<br />
GTAP6<br />
GMR<br />
GTAP6<br />
GTAP6<br />
GTAP6<br />
Denmark 36.1 25.2 16.1 52.1 5.2 46.6 1.7 -61.6 2.0<br />
Finland 27.3 26.9 26.3 49.5 8.4 36.0 0.0 -75.9 0.8<br />
France 18.2 11.6 24.6 45.4 79.5 38.4 2.5 -64.3 3.0<br />
Germany 15.5 13.2 14.1 41.8 45.7 21.5 0.8 -62.6 1.0<br />
Britain 15.7 2.0 0.9 28.0 18.1 54.1 4.0 -58.0 4.4<br />
Italy 15.1 11.4 19.6 45.5 44.1 34.4 0.5 -51.4 0.8<br />
Japan 6.9 4.3 4.7 28.4 18.8 40.4 3.3 -8.5 3.3<br />
Netherlands 21.0 2.8 14.3 41.6 64.0 34.5 1.9 -21.6 2.3<br />
Spain 14.2 3.5 0.8 29.3 34.3 22.4 1.5 -54.4 2.2<br />
Sweden 26.0 17.5 14.4 56.6 40.8 50.4 1.7 -79.7 2.0<br />
US 4.7 0.4 1.0 29.5 15.9 36.0 3.0 -34.5 3.0<br />
Source: Gurgel et al. (2006).


