

well log study and petrophysical properties of the ... - Paas.com.pk
well log study and petrophysical properties of the ... - Paas.com.pk
well log study and petrophysical properties of the ... - Paas.com.pk

Create successful ePaper yourself
Turn your PDF publications into a flip-book with our unique Google optimized e-Paper software.
Pakistan Journal <strong>of</strong> Science (Vol. 64 No. 3 September, 2012)<br />
WELL LOG STUDY AND PETROPHYSICAL PROPERTIES OF THE EARLY PERMIAN<br />
WARCHHA SANDSTONE, POTWAR BASIN, PAKISTAN<br />
S. Ghazi, S. R. Ahmad * <strong>and</strong> S. Sharif<br />
Institute <strong>of</strong> Geo<strong>log</strong>y, University <strong>of</strong> <strong>the</strong> Punjab, Lahore 54590, Pakistan<br />
Corresponding author email: sajidpu@yahoo.<strong>com</strong><br />
ABSTRACT: The Chak Naurang Well1-A, drilled by Oil <strong>and</strong> Gas development <strong>com</strong>pany limited<br />
(OGDCL) in <strong>the</strong> eastern Potwar Basin, encountered thickness <strong>of</strong> 82 m for <strong>the</strong> Early Permian Warchha<br />
S<strong>and</strong>stone. The sedimento<strong>log</strong>ical <strong>and</strong> reservoir aspects <strong>of</strong> <strong>the</strong> Warchha S<strong>and</strong>stone from <strong>the</strong> response <strong>of</strong><br />
various wireline <strong>log</strong>s have been investigated. This <strong>study</strong> is focused on <strong>the</strong> response <strong>of</strong> <strong>log</strong> signatures<br />
against <strong>the</strong> sediments within <strong>the</strong> Warchha S<strong>and</strong>stone reveals an overview <strong>of</strong> depositional setting.<br />
Large-scale subsurface facies architecture based on <strong>the</strong> gamma-ray <strong>log</strong> including, channel fill deposits,<br />
point bar <strong>and</strong> flood plain have been identified. They show a characteristic vertical stacking pattern on<br />
<strong>the</strong> <strong>log</strong>s. The depth interval from 2357m to 2439m has been investigated for <strong>the</strong> <strong>petrophysical</strong><br />
<strong>properties</strong> by examining <strong>the</strong> response <strong>of</strong> <strong>the</strong> various wireline <strong>log</strong>s recorded at 1m interval. The result <strong>of</strong><br />
this <strong>study</strong> suggests that <strong>the</strong> Warchha S<strong>and</strong>stone possess considerable storage capacity for holding<br />
moveable hydrocarbon.<br />
Key words: Warchha S<strong>and</strong>stone, wireline <strong>log</strong>s, gamma-ray <strong>log</strong>, <strong>petrophysical</strong> <strong>properties</strong>, moveable hydrocarbon.<br />
INTRODUCTION<br />
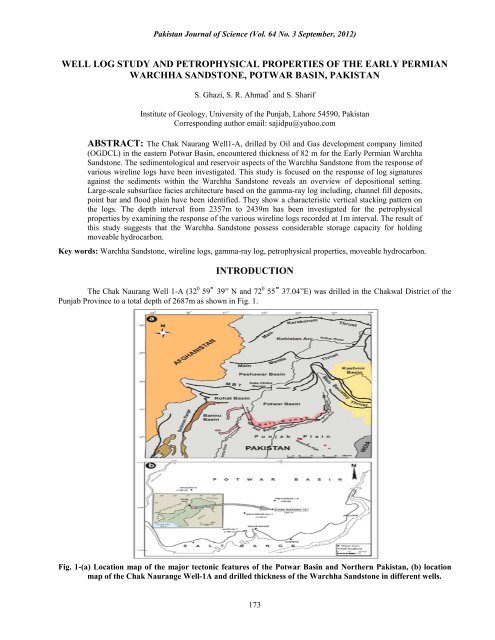
The Chak Naurang Well 1-A (32 0 59 39” N <strong>and</strong> 72 0 55 37.04”E) was drilled in <strong>the</strong> Chakwal District <strong>of</strong> <strong>the</strong><br />
Punjab Province to a total depth <strong>of</strong> 2687m as shown in Fig. 1.<br />
Fig. 1-(a) Location map <strong>of</strong> <strong>the</strong> major tectonic features <strong>of</strong> <strong>the</strong> Potwar Basin <strong>and</strong> Nor<strong>the</strong>rn Pakistan, (b) location<br />
map <strong>of</strong> <strong>the</strong> Chak Naurange Well-1A <strong>and</strong> drilled thickness <strong>of</strong> <strong>the</strong> Warchha S<strong>and</strong>stone in different <strong>well</strong>s.<br />
173
Pakistan Journal <strong>of</strong> Science (Vol. 64 No. 3 September, 2012)<br />
It lies in east <strong>of</strong> <strong>the</strong> Joyamir on <strong>the</strong> seismic line<br />
no 794-cw-35, which crosses <strong>the</strong> Chak Naurang in <strong>the</strong><br />
north-east <strong>and</strong> <strong>the</strong> south-west directions. The average<br />
ground elevation <strong>of</strong> this <strong>well</strong> is 549.01m above sea level<br />
<strong>and</strong> <strong>the</strong> Kelly Bushing elevation is 556.67m. The main<br />
objectives <strong>of</strong> <strong>the</strong> <strong>well</strong> were to drill <strong>and</strong> investigate <strong>the</strong><br />
Khewra, Tobra, Sakesar <strong>and</strong> Chorgali formations,<br />
whereas <strong>the</strong> secondary objective was to test <strong>the</strong> D<strong>and</strong>ot<br />
<strong>and</strong> Warchha formations. The sequence encountered in<br />
this <strong>well</strong> is given in Table 1.<br />
Table 1. Main Litho<strong>log</strong>ies <strong>and</strong> Formations encounted in <strong>the</strong> Chak Naurang Well-1A<br />
Age Formation Thickness (m) Main Litho<strong>log</strong>y<br />
Early Pliocene Chinji 875 Claystone with S<strong>and</strong>stone<br />
Upper Miocene Kamlial 157 S<strong>and</strong>stone with Claystone <strong>and</strong> Siltstone<br />
Middle Miocene Murree 1064 S<strong>and</strong>stone with Claystone<br />
Middle Eocene Chorgali 38 Limestone with Minor Shale<br />
Early Eocene Sakesar 110 Limestone with Shale <strong>and</strong> Marl<br />
Upper Palaeocene Patala 09 Shale with minor Limest<br />
Early Palaeocene Lockhart 11 Limestone with minor shale<br />
Early Permian Sardhai 99 Shale with Minor s<strong>and</strong>stone<br />
Early Permian Warchha 82 S<strong>and</strong>stone with Shale<br />
Early Permian D<strong>and</strong>ot 29 S<strong>and</strong>stone with Shale<br />
Early Permian Tobra 26 S<strong>and</strong>stone with Shale<br />
Middle Cambrian Kussak 24 S<strong>and</strong>stone, Silstone <strong>and</strong> Shale<br />
Early Cambrian Khewra 122 S<strong>and</strong>stone, Siltstone <strong>and</strong> Shale<br />
Pre-Cambrian Salt Range +47 Salt, Marl with Dolomite <strong>and</strong> Anhydrite<br />
The oldest formation drilled in this <strong>well</strong> is <strong>the</strong><br />
Salt Range Formation <strong>of</strong> Precambrian age. While, <strong>the</strong><br />
youngest formation encountered is <strong>the</strong> Chinji Formation<br />
<strong>of</strong> <strong>the</strong> Late Miocene to Early Pliocene age (Fatmi, 1973).<br />
Pakistan has a distinction because <strong>of</strong> its presence at <strong>the</strong><br />
junction <strong>of</strong> <strong>the</strong> Indian <strong>and</strong> <strong>the</strong> Eurasian Plate <strong>and</strong> <strong>the</strong><br />
palaeomagnetic data confirms that 1500 to 3500 km<br />
convergence has occurred between <strong>the</strong>se two plates<br />
(Molnar <strong>and</strong> Tapponnier, 1975). This convergence is<br />
largely ac<strong>com</strong>modated by <strong>the</strong> underthrusting <strong>of</strong> one<br />
continental block beneath <strong>the</strong> o<strong>the</strong>r (Molnar <strong>and</strong><br />
Tapponnier, 1975). The Potwar Basin has several features<br />
that make it favourable site for <strong>the</strong> accumulation <strong>of</strong><br />
hydrocarbon <strong>and</strong> <strong>the</strong> basin is filled with thick deposits <strong>of</strong><br />
source, reservoir <strong>and</strong> <strong>the</strong> cap rocks. It contains thick<br />
overburden <strong>of</strong> sediments that provide <strong>the</strong> optimum<br />
geo<strong>the</strong>rmal gradient for <strong>the</strong> formation <strong>of</strong> <strong>the</strong><br />
hydrocarbons. The present <strong>study</strong> is mainly focused on <strong>the</strong><br />
Early Permian Warchha S<strong>and</strong>stone. The Warchha<br />
S<strong>and</strong>stone is <strong>com</strong>posed <strong>of</strong> light-pink, red, reddish-brown<br />
<strong>and</strong> white-coloured fine-to coarse-grained s<strong>and</strong>stone,<br />
which is conglomeratic in places <strong>and</strong> has interbeds <strong>of</strong><br />
siltstone <strong>and</strong> claystone. It is characteristically speckled in<br />
places. Several fining-upward cycles are recognised<br />
within <strong>the</strong> formation <strong>and</strong> <strong>the</strong>se are <strong>com</strong>posed <strong>of</strong><br />
conglomerate <strong>and</strong> cross-bedded s<strong>and</strong>stone in <strong>the</strong>ir basal<br />
part <strong>and</strong> bioturbated siltstone <strong>and</strong> claystone / mudstone in<br />
<strong>the</strong>ir upper part (Ghazi, 2005, 2009). Clasts are mainly <strong>of</strong><br />
plutonic <strong>and</strong> low-grade metamorphic origin, with an<br />
additional minor sedimentary <strong>com</strong>ponent. Textural<br />
<strong>properties</strong> <strong>of</strong> <strong>the</strong> s<strong>and</strong>stone are fine- to coarse-grained,<br />
poorly- to moderately-sorted, sub-angular to sub-rounded<br />
<strong>and</strong> generally with a loose packing. Based on<br />
petrographic modal analyses, <strong>the</strong> s<strong>and</strong>stone is dominantly<br />
a sub-arkose to arkose (Ghazi, 2007, 2009). A broad<br />
range <strong>of</strong> sedimentary structures are recognised, including<br />
different forms <strong>of</strong> bedding, cross bedding, ripple forms,<br />
ripple stratification, channels, flute casts, load casts,<br />
desiccation cracks, rain imprints, cone-in-cone structures,<br />
a variety <strong>of</strong> concretions <strong>and</strong> bioturbation (Ghazi, 2009).<br />
This <strong>study</strong> is <strong>the</strong> first <strong>com</strong>prehensive assessment<br />
<strong>of</strong> its kind <strong>and</strong> <strong>the</strong> aim <strong>of</strong> this paper is to describe <strong>the</strong><br />
large-scale fluvial facies architecture <strong>and</strong> <strong>the</strong> reservoir<br />
potential <strong>of</strong> <strong>the</strong> Warchha S<strong>and</strong>stone based on <strong>the</strong><br />
sedimento<strong>log</strong>ical interpretation <strong>of</strong> wireline <strong>log</strong>s.<br />
Geo<strong>log</strong>ical Setting: The Chak Naurang Well-1A lies in<br />
<strong>the</strong> north-eastern part <strong>of</strong> <strong>the</strong> Potwar Basin (Fig.1). The<br />
Chak Naurang seismic time structure map drawn on <strong>the</strong><br />
top <strong>of</strong> <strong>the</strong> Chorgali Formation shows <strong>the</strong> presence <strong>of</strong><br />
eastern, western <strong>and</strong> <strong>the</strong> sou<strong>the</strong>rn three independent fault<br />
blocks having closed areas <strong>of</strong> 20 square km, 7.5 square<br />
km <strong>and</strong> 9.0 square km respectively. The Chak Naurang<br />
Well-1A bottomed into <strong>the</strong> Salt Range Formation is<br />
located in <strong>the</strong> structurally higher western fault block. The<br />
Salt Range–Potwar Forel<strong>and</strong> Basin (SRPFB) is bounded<br />
by <strong>the</strong> Salt Range Thrust in <strong>the</strong> south <strong>and</strong> <strong>the</strong> Main<br />
Boundary Thrust (MBT) in <strong>the</strong> north. It is bounded by<br />
left lateral Jehlum Fault <strong>and</strong> right lateral Kalabagh Fault<br />
in <strong>the</strong> east <strong>and</strong> west respectively. The Eocambrian to<br />
Cenozoic sedimentary sequence <strong>of</strong> <strong>the</strong> Indian Plate is<br />
exposed in SRPFB. Structurally, <strong>the</strong> SRPFB <strong>com</strong>prises <strong>of</strong><br />
<strong>the</strong> Nor<strong>the</strong>rn Potwar Deformed Zone (NPDZ), <strong>the</strong> Soan<br />
Syncline <strong>and</strong> <strong>the</strong> Sou<strong>the</strong>rn Potwar Platform Zone (SPPZ).<br />
174
Pakistan Journal <strong>of</strong> Science (Vol. 64 No. 3 September, 2012)<br />
The SRPFB is covered by <strong>the</strong> molasses sediments<br />
ranging in age from Miocene to Pleistocene. The<br />
Eocambrian to Tertiary sedimentary sequence in SRPFB<br />
is exposed along ranges in <strong>the</strong> south. The sedimentary<br />
rocks <strong>of</strong> <strong>the</strong> SRPFB are deformed during thin-skinned<br />
Himalayan tectonics, forming <strong>the</strong> structural trap for<br />
hydrocarbons. Hence <strong>the</strong> SRPFB is structurally<br />
favourable site for <strong>the</strong> hydrocarbon accumulation. This<br />
forel<strong>and</strong> basin is filled with thick sequence <strong>of</strong> <strong>the</strong> source,<br />
reservoir <strong>and</strong> seal rocks (e.g., Raza et al., 1989; Kadri,<br />
1995; Shah, 2009). It contains 1980m to 3050m thick<br />
overburden <strong>of</strong> fluvial sediments which provide burial<br />
depth <strong>and</strong> optimum geo<strong>the</strong>rmal gradient favourable for<br />
<strong>the</strong> formation <strong>of</strong> hydrocarbon in <strong>the</strong> SRPFB.<br />
METHODOLOGY<br />
The fluvial system was reconstructed <strong>and</strong> <strong>the</strong><br />
entire succession was subdivided on <strong>the</strong> basis <strong>of</strong><br />
identification <strong>of</strong> stacked large-scale elements. The<br />
present research is based on <strong>the</strong> <strong>well</strong> <strong>log</strong> data <strong>of</strong> <strong>the</strong> Chak<br />
Naurang <strong>well</strong>-1A provided with <strong>the</strong> courtesy <strong>of</strong> <strong>the</strong><br />
Directorate General Petroleum Concessions (DGPC),<br />
Islamabad, Pakistan. The response <strong>of</strong> <strong>log</strong>s were noted at<br />
one meter interval <strong>and</strong> <strong>the</strong> volume <strong>of</strong> <strong>the</strong> shale is<br />
calculated by gamma-ray <strong>log</strong>. The porosity is calculated<br />
from <strong>the</strong> Density-Neutron porosity <strong>log</strong>s, <strong>and</strong> finally <strong>the</strong><br />
Neutron-Density <strong>com</strong>bined <strong>log</strong>s. The Resistivity <strong>of</strong> <strong>the</strong><br />
invasion zone (R i ), <strong>the</strong> flushed zone (R x0 ), uninvaded<br />
zone or true resistivity <strong>of</strong> <strong>the</strong> Formation (R t ) is evaluated<br />
with <strong>the</strong> help <strong>of</strong> resistivity <strong>of</strong> <strong>the</strong> formation water at<br />
formation temperature (R W ), water saturation (S W ) <strong>and</strong><br />
moveable hydrocarbon index (S W /S XO ).<br />
The top <strong>and</strong> bottom <strong>of</strong> <strong>the</strong> Warchha S<strong>and</strong>stone<br />
in <strong>the</strong> examined <strong>well</strong> <strong>log</strong>s have been marked previously<br />
by operating <strong>com</strong>pany (OGDCL), <strong>the</strong>ir interpretations<br />
having <strong>the</strong>mselves been based partly on previous oil<br />
<strong>com</strong>pany investigations <strong>and</strong> partly on information from<br />
driller <strong>log</strong>s<br />
Log Characters: Most <strong>of</strong> <strong>the</strong> Warchha S<strong>and</strong>stone in <strong>the</strong><br />
Chak Naurang Well 1-A has constant <strong>log</strong> character <strong>and</strong><br />
identifiable (e.g., Ghazi <strong>and</strong> Mountney, 2010). However<br />
shape <strong>of</strong> <strong>the</strong> <strong>log</strong> in few intervals is variable <strong>and</strong> difficult<br />
to identify. The Warchha S<strong>and</strong>stone is litho<strong>log</strong>ically<br />
characterised by conglomeratic s<strong>and</strong>stone, s<strong>and</strong>stone,<br />
siltstone, shale <strong>and</strong> mudstone (Ghazi <strong>and</strong> Mountney,<br />
2010). It is best delineated on <strong>the</strong> gamma-ray <strong>log</strong>;<br />
however, many difficulties arose in <strong>the</strong> interpretation <strong>of</strong><br />
<strong>the</strong> shape <strong>of</strong> gamma-ray <strong>log</strong>s because <strong>of</strong> <strong>the</strong> presence <strong>of</strong><br />
naturally radioactive minerals, detrital mica <strong>and</strong> pure<br />
carbonate within some s<strong>and</strong>stone facies (Hurst, 1990;<br />
Rider, 1990). To solve such problems <strong>log</strong> motifs (trends)<br />
<strong>and</strong> <strong>well</strong> cutting data at particular depth intervals were<br />
<strong>com</strong>pared with o<strong>the</strong>r <strong>log</strong>s curves. It shows low to<br />
moderate values <strong>of</strong> <strong>the</strong> gamma-ray against porous <strong>and</strong><br />
moderately to <strong>well</strong>-sorted s<strong>and</strong>stone intervals as shown in<br />
Fig. 2.<br />
Fig. 2- Characteristic gamma-ray <strong>log</strong> response against <strong>the</strong> Warchha S<strong>and</strong>stone in Chak Naurang Well-1A.<br />
175
Pakistan Journal <strong>of</strong> Science (Vol. 64 No. 3 September, 2012)<br />
The porous s<strong>and</strong>stone intervals delineate<br />
generally cylindrical shape in Sp curves. While porous<br />
s<strong>and</strong>stone intervals show wide separation between <strong>the</strong><br />
shallow <strong>and</strong> deep induction curves.<br />
Accumulations <strong>of</strong> sediments that reflect<br />
different depositional environments tend to display<br />
characteristic <strong>log</strong> motifs <strong>and</strong> <strong>the</strong> recognition <strong>of</strong> <strong>the</strong>se <strong>log</strong><br />
motif trends can be used as an indicator <strong>of</strong> <strong>the</strong> likely<br />
depositional setting <strong>of</strong> <strong>the</strong> facies succession (Ghazi,<br />
2009). At a basic level, a gamma-ray <strong>log</strong> motif indicates<br />
<strong>the</strong> variation in grain size. However, in fluvial<br />
successions <strong>the</strong> relationship between grain size change<br />
<strong>and</strong> type <strong>of</strong> s<strong>and</strong>stone facies is additionally significantly<br />
affected by <strong>the</strong> presence <strong>of</strong> a clay matrix within s<strong>and</strong>dominated<br />
beds (Rider, 1990). The presence <strong>of</strong> claystone<br />
clasts or mud pebbles in a channel deposit will generate<br />
higher values on <strong>the</strong> gamma-ray <strong>log</strong>, even if <strong>the</strong> parent<br />
material is a ¡clean s<strong>and</strong>stone (Ghazi, 2009). Similarly,<br />
<strong>the</strong> presence <strong>of</strong> carbonaceous material will also act to<br />
increase <strong>the</strong> value <strong>of</strong> <strong>the</strong> gamma-ray <strong>log</strong> (Chow et al,<br />
2005).<br />
Identification <strong>of</strong> Large-Scale Fluvial Facies: On <strong>the</strong><br />
basis <strong>of</strong> <strong>the</strong> <strong>well</strong>-<strong>log</strong> shapes <strong>and</strong> stacking <strong>of</strong> vertical<br />
pr<strong>of</strong>iles not only can litho<strong>log</strong>ical interpretation be made<br />
but also <strong>the</strong> subsurface facies analysis (“electr<strong>of</strong>acies”) as<br />
<strong>well</strong> as <strong>the</strong> environmental <strong>and</strong> stratigraphic interpretation<br />
(Pirson, 1970; Serra, 1985; Juhász et al., 2004; Chow et<br />
al., 2005; Ghazi <strong>and</strong> Mountney, 2010). The <strong>log</strong>s shape<br />
may provide a general larger-scale stratigraphic <strong>and</strong><br />
sedimento<strong>log</strong>ical interpretation (Ghazi <strong>and</strong> Mountney,<br />
2010). The overall tendencies <strong>and</strong> <strong>the</strong> larger-scale<br />
depositional elements <strong>of</strong> a thick sedimentary succession<br />
(i.e. fining-upward cycles) are more easily identifiable<br />
(Juhász et al., 2004). However, <strong>the</strong> sedimentary structures<br />
<strong>and</strong> <strong>the</strong> o<strong>the</strong>r important details remain hidden in this kind<br />
<strong>of</strong> interpretation (Juhász et al., 2004).<br />
The main litho<strong>log</strong>y identified through gammaray<br />
<strong>log</strong> shape characteristics <strong>and</strong> <strong>the</strong>ir vertical stacking<br />
pattern provides a view on <strong>the</strong> overall large-scale<br />
architectural build-up (Ghazi <strong>and</strong> Mountney, 2010). The<br />
main depositional elements distinguished on <strong>the</strong> basis <strong>of</strong><br />
gamma-ray <strong>log</strong> in <strong>the</strong> Warchha S<strong>and</strong>stone include,<br />
channel, point bar, <strong>and</strong> floodplain deposits (Fig. 2).<br />
However, thin alternate fine-grained s<strong>and</strong>stone <strong>and</strong><br />
siltstone beds indicate <strong>the</strong> presence <strong>of</strong> natural levee <strong>and</strong><br />
<strong>the</strong> crevasse splay (Ghazi, 2009).<br />
a. Channel-fill deposits: The s<strong>and</strong>y channel-fill deposits<br />
have a very characteristic appearance on <strong>the</strong> gamma-ray<br />
<strong>log</strong> (Fig.2). The <strong>log</strong> motif can be ei<strong>the</strong>r a cylinder or bellshaped<br />
<strong>and</strong> smooth or slightly serrated (Ghazi, 2009;<br />
Ghazi <strong>and</strong> Mountney, 2010). Generally <strong>the</strong>ir sharp bases<br />
indicate downcutting into clay- or silt-rich floodplain<br />
sediments (cf. Juhász et al., 2004). Therefore, <strong>the</strong>y show<br />
great variability in terms <strong>of</strong> thickness, stacking <strong>and</strong> <strong>the</strong><br />
overall character. Analyzing <strong>the</strong> <strong>well</strong>-<strong>log</strong> response<br />
several <strong>com</strong>pletely different channel forms can be<br />
identified. Only <strong>the</strong> vertical continuity <strong>of</strong> <strong>the</strong> channel fill<br />
can be observed <strong>and</strong> almost nothing is known about <strong>the</strong>ir<br />
lateral dimensions <strong>and</strong> <strong>the</strong> relationships.<br />
b. Point bar deposits: Five point bar deposits have been<br />
identified in <strong>the</strong> Warchha S<strong>and</strong>stone <strong>of</strong> <strong>the</strong> Chak Naurang<br />
Well-1A (cf. Cant, 1994; Ghazi <strong>and</strong> Mountney, 2010;<br />
Fig. 2). The Point-bar deposits are connected to <strong>the</strong><br />
me<strong>and</strong>ering channel fills <strong>and</strong> have a characteristic bellshaped<br />
on <strong>the</strong> gamma-ray <strong>log</strong> (Ghazi, 2009; Ghazi <strong>and</strong><br />
Mountney, 2010). The fining-upward succession appears<br />
on <strong>the</strong> <strong>log</strong> in <strong>the</strong> shape <strong>of</strong> a pine tree with “branches”<br />
be<strong>com</strong>ing finer upward in corresponding grain size (Fig.<br />
2). This is quite <strong>com</strong>mon in <strong>the</strong> Warchha S<strong>and</strong>stone <strong>and</strong><br />
generally overlies <strong>the</strong> thin layer <strong>of</strong> conglomerate <strong>and</strong> very<br />
coarse-grained s<strong>and</strong>stone channel-fill or <strong>the</strong> channel lag<br />
deposits (Ghazi, 2009; Ghazi <strong>and</strong> Mountney, 2010). Its<br />
maximum thickness developed up to 10 m in cycle 2<br />
(Fig.2).<br />
c. Floodplain deposits: Log <strong>of</strong> this element shows high<br />
variability in shape from symmetrical to extremely<br />
serrated. In a few places, small-scale cylinder- <strong>and</strong><br />
funnel-shaped motifs transform into small bell-shaped<br />
motifs before returning once more to funnel-shaped<br />
again. Usually, this pattern records a fining-upward trend<br />
but, in few places, a coarsening-upward trend was also<br />
observed (Ghazi <strong>and</strong> Mountney, 2010). Upper boundaries<br />
in many cases show an erosional contact. The Floodplain<br />
deposits include <strong>the</strong> fine-grained overbank sediments <strong>of</strong><br />
<strong>the</strong> floodplain <strong>and</strong> cover a wide flat basinal area where<br />
several rivers flowed across <strong>the</strong> alluvial plain <strong>and</strong> <strong>the</strong>ir<br />
floodplains merged. Floodplain deposits are <strong>com</strong>prises <strong>of</strong><br />
<strong>the</strong> fine grained over bank deposits. The serrated gamma<br />
ray <strong>log</strong> shape indicates <strong>the</strong> presence <strong>of</strong> alternating silt <strong>and</strong><br />
mud in <strong>the</strong> Warchha S<strong>and</strong>stone (Ghazi, 2009: Ghazi <strong>and</strong><br />
Mountney, 2010; Fig. 2).<br />
Petrophysical Properties: The <strong>petrophysical</strong> <strong>properties</strong><br />
<strong>of</strong> <strong>the</strong> Warchha S<strong>and</strong>stone in Chak Naurang Well-1A are<br />
based on interpretation <strong>of</strong> <strong>the</strong> Spontaneous potential<br />
(millivolts), Total gamma-ray (API units), Sonic<br />
(microsecond per foot), Density (gm/cc), Neutron<br />
(limestone equivalent porosity units), Micro spherically<br />
focused (ohm-metres), Shallow latro (ohm-metres) <strong>and</strong><br />
Deep latro (ohm-metres).<br />
1. Shale content: Both <strong>the</strong> spontaneous potential <strong>and</strong><br />
gamma-ray <strong>log</strong>s data are interpreted for <strong>the</strong> determination<br />
<strong>of</strong> shale content as shown in Fig. 3.<br />
176
Pakistan Journal <strong>of</strong> Science (Vol. 64 No. 3 September, 2012)<br />
Fig. 3- The distribution <strong>of</strong> <strong>the</strong> volume <strong>of</strong> shale in different intervals in <strong>the</strong> Warchha S<strong>and</strong>stone<br />
The value <strong>of</strong> <strong>the</strong> gamma-ray <strong>log</strong> is high in shale<br />
litho<strong>log</strong>y, whereas it is low in s<strong>and</strong>stones (Fig. 2). The<br />
depth intervals such as A (2361m - 2363m), B (2367m -<br />
2369m), C (2379m - 2381m), D (2389m - 2365m), E<br />
(2399m - 2403m), F (2425m - 2427m), G (2435m -<br />
2437m) show low values <strong>of</strong> <strong>the</strong> gamma-ray indicating<br />
low percentages <strong>of</strong> shale <strong>and</strong> mud <strong>and</strong> presence <strong>of</strong><br />
dominantly s<strong>and</strong>stone in <strong>the</strong> Warchha S<strong>and</strong>stone in above<br />
mentioned depth intervals (Table 2).<br />
Table 2: Possible hydrocarbon bearing intervals in <strong>the</strong> Warchha S<strong>and</strong>stone in Chak Naurang Well 1A.<br />
2. Porosity: The Warchha S<strong>and</strong>stone is not <strong>com</strong>posed <strong>of</strong><br />
mixture <strong>of</strong> litho<strong>log</strong>y from conglomerate -to-clay-sized<br />
gains. This made porosity calculation <strong>com</strong>plex<br />
corresponding to litho<strong>log</strong>y. A single <strong>log</strong> data can not<br />
produce accurate porosity values; hence, <strong>com</strong>bination <strong>of</strong><br />
neutron-density <strong>log</strong> <strong>and</strong> <strong>the</strong> cross-plots are used to mark<br />
litho<strong>log</strong>ies. The porosity <strong>of</strong> <strong>the</strong> Warchha S<strong>and</strong>stone is<br />
calculated with <strong>the</strong> help <strong>of</strong> <strong>the</strong> neutron <strong>and</strong> density <strong>log</strong>s<br />
data as shown in Fig. 4.<br />
177
Pakistan Journal <strong>of</strong> Science (Vol. 64 No. 3 September, 2012)<br />
Fig. 4- Cross-plot <strong>of</strong> <strong>the</strong> Neutron-Density porosity percentage verses depth in <strong>the</strong> Warchha S<strong>and</strong>stone.<br />
The porosity values in <strong>the</strong> Warchha S<strong>and</strong>stone<br />
calculated from predominantly s<strong>and</strong>stone litho<strong>log</strong>y in<br />
depth intervals A (2361m - 2363m), B (2367m - 2369m),<br />
C (2379m - 2381m), D (2389m - 2365m), E (2399m -<br />
2403m), F (2425m - 2427m), G (2435m - 2437m) are<br />
high, whereas <strong>the</strong> depth interval C (2373m - 2375m)<br />
having higher shale contents show low porosity (Fig. 4;<br />
Table 2). The porosity values in s<strong>and</strong>stone litho<strong>log</strong>y<br />
ranging from 26.75% to 34.5%, indicating highly porous<br />
s<strong>and</strong>stone.<br />
3. Resistivity: The resistivity <strong>of</strong> <strong>the</strong> invasion zone (Ri),<br />
surrounding <strong>the</strong> borehole, measured with <strong>the</strong> help <strong>of</strong> LLS<br />
Log data <strong>and</strong> <strong>of</strong> <strong>the</strong> flushed zone resistivity (R Xo )<br />
measured by MSFL <strong>log</strong> data. Resistivity <strong>of</strong> <strong>the</strong> invaded<br />
zone or true resistivity (R t ) <strong>of</strong> <strong>the</strong> formation is calculated<br />
with <strong>the</strong> interpretation <strong>of</strong> LLD <strong>log</strong> data. In clean<br />
formations or formation saturated with water R t , R Xo <strong>and</strong><br />
R i <strong>log</strong> curves give <strong>the</strong> same response but in hydrocarbonbearing<br />
zones R t gives high values than R Xo <strong>and</strong> R i with<br />
fresh water based mud. Depth intervals, A (2361m -<br />
2363m), B (2367m-2369m), C (2379m - 2381m), D<br />
(2389m - 2365m), E (2399m - 2403m), F (2425m -<br />
2427m), G (2435m - 2437m) show high values <strong>of</strong><br />
resistivity (Fig. 5) The formation water resistivity (R w ) at<br />
formation temperature (T f ) is calculated with <strong>the</strong> help <strong>of</strong><br />
resistivity <strong>of</strong> mud (R m ), resistivity <strong>of</strong> invasion zone (R i )<br />
<strong>and</strong> SP <strong>log</strong> values. Resistivity values decrease with<br />
increase in formation temperature (T f ).<br />
4. Moveable Hydrocarbon Index: The Moveable<br />
Hydrocarbon Index (MHI) also gives information about<br />
formation permeability. A roughly estimation <strong>of</strong> <strong>the</strong><br />
permeability <strong>of</strong> formation is possible with <strong>the</strong> help <strong>of</strong><br />
moveable hydrocarbon index. It is <strong>the</strong> ratio between<br />
water saturation <strong>of</strong> <strong>the</strong> uninvaded zone (S W ) to water<br />
saturation <strong>of</strong> <strong>the</strong> invaded zone. If S W / S XO value is<br />
greater than 1 <strong>the</strong>n <strong>the</strong> hydrocarbon is not moved during<br />
invasion. If S W / S XO value is less than 0.6 <strong>the</strong>n<br />
hydrocarbon is moveable. Index having values less than<br />
0.6 in depth intervals, A (2361m - 2363m), B (2367m -<br />
2369m), C (2379m - 2381m), D (2389m - 2365m), E<br />
(2399m - 2403m), F (2425m - 2427m), G (2435m -<br />
2437m), indicate porous s<strong>and</strong>stone litho<strong>log</strong>y in which<br />
hydrocarbon is moveable due to presence <strong>of</strong> permeability<br />
(Fig. 6). The index value less than 0.6 indicate only rough<br />
estimation <strong>of</strong> <strong>the</strong> permeability, however it is not possible<br />
to measure <strong>the</strong> exact permeability <strong>of</strong> <strong>the</strong> formation with<br />
<strong>the</strong> help <strong>of</strong> index value.<br />
Conclusions: The Early Permian Warchha S<strong>and</strong>stone in<br />
Chak Naurang Well-1, Potwar Basin demonstrate<br />
characteristic <strong>log</strong> responses <strong>of</strong> dominantly s<strong>and</strong>stone,<br />
shale <strong>and</strong> mudstone, which can be identified <strong>and</strong> interpret<br />
fluvial depositional environment. Based on <strong>log</strong> pattern<br />
three types <strong>of</strong> large-scale facies architectural elements,<br />
channel, point bar <strong>and</strong> floodplain have been identified. A<br />
cylinder-shaped <strong>log</strong> motif is indicative <strong>of</strong> ab<strong>and</strong>oned<br />
channels; a bell-shape motif is indicative <strong>of</strong> point bar<br />
deposits <strong>and</strong> symmetrical to extremely serrated <strong>log</strong> motifs<br />
are indicative <strong>of</strong> fine-grained overbank deposits. The<br />
<strong>petrophysical</strong> <strong>properties</strong> <strong>of</strong> <strong>the</strong> Warchha. S<strong>and</strong>stone<br />
indicate <strong>the</strong> presence <strong>of</strong> storage capacity for moveable<br />
hydrocarbon in <strong>the</strong> Warchha S<strong>and</strong>stone.<br />
Acknowledgements: The author would like to<br />
acknowledge Director General Petroleum Concession<br />
(DGPC), Islamabad, Pakistan for providing <strong>well</strong> data.<br />
Specifically thanks to Nigel Mountney (University <strong>of</strong><br />
Leeds) <strong>and</strong> Adrian Hartley (University <strong>of</strong> Aberdeen) for<br />
178
Pakistan Journal <strong>of</strong> Science (Vol. 64 No. 3 September, 2012)<br />
valuable discussions regarding <strong>the</strong> interpretation <strong>of</strong> parts.<br />
REFERENCE<br />
Cant, D. J., Subsurface facies analysis. In: Walker, R.G.,<br />
<strong>and</strong> James, N.P. (eds.), Facies Models,<br />
Geoscience, Canada, 27-45 (1994).<br />
Chow, J. J, M. C. Li, <strong>and</strong> S. C. Fuh, Geophysical <strong>well</strong> <strong>log</strong><br />
<strong>study</strong> on <strong>the</strong> palaeo-environment <strong>of</strong> <strong>the</strong><br />
hydrocarbon producing zones in <strong>the</strong> Erchungchi<br />
Formation, Hsinyin, SW Taiwan. TAO, 16:531-<br />
545 (2005).<br />
Fatmi, A. N., Lithostratigraphic units <strong>of</strong> <strong>the</strong> Kohat-<br />
Potwar Province, Indus Basin. Geo<strong>log</strong>ical<br />
Survey <strong>of</strong> Pakistan, Memoir.10:80p (1973).<br />
Ghazi, S. <strong>and</strong> N. Mountney, Subsurface lith<strong>of</strong>acies<br />
analysis <strong>of</strong> <strong>the</strong> fluvial Early Permian Warchha<br />
S<strong>and</strong>stone, Potwar Basin, Pakistan. Journal <strong>of</strong><br />
Geo<strong>log</strong>ical Society <strong>of</strong> India. 76: 505-517 (2010).<br />
Ghazi, S., Fluvial fining upward cycles <strong>of</strong> <strong>the</strong> Lower<br />
Permian Warchha S<strong>and</strong>stone, Salt Range,<br />
Pakistan, Abstract volume, 8 th International<br />
Fluvial Sedimento<strong>log</strong>ical Conference. Delft,<br />
Holl<strong>and</strong>, 109 (2005).<br />
Ghazi, S., Petrography, diagenesis <strong>and</strong> provenance <strong>of</strong> <strong>the</strong><br />
Early Permian Warchha S<strong>and</strong>stone, Salt Range,<br />
Pakistan, paper presented in British<br />
Sedimento<strong>log</strong>ical Research Group annual<br />
meeting, University <strong>of</strong> Birmingham, Engl<strong>and</strong><br />
(2007).<br />
Ghazi, S., Sedimento<strong>log</strong>y <strong>and</strong> stratigraphic evolution <strong>of</strong><br />
<strong>the</strong> Early Permian Warchha S<strong>and</strong>stone, Salt<br />
Range, Pakistan. PhD <strong>the</strong>sis submitted to<br />
University <strong>of</strong> <strong>the</strong> Leeds, Engl<strong>and</strong>, 362p (2009).<br />
Hurst, A., Natural gamma-ray spectroscopy in<br />
hydrocarbon bearing s<strong>and</strong>stones from <strong>the</strong><br />
Norwegian continental shelf. In: Hurst, A.,<br />
Lovell, M.A., Morton, A.C. (eds.), Geo<strong>log</strong>ical<br />
application <strong>of</strong> wireline <strong>log</strong>s, Geo<strong>log</strong>ical Society.<br />
London, Special Publication No. 48:211-222<br />
(1990).<br />
Juhász, G., P. Mϋller <strong>and</strong> Á. Tόth-Mark, Alluvial<br />
architecture <strong>and</strong> fluvial cycles in Quaternary<br />
deposits in a continental interior basin, East<br />
Hungary. Geol. Croat., 57:171-190 (2004).<br />
Kadri, I. B., Petroleum Geo<strong>log</strong>y <strong>of</strong> Pakistan. Pakistan<br />
Petroleum Limited, Karachi, Pakistan. 275p<br />
(1995).<br />
Molnar, P. <strong>and</strong> P. Tapponnier, Cenozoic tectonics <strong>of</strong><br />
Asia: effects <strong>of</strong> a continental collision. Science,<br />
189:419-426 (1975).<br />
Pirson, J., Geo<strong>log</strong>ical <strong>well</strong>-<strong>log</strong> analysis Gulf Publishing<br />
Company, Houston, 370p (1970).<br />
Raza, H. A., R. Ahmed, S. Alam <strong>and</strong> S. M. Ali,<br />
Petroleum zones <strong>of</strong> Pakistan. Journal <strong>of</strong><br />
Hydrocarbon Research. 1(2):1-19 (1989).<br />
Rider, M. H., Gamma-ray <strong>log</strong> shape used as a facies<br />
indicator: critical analysis <strong>of</strong> an oversimplified<br />
methodo<strong>log</strong>y. In: Hurst. A., Lovell, M.A.,<br />
Morton, A.C. (eds.), Geo<strong>log</strong>ical applications <strong>of</strong><br />
wireline <strong>log</strong>s. Geo<strong>log</strong>ical Society London,<br />
Special Publication 48:27-37 (1990).<br />
Serra, O., Sedimentary Environment from Wireline Logs.<br />
Schlumberger, Montrouge, 211p (1985).<br />
Shah, S. M. I., Stratigraphy <strong>of</strong> Pakistan. Geo<strong>log</strong>ical<br />
Survey <strong>of</strong> Pakistan. Memoir. 22:381p (2009).<br />
179


