Full issue - B & S Analytik GmbH
Full issue - B & S Analytik GmbH
Full issue - B & S Analytik GmbH

Create successful ePaper yourself
Turn your PDF publications into a flip-book with our unique Google optimized e-Paper software.
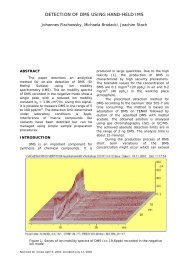
INTERNATIONA L<br />
International Journal<br />
for Ion Mobility Spectrometry<br />
SOCIETY<br />
for<br />
ION<br />
MOBILITY<br />
SP ECTROMETRY<br />
4(2001)1<br />
Official publication of the<br />
International Society for Ion Mobility Spectrometry
International Society for<br />
Ion Mobility Spectrometry<br />
ISIMS 2001<br />
Second Announcement<br />
and Call for Papers<br />
10 th International<br />
Conference on<br />
Ion Mobility<br />
Spectrometry<br />
August 12 - 17, 2001<br />
Wernigerode<br />
Town Hall<br />
National Park Harz
Welcome to<br />
the<br />
ISIMS 2001<br />
10 th International Conference on Ion Mobility Spectrometry<br />
organised by the Institute of Spectrochemistry and Applied Spectroscopy, Dortmund, and Bruker<br />
Saxonia <strong>Analytik</strong>, Leipzig - under the patronage of the International Society for Ion Mobility<br />
Spectrometry.<br />
Dates: August 12-17, 2001<br />
Location: Town Hall of Wernigerode<br />
Accommodation: Gothisches Haus<br />
The conference will be held at the over 500 year old historic town hall of<br />
Wernigerode (see front page). Accommodation will be organised at the<br />
equally historic hotel "Gothisches Haus", built in the first half of the 15 th<br />
century, which is situated alongside the town hall.<br />
All conference correspondence should be addressed to:<br />
International Society for Ion Mobility Spectrometry,<br />
c/o Dr. Jörg Ingo Baumbach, Institute of Spectrochemistry and Applied Spectroscopy,<br />
P.O. Box 10 13 52, D-44013 Dortmund, Germany,<br />
Phone: +49 231 1392 238, FAX: +49 231 1392 438, E-Mail: Baumbach@ISAS-Dortmund.DE<br />
or<br />
Dr. Joachim Stach, Bruker Saxonia <strong>Analytik</strong> <strong>GmbH</strong>, Permoserstr. 15,<br />
D-04318 Leipzig, Germany,<br />
Phone: +49 341 2431 332, FAX: +49 341 2431 404, E-Mail: JS@BSAX.DE<br />
Conference announcements will be posted on the Internet http://ims.isas-dortmund.de<br />
Scientific Programme:<br />
The scientific programme covers most aspects of ion mobility spectrometry. The main subjects will<br />
be:<br />
• fundamental studies,<br />
• instrument development,<br />
• miniaturisation,<br />
• applications,<br />
• operational aspects,<br />
• hyphenated IMS techniques (GC-IMS, IMS-MS, ...),<br />
• data handling and signal processing,<br />
• data format standards.
Conference Schedule:<br />
August 12, Sunday, 16:00 - 20:00<br />
August 12, Sunday, 17:00<br />
August 12, Sunday, 19:30<br />
August 13, Monday, 8:30<br />
August 13, Monday, 8:45 - 16:45<br />
August 13, Monday, 17:00<br />
August 13, Monday, 20:00<br />
August 14, Tuesday, 8:30 - 17:30<br />
August 14, Tuesday, 19:00<br />
August 15, Wednesday, 8:30 - 17:30<br />
August 16, Thursday, 9:30 - 11:30<br />
August 16, Thursday, 12:30<br />
August 16, Thursday, 20:00<br />
August 17, Friday, 8:30 - 11:15<br />
August 17, Friday, 11.15<br />
Registration<br />
Meeting of the Steering Committee<br />
(closed session)<br />
Get-together - WelcomingReception<br />
Opening Address<br />
Lectures<br />
ISIMS Meeting<br />
Bowling*<br />
Lectures<br />
Visit of the Castle of Wernigerode*<br />
Lectures<br />
Poster Session and Exhibition<br />
Sightseeing Tour<br />
Conference Dinner<br />
Lectures<br />
Closing Remarks<br />
* limited number of tickets<br />
Conference Site and Format:<br />
The conference will be held between August 12 - 17, 2001, in the town hall of Wernigerode. The<br />
accommodation is organised in the hotel<br />
Gothisches Haus,<br />
Marktplatz 2, D-38855 Wernigerode,<br />
Phone: +49 3942 6750, FAX. +49 3943 675537, E-Mail: gothisches-haus@tc-hotels.de<br />
A limited number of rooms are reserved. After July 10, rooms not registered will be released to the<br />
public, late registration is therefore discouraged, as accommodation cannot be guaranteed after this<br />
date. Extra costs for families must be paid at the time of registration as it will be billed as part of the<br />
conference package. Additional room expenses, telephone, extra meals, etc. are the responsibility of<br />
the individual delegates.<br />
The conference format will be similar to previous years. Contributions presented as lectures and<br />
posters are welcome. All manufacturers of ion mobility spectrometers and related equipment are<br />
invited to participate in an industrial exhibition including special presentations of company profiles.<br />
The registration fee includes accommodation for five nights, Sunday to Friday, breakfast, lunch and<br />
dinner, welcome reception and conference banquet and the conference proceedings published as<br />
special <strong>issue</strong> of the International Journal for Ion Mobility Spectrometry.<br />
The half-day sightseeing tour is also included with a<br />
steam train trip up into the Harz mountains and<br />
the Brocken peak.
Venue:<br />
A Count of Wernigerode is first mentioned in 1121 in a document of the<br />
bishop of Halberstadt. The Counts of Wernigerode were first granted<br />
their city on the 27 April 1229. The town is located in the National Park<br />
Harz close to the peak Brocken. The town hall<br />
was mentioned 1277 as "gimnasio vel theatro"<br />
where the counts of Wernigerode held court and<br />
other celebrations. One of the oldest buildings in<br />
town is today´s Hotel "Gothisches Haus". The<br />
house was built in the second half of the 15th<br />
century and turned into a restaurant in 1848. A<br />
famous landmark of the town is the impressive<br />
castle of the counts of Stolberg-Wernigerode high<br />
above the city of Wernigerode. The castle was<br />
built on a promontory of the Agnesberg between 1110 and 1120.<br />
Around 1730 the castle was turned into a<br />
Baroque residence.<br />
Registration Fee:<br />
Registration and payment<br />
Regular<br />
Students<br />
before June 30, 2001<br />
1.600 DM<br />
1.300 DM<br />
after June<br />
30, 2001<br />
1.800 DM<br />
1.500 DM<br />
The additional price for spouses and accompanying persons is 700 DM.<br />
Rooms in the hotel have been reserved for both conference and the weekend before and after to<br />
allow some sightseeing. These rooms will be available but are not covered by the workshop costs,<br />
additional days lodging and meals have to be covered individually.<br />
The registration fee includes accommodation for five nights, Sunday to Friday, breakfast, lunch and<br />
dinner, coffee breaks, welcome reception and conference banquet and the conference proceedings<br />
published as special <strong>issue</strong> of the International Journal for Ion Mobility Spectrometry.
Three methods of payment are acceptable:<br />
Methods of payment:<br />
1. Checks made out to ISIMS´2001, payable in DM can be sent directly to ISIMS office in<br />
Dortmund with the registration form<br />
2. Payment in DM to Commerzbank Account 3232311, BLZ 44040037, SWIFT Code:<br />
COBADEFF440, the bank transfer should state explicitely ISIMS´2001, the name and the address<br />
of the participants, proof of the bank transfer should be enclosed with the registration form.<br />
3. Payment by VISA, MASTERCARD/EUROCARD, AMEX.<br />
Abstracts of Papers:<br />
To enhance the quality of preparation of presentations a 4 page extended abstract should be<br />
delivered as a PDF-File. If no PDF-Writer is availalble, camera ready files including the figures and<br />
tables in text in Microsoft WORD, Corel WORDPERFECT or Lotus WORDPRO could be<br />
accepted if readable. All the extended abstracts will be published in a special <strong>issue</strong> of the<br />
International Journal for Ion Mobility Spectrometry. The deadline for submission is July 10, 2001 -<br />
arrival at ISAS in Dortmund. E-Mail delivery would be prefered: Baumbach@ISAS-Dortmund.DE.<br />
But please note, that e-mails of more than 1.3 MB will be rejected by the firewall at the ISAS.<br />
The header of the paper should have the form as used in the International Journal for Ion Mobility<br />
Spectrometry, for example:<br />
Text should be arranged including the figures and tables in one single column per page.<br />
Important note:<br />
Please note that the submission of a 4 page extended abstract by the deadline is a precondition of<br />
presenting a paper or poster at the conference.<br />
Transportation:<br />
Berlin airport, Frankfurt and Düsseldorf airport are about 200 or 300 km from Wernigerode. A car<br />
is not essential but helpful if you wish to explore the National Park Harz. Travel service is available<br />
at the following internet page http://bahn.hafas.de/bin/detect.exe/bin/query.exe/e<br />
Frankfurt - Wernigerode<br />
Munich - Wernigerode<br />
Düsseldorf - Wernigerode<br />
Berlin - Wernigerode<br />
Distance by train<br />
320 km<br />
4 h - about 150 DM<br />
530 km<br />
7 h - about 250 DM<br />
380 km<br />
5 h - about 130 DM<br />
230 km<br />
3h - about 100 DM<br />
Distance by car<br />
335 km<br />
614 km<br />
385 km<br />
231 km
International Steering Committee:<br />
D.A. Atkinson<br />
J.I. Baumbach<br />
H. Bollan<br />
A. Brittain<br />
G.A. Eiceman<br />
St. Harden<br />
H.H. Hill<br />
A. Lawrence<br />
T. Limero<br />
J. Stach<br />
P. Thomas<br />
USA<br />
Germany<br />
United Kingdom<br />
United Kingdom<br />
USA<br />
USA<br />
USA<br />
Canada<br />
USA<br />
Germany<br />
United Kingdom<br />
Local Organising Comittee:<br />
J.I. Baumbach<br />
T. Böhme<br />
M. Brodacki<br />
St. Güssgen<br />
A. Rudolph<br />
H. Schmidt<br />
St. Sielemann<br />
J. Stach<br />
Important Dates:<br />
Early registration<br />
Submission of 4 pages abstract<br />
June 30, 2001<br />
July 10, 2001
10 th International Conference on Ion Mobility Spectrometry<br />
I wish to register for the ISIMS´2001<br />
Registration Form<br />
• Mr.<br />
Family Name:<br />
• Mrs.<br />
• Dr.<br />
• Prof.<br />
First Name:<br />
Institution/<br />
Company:<br />
Address:<br />
City:<br />
Country:<br />
Phone:<br />
FAX:<br />
E-Mail<br />
Name(s) of accompanying persons(s):<br />
I plan a scientific contribution for the<br />
Title of contribution(s):<br />
• lectures<br />
• poster session<br />
by using credit cards (VISA, MASTERCARD/EUROCARD, AMEX)<br />
Card holder´s name: ________________________________________<br />
Card number: _____________________________________________<br />
Expiry date: ___________________<br />
Signature: _________________
Table of Contents<br />
Papers presented at<br />
9 th International Conference on Ion Mobility Spectrometry, ISIMS 2000,<br />
Halifax, Nova Scotia, Canada, August 13-16, 2000<br />
A Miniature Ion Mobility Spectrometer with a<br />
Pulsed Corona-Discharge Ion Source<br />
Jun Xu, W. B. Whitten, T. A. Lewis, and J. M. Ramsey<br />
We report studies of a miniature ion mobility spectrometer (IMS) that employs a pulsed corona<br />
discharge ion source. IMS spectra were measured as a function of pulse width and height, drift<br />
field, and various corona ionization configurations. Preliminary results indicate that pulsed corona<br />
discharge ionization can be used for mm-scale IMS with high sensitivity and good resolution.<br />
3<br />
The development and sea trials of a prototype portable ion mobility spectrometer 7<br />
for monitoring monoethanolamine on board submarines<br />
H.R. Bollan 1 , J.L. Brokenshire 2<br />
Monoethanolamine (MEA) is used in equipment installed in submarines for the purpose of scrubbing<br />
carbon dioxide (CO 2 ) from the enclosed atmosphere. Previously, a prototype fixed-point<br />
continuous monitor for MEA was developed[1] and subjected to sea trials on a submarine. The<br />
concentration of MEA was monitored in the CO 2 scrubber compartment over a period of three<br />
months and found to be within the maximum permissible concentration for a continuous ninetyday<br />
period (MPC 90 ) for the majority of the patrol. The concentration only briefly exceeded the<br />
MPC 90 but did not exceed the MPC 24 (MPC for a continuous 24-hour period), and was rendered<br />
very quickly below the MPC 90 level. Following the success of the continuous monitor, a prototype<br />
portable MEA monitor was developed and also subjected to sea trials in order to investigate<br />
the operability of the instrument on board and to determine the atmospheric concentrations of<br />
MEA accumulated in various compartments within a submarine. The monitor remained fully<br />
functional throughout the trials performed on a submarine, and calibration was stable in excess of<br />
eight months spanning the calibration and trials period. The results from the sea trials indicated<br />
that the atmospheric MEA vapour was more concentrated in the compartment containing the<br />
CO 2 scrubbers. Despite frequent ventilating of the submarine, the MEA concentrations reached<br />
equilibrium over a relatively short period of time, but were maintained below exposure limits.<br />
Ion non-linear drift spectrometer (INLDS) -<br />
a selective detector for high-speed gas chromatography<br />
I.A.Buryakov, Yu. N. Kolomiets, V.B. Louppou<br />
Experimental data on detection of vapours of 2,4-dinitrotoluene (DNT), 2,4,6-trinitrotoluene<br />
(TNT), pentaerythritol tetranitrate (PETN), cocaine, crack in air with INLDS are presented in the<br />
report. Calculated detection limit, linearity, INLDS sensitivity on detecting vapours are given.<br />
Chromatographic analysis of solutions of DNT, TNT, PETN, cocaine, crack, heroin, barbital,<br />
phenatine dihydrophosphate with GC-INLDS is performed. Retention time of chromatographic<br />
peaks and peak width at half height are determined. A possibility to decrease separation time<br />
using selective detector is considered.<br />
Rapid analysis of pesticides on imported fruits by GC-IONSCAN<br />
R. DeBono, A. Grigoriev, R. Jackson, R. James,<br />
F. Kuja, A. T. Le, S. Nacson, A. Rudolph, S.Yin Loveless<br />
A large number of organic compounds are used today for the control of insects, weeds and<br />
diseases on fruits and vegetables, and consequently there is a need for analysis of residue<br />
products, especially on imported fruits and vegetables. Screening for banned pesticides on fruits<br />
and vegetables requires special methods of analysis. In this respect, gas chromatography (GC)<br />
has become one of the most important methods for analyzing pesticides and similar compounds,<br />
due to its separation capabilities and high sensitivity, employing specific detectors such as ECD,<br />
13<br />
16<br />
Copyright © 1998 by International Society for Ion Mobility Spectrometry
mass spectrometry and most recently ion mobility spectrometry. Standard GC investigations,<br />
however, often require sample work-up and may involve a lengthy analysis. This paper addresses<br />
the application of a novel solid phase desorption (SPD) add-on module to the Barringer<br />
GC-IONSCAN system for rapid screening of pesticides on imported fruits. The SPD module<br />
consists of a sliding tray for placing a filter and a desorber to volatilize the sample into a GC<br />
column through a heated six port valve. A preconcentrator sample loop traps volatile and<br />
non-volatile substances during the desorption cycle and releases them by resistive heating into<br />
the analytical column. The GC oven is temperature programmable from ambient to 300°C and<br />
offers ramping rates of 1 to 40°C/min. The GC is additionally fitted with a split/splitless injector<br />
for liquid and gaseous sample injection and a metallic megabore column, resulting in fast analyses.<br />
...<br />
The use of IMS and GC/IMS for analysis of Saliva<br />
Chr. Fuche, A. Gond, D. Collot, C. Faget<br />
Different methods for testing car drivers on illegal drugs are reviewed. Saliva analysis is preferred<br />
for practical reasons. Three technologies are compared for the research of narcotics in saliva :<br />
Ionscan 400, GC/Ionscan and GC/MS<br />
Strategies for smarter chemical sensors<br />
P. de B. Harrington, G. Chen, A. Urbas<br />
Advancements in computer technology are forcing a paradigm shift in the processing of data from<br />
analytical instrumentation. The traditional approach is to signal average data from an analytical<br />
instrument once it achieves a steady-state response (i.e., the signal from the instrument<br />
stabilizes). However, a single signal averaged spectrum from the stabilized instrument response<br />
excludes temporal information that may be exploited to solve significant chemical problems. This<br />
paper presents the opportunities furnished by modeling the dynamical or transient responses of<br />
ion mobility spectrometers. The transient response occurs when the sample is introduced to the<br />
inlet of the instrument and the sample is removed from the inlet of the instrument. In other<br />
cases, for which the sample is thermally desorbed, the transient is introduced by the temperature<br />
time profile of the desorber and sample discrimination that may occur in the transfer lines . A<br />
useful method that is gaining popularity for modeling dynamic or temporal changes in data is<br />
SIMPLISMA . Using SIMPLISMA, the ion mobility data are factored into sets of concentration<br />
profiles and concentration independent spectra. Each feature or IMS peak that varies independently<br />
with respect to the duration of the measurement will be modeled as a separate component.<br />
An example will be presented later. ...<br />
Initial Study of Electrospray Ionization-Ion Mobility Spectrometry<br />
for the Detection of Metal Cations<br />
H.M. Dion, L.K. Ackerman, H.H. Hill, Jr.<br />
ESI-IMS of nine inorganic cation solutions was performed for the first time. Counter ion had a<br />
large effect upon the sensitivity and response ion identity of the cations studied. Several salt<br />
solutions yielded one major cation peak including: aluminum sulfate, lanthanum chloride, strontium<br />
chloride, uranium acetate, uranium nitrate, and zinc sulfate. Aluminum nitrate and zinc<br />
acetate solutions produced multiple cation peaks, which increased the detection limits and difficulty<br />
of identification through comparison with the ESI-MS literature. Predicted detection limits<br />
ranged from 0.33 ppm to 25 ppm depending on the salt solution studied. The identity of the<br />
species detected is unconfirmed, but literature suggests, and drift times support the detection of<br />
cation-solvent or cation-solvent-anion complexes. Finally, strontium and lanthanum chloride<br />
were separated and detected simultaneously with a resolution of 2.2. This is the first research<br />
showing the use of ESI-IMS as a detection and separation method for metal ion and ion complexes<br />
and the results from this study warrant future development of ESI-IMS as a field technique for<br />
the detection of metal contaminants in the environment.<br />
20<br />
26<br />
31<br />
Copyright © 1998 by International Society for Ion Mobility Spectrometry
The use of GC-IMS to analyze high volume vapour samples from cargo containers<br />
P. Lafontaine, P. Pilon, R. Morrison, P. Neudorfl<br />
One avenue of narcotics smuggling is by concealment in cargo containers. Canada Customs statistics<br />
indicate that the value of drugs seized from cargo containers was greatest for cocaine.<br />
Approximately, a million containers enter Canada each year and a manual inspection of each one<br />
is impossible. A quick, inexpensive and effective method of container chemical identification<br />
coupled with intelligence information could target likely containers, serve to interdict drugs and<br />
provide a deterrent to drug smugglers. This paper describes some development of a high volume<br />
air sampling method with subsequent chemical analysis by GC-IMS to provide a rapid method for<br />
cargo container inspection. ...<br />
Evaluation of sample collectors for ion mobility spectrometry<br />
N. Mina, S.P. Hernández, F.R. Román, L.A. Rivera<br />
A series of commercially available filter materials and membranes were studied to investigate<br />
their affinity with various explosives (RDX, NG, TNT, PETN and DNT) and their<br />
adsorption/desorption thermal characteristics using a Barringer IonScan 400 IMS. The filters and<br />
membranes, that withstood the high temperatures of the IMS injector/desorber were made of<br />
either fiberglass or cellulose, fine or coarse porosity of various pore sizes (0.5-40 mm), and<br />
medium to fast flow rate. The data suggest that filter material properties such as pore size,<br />
surface roughness and porosity; flow rate and explosive vapor pressure are parameters that can<br />
influence the IMS response. The affinity of the explosives for the filter material can also influence<br />
IMS response. In general, the filters that showed the best responses were those with smaller<br />
pore size, medium to fine porosity, and medium flow rates. The explosives that showed the best<br />
IMS responses were those with very low vapor pressure such as PETN and RDX. However the<br />
data seem to suggest that the affinity of NG for the filter materials is enhancing its signal close to<br />
the responses seen for RDX and PETN when compared with DNT and TNT that are less volatile<br />
than NG.<br />
Principles and applications of a solid phase desorption unit<br />
coupled to a GC-IONSCAN system<br />
A. Grigoriev, R. Jackson, F. Kuja, S. Nacson and A. Rudolph*<br />
The Barringer Solid Phase Desorption (SPD) unit was developed to allow GC-IONSCAN analyses<br />
of solid samples without prior sample preparation. It attaches to the side of the<br />
GC-IONSCAN and interfaces with it mechanically and electronically (Figure 1). The liquid sample<br />
injection capability of the GC is retained for maximum flexibility. Temperatures of the SPD<br />
desorber, inlet, valve and transfer lines as well as the duration of each stage of the analysis can be<br />
programmed. The SPD-GC-IONSCAN now offers three analysis methods: Direct desorption<br />
IMS, liquid injection GC-IMS and solid phase desorption GC-IMS.<br />
Operational assessment of a handheld ion mobility spectrometry instrument<br />
Chih-Wu Su, St. Rigdon, T. Noble, M. Donahue, C. Ranslem<br />
In 1995, the U.S. Coast Guard made the decision to outfit vessel boarding teams with state of the<br />
art technology to assist them in detecting trace levels of narcotics. Based on an assessment<br />
conducted by the Research and Development Center (R&DC), ion mobility spectrometry (IMS)<br />
was selected as the technology best suited for operational use. Specifically, the Coast Guard<br />
selected the Ionscan, an IMS instrument manufactured by Barringer instruments. A limiting factor<br />
of all models of the Ionscan is its size and power requirements, weighing between 50 and 60<br />
pounds. These limitations typically require that the Ionscan be operated on the Coast Guard<br />
cutter where there is a ready supply of 115VAC power. As a result, samples must be transported<br />
from the vessel being boarded to the Ionscan for analysis. The impact of this protocol is a<br />
loss of time resulting in the inability of the boarding officer to quickly determine areas to resampled.<br />
Additionally, the requirement that the Ionscan operator remain on the cutter results in the<br />
boarding party being reduced by one person.<br />
34<br />
37<br />
41<br />
45<br />
Copyright © 1998 by International Society for Ion Mobility Spectrometry
In-situ methylation of methamphetamine during IONSCAN analysis<br />
Chih-Wu Su, St. Rigdon, Kim Babcock<br />
The Ionscan, an instrument manufactured by Barringer Instruments based on ion mobility<br />
spectrometry (IMS) technology, is well known for its field application in illicit drug interdiction. It<br />
is currently used by the U.S. Coast Guard (CG) and by the Drug Enforcement Agency (DEA) to<br />
support federal, state and local drug cases. The CG Research and Development Center (R&DC)<br />
carried out an investigation to determine the source and identity of an extra peak that appeared<br />
in Ionscan results for Meth, in liquid standard form, on filter paper. It was observed that the<br />
extra peak, tentatively named Meth-2, appeared just after Meth on the Ionscan plasmagram<br />
(Figure 1) and had a drift time similar to that for nicotine. In 1996, Ms. Angela DeTulleo of the<br />
DEA South Central Lab reported that nicotine interfered with the detection of methamphetamine<br />
(Meth) 1 . In 1999, Dr. Peter Harrington’s group from Ohio University in Athens, Ohio,<br />
reported a procedure that could pre-separate Meth and nicotine using the difference in their<br />
vapor pressures and the SIMPLISMA (SIMPL-to-use-Interactive Self-Modeling Mixture Analysis)<br />
method 2 . Although Dr. Harrington’s method solved the nicotine interference problem, it<br />
required the use of an additional device as well as extra sample preparation time. The CG<br />
Research and Development Center (R&DC) has always been involved in the investigation and<br />
development of fast and easy field applicable methods for CG boarding officers to confirm and<br />
reduce/eliminate interferences on target compounds detected by the Ionscan. The unknown<br />
peak called Meth-2 further complicated the observed interference of nicotine with Meth detection.<br />
In order to investigate the nature of Meth-2, a study was launched to isolate and identify it.<br />
Consequently, an interesting in-situ methylation process during Ionscan analysis was discovered.<br />
This paper reports the results of this study as well as some possible applications.<br />
Ion mobility spectrometry in helium with corona discharge ionization source<br />
M. Tabrizchi and T. Khayamian<br />
An ion mobility spectrometer is described using helium as the drift gas and corona discharge as<br />
its ionization source. The observed ion current is approximately seventy times larger than that<br />
noted for the conventional system having 63 Ni as the ionization source. The selectivity factors in<br />
helium are close to those in nitrogen. The relative separation of the peaks in helium is almost<br />
twice as much as that observed in nitrogen. This results in a major enhancement of the resolution.<br />
A two-fold increase in the capacity factor (k') for ions in helium is also realized.<br />
External exit gate Fourier transform ion mobility spectrometry<br />
Ed Tarver, James F. Stamps, Richard T. Jennings, William F. Siems<br />
Ion mobility spectrometry (IMS) has been recognized as one of the most sensitive and robust<br />
techniques for the detection of explosives, narcotics and chemical warfare agents. The extreme<br />
sensitivity and electronic simplicity of IMS instrumentation has offered tremendous theoretical<br />
potential for this analytical technique. While the detection limits achievable with IMS are rivaled<br />
by relatively few alternative methods (e.g., mass spectrometry, biochemical detection, and flame<br />
photometric or other chemically specific detectors interfaced to gas chromatographs), none can<br />
match the combination of sensitivity and speed of response. Coupled with low cost, ruggedness<br />
and atmospheric pressure operation, IMS has promised to be the solution for a variety of analytical<br />
challenges. We have recently demonstrated improved spectral resolution as well as significant<br />
signal-to-noise enhancement by implementing the external exit gate Fourier transform technique<br />
on both commercial and Sandia National Laboratory proprietary IMS instruments. ...<br />
Miniaturized ion mobility spectrometer<br />
M. Teepe, J.I. Baumbach, A. Neyer, H. Schmidt, P. Pilzecker<br />
Miniaturization of an ion mobility spectrometer (IMS) can lead to a handy low cost on-line and<br />
on-site environmental scanning system for exhausts in chemical, waste and petrochemical industries.<br />
Ion mobility spectrometry has changed from a not common known method in the late<br />
sixties to a practical method for the detection of toxic pollutants and explosives and some other<br />
analytes in the atmosphere at ambient pressure and temperature down to the ppb V (parts per<br />
billion) concentration range. The size of a common high resolution IMS (in the range of normal<br />
48<br />
52<br />
57<br />
60<br />
Copyright © 1998 by International Society for Ion Mobility Spectrometry
Personal Computers) makes it useful in process control for industry and in centralised measurement<br />
systems like gateways at airports. But ion mobility spectrometry is a more powerful detection<br />
method than it is now used for. Many other applications are proposed in the scientific<br />
literature. In the growing semiconductor industries, especially for Reactive Ion Etching an on-line<br />
gas control can lead to a more reliable process. New fields of application are possible like ‘intelligent’<br />
on-line control for air conditions in cars and other vehicles. For these applications it is<br />
useful to have a small, fast, economical and powerful analytical on-site and on-line system. A<br />
miniaturized IMS with size of today’s common mobile phones will meet such needs. A prototype<br />
µ-IMS - ten times smaller than conventional ones - with components produced by microstructure-technologies<br />
is presented in this paper. Successful results using this spectrometer are<br />
reported. Finally an outlook to a modular system design with respect to mass production is<br />
shown.<br />
Evolution of IMS technology within the Australian Customs Service<br />
G. Webster<br />
Customs has been using IMS technology since 1997, in the form of the Barringer Ionscan, when<br />
an air cargo examination team at Sydney International Airport commenced an operational evaluation<br />
of the equipment. The location of this one unit and the specially selected officers to manage<br />
it have proven critical to the overall success of the technology. Without the initiative of these<br />
officers we may not have had the first taste of success that ultimately led to the introduction of<br />
further units. This initial success involved the seizure of 330 grams of cocaine concealed in the<br />
frame of a mountain bike. The presence of the cocaine “alarm” confirmed suspicions regarding<br />
the bike, which led to discovery of the illicit drug.<br />
VIP sources for ion mobility spectrometry<br />
H.-R. Döring, G. Arnold, V. L. Budovich<br />
Ion Mobility Spectrometry (IMS) for the detection of chemical warfare agents (CWAs), toxic<br />
industrial chemicals (TICs), drugs and explosives is mainly based on the ionization by radioactive<br />
sources as Ni63, Am 241 and H3, since these sources optimally meet the requirements made on<br />
a portable device for field use: They are small-sized and very lightweight, they have an extremely<br />
good mechanical stability and do not require any additional power. They are very reliable while<br />
displaying an excellent sensitivity with regard to the detection of quite a large number of<br />
compounds of interest. However, for well-known reasons (radiation safety, disposal problems)<br />
there is a growing interest in replacing radioactive sources by alternative ionization techniques. In<br />
the past the most promising candidates for replacing radioactivity were photoionization (PI) and<br />
corona-discharge ionization (CD). ...<br />
Relationships for ion dispersion in ion mobility spectrometry<br />
G.E. Spangler<br />
In recent years, the field of ion mobility spectrometry (IMS) has grown to include not only linear<br />
DC-field IMS, but also asymmetric RF-field IMS. These two approaches to ion mobility spectrometry<br />
produce two types of data that have not yet been correlated with each other. Approaches<br />
to achieving such a correlation is described here.<br />
65<br />
67<br />
71<br />
Copyright © 1998 by International Society for Ion Mobility Spectrometry
Regular Papers<br />
A novel Method for the Detection of MTBE: Ion Mobility Spectrometry coupled to<br />
Multi Capillary Column<br />
Z. Xie, St. Sielemann, H. Schmidt, J.I. Baumbach<br />
A combination of an ion mobility spectrometer with radioactive ionization source and equipped<br />
with a multi capillary column was used as a new analytical method for the detection of MTBE, a<br />
gasoline additive, which has become a potential water pollution problem. To extract MTBE out of<br />
the water a membrane extraction unit was set up, which is simple, effective and easy to automate<br />
with respect to further applications. The analyte was extracted on the one hand directly out of<br />
the water, thus the membrane was completely steeped in the water. On the other hand, the<br />
membrane was held in the gas phase over the surface of the water (head space). The minimum<br />
detectable limit for both methods was about 50 ppb vl of MTBE in water and the reproducibility<br />
with a standard deviation of 8.9 % (head space) and 11.5 % (aqueous phase) rather high. Finally<br />
the utilizability of the system for on-site and on-line measurements is briefly discussed.<br />
Finalisation of a IUPAC/JCAMP-DX data transfer standard<br />
for ion mobility spectrometry data<br />
A.N. Davies, J.I.Baumbach, P. Lampen, H. Schmidt<br />
In the last few years the rapid developments in the field of ion-mobility spectrometry many<br />
several different sites around the world has made it imperative to establish an agreed protocol<br />
for the storage and exchange of experimental data. Under the auspices and guidance of IUPAC<br />
through the Working Party on Spectroscopic Data Standards (JCAMP-DX) and the development<br />
work of the members of the International Society for Ion Mobility Spectrometry such a standard<br />
has been developed which is now in it’s final stages. It will be published as the Appendix to this<br />
paper and placed on the IUPAC web sites for final comment. An example of the usefulness of<br />
these standards as chemical MIME types for the display of spectroscopic data on the web will be<br />
described and an example is available for viewing on the JCAMP-DX web site as well as the web<br />
site of the ISIMS.<br />
77<br />
84<br />
Copyright © 1998 by International Society for Ion Mobility Spectrometry
9 th International Conference on<br />
Ion Mobility Spectrometry<br />
SOCIETY<br />
INTERNATIONA L<br />
for<br />
ION<br />
SP ECTROMETRY<br />
MOBILITY<br />
ISIMS 2000<br />
Halifax, Nova Scotia, Canada<br />
August 13-16, 2000<br />
Papers presented
A Miniature Ion Mobility Spectrometer with<br />
a Pulsed Corona-Discharge Ion Source<br />
Jun Xu, W. B. Whitten, T. A. Lewis, and J. M. Ramsey<br />
Oak Ridge National Laboratory, P. O. Box 2008, Oak Ridge, TN 37831, USA<br />
Abstract<br />
We report studies of a miniature ion mobility<br />
spectrometer (IMS) that employs a pulsed<br />
corona discharge ion source. IMS spectra<br />
were measured as a function of pulse width<br />
and height, drift field, and various corona<br />
ionization configurations. Preliminary results<br />
indicate that pulsed corona discharge ionization<br />
can be used for mm-scale IMS with high<br />
sensitivity and good resolution.<br />
Introduction<br />
There is a consensus among researchers,<br />
developers, and users that miniaturization of<br />
ion mobility spectrometry (IMS) instruments is<br />
desirable for the next generation of IMS [1-3].<br />
We have reported a miniature IMS that has a<br />
drift channel of 1.7 mm in diameter and 37 mm<br />
in length [3]. In testing properties of the<br />
miniature IMS, we used a pulsed Nd:YAG laser<br />
to generate ions. The miniature IMS has been<br />
shown to have a reasonably good resolution.<br />
As the size of IMS instruments is reduced,<br />
there is a need for miniaturized ionization<br />
sources as well.<br />
Although laser ionization is a simple means for<br />
generating ions, it cannot be integrated with a<br />
tiny IMS due to the large size of most laser<br />
systems. For practical use, a new ionization<br />
source is needed for miniature IMS. The<br />
conventional IMS instruments use radioactive<br />
Ni63, which emits electrons with 67 keV kinetic<br />
energy. The problem associated with this<br />
method is the low stopping power of the<br />
high-energy electrons in the small volume of<br />
miniature IMS channel. In addition, the Ni63<br />
source is less likely to be accepted in the<br />
market place because of its radioactive nature.<br />
Another alternative is photoionization by<br />
ultraviolet light [4]. This method also shows<br />
reduced sensitivity in miniature spectrometers<br />
because the photon interaction volume is small<br />
in the miniaturized channel.<br />
Utilization of a pulsed corona discharge ion<br />
source is being explored in this work. The<br />
physics of the corona discharge has been<br />
presented in references [5-7]. The corona tip is<br />
biased to a high potential, which produces a<br />
highly non-uniform field that is sufficient to<br />
generate ions, but insufficient for electrical<br />
breakdown. Recent work by Tabrizchi [7] has<br />
demonstrated that corona discharge ionization<br />
is a very useful method to generate ions for<br />
conventional IMS instruments. It is plausible to<br />
use a corona discharge ion source for a<br />
miniature IMS as well.<br />
Experimental<br />
Our experimental setup of a miniature ion<br />
mobility spectrometer (IMS) that employed a<br />
pulsed corona discharge ion source is shown in<br />
Figure 1. The drift channel, 2.5 mm in diameter<br />
and 47 mm in length, was comprised of 10<br />
stacked metal electrodes separated by Teflon<br />
spacers. Nine miniature resistors (DIGI-KEY,<br />
Thief River Falls, MN), each with 2 MΩ<br />
resistance and 1% uncertainty, were connected<br />
between the electrodes to form a voltage<br />
divider. A power supply (Stanford Research<br />
Systems, Sunnyvale, CA) provided the drift<br />
voltage to the end electrode, with the voltage<br />
being distributed to the intermediate electrodes<br />
through these resistors.<br />
A Ni corona tip with end radius of approximately<br />
25 µm was mounted at the end of the drift<br />
channel, as shown in Fig.1. The tip, together<br />
with the second electrode of the IMS channel,<br />
formed a tip-ring configuration. A pulse was<br />
generated by a pulse generator (DEI, B1010)<br />
and amplified to a high voltage varying from 1-3<br />
Copyright © 2000 by International Society for Ion Mobility Spectrometry
J. Xu et al.: „A miniature ion ...”, IJIMS 4(2001)1,3-6, p. 4<br />
Potential<br />
H. V. Amp<br />
H. V.<br />
Drift Bias<br />
Pulse Gen.<br />
Computer<br />
Figure 1.<br />
Experimental Setup. Top illustrates the drift potential and<br />
the corona pulse.<br />
kV by a high-voltage pulse amplifier (DEI,<br />
GRX-3K). The pulse width varied from 400 ns<br />
to 400 µs with a repetition frequency of 20 Hz.<br />
The high-voltage pule was applied to the<br />
corona tip, as illustrated in the top of Fig. 1, and<br />
was superimposed with the drift potential.<br />
During the period of the high voltage pulse,<br />
ions were generated and confined in the<br />
vicinity of the tip. After the pulse, the ions<br />
moved in the drift field. The corona<br />
discharge pulse also served as the ion<br />
injection process to start the mobility<br />
measurement.<br />
Corona discharge ions were separated<br />
according to their mobilities, and reached a<br />
detector plate (OFHC) located at the end of<br />
the IMS channel. The ion current was sent<br />
to a homemade current amplifier coupled<br />
with a digital oscilloscope (TDS410A,<br />
Tektronix, Wilsonville, OR). The current<br />
amplifier was based on an Analog Devices<br />
preamplifier (Model 549LH). The current<br />
amplifier had a 1-KHz bandwidth with a<br />
gain of 0.08 V/nA. The oscilloscope was<br />
triggered by the corona pulse, which<br />
served as a start signal for the mobility<br />
spectra. The oscilloscope digitized and<br />
averaged the mobility spectra. The spectra<br />
were subsequently stored on an Apple<br />
Macintosh computer running Labview<br />
software.<br />
Copyright © 2000 by International Society for Ion Mobility Spectrometry<br />
TDC/<br />
O’scope<br />
I (nA) / V<br />
Results and Discussions<br />
The initial current generated by<br />
the corona tip was studied by<br />
measuring the current passing<br />
through the ring electrode which<br />
was grounded through a<br />
picoammeter (Keithley, 486). A<br />
blue glow was observed around<br />
the tip in the dark room. The<br />
ratio of the current to the tip bias<br />
(V), I/V, has been plotted as a<br />
function of the tip bias, and<br />
shown in Figure 2. The plot<br />
shows two linear regions. In the<br />
low bias region (< 2250 V), the<br />
corona threshold was 1860 V<br />
with a slope of 6.85x10 -5 nA/V 2 .<br />
In the high bias region, the<br />
threshold was found to be 1960<br />
V with a slope of 9.23x10 -5<br />
nA/V 2 . A graph of I/V versus V<br />
has been referred to as a<br />
Townsend plot [5, 6], with a<br />
linear relationship derived for a low current self<br />
sustained corona discharge. The presence of<br />
two linear regions with different slope may be<br />
due to imperfections of the tip, such as an<br />
asymmetric physical structure. For large tip to<br />
ring separation, these imperfections may be<br />
negligible, resulting in a linear Townsend<br />
0.09<br />
0.08<br />
0.07<br />
0.06<br />
0.05<br />
0.04<br />
0.03<br />
0.02<br />
0.01<br />
0<br />
1700 1900 2100 2300 2500 2700 2900<br />
Bias (V)<br />
Figure 2.<br />
Townsend plot of corona discharge with tip-ring
J. Xu et al.: „A miniature ion ...”, IJIMS 4(2001)1,3-6, p. 5<br />
0.012 -600V<br />
8<br />
Current (V-Eqv.)<br />
-800V<br />
-900V<br />
0.009<br />
-1000V<br />
-1100V<br />
-1300V<br />
0.006<br />
-1500V<br />
-1700V<br />
0.003<br />
Velocity (m/sec)<br />
7<br />
6<br />
5<br />
4<br />
3<br />
2<br />
1<br />
0<br />
0 5 10 15 20 25 30 35 40<br />
E-Field (V/mm)<br />
0.000<br />
0.000 0.005 0.010 0.015 0.020<br />
Time (Sec)<br />
Figure 3.<br />
Mobility spectra of negative ions generated by pulsed corona discharge as a function of drift potentials.<br />
The upper corner plots the velocity of the ions as a function of the drift field.<br />
relationship. We speculate that the asymmetric<br />
structure may be more important when the<br />
distance between the tip and the ring is small (2<br />
mm in the present case). It should be noted<br />
that, if the corona electrode is too close to the<br />
corona electrode, arcing occurs, which may<br />
ultimately limit how small the IMS can be.<br />
Ion mobility spectra of negative ions produced<br />
in air were measured as a function of drift bias,<br />
as shown in Figure 3. For these<br />
measurements, the pulse width was fixed at<br />
1.08 µs and the corona tip bias was +2600V.<br />
Air at atmospheric pressure and room<br />
temperature served as both drift and sample<br />
gas. The velocity of the ion packet was plotted<br />
as a function of the drift electric field, as shown<br />
in the upper corner of Fig. 3. The plot clearly<br />
shows a linear relation between the mobility<br />
velocity and the drift field, as expected. The<br />
current detected at the IMS collection electrode<br />
was found to have a quadratic relation with the<br />
drift field. This is a typical property for IMS that<br />
uses corona discharge as ion source, as<br />
discussed in Ref. 7.<br />
The mechanism responsible for negative ion<br />
formation by pulsed corona discharge is<br />
interpreted as follows: The high field near the<br />
tip generates both electrons and ions through<br />
field assisted ionization in air. The electrons<br />
are captured by O 2, which has an electron<br />
-<br />
affinity of 0.44 eV. O 2 ions then react with<br />
water molecules to form cluster ions, such as<br />
(H 2O)O 2- . This prediction is consistent with<br />
mass spectrometry studies which indicate that<br />
if oxygen is present the dominant reactant ions<br />
produced in corona discharge are the<br />
-<br />
superoxide ion: O 2 and its water clusters<br />
(H 2O)O<br />
- 2 [8].<br />
Measurement of IMS charge as a function of<br />
pulse width showed that the yield of negative<br />
ions detected was optimized at a very narrow<br />
pulse width and then decreased as the pulse<br />
width was increased. These data are<br />
interpreted as indicative of a competitive<br />
process between the formation of negative ions<br />
Copyright © 2000 by International Society for Ion Mobility Spectrometry
J. Xu et al.: „A miniature ion ...”, IJIMS 4(2001)1,3-6, p. 6<br />
and ion capture by the positively biased tip. A<br />
resolution of R=13 was achieved with the<br />
corona discharge miniature IMS under the<br />
described conditions.<br />
Conclusions<br />
A miniature ion mobility spectrometer with a<br />
pulsed corona discharge ionization source has<br />
been successfully demonstrated. A linear<br />
relation between the drift field and ion velocity<br />
was observed, with resolution comparable to<br />
that obtained with laser ionization in a drift cell<br />
of similar dimensions [3], with the potential for<br />
construction of an instrument package of<br />
considerably smaller dimensions.<br />
Acknowledgement<br />
This research was sponsored by the US DOE,<br />
Office of Research and Development. Oak<br />
Ridge National Laboratory is managed by<br />
UT-Battelle, LLC for the U.S. Department of<br />
Energy under contract DE-AC05-00OR22725.<br />
References<br />
[1] Baumbach, J. I. and Eiceman, G. A. Applied<br />
Spectrosc. 1999, 53, 338A-355A, and references<br />
therein.<br />
[2] R. A. Miller, G. A. Eiceman, E. G. Nazarov, and T. A.<br />
King, Technical Digest, Solid-State Sensor and<br />
Actuator Workshop, Hilton Head Island, SC, 2000,<br />
page 120.<br />
[3] Jun Xu, William B. Whitten, and J. Michael Ramsey,<br />
Anal. Chem. In Press<br />
[4] M. A. Baim, R. L. Eatherton, and H. H. Hill, Jr., Anal.<br />
Chem. 55, 1761 (1983).<br />
[5] J. M. Meek and J. D. Craggs, Electric Breakdown of<br />
Gases(Wiley, Chichster, 1978).<br />
[6] Yu. P. Raizer, gas Discharge Physcis, (Springer,<br />
Berlin, 1991).<br />
[7] M. Tabrizchi, T. Khayamian, and N. Taj, Rev. Sci.<br />
Instrum., 71, 2321 (2000).<br />
[8] C. J. Proctor and J. F. J. Todd, Org Mass Spectrom.<br />
18, 509 (1983).<br />
Copyright © 2000 by International Society for Ion Mobility Spectrometry
The development and sea trials of a prototype portable ion mobility<br />
spectrometer for monitoring monoethanolamine on board submarines<br />
H.R. Bollan 1 , J.L. Brokenshire 2<br />
1<br />
Sea Technology Group/Submarines, Defence Procurement Agency, MOD Abbey Wood, Bristol, UK<br />
2<br />
Graseby Dynamics Ltd., Bushey, Watford, Herts, UK<br />
ABSTRACT<br />
Monoethanolamine (MEA) is used in equipment<br />
installed in submarines for the purpose of<br />
scrubbing carbon dioxide (CO 2) from the<br />
enclosed atmosphere. Previously, a prototype<br />
fixed-point continuous monitor for MEA was<br />
developed[1] and subjected to sea trials on a<br />
submarine. The concentration of MEA was<br />
monitored in the CO 2 scrubber compartment<br />
over a period of three months and found to be<br />
within the maximum permissible concentration<br />
for a continuous ninety-day period (MPC 90) for<br />
the majority of the patrol. The concentration<br />
only briefly exceeded the MPC 90 but did not<br />
exceed the MPC 24 (MPC for a continuous<br />
24-hour period), and was rendered very quickly<br />
below the MPC 90 level. Following the success<br />
of the continuous monitor, a prototype portable<br />
MEA monitor was developed and also<br />
subjected to sea trials in order to investigate<br />
the operability of the instrument on board and<br />
to determine the atmospheric concentrations of<br />
MEA accumulated in various compartments<br />
within a submarine. The monitor remained fully<br />
functional throughout the trials performed on a<br />
submarine, and calibration was stable in excess<br />
of eight months spanning the calibration and<br />
trials period. The results from the sea trials<br />
indicated that the atmospheric MEA vapour was<br />
more concentrated in the compartment<br />
containing the CO 2 scrubbers. Despite frequent<br />
ventilating of the submarine, the MEA<br />
concentrations reached equilibrium over a<br />
relatively short period of time, but were<br />
maintained below exposure limits.<br />
INTRODUCTION<br />
An instrument designed for the continuous<br />
fixed-point monitoring of MEA was developed<br />
Copyright © 2000 by International Society for Ion Mobility Spectrometry<br />
[1], evaluated, calibrated, and subjected to sea<br />
trials in the CO 2 scrubber compartment of a<br />
submarine. The purpose of the trial was<br />
two-fold. It was necessary to determine the<br />
atmospheric concentrations of MEA and to<br />
prove the functionality of the prototype<br />
instrument. As reported previously[1] the<br />
monitor was capable of detecting MEA over a<br />
range of temperatures and without interference<br />
from other contaminant species normally found<br />
in the atmosphere of a submarine, at their<br />
respective MPC 90s. Due to the success of the<br />
project, the Ship Support Agency / Marine<br />
Auxiliary Environmental and Steam Integrated<br />
Project Team MAES5c (SSA/MAES5c)<br />
sponsored the Defence Evaluation and<br />
Research Agency (DERA) Bridgwater<br />
Laboratories with the development of a<br />
prototype portable MEA monitor. The purpose<br />
of this project was to evaluate the operation<br />
and suitability of the instrument for monitoring<br />
on board of a different class of submarine, and<br />
to determine the concentrations not only in the<br />
scrubber compartment but also in as many<br />
other compartments as possible.<br />
The prototype portable MEA monitor was based<br />
upon the hand-held Chemical Agent Monitor<br />
(CAM). A CAM was modified by replacement of<br />
the normal membrane inlet system with a direct<br />
inlet system, and the dopant chemical was<br />
changed from acetone to 4-heptanone in order<br />
to improve resolution, response and recovery<br />
characteristics. The range of the instrument<br />
was set up to encompass the MPC 90 and , if<br />
possible the MPC 24. As well as not being<br />
affected by interference from normal<br />
atmospheric contaminants within the submarine<br />
(already shown possible with the continuous<br />
MEA monitor), the portable monitor would have<br />
© British Crown Copyright 2000/MOD -<br />
Published with the permission of the Controller of Her Britannic Majesty’s Stationery Office
H.R. Bollan and J.L. Brokenshire: „The development and sea trials...”, IJIMS 4(2001)1,7-12, p. 8<br />
to function under various conditions of airflow,<br />
pressure, and relative humidity.<br />
TEST METHODS AND EQUIPMENT<br />
MEA vapour generation and calibration<br />
Vapour generators were set up with permeation<br />
sources installed, to deliver a range of<br />
concentrations of MEA vapour under conditions<br />
of dynamic air flow. The MEA vapour was<br />
sampled from the exhaust of the generator<br />
using an impinger containing 18 mN methane<br />
sulphuric acid as the sampling medium. The<br />
collected samples were then analysed using ion<br />
chromatography.<br />
Prototype MEA monitor<br />
In order to provide the required performance for<br />
MEA monitoring, including sensitivity, speed of<br />
response and recovery, and immunity to false<br />
alarms, a number of changes to a CAM were<br />
required. These included the replacement of<br />
the membrane inlet system (which results in<br />
very long response and recovery times), by a<br />
capillary inlet system. The recirculating system<br />
of CAM provides a slight negative pressure<br />
within the detector, which is used to produce a<br />
continuous inward flow through the capillary<br />
inlet. The dimensions of the capillary were<br />
selected such that the net flow resulted in an<br />
appropriate rate of sample ingress, while<br />
maintaining a reasonably dry air stream in the<br />
detector and hence an acceptable sieve pack<br />
life. The chosen capillary dimensions result in<br />
high sample velocity and minimal residence<br />
time giving rapid response and recovery<br />
characteristics compared with the membrane<br />
inlet.<br />
In order to provide the necessary selectivity, in<br />
particular the ability to operate in the presence<br />
of ammonia, the ion molecule chemistry had to<br />
be changed. The acetone permeation source,<br />
used in CAM, was removed and a special<br />
adaptor fitted in its place. This adaptor carried<br />
inlet and outlet flow tubes to a much larger<br />
permeation source containing 4-heptanone,<br />
external to the sieve pack. This higher<br />
molecular weight ketone generated at greater<br />
concentration than acetone results in the<br />
dynamic range and degree of selectivity<br />
required for the MEA monitor. The MEA<br />
monitor was programmed to give the required<br />
response characteristics by removing the<br />
existing data from the CAM EEPROM and<br />
replacing with appropriate mobility windows and<br />
look up tables for MEA. The look up tables are<br />
used to convert the signal from the collector<br />
electrode to display output.<br />
Prototype portable MEA monitor testing<br />
The MEA monitor was connected to a personal<br />
computer, programmed with the necessary<br />
software to record trials data, according to the<br />
instructions provided. Details of each test were<br />
recorded into a note file and the computer set<br />
to collect data. The MEA monitor was exposed<br />
to the MEA vapour source until a stable MEA<br />
product ion peak was observed in the ion<br />
mobility spectrum; the spectrum was stored<br />
and displayed on the PC. With the nozzle<br />
protective cap in place, collection of ion mobility<br />
spectra was continued until full recovery of the<br />
response was observed.<br />
EXPERIMENTAL<br />
Pre-trials evaluation<br />
Response and recovery characteristics were<br />
determined from ion mobility spectra collected<br />
during exposure cycles to the calibrated levels<br />
of MEA ranging from 0.16 vpm to 2.69 vpm.<br />
The data recorded included RIP and MEA peak<br />
drift times and amplitudes for exposure to a<br />
nominal concentration of 0.5 vpm of MEA<br />
vapour (equivalent to the MPC 90), determined<br />
as 0.47 vpm MEA.<br />
Sea trials<br />
The monitor and portable computer were taken<br />
on board an attack submarine. Readings and<br />
spectra were recorded in the various<br />
compartments in the submarine. The data was<br />
returned to the laboratory for post trials<br />
analysis,<br />
Post trials calibration<br />
The monitor was returned to DERA Bridgwater<br />
for calibration checks.<br />
RESULTS<br />
Pre-trials evaluation<br />
The MEA peak amplitudes as a function of<br />
time, when sampling 0.47 vpm MEA, are shown<br />
in figure 1. The MEA peak amplitude stabilised<br />
very quickly. The ratio of MEA peak to RIP drift<br />
times varied over the range 1.222 to 1.179; in<br />
figure 2 it can be seen that the ratio is relatively<br />
constant throughout the monitor operation.<br />
Copyright © 2000 by International Society for Ion Mobility Spectrometry
H.R. Bollan and J.L. Brokenshire: „The development and sea trials...”, IJIMS 4(2001)1,7-12, p. 9<br />
MEA peak amplitude<br />
100<br />
90<br />
80<br />
70<br />
60<br />
50<br />
40<br />
30<br />
20<br />
10<br />
0<br />
0 100 200 300 400 500<br />
Elapsed time/mins<br />
Figure 1: MEA peak amplitude as a function of time<br />
Response and recovery<br />
The rates of response and recovery of the<br />
monitor to MEA as a function of concentration<br />
are shown in figures 3 and 4. The MEA peak<br />
amplitudes for the pre-trials evaluation<br />
concentrations are summarised in table 1 and<br />
the calibration curve plotted in figure 5.<br />
Dynamic range<br />
Figure 6 shows the equilibrium response<br />
spectrum 2.69 vpm MEA. At 2.69 vpm the RIP<br />
was not depleted, showing that the dynamic<br />
range could be extended to a higher<br />
concentration of MEA monitoring, but that at<br />
the higher level the sensitivity was decreased<br />
i.e. the change in amplitude became smaller<br />
with increase in MEA concentration.<br />
Sea trials<br />
The monitor remained functional throughout the<br />
trials and showed that the levels of MEA varied<br />
throughout the submarine, the highest<br />
concentration was in the compartment housing<br />
the CO 2 scrubbers, diminishing with distance<br />
from this compartment, and showed a<br />
considerable homogeneity away from the<br />
immediate vicinity of the scrubber<br />
compartment. There were some areas where<br />
no MEA peak was recorded in the spectra.<br />
2<br />
Ratio of MEA to RIP drift times<br />
1.5<br />
1<br />
0.5<br />
0<br />
0 100 200 300 400 500<br />
Elapsed time/mins<br />
Figure 2: Ratio of MEA peak to RIP drift times as a function of time<br />
Copyright © 2000 by International Society for Ion Mobility Spectrometry
H.R. Bollan and J.L. Brokenshire: „The development and sea trials...”, IJIMS 4(2001)1,7-12, p. 10<br />
MEA peak amplitude<br />
90<br />
80<br />
70<br />
60<br />
50<br />
40<br />
30<br />
20<br />
10<br />
0<br />
0 50 100 150 200 250 300<br />
Elapsed time/secs<br />
0.16 vpm<br />
0.25 vpm<br />
0.47 vpm<br />
0.82 vpm<br />
1.14 vpm<br />
2.69 vpm<br />
Figure 3: Rate of monitor response to MEA as a function of concentration<br />
MEA peak amplitude<br />
90<br />
80<br />
70<br />
60<br />
50<br />
40<br />
30<br />
20<br />
10<br />
0<br />
0 50 100 150 200 250 300<br />
Elapsed time/secs<br />
0.16 vpm<br />
0.25 vpm<br />
0.47 vpm<br />
0.82 vpm<br />
1.14 vpm<br />
2.69 vpm<br />
Figure 4: Rate of monitor recovery from MEA as a function of concentration<br />
Table 1: Summary of equilibrium responses to MEA as a function of concentration<br />
MEA concentration<br />
(vpm)<br />
0.16<br />
0.25<br />
0.47<br />
0.82<br />
1.14<br />
2.69<br />
Equilibrium MEA<br />
peak amplitude<br />
19<br />
25<br />
41<br />
52<br />
64<br />
89<br />
Time to<br />
equilibrium<br />
response (min)<br />
2½<br />
1½<br />
2<br />
2<br />
1½<br />
2<br />
Time to recovery<br />
(sec)<br />
45<br />
180<br />
Copyright © 2000 by International Society for Ion Mobility Spectrometry
H.R. Bollan and J.L. Brokenshire: „The development and sea trials...”, IJIMS 4(2001)1,7-12, p. 11<br />
90<br />
80<br />
70<br />
60<br />
50<br />
40<br />
30<br />
20<br />
10<br />
0<br />
0 0.5 1 1.5 2 2.5 3<br />
Figure 5: MEA peak amplitude as a function of concentration<br />
Post trials calibration check<br />
The calibration check of the monitor after<br />
completion of the trials indicated that the<br />
calibration was satisfactory.<br />
DISCUSSION<br />
The MEA Monitor is a hand-held instrument of<br />
dimensions 390 mm x 145 mm x 80 mm,<br />
weighing approximately 2.5 Kg, including a 6V<br />
Ni/Cd rechargeable battery. The replacement of<br />
the membrane, which requires heating, with a<br />
capillary inlet results in less power being<br />
drained from the battery , thus extending<br />
battery life compared with CAM. The life of the<br />
battery under these conditions has not yet been<br />
determined. There is an automatic battery<br />
check so if the voltage becomes too low a<br />
warning symbol is displayed.<br />
The monitor was designed to determine the<br />
concentration of monoethanolamine vapour<br />
and is ideally suited for use in submarine<br />
environments. The MEA monitor incorporates<br />
the widely proven detection system from the<br />
original CAM, with enhanced sampling and<br />
detection systems, which provide improved<br />
response and recovery characteristics and<br />
greater interference rejection.<br />
Amplitude<br />
200<br />
150<br />
100<br />
RIP: drift time 10.282<br />
ms amplitude 115<br />
units<br />
MEA: drift time 12.093 ms<br />
amplitude 89 units<br />
50<br />
0<br />
1 8<br />
15 22 29 36 43 50 57 64 71 78 85 92 99 106113120127134141148155162169176183190197204211218225232239246253<br />
Drift time<br />
Figure 6: Ion mobility spectrum for equilibrium response to 2.69 vpm MEA<br />
Copyright © 2000 by International Society for Ion Mobility Spectrometry
H.R. Bollan and J.L. Brokenshire: „The development and sea trials...”, IJIMS 4(2001)1,7-12, p. 12<br />
The specification drawn from the trials is as<br />
follows: limit of detection 0.05 vpm; dynamic<br />
range 0.05 – 2.5 vpm; 90 % response < 2<br />
minutes (typical); 90 % recovery < 4 minutes<br />
(typical); environmental temperature 0C to +<br />
40C operating and - 30C to + 70C storage.<br />
The response and recovery characteristics<br />
emphasise the difficulties of monitoring high<br />
surface active materials such as MEA where<br />
prolonged exposure to high concentrations<br />
results in longer recovery times, and exposure<br />
to lower concentrations results in longer initial<br />
response times.<br />
The analysis of the trials data showed that the<br />
bar responses were always equivalent to<br />
between four and seven bars, out of a possible<br />
maximum of eight bars, equivalent to a range<br />
of 0.5 vpm to 2.5 vpm in the scrubber<br />
compartment. The MEA concentration in one<br />
other compartment reached 0.25 vpm on one<br />
occasion, but generally only trace levels of<br />
MEA vapour, between 0.05 vpm and 0.1 vpm,<br />
were detected in the other compartments<br />
where MEA vapour was registered. This<br />
indicated that MEA vapour spread into other<br />
parts of the submarine adjacent to or linked to<br />
the scrubber compartment, or that some MEA<br />
is being carried over from the scrubber.<br />
CONCLUSIONS<br />
The development of the MEA monitor as a<br />
convenient, hand-held robust means of<br />
detecting MEA vapour in real time was<br />
successful. The monitor was capable of<br />
detecting the required dynamic range and had<br />
an appropriate limit of detection.<br />
As MEA has been recorded at various<br />
concentrations in the submarine atmosphere<br />
there is a requirement for localised real-time<br />
monitoring of the vapour.<br />
The Monitor was not only useful for determining<br />
MEA concentrations but also the length of time<br />
required for MEA concentrations to accumulate.<br />
REFERENCES<br />
[1] H R Bollan, D J West, J L Brokenshire ”Assessment<br />
of ion mobility spectrometry for monitoring<br />
monoethanolamine in recycled atmospheres” Int. J.<br />
for IMS 1(1998)1<br />
ACKNOWLEDGEMENTS<br />
The preparation and presentation of this paper<br />
was sponsored by the Defence Procurement<br />
Agency, Sea Technology Group/Submarines.<br />
The work was sponsored by the Ship Support<br />
Agency, Marine Auxiliary Environmental and<br />
Steam Integrated Project Team MAES5c<br />
(SSA/MAES235c), MoD Foxhill, Bath, under<br />
contract to the Defence Evaluation and<br />
Research Agency (DERA), Bridgwater<br />
Laboratories, with sub contract development<br />
assigned to Graseby Dynamics Ltd., Bushey,<br />
Watford. The sea trials were performed by Lt<br />
Cdr M H Lunn RN, MAES5c, and laboratory<br />
work was carried out by Tim Kelley and David<br />
West of DERA Bridgwater.<br />
Copyright © 2000 by International Society for Ion Mobility Spectrometry
Ion non-linear drift spectrometer (INLDS) - a selective detector for<br />
high-speed gas chromatography<br />
I.A.Buryakov, Yu. N. Kolomiets, V.B. Louppou<br />
The Design & Technological Institute of Instrument Engineering for Geophysics and Ecology, the Siberian Branch of<br />
RAS, 3/6 Pr. Ak. Koptyuga, 630090, Novosibirsk, Russia<br />
Abstract<br />
Experimental data on detection of vapours of<br />
2,4-dinitrotoluene (DNT), 2,4,6-trinitrotoluene<br />
(TNT), pentaerythritol tetranitrate (PETN),<br />
cocaine, crack in air with INLDS are presented<br />
in the report. Calculated detection limit,<br />
linearity, INLDS sensitivity on detecting vapours<br />
are given. Chromatographic analysis of<br />
solutions of DNT, TNT, PETN, cocaine, crack,<br />
heroin, barbital, phenatine dihydrophosphate<br />
with GC-INLDS is performed. Retention time of<br />
chromatographic peaks and peak width at half<br />
height are determined. A possibility to decrease<br />
separation time using selective detector is<br />
considered.<br />
DESCRIPTION OF THE TECHNIQUE<br />
The most efficient means for high-speed<br />
detection of chemical compounds in air are gas<br />
chromatographs. In the field of analytical<br />
devices the trend today is to decrease<br />
separation time. Such fast chromatographic<br />
separation is completed with a relatively low<br />
resolution (∼10 3 theoretical plates). Therefore,<br />
to ensure a highly reliable detection detectors<br />
with a high selectivity are required. Ion<br />
non-linear drift spectrometer (INLDS) meets<br />
these requirements.<br />
INLDS operation consists in sampling, sample<br />
ionization, ion separation in a carrier gas<br />
stream in a strong electric field and registration<br />
of separated ions [1,2]. A mixture of ions of<br />
different types is separated in INLDS by the<br />
electric field strength dependence of the<br />
mobility coefficient. Ion drift velocity V d, caused<br />
by an action of electric field is [3]:<br />
V d = K(0) (1+α(E)) E, (1)<br />
where K(0) is the mobility coefficient in a weak<br />
field, E is electric field strength, α(E) is<br />
normalized function which describes the electric<br />
field dependence of the mobility.<br />
Under the action of periodic alternating<br />
asymmetric waveform field E d (t) that meets the<br />
conditions:<br />
T<br />
∫<br />
0<br />
2b<br />
, < E (t) >≠0,<br />
+ 1<br />
E (t)dt E (t) > = 0<br />
d<br />
≡<<br />
d<br />
(2)<br />
(b>1 is an integer) ions executing oscillatory<br />
motions (period T) drift with velocity V i [1].<br />
The drift is compensated by constant field:<br />
E c = /(1++) (3).<br />
With E c changing and E d(t) given spectrum of a<br />
mixture of ions of all types is recorded [2].<br />
High selectivity permits the use of INLDS as a<br />
detector in a gas chromatograph and allows<br />
selective detection of chromatographic fraction,<br />
which reduces separation time and<br />
requirements placed upon the column<br />
efficiency. This is revealed with the use of GC<br />
with a high-speed multicapillary column (MCC)<br />
[4].<br />
EXPERIMENTAL<br />
Block diagram of GC-INLDS is given on Fig.1.<br />
INLDS comprises an ionization chamber with<br />
63<br />
Ni, an ion separation chamber formed by two<br />
electrodes which are coaxial cylinders 7 cm in<br />
length, 1 and 0.68 cm in diameter, an ion<br />
detection system and a voltage generator. Ions<br />
with purified air with flow rate Q t=50 cm 3 /sec<br />
are transported through the separation<br />
chamber. The generator has the following<br />
parameters: voltage form<br />
f(t)= (sin[π⋅(t-mT) /τ]-2τ / πT) / (1-2τ / πT), with<br />
mT ≤ t ≤ (mT+τ), f(t)=- (2τ / πT) / (1-2τ / πT),<br />
with (mT+τ) ≤ t ≤ (m+1)T (m ≥ 0 - is an integer),<br />
d<br />
Copyright © 2000 by International Society for Ion Mobility Spectrometry
Buryakov et al.: „Ion non-linear drift spectrometer...”, IJIMS 4(2001)1, 13-15, p. 14<br />
8 1 2 3 4<br />
9<br />
10<br />
11<br />
12<br />
±<br />
7<br />
5<br />
U d<br />
U c<br />
6<br />
I<br />
temperature T c was 175°C, column gas<br />
flow rate was Q c = 0.8 cm 3 /s.<br />
Values of saturated vapour<br />
concentration C eq of explosives [5]:<br />
DNT-55.7ppb (v/v), TNT -9.4ppb,<br />
PETN-18ppt and cocaine-300ppt. For<br />
chromatographic studies we used<br />
acetone solutions of (g/l): DNT-3x10 -3 ,<br />
TNT-2,5x10 -4 , PETN-1,4x10 -4 ,<br />
trotyl-3x10 -4 , ethanol solutions of:<br />
barbital<br />
((C 2H 5) 2CCONHCONHCO)-1.41,<br />
crack-1, heroin-0.88, phenatine<br />
dihydrophosphate<br />
(C 15H 16N 2O.2H 3PO 4)-1.07, methanol<br />
solution of cocaine-1 of ”Alltech”.<br />
Figure1:<br />
Block-diagram of GC-INLDS :<br />
1-ionizer, 2- 63 Ni, 3-separator, 4-electrodes, 5-generator,<br />
6-collector, 7-electrometer, 8-syringe injector, 9-MCC,<br />
10-oven, 11-pneumatic switch, 12-compound.<br />
high-voltage pulse duration τ = 1.9 µsec, T = 5,9<br />
µsec, dispersion voltage amplitude U d= 1÷4 kV.<br />
Sampling flow rate Q ex=5 cm 3 /s.<br />
GC comprising a syringe injector (volume of<br />
1µl), a chromatographic oven and MCC 0.2 m<br />
in length containing 1000 capillaries 4x10 -5 m in<br />
diameter coated with phase SE-30 was used.<br />
As a carrier-gas purified air was used. The time<br />
of sample injection was 0.3 s. Column<br />
Ion Current, r.a.<br />
-15 -5 5 15 25 35<br />
U c , V<br />
Figure 2:<br />
Drift-spectra of air containing vapours of: a)<br />
phenatine, b) barbital, c) crack (positive mode) and<br />
d) DNT, e) TNT, f) PETN (negative mode).<br />
a)<br />
b)<br />
c)<br />
d)<br />
e)<br />
f)<br />
RESULTS AND DISCUSSION<br />
Selective detection of explosives<br />
and drug vapours in air with INLDS.<br />
Drift spectra of air containing vapours<br />
of compounds: DNT, TNT, PETN,<br />
phenatine, barbital obtained under<br />
negative mode and vapours of cocaine and<br />
crack under positive mode are given on Fig.2.<br />
No difference between the drift spectra of pure<br />
air and air containing heroin vapours was<br />
revealed. Reference to Fig. 2 shows that peaks<br />
of explosives are completely separated from<br />
one another and from background. On<br />
analysing phenatine and barbital several types<br />
of ions are detected. Peaks of cocaine and<br />
crack completely coincide with one another and<br />
partially overlap with the background. It should<br />
be mentioned that to detect explosives,<br />
barbital, phenatine positive U c is to be applied<br />
(α(E) >0). U c is negative for ions of cocaine.<br />
Analytical characteristics of INLDS. The<br />
concentration dependence of the detector<br />
signal is expressed by: I=D×C k , where D is a<br />
constant, k refers to sensitivity coefficient, C is<br />
the compound concentration. Calculated<br />
detection limit (L) and the concentration<br />
dependence I(C) are presented in Table 2<br />
(columns 2, 3). The double width of zero line<br />
was 4 fA. With the given k values the range<br />
width was over 10 3 on detecting DNT and TNT<br />
and equal to ~ 300 on detecting cocaine. The<br />
detection time of one compound did not exceed<br />
1 s.<br />
Chromatographic analysis of solutions.<br />
Retention times (t R) and peak width at half<br />
height of (µ 1/2) detected with GC-INLDS along<br />
Copyright © 2000 by International Society for Ion Mobility Spectrometry
Buryakov et al.: „Ion non-linear drift spectrometer...”, IJIMS 4(2001)1, 13-15, p. 15<br />
r.a<br />
1<br />
0<br />
1.7<br />
U c , V<br />
2.6<br />
3.5<br />
0<br />
10<br />
20<br />
t, s<br />
a)<br />
r.a.<br />
1<br />
0<br />
U c ,V<br />
-10 -5<br />
0<br />
10<br />
50<br />
40<br />
30<br />
20<br />
t, s<br />
b)<br />
Figure 3:<br />
Chromato-drift-spectra of solutions of: a) military trotyl consisting of DNT and TNT (U d=-1.8 kV. Q c=0.5<br />
cm 3 /s and T c=150°C), b) criminal crack. (U d=-4 kV).<br />
with the fundamental parameters of INLDS,<br />
such as: ion sign, compensation voltage (U c),<br />
peak width at half height of (DU c1/2), current<br />
amplitude on detecting chromatographic<br />
compound fraction (I) are presented in Table 1.<br />
One can see from the tabulated data that the<br />
lower is the retention time, the lower is the<br />
column efficiency.<br />
The results obtained with GC-INLDS upon<br />
scanning voltage U c over a chosen range of<br />
values at regular intervals are presented as<br />
three-dimensional chromato-drift-spectra,<br />
where U c of INLDS is plotted on the abscissa, t R<br />
is laid off as ordinate and I is plotted on Z axis.<br />
Chromato-drift-spectra of solutions of: a)<br />
military trotyl consisting of DNT and TNT, b)<br />
criminal crack are given on Fig.3. The time of<br />
recording one drift-spectrum is 1 sec. It is<br />
evident from Fig.3à that peaks of DNT and TNT<br />
are completely separated both in retention time<br />
and compensation voltage U c. Fig.3b shows<br />
sufficient degree of separation between peaks<br />
of cocaine and background.<br />
The results of testing have shown a possibility<br />
for selective detection of vapours DNT, TNT,<br />
PETN, cocaine, crack, barbital, heroin,<br />
phenatine with INLDS and GC(MCC)-INLDS.<br />
REFERENCES<br />
[1] M.P. Gorshkov. Inventor’s Certificate of USSR, No.<br />
966583 (1982).<br />
[2] I.A. Buryakov, E.V. Krylov, E.G. Nazarov, U.Kh.<br />
Rasulev. Int. J. of Mass Spec. and Ion Pros. 128:<br />
143-48 (1993).<br />
[3] E.A. Mason and E.W. McDaniel. John Wiley & Sons,<br />
New York, 1988, p. 160.<br />
[4] V.P. Soldatov, I.I. Naumenko, A.P. Ephimenko. Pat.of<br />
Russia, No. 16512000 (1991)..<br />
[5] V.C. Dionne, D.P. Roundbehler, E.K. Achter, R.J.<br />
Hobbs, D.H. Fine. J. of Ener. Mater. 4: 447 (1986).<br />
Table 1: Parameters of GC-INLDS on detecting solutions of explosives and drugs.<br />
Compound<br />
DNT<br />
TNT<br />
PETN<br />
Cocaine<br />
Crack<br />
Barbital<br />
Heroin<br />
Phenatine<br />
L, (ppt)<br />
2<br />
0.4<br />
0.6<br />
0.1<br />
I(fA) =D·C k (ppt)<br />
I =3×C 0.6<br />
I =12×C 0.7<br />
I =9×C 0.85<br />
I =40×C 0.85<br />
t R, c<br />
4.3<br />
7.2<br />
10<br />
51<br />
15<br />
206<br />
49<br />
m 1/2, c<br />
0.65<br />
0.8<br />
1<br />
3.2<br />
3<br />
9.4<br />
4.7<br />
Sign<br />
-<br />
-<br />
-<br />
+<br />
-<br />
+<br />
-<br />
U c, B<br />
11.5<br />
7.2<br />
2.1<br />
-3.3<br />
31<br />
3.85<br />
3.3<br />
DU c1/2, B<br />
0.9<br />
0.85<br />
0.8<br />
1.7<br />
6.5<br />
3.1<br />
1.4<br />
I, fA<br />
680<br />
580<br />
160<br />
1700<br />
2200<br />
30<br />
260<br />
60<br />
Copyright © 2000 by International Society for Ion Mobility Spectrometry
Rapid analysis of pesticides on imported fruits by GC-IONSCAN<br />
R. DeBono 2 , A. Grigoriev 1 , R. Jackson 1 , R. James 1 , F. Kuja 1 , A. Loveless 1<br />
T. Le 2 , S. Nacson 1 , A. Rudolph 1 and S.Yin 2<br />
1<br />
Barringer Research Ltd., 1730 Aimco Boulevard, Mississauga, Ontario L4W 1V1, Canada<br />
2<br />
Barringer Instrument Inc., 30 Technology Drive, Warren, New Jersey 07059, USA<br />
Introduction<br />
A large number of organic compounds are used<br />
today for the control of insects, weeds and<br />
diseases on fruits and vegetables, and<br />
consequently there is a need for analysis of<br />
residue products, especially on imported fruits<br />
and vegetables. Screening for banned<br />
pesticides on fruits and vegetables requires<br />
special methods of analysis. In this respect,<br />
gas chromatography (GC) has become one of<br />
the most important methods for analyzing<br />
pesticides and similar compounds, due to its<br />
separation capabilities and high sensitivity,<br />
employing specific detectors such as ECD,<br />
mass spectrometry and most recently ion<br />
mobility spectrometry. Standard GC<br />
investigations, however, often require sample<br />
work-up and may involve a lengthy analysis.<br />
This paper addresses the application of a novel<br />
solid phase desorption (SPD) add-on module to<br />
the Barringer GC-IONSCAN system for rapid<br />
screening of pesticides on imported fruits. The<br />
SPD module consists of a sliding tray for<br />
placing a filter and a desorber to volatilize the<br />
sample into a GC column through a heated six<br />
port valve. A preconcentrator sample loop<br />
traps volatile and non-volatile substances<br />
during the desorption cycle and releases them<br />
by resistive heating into the analytical column.<br />
The GC oven is temperature programmable<br />
from ambient to 300°C and offers ramping<br />
rates of 1 to 40°C/min. The GC is additionally<br />
fitted with a split/splitless injector for liquid and<br />
gaseous sample injection and a metallic<br />
megabore column, resulting in fast analyses.<br />
Sample investigation involves wiping the<br />
exterior of a fruit with a Teflon or fiberglass filter<br />
and placing the filter onto the sliding tray of the<br />
SPD module. The analysis is initiated by<br />
sliding the tray into the SPD module. Total<br />
cycle time varies depending on the number of<br />
pesticides being examined and is in the range<br />
of 5 to 10 minutes per sample.<br />
Alternatively, the collected filter or a sample<br />
directly can be extracted with 1mL of acetone<br />
or other appropriate solvents, and an aliquot,<br />
usually 1-5µL, is injected into the heated<br />
injector of the GC-IONSCAN system. The<br />
instrument also enables direct thermal<br />
desorption of the filter into the IMS (non-GC<br />
mode) for rapid sample screening when the<br />
sample matrix is not too complex.<br />
Most pesticides examined in this study were<br />
detected in the negative ion mobility mode<br />
where they were ionized through an<br />
electron-capture process in the reaction region<br />
by a 63 Ni ionization source. Other pesticides<br />
may be examined in the positive ion mode,<br />
where ionization occurred by proton transfer<br />
from the chemical ionization reagent<br />
nicotinamide.<br />
Detection limits at picogram levels for<br />
pesticides listed in the EPA 8081 method were<br />
demonstrated. The identification of pesticides in<br />
the samples was based on their GC retention<br />
time and specific reduced mobility K o.<br />
Experimental<br />
Figure 1 shows a schematic plumbing diagram<br />
of the instrument with the three modes of<br />
sample introduction.<br />
The GC-IONSCAN was operated in negative<br />
ion mode with a drift tube temperature of<br />
105°C. The drift flow was 300cc/min, the inlet<br />
temperature was 240°C and the desorber<br />
temperature was 225°C.<br />
The SPD operating conditions were as follows:<br />
Inlet temperature 240°C, desorber temperature<br />
260°C, transfer line temperature from desorber<br />
Copyright © 2000 by International Society for Ion Mobility Spectrometry
R. DeBono et al.: „Rapid analysis of pesticides...”, IJIMS 4(2001)1,16-19, p. 17<br />
Solid Phase Desorption GC-IMS<br />
N 2 Ccarrier Gas<br />
Filter Desorber<br />
Preconcentration Loop<br />
GC Oven<br />
Megabore Column<br />
Drift Gas + Calibrant<br />
6 Port Switching Valve<br />
Exhaust<br />
N 2 Carrier Gas<br />
Heated Injector<br />
IMS<br />
Modes of Operation<br />
Direct Sample Desorption<br />
into IMS<br />
1) Direct thermal desorption into IMS<br />
2) Liquid/gas injection through GC column<br />
Purge Gas + CI Reagent<br />
3) Filter desorption onto the GC column<br />
Figure 1: Schematic Diagram of Barringer’s SPD-GC-IONSCAN<br />
to valve 240°C, valve temperature 220°C,<br />
transfer line temperature from valve to GC<br />
220°C, desorption time 15s, purge time 5s, loop<br />
cooling time and back purge 100s, loop heating<br />
time 6.5s.<br />
The GC. operating conditions were as follows:<br />
GC column 10m DB-5, 0.53 mm i.d., 1µm film<br />
thickness, nitrogen carrier gas at 10psi,<br />
temperature programming 80°C for 40s,<br />
ramping at 15°C/min to 240°C.<br />
Results<br />
A typical analysis of a mixture of pesticides is<br />
shown in Figure 2. The cis and trans isomers<br />
of chlordane are resolved under the GC<br />
conditions employed as their different collision<br />
cross sections result in different interactions<br />
between the molecules and the stationary and<br />
mobile GC phases. The cis and trans isomers<br />
also result in different IMS spectra<br />
(plasmagrams), where the trans isomer has a<br />
longer drift time due to its larger collision cross<br />
section and increased interaction with the drift<br />
gas. ß-BHC and γ-BHC were not resolved by<br />
the GC; however, their respective reduced<br />
mobilities and IMS drift times were significantly<br />
different to allow identification.<br />
Each chromatographic peak shown in Figure 2<br />
produces a specific plasmagram profile and an<br />
example of this feature is shown in Figure 3 for<br />
cis- and trans-chlordane.<br />
Pesticides were detected by wiping spiked and<br />
unspiked apples and oranges, using both<br />
fibreglass and Teflon filters. γ-BHC residues<br />
Copyright © 2000 by International Society for Ion Mobility Spectrometry
R. DeBono et al.: „Rapid analysis of pesticides...”, IJIMS 4(2001)1,16-19, p. 18<br />
Figure 2 Chromatogram of a Mixture of Pesticides<br />
Figure 3 Plasmagram of cis-Chlordane (left) and trans-Chlordane (right)<br />
Copyright © 2000 by International Society for Ion Mobility Spectrometry
R. DeBono et al.: „Rapid analysis of pesticides...”, IJIMS 4(2001)1,16-19, p. 19<br />
1.0% for parathion and 5.9% for ß-BHC. With a<br />
fibreglass filter, efficiencies were 4.1% and<br />
2.8%, respectively.<br />
Table 1 lists the reduced mobilities, limit of<br />
detection (LOD) and the dynamic range of the<br />
pesticides investigated. The linear range can<br />
be easily extended by simply using the split<br />
feature of the GC-IONSCAN, a split ratio of 5:1<br />
would extend the upper limit to 30 ng.<br />
Detection limits for pesticides analyzed in the<br />
negative ion mode ranged from 10 to 300 pg,<br />
with linear ranges of 10 to 6000 pg.<br />
Figure 4: Analysis of Orange<br />
Conclusions<br />
A rapid method for screening fruits for<br />
pesticides has been developed using a novel<br />
solid phase desorption for the GC-IONSCAN<br />
system. Banned pesticides in Canada, US and<br />
Pesticide<br />
ß-BHC<br />
γ-BHC<br />
cis-Chlordane<br />
trans-Chlordane<br />
Endosulfan<br />
Endrin Ketone<br />
Parathion<br />
Mol. Mass<br />
291<br />
291<br />
410<br />
410<br />
407<br />
381<br />
291<br />
were found on the skin of unspiked oranges<br />
purchased in local supermarkets (Figure 4).<br />
Evaluation of the transfer efficiencies of two<br />
pesticides from spiked apples were determined.<br />
Using a Teflon filter, the transfer efficiency was<br />
Table 1: Pesticides in This Study<br />
Red. Mobility<br />
1.2650<br />
1.2550<br />
1.0840<br />
1.0616<br />
1.0930<br />
1.0820<br />
1.2740<br />
Ion<br />
Observed<br />
M −<br />
M −<br />
M −<br />
M −<br />
M −<br />
M −<br />
M −<br />
LOD<br />
10 pg<br />
100 pg<br />
50 pg<br />
25 pg<br />
300 pg<br />
200 pg<br />
20 pg<br />
Linear Range<br />
10-300 pg<br />
100-5000 pg<br />
50-5000 pg<br />
25-1000 pg<br />
300-6000 pg<br />
200-1500 pg<br />
20-300 pg<br />
Europe can be programmed into the analyzer,<br />
allowing routine screening of these pesticides<br />
in imported fruits and vegetables. Processing<br />
time per sample is typically under 10 minutes<br />
with detection limits in the low picogram levels.<br />
Copyright © 2000 by International Society for Ion Mobility Spectrometry
The use of IMS and GC/IMS for analysis of Saliva<br />
Chr. Fuche 1 , A. Gond 1 , D. Collot 1 and C. Faget 2<br />
1<br />
CREL, 168 rue de Versailles F78150 Le CHESNAY, France<br />
2<br />
Laboratoire VERGER, 53 rue Corbier Thiébaut, F60270 GOUVIEUX, France<br />
ABSTRACT<br />
Different methods for testing car drivers on<br />
illegal drugs are reviewed. Saliva analysis is<br />
preferred for practical reasons. Three<br />
technologies are compared for the research of<br />
narcotics in saliva : Ionscan 400, GC/Ionscan<br />
and GC/MS<br />
INTRODUCTION<br />
The CREL (Centre de Recherche et d'Etudes<br />
de la Logistique) is the french police research<br />
centre. The aim of this centre is to find new<br />
technologies and new methodologies for the<br />
police squad. Police forces need rugged<br />
equipments and methods that can be used by<br />
any officer after minimum training.<br />
The number of deaths increases in traffic<br />
accidents. For example, the first day of 2000<br />
year between 4 and 6 am, 90 persons died on<br />
the roads. Most of the drivers involved were<br />
between 18 and 26 years old. Besides, the<br />
percentage of drivers that could be positive on<br />
drugs is not insignificant. Statistics allow to say<br />
that this percentage lies between 3 and 10 %.<br />
These figures may well be underestimated, as<br />
it has been once established in Belgium that<br />
43% of the drivers leaving a night club were<br />
tested positive on narcotics. Litterature shows<br />
that smoking one single marijuana cigarette<br />
has the same effects as drinking 3 glasses of<br />
wine on empty stomach. It means a marijuana<br />
cigarette reduces the reflexes and the<br />
capacities to evaluate speed and distances.<br />
As a consequence, in june1999, the french<br />
government passed a new law stating that any<br />
driver involved in a fatal accident must be<br />
tested for alcohol and narcotics. Today<br />
nevertheless in case of body injuries, the state<br />
prosecutor requires a narcotics detection too<br />
even if there is no death. In France, in any road<br />
accident with body injuries or death, the<br />
breathalyser is used automatically.<br />
The aim of this study is to find a simple<br />
technology for the detection of narcotics in<br />
saliva. This technology is indeed for use on site<br />
on the road, not in a laboratory. Five main<br />
narcotics are studied: THC, Cocaine, MDMA<br />
(methylenedioxymethamphetamine) or ecstasy,<br />
Heroin and its metabolite 6MAM<br />
(6monoacetylmorphin). Three technologies are<br />
compared : Ionscan 400, GC/Ionscan and<br />
GC/MS. The latter is used for checking the<br />
results.<br />
BIOLOGICAL MATRICES<br />
How can we detect the presence of narcotics ?<br />
We know that every biological matrix contains a<br />
chemical print of narcotics:<br />
• the first biological matrix used is blood<br />
because it remains the only reference<br />
matrix for a court of justice and because of<br />
its medical interest. But, only a doctor in<br />
medecine or a qualified nurse is legally<br />
qualified to take blood samples.<br />
• the second is urine, which offers many<br />
analytical interests but which is difficult to<br />
sample on site. Its collection requires a<br />
special equipement and we know it ’s<br />
possible to alter the sample, as some<br />
problems with sportsmen have shown.<br />
• another solution lies in sweat but the<br />
quantity collected is often unsufficient and<br />
collection is difficult to perform.<br />
• the last solution seems to be saliva, which<br />
is suitable for the scope and easy to collect.<br />
We believe this is the simplest matrix to<br />
collect for police forces. Drugs contents in<br />
saliva can be used as a good biological<br />
indicator matrix. To support this view Pichini<br />
and coll. (1) and Cone and coll. (2) have<br />
Copyright © 2000 by International Society for Ion Mobility Spectrometry
Chr. Fuche et al.: „The use of IMS and GC/IMS...”, IJIMS 4(2001)1, 20-25, p. 21<br />
shown that saliva testing for abuse of drugs<br />
provides both qualitative and quantitative<br />
information on drug status and that drug<br />
concentrations reflect the free fraction of<br />
drug in blood.<br />
Saliva testing detects the narcotics physically<br />
present inside the mouth as well as those<br />
biologically absorbed. The quantity detected is<br />
higher when the collection is performed closer<br />
to the comsumption when the narcotics are<br />
absorbed by inhalation or smoking.<br />
Some pharmacokinetics data for illegal<br />
substances, expressed as halflives in saliva are<br />
24 hours for THC, Heroin and 6MAM and 4<br />
days for Cocaine. It is unknown for MDMA.<br />
For comparison, it is possible to find a chemical<br />
print of THC in urine 1 month after the last<br />
consumption. This is an another reason why we<br />
prefer saliva rather than urine because the print<br />
inside saliva better reflects the real state of the<br />
driver.<br />
METHODOLOGY<br />
We use a piece of the same absorbent cotton<br />
as is used in dentist surgery. The cotton is<br />
placed inside the mouth by the patient. The<br />
cotton is masticated as a chewing gum thus it<br />
absorbs both saliva and mouth cells which may<br />
contain twice as much of the narcotics print as<br />
the saliva does.<br />
The process is not invasive. It does not expose<br />
the patient to discomfort because he collects<br />
his saliva himself. And there is no skin irritation<br />
or risk of infection because the cotton is sterile<br />
and stored inside a test tube. The cotton is put<br />
in a syringe and compressed to recover the<br />
saliva. The volume of is between 0 and 1ml.<br />
IONSCAN 400<br />
The standard operating conditions of IMS<br />
detector are summarized in table 1. The<br />
Ionscan 400 was used without any hardware<br />
modifications.<br />
Table 1 : standard conditions<br />
Temperature : tube : 240 °C<br />
inlet : 290 °C<br />
desorb : 295 °C<br />
Flow: drift : 300cc/mn<br />
sample : 200 cc/mn<br />
The temperatures are higher than usual<br />
because the desorption is higher particularly for<br />
THC.<br />
GC/IONSCAN<br />
For the GC/IONSCAN, we replaced 2 parts, the<br />
injector and the column. The injector is a Ross<br />
injector and the column is a capillary column.<br />
The Ross injector is composed of two<br />
concentric glass tubes, the capillary being the<br />
inner one. The vector gas is helium. The<br />
advantages are that it is possible to set any<br />
required concentration of solute, and that the<br />
evaporation of solvent prevents the signal from<br />
Chemical treatment.<br />
The saliva can be analysed directly or it can be<br />
"chemically treated" or "extracted". In this case<br />
narcotics are extracted three times from both<br />
cotton and saliva by a mixture of hexane and<br />
ethyl acetate (50:50). The extracts from cotton<br />
and saliva are combined and concentrated.<br />
INSTRUMENTS :<br />
The Ionscan 400 is able to analyse both the<br />
pure saliva, that is to say saliva without<br />
chemical treatment, and the extracted saliva.<br />
With the GC/ionscan and the GCMS it is only<br />
possible to analyse the extracted saliva. The<br />
GC/MS is used as a reference technique in this<br />
study.<br />
Copyright © 2000 by International Society for Ion Mobility Spectrometry
Chr. Fuche et al.: „The use of IMS and GC/IMS...”, IJIMS 4(2001)1, 20-25, p. 22<br />
GC<br />
oven:<br />
initial Temp. :190°C<br />
rate 1 : 8,75°C/min up to 260°C<br />
rate 2 : 40°C/min<br />
final temp. : 290°C<br />
delay of analysis : 645s<br />
transfer line : 285 °C<br />
IONSCAN:<br />
tube : 236°C<br />
inlet : 285°C<br />
desorb : 285°CC<br />
shifting. The disadvantage is that the injector is<br />
very fragile because it ’s outside the machine<br />
and it is made of glass.<br />
The capillary column offers a good resolution<br />
and requires smaller quantity of sample. This<br />
column is not standard. It is custom- made<br />
according to our specifications.<br />
The temperatures are lower than for the<br />
Ionscan 400 because there are no problems in<br />
the column desorption.<br />
All narcotics signals are clearly separared (fig<br />
1). With the GC /MS, the reference<br />
chromatogram is the same as with the<br />
GC/Ionscan (same chromatographic order and<br />
a good resolution).<br />
EXPERIMENTAL<br />
We use reference samples made from<br />
narcotics standards and clean saliva. For this<br />
purpose, we collect saliva from people who do<br />
not take drugs and who neither smoke nor<br />
drink coffee because caffeine and nicotine have<br />
a higher detection rate than narcotics. Each<br />
sample is analysed 5 times.<br />
Narcotics Standards<br />
We test four narcotics solutions. Table2<br />
summarizes the quantities dropped on the filter<br />
for Ionscan400. For comparison purposes, the<br />
quantity dropped on the filter is the same as for<br />
the GC/Ionscan and GC/MS analyser.<br />
Direct analysis (Ionscan 400)<br />
The volume analysed is always 200 µl.<br />
Samples are dropped on the teflon filter. When<br />
the teflon filter is dry, the deposit is analysed<br />
directly.<br />
Extracted saliva (Ionscan 400, GC/Ionscan,<br />
GC/MS)<br />
300 µl of saliva are always extracted and 2 µl<br />
are dropped on the filter or injected.<br />
RESULTS AND DISCUSSION<br />
IONSCAN 400<br />
From a quantitative point of vue, quantities 20<br />
times lower are present in the extracted saliva<br />
than in the unextracted saliva.<br />
For the three mixtures, the increase in<br />
compounds concentration is not observed for<br />
unextracted saliva(figure 2). The results for<br />
these narcotics are that the amplitude of the<br />
signal is not correlated with the quantity of<br />
narcotics.<br />
Heroin and 6MAM are detected in pure<br />
saliva(figure3). We assume that 6MAM arises<br />
from a degradation of heroin by enzymatic<br />
process.<br />
In the case of the extracted saliva, we have<br />
only the signal of heroin perhaps because the<br />
quantity of 6MAM is insufficient.<br />
Figure 1 :<br />
reference<br />
chromatogram<br />
from<br />
GC/<br />
IONSCAN<br />
Copyright © 2000 by International Society for Ion Mobility Spectrometry
Chr. Fuche et al.: „The use of IMS and GC/IMS...”, IJIMS 4(2001)1, 20-25, p. 23<br />
Table 2 : Quantities dropped in each sample<br />
Drug<br />
Pure<br />
saliva<br />
Extracted<br />
Saliva<br />
Drug<br />
Pure<br />
saliva<br />
Extracted<br />
Saliva<br />
Mixture 1<br />
Cocaine: 0.4 µg<br />
MDMA: 10 µg<br />
Cocaine: 0.024 µg<br />
MDMA: 0.6 µg<br />
Thc1<br />
57.6 µg<br />
3.5 µg<br />
Mixture 2<br />
Cocaine: 0.8 µg<br />
MDMA: 20 µg<br />
Cocaine: 0.048 µg<br />
MDMA: 1.2 µg<br />
THC2<br />
230.4 µg<br />
13.8 µg<br />
Mixture 3<br />
Cocaine: 1.6 µg<br />
MDMA: 40 µg<br />
Cocaine: 0.096 µg<br />
MDMA: 2.4 µg<br />
THC3<br />
576 µg<br />
35 µg<br />
Heroin<br />
9.4 µg<br />
0.54 µg<br />
THC cannot be detected inside pure saliva at<br />
any concentration with this process. The<br />
chemical method is necessary to obtain the<br />
THC detection with the IONSCAN 400 (figure<br />
4).We test a fourth reference solution which is<br />
a mixture of cocaine and THC. It is run to check<br />
if the signal of cocaine would mask that of<br />
THC. Again, for pure saliva, only cocaine is<br />
detected and in extracted saliva, both cocaine<br />
and THC are detected (figure 4); their signals<br />
are clearly separated.<br />
In conclusion, pure saliva cannot be used for<br />
the detection of illegal drugs because on the<br />
one hand THC is not detected and on the other<br />
hand, false amphetamine signals are created<br />
by the degradation of enzymes.<br />
We calculate the response of IMS with<br />
differents concentrations of narcotics. All<br />
equations are quadratic. The correlation<br />
coefficent shows a relatively strong relationship<br />
between the variables (cocaine: R=0,93; MDMA<br />
and THC: R=0,96).<br />
GC/IONSCAN.<br />
The quantities injected are the same as for the<br />
IONSCAN 400 in order to compare the results.<br />
The three mixtures are injected via the Ross<br />
injector. As explained earlier, only extracted<br />
saliva is used with this instrument. MDMA is<br />
detected in each case and cocaine is detected<br />
only in the first and third mixture. But the signal<br />
for cocaine is lower in the third than in the first<br />
chromatogram. This is a nonsense because the<br />
quantity of cocaine is four times higher than in<br />
the first one. The sensitivity is not linear (figure<br />
5).<br />
In the 5 samples, heroin is never detected<br />
whereas it is detected in each case with the<br />
IONSCAN 400 and GC/MS.<br />
The GC/Ionscan detects THC in 2 of 3<br />
reference solutions, whereas the ionscan 400<br />
detects it in each case. For the mixture , once<br />
more , only cocaine is detected. The quantity of<br />
THC is too low. These results are checked with<br />
the GC/MS.<br />
CONCLUSIONS<br />
The most sensitive and reliable method for<br />
saliva analysis is GC/MS, but this technology is<br />
expensive and it is difficult to use.<br />
The analysis of saliva requires a chemical<br />
treatment in order to obtain the best sensitivity<br />
for all narcotics.<br />
We obtain better results with the IONSCAN 400<br />
than with the GC/ionscan for many narcotics.<br />
The problem with Ionscan 400 is the overlap of<br />
the signals. For example, heroin and THC, V3<br />
calibrant sample and methadone.<br />
For police controls, Ionscan has the capability<br />
to analyze not only the extracted saliva but also<br />
to analyze sample taken from the vehicle,<br />
objects and clothes with the same settings on<br />
the instrument.<br />
ACKNOWLEDGMENTS<br />
The volunteers who donated their saliva, Dr<br />
Claude Guionnet, Barringer Europe for the<br />
technical help, Dr Olivier Mauzac from CREL<br />
for the help in writing this document.<br />
REFERENCES<br />
[1] PICHINI and coll : Drug Monitoring in Non<br />
conventional Biological Fluids and Matrices ; Clin.<br />
Phamacokinet, 1996 Mar, 30 (3) 211-228<br />
[2] Cobe et al. cocaine disposition in saliva following<br />
intravenous, intrasanal and smoked administration, J.<br />
of Analytical Toxicology 21(1997) 465-475<br />
Copyright © 2000 by International Society for Ion Mobility Spectrometry
Chr. Fuche et al.: „The use of IMS and GC/IMS...”, IJIMS 4(2001)1, 20-25, p. 24<br />
Copyright © 2000 by International Society for Ion Mobility Spectrometry
Chr. Fuche et al.: „The use of IMS and GC/IMS...”, IJIMS 4(2001)1, 20-25, p. 25<br />
Mixture<br />
1<br />
Mixture<br />
2<br />
Mixture<br />
3<br />
Copyright © 2000 by International Society for Ion Mobility Spectrometry
Strategies for smarter chemical sensors<br />
P. de B. Harrington, G. Chen, A. Urbas<br />
Ohio University Center for Intelligent Chemical Instrumentation, Department of Chemistry and Biochemistry, Ohio<br />
University, Athens OH 45701-2979, USA<br />
Advancements in computer technology are<br />
forcing a paradigm shift in the processing of<br />
data from analytical instrumentation. The<br />
traditional approach is to signal average data<br />
from an analytical instrument once it achieves a<br />
steady-state response (i.e., the signal from the<br />
instrument stabilizes). However, a single signal<br />
averaged spectrum from the stabilized<br />
instrument response excludes temporal<br />
information that may be exploited to solve<br />
significant chemical problems.<br />
This paper presents the opportunities furnished<br />
by modeling the dynamical or transient<br />
responses of ion mobility spectrometers. The<br />
transient response occurs when the sample is<br />
introduced to the inlet of the instrument and the<br />
sample is removed from the inlet of the<br />
instrument. In other cases, for which the<br />
sample is thermally desorbed, the transient is<br />
introduced by the temperature time profile of<br />
the desorber and sample discrimination that<br />
may occur in the transfer lines . A useful<br />
method that is gaining popularity for modeling<br />
dynamic or temporal changes in data is<br />
SIMPLISMA . Using SIMPLISMA, the ion<br />
mobility data are factored into sets of<br />
concentration profiles and concentration<br />
independent spectra . Each feature or IMS<br />
peak that varies independently with respect to<br />
the duration of the measurement will be<br />
modeled as a separate component. An<br />
example will be presented later.<br />
The problem associated with dynamic modeling<br />
methods is that individual spectra must be<br />
stored instead of a single signal averaged<br />
spectrum. The ion mobility measurement is<br />
fast enough that a large volume of spectra may<br />
be acquired. Therefore, data compression<br />
becomes a useful tool. Ion mobility spectra are<br />
amenable to two-dimensional compression for<br />
which both the drift time and spectrum<br />
acquisition time dimensions are reduced . If<br />
wavelet compression is used, SIMPLISMA can<br />
directly model the compressed data . In<br />
addition, SIMPLISMA has been written as a<br />
real-time program in LabVIEW and can build<br />
and refine models as the data are collected .<br />
A single set of data will be used to illustrate the<br />
modeling of 2D compressed spectra. The<br />
measurement spectra are given in . The data<br />
were collected from a 1:1 mix (v/v) of<br />
dicyclohexylamine (DCHA) and diethylmethyl<br />
phosphonate (DEMP) that was sampled with a<br />
Graseby (Graseby Ionics, Ltd, Watford, UK)<br />
Chemical Agent Monitor (CAM) operating in<br />
positive ion mode. DCHA (99%, Lot<br />
#02810MX, Aldrich Chemical Company, WI)<br />
and DEMP (98%, Batch # 10010573,<br />
Lancaster, U.K.) were mixed equally by volume<br />
to furnish the liquid mixture. The CAM was<br />
modified in that the acetone dopant was<br />
removed and the instrument was cleaned of all<br />
residual acetone. The analog output was<br />
interfaced with a National Instruments<br />
AT-MIO-16X board, which provided the<br />
triggered analog-to-digital conversion and<br />
timing of the ion mobility spectra. The board<br />
interfaced to the ISA bus of a 200 MHz Pentium<br />
Pro Personal Computer that operated under<br />
Windows 98 Second Edition. The acquisition<br />
software was a virtual instrument (VI) that was<br />
written in LabVIEW 5.1. The spectra were<br />
sampled at an 80 kHz acquisition rate that<br />
furnished 1500 points per spectrum and<br />
collected at a rate of approximately 10 spectra<br />
per second.<br />
Copyright © 2000 by International Society for Ion Mobility Spectrometry
P. de B. Harrington: „Strategies for smarter...”, IJIMS 4(2001)1,26-30, p. 27<br />
The data set comprised 1560 spectra. Each<br />
spectrum was baseline corrected by subtracting<br />
the average calculated from the points between<br />
1.5 and 3.0 ms. For each spectrum, 1024 data<br />
points that ranged between 3.0 and 15.8 ms<br />
were selected for constructing the SIMPLISMA<br />
model. The SIMPLISMA program was written<br />
in C++ by Harrington and applied to the data<br />
post-run. The alpha value for damping noise<br />
was set to 5% of the maximum peak of the<br />
average spectrum calculated from the data set.<br />
The SIMPLISMA model was set to 5<br />
components. SIMPLISMA was applied to the<br />
2D wavelet compressed data. This data set<br />
was compressed using the Daubechies family<br />
of wavelets. Each spectrum was compressed<br />
to 64 points using the partial daublet 22 filter.<br />
The columns of the compressed data matrix<br />
were then compressed to 64 points using the<br />
partial daublet 12 filter. The original data size<br />
was 1560´1024 points and was compressed to<br />
64´64 points or 0.26% of its original size and a<br />
compression ratio of 99.7% was obtained. The<br />
concentration profiles and spectra from the<br />
SIMPLISMA model were transformed back to<br />
their corresponding sizes using the inverse<br />
wavelet transform.<br />
Figure 2 gives the concentration profiles that<br />
were obtained from the full and compressed<br />
data for the SIMPLISMA components that<br />
model the DEMP dimer peak. The sample vial<br />
was presented and then removed from the<br />
CAM inlet at approximately 20 s into the<br />
experiment. The information that is lost during<br />
compression corresponds to high frequency<br />
noise.<br />
Figure 3 gives the spectra obtained from<br />
SIMPLISMA from the compressed and<br />
uncompressed data. Note that the dimer peak<br />
is modeled well by SIMPLISMA and there are<br />
no other peaks contained in these spectra. In<br />
addition, the model from the compressed data<br />
Figure 1: Positive ion CAM measurement of a 1:1 (v/v) mix of DCHA and DEMP<br />
Copyright © 2000 by International Society for Ion Mobility Spectrometry
P. de B. Harrington: „Strategies for smarter...”, IJIMS 4(2001)1,26-30, p. 28<br />
Sample Acquisition Time (s)<br />
0 20 40 60 80 100 120 140<br />
0.7<br />
Unprocessed Data<br />
99.7% 2D-Wavelet Compressed<br />
0.23<br />
0.18<br />
Unprocessed Data<br />
99.7% 2D-Wavelet Compressed<br />
0.5<br />
Intensity (V)<br />
0.3<br />
Relative Intensity<br />
0.13<br />
0.08<br />
0.1<br />
0.03<br />
-0.1<br />
-0.02<br />
50 300 550 800 1050 1300 1550<br />
Scan Number<br />
Figure 1:<br />
Concentration profiles for the DEMP dimer peak.<br />
0 2 4 6 8 10 12 14 16<br />
Drift Time (ms)<br />
Figure 2:<br />
Spectra for the DEMP dimer peak<br />
Sample Acquisition Time (s)<br />
0 20 40 60 80 100 120 140<br />
2.5<br />
0.24<br />
0.19<br />
Unprocessed Data<br />
99.7% 2D-Wavelet Compressed<br />
Intensity (V)<br />
2.0<br />
1.5<br />
Unprocessed Data<br />
99.7% 2D-Wavelet Compressed<br />
Relative Intensity<br />
0.14<br />
0.09<br />
0.04<br />
1.0<br />
-0.01<br />
50 300 550 800 1050 1300 1550<br />
Scan Number<br />
Figure 4:<br />
Concentration profiles for the water RIP<br />
0 2 4 6 8 10 12 14 16<br />
Drift Time (ms)<br />
Figure 3<br />
Water RIP spectra<br />
Sample Acquisition Time (s)<br />
0 20 40 60 80 100 120 140<br />
0.5<br />
Unprocessed Data<br />
99.7% 2D-Wavelet Compressed<br />
0.25<br />
0.20<br />
Unprocessed Data<br />
99.7% 2D-Wavelet Compressed<br />
Intensity (V)<br />
0.3<br />
0.1<br />
Relative Intensity<br />
0.15<br />
0.10<br />
0.05<br />
0.00<br />
-0.1<br />
50 300 550 800 1050 1300 1550<br />
Scan Number<br />
Figure 66:<br />
Concentration profiles for the DEMP<br />
monomer peak<br />
-0.05<br />
0 2 4 6 8 10 12 14 16<br />
Drift Time (ms)<br />
Figure 5:<br />
Spectra for the DEMP monomer peak<br />
Copyright © 2000 by International Society for Ion Mobility Spectrometry
P. de B. Harrington: „Strategies for smarter...”, IJIMS 4(2001)1,26-30, p. 29<br />
shows no attenuation in peak height. Figure 4<br />
and Figure 5 give the SIMPLISMA<br />
concentration profiles and spectra for the water<br />
reactant ion peak (RIP). Figure 6 and Figure 7<br />
give the concentration profiles and the spectra<br />
for the DEMP monomer peak. All three<br />
SIMPLISMA spectra contained only one peak,<br />
because these peaks varied throughout the<br />
measurement.<br />
This chemical system is interesting because<br />
DEMP will suppress the DCHA peaks through<br />
competitive charge inhibition. However, DCHA<br />
may be detected and resolved due to sample<br />
discrimination that occurs during the CAM<br />
measurement. In the concentration profiles<br />
given in , the DCHA component appears and<br />
rapidly disappears as the concentration of<br />
DEMP increases during the experiment.<br />
Because the DCHA peaks are short-lived<br />
during the measurement process, the DCHA<br />
monomer, the dimer, and the DEMP-DCHA<br />
mixed dimer all appear as one component in<br />
the spectrum in Figure 9.<br />
Figure 10 and Figure 11 give examples of a<br />
spurious component. This last component is<br />
modeling noise, which is evident in the<br />
unprocessed and compressed data.<br />
SIMPLISMA would be run again with the<br />
number of components specified as 4.<br />
Dynamic modeling of IMS data can be used to<br />
solve analytical problems. For the<br />
DCHA-DEMP mixture, a single time-averaged<br />
spectrum would not reveal the presence of<br />
DCHA. Using 2D wavelet compression a<br />
volume of data may be compressed, so that<br />
SIMPLISMA can exploit trends that occur<br />
during the measurement process. The<br />
SIMPLISMA models obtained from the<br />
compressed data can be transformed back to<br />
the their original sizes without altering the data.<br />
Sample Acquisition Time (s)<br />
0 20 40 60 80 100 120 140<br />
0.5<br />
Unprocessed Data<br />
99.7% 2D-Wavelet Compressed<br />
0.18<br />
Unprocessed Data<br />
99.7% 2D-Wavelet Compressed<br />
Intensity (V)<br />
0.3<br />
0.1<br />
Relative Intensity<br />
0.13<br />
0.08<br />
0.03<br />
-0.1<br />
50 300 550 800 1050 1300 1550<br />
Scan Number<br />
Figure 8:<br />
Concentration profiles for DCHA<br />
-0.02<br />
0 2 4 6 8 10 12 14 16<br />
Drift Time (ms)<br />
Figure 7:<br />
Spectra that correspond to DCHA<br />
Sample Acquisition Time (s)<br />
0 20 40 60 80 100 120 140<br />
0.2<br />
Unprocessed Data<br />
99.7% 2D-Wavelet Compressed<br />
0.10<br />
Unprocessed Data<br />
99.7% 2D-Wavelet Compressed<br />
0.1<br />
Intensity (V)<br />
0.0<br />
Relative Intensity<br />
0.05<br />
-0.1<br />
0.00<br />
-0.2<br />
-0.05<br />
50 300 550 800 1050 1300 1550<br />
Scan Number<br />
Figure 10<br />
Spurious concentration profiles<br />
0 2 4 6 8 10 12 14 16<br />
Figure 9<br />
Spurious spectra<br />
Drift Time (ms)<br />
Copyright © 2000 by International Society for Ion Mobility Spectrometry
P. de B. Harrington: „Strategies for smarter...”, IJIMS 4(2001)1,26-30, p. 30<br />
References<br />
[1] Reese, E.S.; Harrington, P B. J. Forens. Sci.<br />
1999, 44, 68-76.<br />
[2] Shaw, L.A.; Harrington, P B. in press, Nov. 2000.<br />
[3] Windig, W.; Guilment, J. Anal. Chem. 1991, 63,<br />
1425-1432.<br />
[4] Harrington, P.B.; Reese, E.S.; Rauch, P J.; Hu,<br />
L.; Davis, D.M. Appl. Spectrosc. 1997, 51,<br />
808-816.<br />
[5] Cai, C.; Harrington, P.B.; Davis, D.M. Anal.<br />
Chem. 1997, 69, 4249-4255.<br />
[6] Harrington, P.B.; Rauch, P.J.; Cai, C. Submitted<br />
2000.<br />
[7] Chen, G.; Harrington, P.B. Submitted 2000.<br />
Copyright © 2000 by International Society for Ion Mobility Spectrometry
Initial Study of Electrospray Ionization-Ion Mobility<br />
Spectrometry for the Detection of Metal Cations<br />
H.M. Dion, L.K. Ackerman, H.H. Hill, Jr.*<br />
1<br />
Department of Chemistry, P.O. Box 644630,Washington State University, Pullman, WA 99164-4630, USA<br />
2<br />
Center for Multiphase Environmental Research, P.O. Box 642710, Washington State University, Pullman,<br />
WA 99164-2710, USA<br />
Abstract<br />
ESI-IMS of nine inorganic cation solutions was<br />
performed for the first time. Counter ion had a<br />
large effect upon the sensitivity and response<br />
ion identity of the cations studied. Several salt<br />
solutions yielded one major cation peak<br />
including: aluminum sulfate, lanthanum<br />
chloride, strontium chloride, uranium acetate,<br />
uranium nitrate, and zinc sulfate. Aluminum<br />
nitrate and zinc acetate solutions produced<br />
multiple cation peaks, which increased the<br />
detection limits and difficulty of identification<br />
through comparison with the ESI-MS literature.<br />
Predicted detection limits ranged from 0.33<br />
ppm to 25 ppm depending on the salt solution<br />
studied. The identity of the species detected is<br />
unconfirmed, but literature suggests, and drift<br />
times support the detection of cation-solvent or<br />
cation-solvent-anion complexes. Finally,<br />
strontium and lanthanum chloride were<br />
separated and detected simultaneously with a<br />
resolution of 2.2. This is the first research<br />
showing the use of ESI-IMS as a detection and<br />
separation method for metal ion and ion<br />
complexes and the results from this study<br />
warrant future development of ESI-IMS as a<br />
field technique for the detection of metal<br />
contaminants in the environment.<br />
Results and Discussion<br />
Several metal salts of differing ionic radius,<br />
charge, and anionic composition were<br />
investigated for response and sensitivity using<br />
ESI-IMS. Additionally, several salts with the<br />
same metal cation and different anion were<br />
examined. A complete list of metal salts<br />
studied, drift times, calculated peak resolution,<br />
reduced mobility values, and predicted<br />
detection limits are reported in Table 1.<br />
The ESI-IMS spectra for aluminum sulfate (10<br />
ppm Al) and aluminum nitrate (100 ppm Al) are<br />
illustrated in figure 1. It appears that the<br />
aluminum sulfate is much more sensitive to<br />
detection than the aluminum nitrate. This may<br />
be explained by the fact that for the aluminum<br />
nitrate the available charge is divided among<br />
several peaks (7.5, 9.4, 11.4 ms) whereas the<br />
aluminum sulfate salt only displays one<br />
predominant peak (11.1 ms). The peak at 11.4<br />
ms for the nitrate and the 11.1 ms peak for the<br />
sulfate can be predicted as the same<br />
complexed ion since the difference in drift times<br />
is only 2.6%. It has been shown in the ESI-MS<br />
literature that aluminum can form hydrolysis<br />
ions as well as complex with small organic<br />
anions [1]. From the ESI-IMS work completed,<br />
it is reasonable to predict that the 11.4 and 11.1<br />
ms peaks for aluminum are either a charged<br />
hydration or acetate complex while the<br />
additional peaks in the nitrate spectra may be a<br />
mixture of nitrate complexes such as<br />
Al(NO 3)(OH)(H 2O) +2 or Al(NO 3)(OH)(H 2O) +3 as<br />
detected by ESI-MS [1].<br />
Additionally, in Figure 1, zinc salts show<br />
distinctly different ion peaks depending on the<br />
anions present in solution. It should be noted<br />
that while every sample was carried by a<br />
mobile phase with 5% acetic acid zinc sulfate<br />
did not produce response peaks similar to the<br />
acetate counterpart.<br />
ESI-MS literature, while very specific in its<br />
metal species identification, is not readily<br />
transferable to ESI-IMS due to the lack of CID<br />
region. It should be noted that the ESI-MS<br />
literature only twice observed a bare cation,<br />
and even with high-energy CID regions,<br />
cation-solvent, and cation-solvent-anion<br />
complexes were the norm. Thus, it is very<br />
likely that the species being detected here are<br />
Copyright © 2000 by International Society for Ion Mobility Spectrometry
H.M. Dion: „Initial Study of Electrospray...”, IJIMS 4(2001)1, 31-33, p. 32<br />
Table 1:<br />
List of metal salts studied, drift times, calculated resolving power of IMS for each peak, and reduced<br />
mobility values in cm 2 v -1 s -1 . (nd = not determined)<br />
Salt<br />
Aluminum<br />
Nitrate<br />
Aluminum<br />
Sulfate<br />
Lanthanum<br />
Chloride<br />
Strontium<br />
Chloride<br />
Strontium<br />
Nitrate<br />
Uranium<br />
Acetate<br />
Uranium<br />
Nitrate<br />
Zinc Acetate<br />
Zinc Sulfate<br />
Chemical Form<br />
Al(NO 3) 3<br />
Al 2(SO 4) 3*18 H 2O<br />
LaCl 3*H 2O<br />
SrCl 2*6 H 2O<br />
Sr(NO 3) 2<br />
UO 2(CH 3COO) 2*2<br />
H 2O<br />
UO 2(NO 3) 2*6 H 2O<br />
Zn(CH 3COO) 2*2<br />
H 2O<br />
ZnSO 4*7 H 2O<br />
Drift<br />
Time<br />
(ms)<br />
7.5, 9.4,<br />
11.4<br />
11.1<br />
10.8<br />
9.8<br />
10.0,<br />
12.4<br />
12.3,<br />
16.3<br />
10.7<br />
12.0,<br />
14.4,<br />
18.8,<br />
20.1,<br />
24.5<br />
10.2<br />
Resolving<br />
Power<br />
22.1, 23.4,<br />
30.7<br />
41.6<br />
31.3<br />
38.0<br />
24.3, 28.1<br />
47.6<br />
31.4<br />
28.8, 34.6,<br />
36.6, 34.5,<br />
36.8<br />
30.2<br />
Observed<br />
K o<br />
2.3, 1.8,<br />
1.5<br />
1.5<br />
1.6<br />
1.8<br />
1.7, 1.4<br />
1.4, 1.1<br />
1.6<br />
1.4, 1.2,<br />
0.9, 0.9,<br />
0.7<br />
1.7<br />
Corrected<br />
K o<br />
2.2, 1.7,<br />
1.4<br />
1.5<br />
1.5<br />
1.7<br />
1.6, 1.3<br />
1.3, 1.0<br />
1.5<br />
1.3, 1.1,<br />
0.9, 0.8,<br />
0.7<br />
1.6<br />
Predicted<br />
Detection<br />
Limit (ppm)<br />
nd<br />
0.33<br />
3.4<br />
8.9<br />
nd<br />
1.8<br />
25<br />
nd<br />
5.4<br />
cation-solvent or cation-solvent-anion<br />
complexes, whose exact identity is a function of<br />
concentration, charge-competition at the<br />
needle, and gas-phase stability. With further<br />
refinement it may be possible to control the<br />
complexation so that the majority of the current<br />
is carried by a single species, making it<br />
possible to develop a sensitive method for the<br />
direct field analysis of inorganic cations and<br />
anions in water.<br />
ACKNOWLEDGEMENTS<br />
Heather Dion was supported by the National<br />
Science Foundation's Integrative Graduate<br />
Education and Research Training Grant to<br />
Washington State University under Grant<br />
#9972817. The National Science Foundation’s<br />
Integrative Graduate Education and Research<br />
Training Grant also provided support for Luke<br />
Ackerman through the form of an<br />
undergraduate summer research experience<br />
fellowship. The authors also wish to<br />
acknowledge INEEL for supplies and operating<br />
expenses.<br />
References<br />
[1] Agnes, G.R.; Horlick, G. Appl. Spectrosc. 1995, 49,<br />
324-334.<br />
[2] Agnes, G.R.; Horlick, G. Appl. Spectrosc. 1992, 46,<br />
401-406.<br />
Copyright © 2000 by International Society for Ion Mobility Spectrometry
H.M. Dion: „Initial Study of Electrospray...”, IJIMS 4(2001)1, 31-33, p. 33<br />
3.4<br />
4.25<br />
3.2<br />
3.0<br />
a<br />
4.00<br />
3.75<br />
c<br />
2.8<br />
3.50<br />
3.25<br />
2.6<br />
3.00<br />
2.4<br />
0 2 4 6 8 10 12 14 16 18 20 22 24<br />
0 2 4 6 8 10 12 14 16 18 20 22 24 26<br />
0.8<br />
4.4<br />
4.2<br />
4.0<br />
b<br />
0.7<br />
d<br />
3.8<br />
3.6<br />
0.6<br />
3.4<br />
3.2<br />
0.5<br />
3.0<br />
0 2 4 6 8 10 12 14 16 18 20 22 24<br />
0 2 4 6 8 10 12 14 16 18 20 22 24 26<br />
Figure 1:<br />
a. Aluminum nitrate (10 ppm Al),<br />
b. Aluminum sulfate (100 ppm Al),<br />
c. Zinc sulfate (100 ppm Zn),<br />
d. Zinc acetate (100 ppm Zn).<br />
All spectra collected at 0.300 ms pulse width and averaged 500 times.<br />
Copyright © 2000 by International Society for Ion Mobility Spectrometry
The use of GC-IMS to analyze high volume vapour samples<br />
from cargo containers<br />
P. Lafontaine, P. Pilon, R. Morrison, P. Neudorfl<br />
Canada Customs and Revenue Agency, Laboratory and Scientific Services Directorate<br />
Research and Development Division<br />
One avenue of narcotics smuggling is by<br />
concealment in cargo containers. Canada<br />
Customs statistics indicate that the value of<br />
drugs seized from cargo containers was<br />
greatest for cocaine. Approximately, a million<br />
containers enter Canada each year and a<br />
manual inspection of each one is impossible. A<br />
quick, inexpensive and effective method of<br />
container chemical identification coupled with<br />
intelligence information could target likely<br />
containers, serve to interdict drugs and provide<br />
a deterrent to drug smugglers. This paper<br />
describes some development of a high volume<br />
air sampling method with subsequent chemical<br />
analysis by GC-IMS to provide a rapid method<br />
for cargo container inspection.<br />
The envisioned cocaine detection method by air<br />
sampling will consist of three steps: sampling of<br />
the containers; trapping of the vapors and<br />
analysis of the trapped vapors. The sampling<br />
of the containers is done with a head assembly<br />
which fits over container vents, a filter<br />
assembly which contains specially coated filters<br />
for collecting vapors and a vacuum pump for<br />
sampling the air. Separate collection and<br />
analysis steps will likely be necessary for well<br />
concealed narcotics. The trapping medium will<br />
contain a complex matrix of materials collected<br />
from the containers as well as any narcotics<br />
vapors contained in the sampled air volume.<br />
The analysis method employed in the field<br />
needs to be portable, easy to use, fairly fast<br />
and analytically effective for the trace analysis<br />
of cocaine in a complex matrix. Laboratory<br />
investigations have used GC-MS/MS(gas<br />
chromatography- ion trap mass spectrometry)<br />
with SPME (solid phase microextraction)<br />
analysis of separated cocaine and also direct<br />
injection into the GC( gas chromatography)<br />
column. Although this method is effective, it is<br />
not field portable. The various analytical<br />
methods which are being evaluated are: Ion<br />
mobility spectrometry (IMS), GC coupled with<br />
IMS (GC-IMS) and portable GC- mass<br />
spectrometry(GC-MS).<br />
Canada Customs employs the Barringer 400<br />
and 400B IMS instruments at most points of<br />
entry into Canada. These are dedicated to the<br />
detection of narcotics. The use of these<br />
instruments for the chemical analysis method<br />
for cargo container air analysis would be a<br />
convenient and low cost option. Unfortunately,<br />
the IONSCAN analysis of the air sampled<br />
materials suffer from signal suppression. This<br />
signal suppression is observed from air<br />
sampled materials when a known amount of<br />
cocaine added to the sampling medium will not<br />
give an signal even though an identical non-air<br />
sampled medium sample will give a positive<br />
identification. The use of a gas<br />
chromatography coupled with ion mobility<br />
spectrometry for dealing with signal<br />
suppression was studied.<br />
A GC-IMS system was assembled in the<br />
laboratory and consisted of two parts: A Varian<br />
3400 CX gas chromatograph coupled to<br />
Barringer IONSCAN Model 250. The sample<br />
interface was effected by pushing the GC<br />
column through a heated metal tube into the<br />
IMS inlet. The sample introduction system into<br />
the chromatography column (DB-15) was either<br />
a solid phase desorber (SPD) via a six port<br />
value or direct desorption with a Varian<br />
ChromatoProbe accessory. The data analysis<br />
software was developed in house. The<br />
apparatus is shown in Figure 1.<br />
The results for cocaine and EDME (ecgonidine<br />
methyl ester, a cocaine degradation product or<br />
cocaine identifier) deposited on Teflon filter with<br />
this apparatus are shown in Figure 2. In the left<br />
Copyright © 2000 by International Society for Ion Mobility Spectrometry
P. Lafontaine et al.: „The use of GC-IMS...”, IJIMS 4(2001)1, 34-36, p. 35<br />
3D plasmagraph (digital units versus retention<br />
time versus drift time), a GC- IMS experiment<br />
using SPD was performed on a coated Teflon<br />
filter with added cocaine and EDME and the<br />
peaks are easily seen. In the right hand<br />
plasmagraph, the results using an air sampled<br />
spiked coated Teflon filter and the same<br />
conditions are shown. In this plasmagraph,<br />
there are many peaks and some of which<br />
obscure the cocaine and EDME peaks.<br />
In a further set of experiments, a Barringer<br />
SPD-GC-IONSCAN was used to examine the<br />
air sampled filters which were spiked with<br />
cocaine and EDME. The signal processing<br />
capabilities of the commercial instrument<br />
allowed better separation and identification of<br />
the cocaine and EDME(Fig. 4). Some<br />
experiments demonstrating the better recovery<br />
results for the SPD-GC-IONSCAN compared to<br />
the IONSCAN are shown in Table 1. The<br />
control blanks also gave good results.<br />
Further work is necessary to verify whether the<br />
sensitivity of the analytical method and the<br />
deployment characteristics of the<br />
SPD-GC-IONSCAN will make this method a<br />
viable field deployable method for vapor<br />
sampling of cargo containers.<br />
Figure 1: Laboratory GC-IMS<br />
Copyright © 2000 by International Society for Ion Mobility Spectrometry<br />
Figure 2: Plasmagraphs of coated filters from SPD GC-IMS
P. Lafontaine et al.: „The use of GC-IMS...”, IJIMS 4(2001)1, 34-36, p. 36<br />
Figure 3:<br />
Plasmagraph and data reduction of a spiked air sampled coated Teflon filter<br />
using the SPD- GC-IONSCAN<br />
Table 1 Analysis of spiked samples of various Air Background<br />
by IONSCAN, SPD-GC-IONSCAN<br />
Samples were spiked with Vapour source set for EDME and Cocaine generation<br />
(equivalent to app. 1 ng of each)<br />
IONSCAN GC-IONSCAN<br />
Container Cocaine EDME Cocaine EDME<br />
Coated filter no air 1953 1109 1134 2279<br />
C1 0 214 507 853<br />
C1 0 231<br />
C2 PASS 0 994<br />
C2 292 0 434 978<br />
C3 527 0 0 475<br />
C4 PASS 478 1883<br />
C5 1004 0 0 1174<br />
C6 PASS 0 573<br />
C4 Not spiked PASS<br />
C6 Not spiked PASS<br />
Copyright © 2000 by International Society for Ion Mobility Spectrometry
Evaluation of sample collectors for ion mobility spectrometry<br />
N. Mina, S.P. Hernández, F.R. Román, L.A. Rivera<br />
Energetic Materials Research Laboratory, Department of Chemistry, University of Puerto Rico Mayagüez Campus,<br />
P O Box 9019, Mayagüez, PR, 00681<br />
Abstract<br />
A series of commercially available filter<br />
materials and membranes were studied to<br />
investigate their affinity with various explosives<br />
(RDX, NG, TNT, PETN and DNT) and their<br />
adsorption/desorption thermal characteristics<br />
using a Barringer IonScan 400 IMS. The filters<br />
and membranes, that withstood the high<br />
temperatures of the IMS injector/desorber were<br />
made of either fiberglass or cellulose, fine or<br />
coarse porosity of various pore sizes<br />
(0.5-40mm), and medium to fast flow rate. The<br />
data suggest that filter material properties such<br />
as pore size, surface roughness and porosity;<br />
flow rate and explosive vapor pressure are<br />
parameters that can influence the IMS<br />
response. The affinity of the explosives for the<br />
filter material can also influence IMS response.<br />
In general, the filters that showed the best<br />
responses were those with smaller pore size,<br />
medium to fine porosity, and medium flow<br />
rates. The explosives that showed the best IMS<br />
responses were those with very low vapor<br />
pressure such as PETN and RDX. However the<br />
data seem to suggest that the affinity of NG for<br />
the filter materials is enhancing its signal close<br />
to the responses seen for RDX and PETN<br />
when compared with DNT and TNT that are<br />
less volatile than NG.<br />
Introduction<br />
Ion Mobility Spectrometry is an analytical<br />
technique known for over 25 years. The<br />
principles, instrumentation, technological<br />
advances, and applications are very well<br />
described elsewhere 1-3 . IMS detectors are very<br />
sensitive and limits of detection in the ppt or<br />
picogram range are reported in the literature 4,5 .<br />
Thus, the main challenge so far is not to lower<br />
the detection limits but how to transfer the<br />
sample from a real scenario to the IMS<br />
injector/desorber. In this regard, a series of<br />
filters and membranes were investigated, in<br />
order to identify materials with the optimum<br />
physical and chemical properties to be used as<br />
IMS sample collectors for explosives. Tests<br />
were performed on various sampling filter<br />
materials to identify the filter properties that<br />
enhance the collection stage of the explosives<br />
and their adsorption and thermal desorption<br />
properties.<br />
Experimental details<br />
An Ionscan 400 Barringer Instruments, Inc.<br />
Murray Hill, NJ, ion mobility spectrometer with<br />
the thermal desorption injector operating at 220<br />
0<br />
C was used for the experiments. In order to<br />
establish baseline measurements, the<br />
instrument was calibrated for its response to<br />
the explosives selected for the experiment,<br />
using fiberglass-sampling filters. The filters<br />
were obtained from Barringer and are ordinarily<br />
used for this purpose. Explosive standard<br />
solutions were obtained from Radian<br />
International, Analytical Reference Materials,<br />
Austin, TX. All of the standards were used as<br />
the acetonitrile (ACN) solutions and had an<br />
initial concentration of 1000 parts per million<br />
(ppm), except DNT which had a concentration<br />
of 100 ppm. Table 1 shows the properties of<br />
the energetic material tested: RDX, PETN,<br />
TNT, NG, and DNT. Working solutions were<br />
prepared at least on a weekly basis to avoid<br />
degradation 6 by successive dilutions of the<br />
stock solutions in High Pressure Liquid<br />
Chromatography (HPLC) grade ACN, obtained<br />
from Aldrich Chemical Co., Milwaukee, WI.<br />
Other materials tested included Barringer’s rag<br />
swabs, and a variety of filters commercially<br />
obtained from VWR Scientific Supplies,<br />
Copyright © 2000 by International Society for Ion Mobility Spectrometry
N. Mina et al.: „Evaluation of sample collectors...”, IJIMS 4(2001)1, 37-40, p. 38<br />
Cataño, PR. Mass deposits in the moderately<br />
low picogram (> 50 pg) to the 100-nanogram<br />
mass range were utilized. A Hamilton Co.<br />
Microliter # 701 microsyringe was used to<br />
dispense the solutions containing the mass of<br />
the explosive being tested. Before performing<br />
the ion mobility analysis, filter materials were<br />
subjected to two important resistance tests:<br />
solvent compatibility and heat resistance. For<br />
the solvent compatibility tests, small aliquots of<br />
ACN and methanol were utilized and then<br />
visual inspection under microscope followed.<br />
An Olympus BH-2 designed for mineralogical<br />
applications and equipped with infinity<br />
corrected 20x, 50x, 80x, and 100x objectives<br />
was used. For the heat treatment tests, a<br />
bench-top, laboratory oven was used to heat<br />
watch glasses (Corning Glass, 75 mm nominal<br />
diameter) to 230-260 °C. Once the watch<br />
glasses reached thermal equilibrium, a sample<br />
of each sampling material was placed on the<br />
watch glass and left in contact for 60, 180, and<br />
300 seconds. The tests were run in duplicate.<br />
Then they were observed visually and by<br />
inspection under microscope.<br />
The materials that withstood the stability tests<br />
were: Whatman-Balston # 1 (# 1),<br />
Whatman-Balston # 41 (41), Gelman A/E (A/E),<br />
Gelman Metrigard (MG), Scientific Products-<br />
Baxter-VWR (S-P) and VWR # 417 (VWR).<br />
From here on, the manufacture names or their<br />
abbreviation, which appear above in<br />
parenthesis, will be used.<br />
The Barringer instrument was calibrated on a<br />
daily basis, qualitatively using a “dip-stick”<br />
impregnated with a mixture of explosives<br />
(supplied by Barringer). On a quantitative<br />
mode, daily runs with certified standards of<br />
RDX on Barringer fiberglass filter were<br />
performed. Instrument pressure was monitored<br />
constantly as well as position of internal<br />
standard.<br />
Results and discussion<br />
In a series of experiments different filter<br />
materials were spiked with increasing amounts<br />
of various explosives (one at the time) in order<br />
to test for the affinity of the explosives and their<br />
adsorption-desorption characteristics. In these<br />
experiments the Barringer SWAB and Barringer<br />
fiberglass filter, and filters # 1, MG, VWR and<br />
A/E were spiked with explosives in the<br />
picogram range.<br />
Barringer Filter Spiked with RDX, PETN, NG,<br />
TNT, and DNT<br />
The order of IMS response was the following:<br />
RDX > NG > PETN > TNT >>> DNT<br />
RDX gives the overall best response followed<br />
by NG. PETN starts to respond when 50 pg are<br />
deposited and TNT starts to respond at 200 pg.<br />
However, PETN has a tendency to level off<br />
while the TNT response becomes sharper<br />
specially, above 400 pg. In order to get a<br />
response from DNT 10,000 pg must be<br />
deposited on the surface of the filter.<br />
Barringer Swab Spiked with RDX, PETN,<br />
TNT, and DNT<br />
The order of IMS response was the following:<br />
RDX >> PETN > TNT >>> DNT<br />
RDX gives a very sharp response. It is much<br />
more responsive than the other explosives<br />
tested. PETN and TNT show a response that<br />
does not differ significantly. DNT required 30<br />
ng to give an average area response of 193<br />
units and as the mass deposited increased<br />
(30-300 ng range) the response did not change<br />
significantly. In both the Barringer Filter and<br />
Table 1: PROPERTIES OF EXPLOSIVE COMPOUNDS USED<br />
EXPLOSIVE<br />
RDX<br />
PETN<br />
TNT<br />
NG<br />
DNT<br />
MW<br />
222<br />
316<br />
227<br />
227<br />
182<br />
VAPOR<br />
PRESSURE<br />
(Ppb)<br />
0.0015<br />
0.0005<br />
6<br />
300<br />
145<br />
CONCENTRATION<br />
STANDARD<br />
SOLUTION (ppm)<br />
1000<br />
1000<br />
1000<br />
1000<br />
100<br />
TYPE OF<br />
MOLECULAR<br />
STRUCTURE<br />
ALIPHATIC<br />
NITROAMINE<br />
ALIPHATIC<br />
NITROESTER<br />
AROMATIC<br />
NON-POLAR<br />
ALIPHATIC NITRO<br />
ESTER<br />
AROMATIC<br />
POLAR<br />
Copyright © 2000 by International Society for Ion Mobility Spectrometry
N. Mina et al.: „Evaluation of sample collectors...”, IJIMS 4(2001)1, 37-40, p. 39<br />
INSTRUMENT RESPONSE<br />
Figure 1. IMS AVE RESP TO # 1 FILTER SPIKED WITH EXPLOSIVES<br />
1800<br />
1500<br />
NG RDX PETN TNT<br />
1200<br />
900<br />
600<br />
300<br />
0<br />
0 200 400 600 800 1000 1200 1400<br />
MASS DEPOSITED: (pg)<br />
Swab, RDX is the most responsive and DNT is<br />
the less responsive.<br />
Whatman–Balston #1 Filter Spiked with NG,<br />
RDX, PETN, TNT, and DNT<br />
The overall order of IMS response is the<br />
following: NG > PETN > RDX > TNT >><br />
DNT<br />
The #1 filter seems to have good<br />
absorption-desorption characteristics. All the<br />
explosive tested gave good sharp responses<br />
except DNT. The values for DNT are not in the<br />
range therefore do not appear in Fig 1.<br />
VWR Filter with RDX, PETN, NG, and TNT<br />
When the VWR filter is spiked with varying<br />
amounts of explosives (500-1500) in the pg<br />
range it is observed that 500 pg PETN gives an<br />
area of 156 compared to 117 for NG and 80 for<br />
RDX. As the mass increases (600 pg and<br />
above) the PETN and NG graphs have a<br />
tendency to overlap and are probably within the<br />
statistical error. As the mass increases (700 to<br />
1250 pg) the RDX curve becomes slightly more<br />
responsive and levels off at 1500 pg. In general<br />
terms, this filter, with some exceptions at low<br />
and mid points for RDX. There is not a<br />
clear-cut difference in response for the above<br />
explosives and thus an order of IMS response<br />
will not be established. The response for TNT is<br />
very poor. This filter requires over 500 pg of the<br />
explosives in order to respond and as mass<br />
increases, the increase in response is not<br />
significant. (Maximum response is ~ 400 area<br />
units).<br />
S-P Filter Spiked with RDX, PETN, NG, and<br />
TNT<br />
TNT and NG gave a better response than RDX<br />
and PETN in this material. The order of<br />
responsiveness is the following: NG > TNT ><br />
RDX > PETN. TNT is the only explosive that<br />
gives a response when 200 pg are deposited<br />
(peak area of 104). When 300 pg is deposited<br />
TNT continues to be the more responsive with<br />
a peak area of 132 compared with 88 for NG.<br />
At mass deposited above 600 pg NG becomes<br />
more responsive and the response of the TNT<br />
flattens off. The standard deviations are<br />
significantly higher than those of others. As with<br />
the VWR filter, the increase in response is not<br />
significant. (Maximum response is ~ 400 area<br />
units).<br />
Conclusions<br />
Various commercially available filter materials<br />
were tested for optimum explosive collection<br />
and release properties. Of the different filter<br />
materials tested for thermal stability, only<br />
cellulose and fiberglass resisted the high<br />
temperatures necessary for their utilization at<br />
the desorption chamber of the IMS. This finding<br />
is consistent with the materials presently used<br />
as IMS sample collectors. The various filters<br />
tested showed different IMS responses for the<br />
combination of explosives and collection<br />
materials tested. The data suggest that filter<br />
material properties such as: pore size, surface<br />
roughness and porosity, flow rate and explosive<br />
vapor pressure of explosive were parameters<br />
that can influence the IMS response. The<br />
affinity of the explosives for the filter material<br />
can also influence IMS response. This affinity<br />
Copyright © 2000 by International Society for Ion Mobility Spectrometry
N. Mina et al.: „Evaluation of sample collectors...”, IJIMS 4(2001)1, 37-40, p. 40<br />
can be explained in terms of interactions of the<br />
filter with the explosive molecules. Such<br />
interactions can be hydrogen bonding,<br />
dipole-dipole, and van der Waals or weak<br />
interactions between partial charges induced in<br />
the carbon skeleton of cellulose molecules. In<br />
general, the filters that showed the best<br />
responses were those with smaller pore size,<br />
medium to fine porosity, and medium flow<br />
rates. On the other hand, the explosives that<br />
showed the best IMS responses were those<br />
with very low vapor pressure such as PETN<br />
and RDX. However the data seem to suggest<br />
that the affinity of NG for the filter materials is<br />
enhancing its signal close to the responses<br />
seen for RDX and PETN when compared with<br />
DNT and TNT that are less volatile than NG.<br />
The ideal sampling material should have the<br />
following desirable properties. Be able to<br />
withstand the high temperatures necessary for<br />
thermal desorption: thermal stability. It should<br />
have good adsorption-desorption properties for<br />
all explosives: rapid adsorption of the explosive<br />
during sampling and quick release of explosive<br />
while heated at the desorption chamber of the<br />
IMS. Finally, it should be inert: do not react with<br />
the explosive or the environment.<br />
Acknowledgments<br />
This work was supported by the FAA under<br />
project No. 99-G-029.<br />
References<br />
[1] R. H. St. Louis and H. H. Hill Jr., Crit. Rev. Anal.<br />
Chem., 21, 321, (1990).<br />
[2] J. V. Haase Ewin, Asian Defense Journal, 6, 56,<br />
(1993).<br />
[3] D. D. Fetterolf, in Advances in Analysis and<br />
detection of Explosives, J. Yynon (Ed.),<br />
Dordrecht, Netherlands, 1993.<br />
[4] F. Garofolo, F. Marziali, V. Migliozzi and A.<br />
Stama, Rapid Commun. In Mass<br />
Spectrom.10,1321, (1996).<br />
[5] F. Garofolo, V. Migliozzi and B. Roio, Rapid<br />
Commun. In Mass Spectrom.8, 527, (1994)<br />
[6] Jankowski, P.Z., Jappinga, E.M., and Butler, E.,<br />
“Operational Deploymentof Explosives Detection<br />
Equipment During the 1996 Olympics.<br />
Copyright © 2000 by International Society for Ion Mobility Spectrometry
Principles and applications of a solid phase desorption unit<br />
coupled to a GC-IONSCAN ® system<br />
A. Grigoriev, R. Jackson, F. Kuja, S. Nacson and A. Rudolph*<br />
Barringer Instruments Ltd., 1730 Aimco Boulevard, Mississauga, ON L4W 1V1, Canada<br />
Introduction<br />
The Barringer Solid Phase Desorption (SPD)<br />
unit was developed to allow GC-IONSCAN<br />
analyses of solid samples without prior sample<br />
preparation.<br />
It attaches to the side of the GC-IONSCAN and<br />
interfaces with it mechanically and<br />
electronically (Figure 1). The liquid sample<br />
injection capability of the GC is retained for<br />
maximum flexibility. Temperatures of the SPD<br />
desorber, inlet, valve and transfer lines as well<br />
as the duration of each stage of the analysis<br />
can be programmed. The SPD-GC-IONSCAN<br />
now offers three analysis methods: Direct<br />
desorption IMS, liquid injection GC-IMS and<br />
solid phase desorption GC-IMS.<br />
Method of Operation<br />
During loading, samples are thermally<br />
desorbed through a heated transfer line and a<br />
heated six port valve into the air cooled sample<br />
collection loop where they condense.<br />
For the sample analysis, the six port valve<br />
switches position and the loop is rapidly heated.<br />
GC carrier gas purges the loop and transfers<br />
the collected sample into the column. After the<br />
purging is complete, the valve switches back<br />
into the loading position and the loop is then air<br />
cooled for the next analysis. Figure 2 shows<br />
the timing of events during sample loading and<br />
analysis.<br />
GC Injector<br />
GC Module<br />
Cooling Fan<br />
For Sample Loop<br />
SPD Desorber<br />
IONSCAN<br />
Desorber<br />
SPD Module<br />
IONSCAN<br />
Module<br />
Figure 1:<br />
Barringer GC-IONSCAN<br />
Copyright © 2000 by International Society for Ion Mobility Spectrometry
A. Grigoriev et al.: „Principles and applications of solid phase ...”, IJIMS 4(2001)1, 41-44, p. 42<br />
2ng Amphetamine 2ng PCP<br />
2ng Methamphetamine 2ng Cocaine<br />
2ng MDA<br />
10ng THC<br />
2ng MDMA<br />
10ng Heroin<br />
2ng MDEA<br />
Figure 2: Timing of Events<br />
Examples of Analyses<br />
Mixtures of narcotics or explosives were<br />
analyzed both by direct (splitless) GC injection<br />
and by SPD injection (from Teflon filter) on the<br />
standard 15m MXT-1 column (0.53mm i.d.,<br />
1µm film thickness), using nitrogen as carrier<br />
gas. Figure 3 shows the analysis of a mixture<br />
of nine narcotics, using the splitless liquid<br />
injection method (2µL injection), whereas<br />
Figure 4 shows the results from the solid phase<br />
desorption analysis of the same mixture (2µL<br />
on a Teflon filter).<br />
Figure 5 shows the analysis of a mixture of six<br />
explosives, using the splitless liquid injection<br />
method (2µL injection), and Figure 6 shows the<br />
results from the solid phase desorption analysis<br />
of the same mixture (2µL on a Teflon filter).<br />
Figure 7 illustrates the separation of EDME and<br />
cocaine from a Teflon filter, using the SPD<br />
analysis method with a 10m DB-5 column<br />
(0.53mm i.d., 1µm film thickness) and nitrogen<br />
as carrier gas. This method was developed for<br />
the vapour screening of cargo containers for<br />
the presence of cocaine.<br />
Copyright © 2000 by International Society for Ion Mobility Spectrometry
A. Grigoriev et al.: „Principles and applications of solid phase ...”, IJIMS 4(2001)1, 41-44, p. 43<br />
2ng Amphetamine 2ng PCP<br />
2ng Methamphetamine 2ng Cocaine<br />
2ng MDA<br />
10ng THC<br />
2ng MDMA<br />
10ng Heroin<br />
2ng MDEA<br />
Figure 3: Splitless Injection Figure 4 Solid Phase Desorption<br />
(Oven Temperature Profile: 120°C for 30s, 15°C/min to 140°C, 30°C/min to 280°C)<br />
Figure 5: Splitless Injection<br />
Figure 6: Solid Phase Desorption<br />
(Oven Temperature Profile: 120°C for 60s, 40°C/min to 240°C)<br />
Conclusion<br />
The Solid Phase Desorption add-on module to<br />
the Barringer GC-IONSCAN performed well<br />
and gave good results in the analyses of<br />
mixtures of narcotics and explosives without<br />
prior sample preparation. Even high boiling<br />
analytes such as heroin or tetryl were observed<br />
to pass efficiently through the SPD system.<br />
Sample loss through degradation or<br />
condensation is estimated to be less than 20%<br />
for most analytes investigated.<br />
Further experiments will be carried out to<br />
exactly determine analyte losses, to optimize<br />
the system and to apply the method to various<br />
other analytical problems.<br />
Copyright © 2000 by International Society for Ion Mobility Spectrometry
A. Grigoriev et al.: „Principles and applications of solid phase ...”, IJIMS 4(2001)1, 41-44, p. 44<br />
Figure 7:<br />
Analysis of a EDME / Cocaine Mixture<br />
Copyright © 2000 by International Society for Ion Mobility Spectrometry
Operational assessment of a handheld ion mobility spectrometry<br />
instrument<br />
Chih-Wu Su 1 , Steve Rigdon 2 , Tim Noble 2 , Mike Donahue 2 , Corey Ranslem 3<br />
1<br />
United States Coast Guard Research & Development Center, 1082 Shennecossett Road, Groton, CT 06340, USA<br />
2<br />
Anteon Corporation, Rte. 2, P.O. Box 220, North Stonington, CT 06359 USA<br />
3<br />
United States Coast Guard, Taclet South, 15000 NW 42nd Ave, Opa Locka Airport, Opa Locka, FL 33052, USA<br />
INTRODUCTION<br />
In 1995, the U.S. Coast Guard made the<br />
decision to outfit vessel boarding teams with<br />
state of the art technology to assist them in<br />
detecting trace levels of narcotics. Based on an<br />
assessment conducted by the Research and<br />
Development Center (R&DC), ion mobility<br />
spectrometry (IMS) was selected as the<br />
technology best suited for operational use.<br />
Specifically, the Coast Guard selected the<br />
Ionscan, an IMS instrument manufactured by<br />
Barringer instruments. A limiting factor of all<br />
models of the Ionscan is its size and power<br />
requirements, weighing between 50 and 60<br />
pounds. These limitations typically require that<br />
the Ionscan be operated on the Coast Guard<br />
cutter where there is a ready supply of 115VAC<br />
power. As a result, samples must be<br />
transported from the vessel being boarded to<br />
the Ionscan for analysis. The impact of this<br />
protocol is a loss of time resulting in the inability<br />
of the boarding officer to quickly determine<br />
areas to resampled. Additionally, the<br />
requirement that the Ionscan operator remain<br />
on the cutter results in the boarding party being<br />
reduced by one person.<br />
THE SABRE 2000 HANDHELD IMS<br />
In early 2000, Barringer Instruments released<br />
the Sabre 2000, a new instrument based on<br />
IMS. The Sabre 2000 weighs less than 6<br />
pounds and is capable of operating on battery<br />
power. The advantage to the Sabre 2000 is that<br />
it can be transported to the vessel being<br />
boarded. Should the Sabre 2000 provide the<br />
operator with an equivalent level of confidence<br />
in the analytical result as the Ionscan, then the<br />
physical advantages afforded by the Sabre<br />
2000 will enable the Coast Guard to conduct<br />
analysis of samples on the vessel being<br />
boarded.<br />
This protocol offers many advantages to the<br />
boarding party over the existing protocol.<br />
Some advantages this device would bring<br />
include the capability of having near real-time<br />
analysis of the samples. Since samples will be<br />
transferred in batches, and not at the end of the<br />
sampling phase, analytical results should be<br />
available minutes after a sample is taken.<br />
Second, with near real-time analysis, the ability<br />
to quickly determine areas of interest requiring<br />
additional resampling will be possible. If each<br />
batch of samples correlates to a specific area<br />
of the vessel, then an alarm in that batch may<br />
indicate the requirement to resample that area.<br />
Third, since the samples are being analyzed on<br />
the vessel, there is no longer a need to leave a<br />
member of the boarding team behind to be the<br />
Ionscan operator. Larger boarding teams<br />
results in increased safety and an increase in a<br />
team’s ability to more thoroughly search a<br />
vessel.<br />
From an analytical standpoint, there is a great<br />
difference between the Sabre 2000 and the<br />
Ionscan 400B. The Sabre 2000 operates using<br />
a closed loop IMS architecture while the<br />
Ionscan 400B operates using an open loop IMS<br />
architecture. One repercussions of employing<br />
a closed loop IMS architecture is that a<br />
semi-permeable membrane is necessary to<br />
physically separate the inside of the instrument<br />
from the outside environment. Another<br />
difference between the Sabre 2000 and the<br />
Ionscan 400B is the operating temperatures.<br />
The Sabre 2000 operates at a much lower<br />
temperature than the Ionscan. The vaporization<br />
rate of organic compounds from a sampling<br />
[The opinions or assertions contained herein are the private ones of the authors and are not to be construed as official or reflecting the<br />
views of the Commandant or the Coast Guard at large. Any instrument, material or chemical referred to by its brand name does not<br />
Copyright © 2000 by International Society for Ion Mobility Spectrometry<br />
constitute an endorsement by the authors, the Commandant or the Coast Guard at large.]
Chih-Wu Su et al.: „Operational assessment of a handheld...”, IJIMS 3(2000)1, 45-47, p. 46<br />
matrix is proportional to the desorption<br />
temperature. The higher the desorption<br />
temperature, the more mass of a sample can<br />
be vaporized over a shorter time period. At the<br />
lower operating temperatures of the Sabre<br />
2000, it will take longer to evaporate the same<br />
mass of sample than the Ionscan. Since the<br />
IMS analysis is a nearly continuous process,<br />
the maximum amplitude of a peak detection will<br />
be lower. The overall result is a decrease in<br />
the detection sensitivity. The lower operating<br />
temperatures also mean that the instrument<br />
may be more prone to sample hang-up if high<br />
levels of contamination are encountered.<br />
When comparing the Sabre 2000 and the<br />
Ionscan, it is evident that they are two totally<br />
different instruments from both a physical as<br />
well as an analytical perspective. As a result,<br />
the assessment of the Sabre 2000 was<br />
approached from the standpoint of it being a<br />
totally new and different instrument. An<br />
intensive evaluation was conducted ranging<br />
from the laboratory to the field.<br />
U.S. COAST GUARD’S APPROACH TO<br />
ASSESSING THE SABRE 2000<br />
The U.S. Coast Guard’s approach to assessing<br />
the Sabre 2000 was a three-step process. The<br />
assessment began with a laboratory evaluation.<br />
The purpose of the laboratory evaluation was to<br />
determine the baseline performance of the<br />
instrument under ideal conditions. The second<br />
step in the evaluation process was a controlled<br />
field evaluation. The purpose of this phase was<br />
to determine the Sabre 2000 performance<br />
under controlled real world conditions.<br />
Following the controlled field evaluation, a<br />
go/no-go decision will be made as to whether<br />
the assessment should be continued on to its<br />
final phase, an at-sea evaluation.<br />
Laboratory Evaluation<br />
The laboratory evaluation was conducted in the<br />
narcotics detection laboratories at the Coast<br />
Guard Research and Development Center.<br />
The evaluation was conducted alongside an<br />
Ionscan 400B for comparison purposes. There<br />
were several tests conducted in the laboratory<br />
evaluation, all centered around determining the<br />
Sabre 2000 analytical capabilities under ideal<br />
conditions.<br />
• Minimum Detection Limit (MDL) Testing.<br />
This testing was conducted to determine<br />
the Sabre 2000 sensitivity for cocaine,<br />
heroin,<br />
methamphetamine,<br />
tetrahydrocannabinol (THC), and<br />
ecgonidine methyl ester (EDME).<br />
• Instrument Response Testing. This testing<br />
was conducted to determine the Sabre<br />
2000 response to a wide range of<br />
concentrations of liquid standards of each<br />
of the narcotics used for the MDL testing. A<br />
series of ”calibration curves” were<br />
developed.<br />
• Instrument Response to Wipe Testing.<br />
This series of tests was similar to the<br />
instrument response testing with the<br />
exception that liquid standards were<br />
deposited on glass plates, allowed to dry,<br />
and then wipe sampled. This test more<br />
closely replicated how the instrument will be<br />
used in the field. Only cocaine was<br />
analyzed for this test.<br />
• Dirty Sample Matrix Testing. Since ”clean”<br />
samples are very rare in the field, a series<br />
of tests to determine the effect of a dirty<br />
sample matrix on the ability of the Sabre<br />
2000 to detect cocaine were conducted.<br />
• Environmental Testing. In its intended<br />
application, the Sabre 2000 will be utilized<br />
during boardings being conducted on the<br />
high seas under conditions of elevated<br />
temperature and high relative humidity. A<br />
series of tests were conducted in an<br />
environmental chamber to test the ability of<br />
the Sabre 2000 to operate under these<br />
conditions.<br />
• Finally, several qualitative parameters<br />
concerning the Sabre 2000 performance<br />
were assessed. They were: battery life,<br />
battery recharge cycle, dryer life, and<br />
membrane life.<br />
Controlled Field Evaluation<br />
The controlled field evaluation was conducted<br />
in several areas around Miami. This location<br />
was chosen for its high marine vessel traffic as<br />
well as its amenability to conducting testing on<br />
live targets in a pierside environment.<br />
Throughout the controlled field evaluation, a<br />
total of three samples were taken from each<br />
test location. Two of the samples were taken<br />
with the Sabre 2000 swipes (swipes specifically<br />
manufactured by Barringer Instruments for use<br />
with the Sabre 2000) for analysis on the two<br />
instruments being utilized for the test. The third<br />
swipe was taken on traditional Coast Guard<br />
sample swipe paper (Schleicher & Schuell filter<br />
Copyright © 2000 by International Society for Ion Mobility Spectrometry
Chih-Wu Su et al.: „Operational assessment of a handheld...”, IJIMS 3(2000)1, 45-47, p. 47<br />
paper grade 404) for analysis on an Ionscan<br />
400B.<br />
The first area of testing was at a U.S. Customs<br />
seizure yard. This area had several boats<br />
impounded for smuggling drugs. This location<br />
enabled samples to be taken from areas of<br />
known contamination which would provide<br />
valuable side-by-side comparison data between<br />
the Sabre 2000s and the Ionscan. As<br />
mentioned, each location that was sampled<br />
was analyzed on two Sabre 2000’s and on an<br />
Ionscan 400B.<br />
The second area of testing was at a Florida<br />
Highway Patrol (FHP) station. Approximately<br />
one year earlier, FHP had seized a van with a<br />
hidden compartment containing a significant<br />
amount of cocaine. Once again, this location<br />
enabled samples to be taken from areas of<br />
known contamination which would provide<br />
valuable side-by-side comparison data between<br />
the Sabre 2000s and the Ionscan.<br />
The final area of testing was on actual boats<br />
arriving in Miami and mooring in the Miami<br />
River. This area was chosen because it<br />
enabled testing to be conducted on actual<br />
vessels similar to those that are boarded on the<br />
high seas. Considering that these were live<br />
targets, it was not known if these targets would<br />
alarm, nor did we have any prior knowledge of<br />
the contaminants´ make-up or their levels. This<br />
phase of the testing provided information on<br />
how the Sabre 2000 will perform on an average<br />
target of interest.<br />
Go/No-Go Decision<br />
At this stage of the assessment, the Sabre<br />
2000’s physical characteristics and analytical<br />
capabilities have been thoroughly investigated.<br />
Based on these findings, a decision is being<br />
drafted which will govern whether the<br />
assessment should progress to its final phase,<br />
an at-sea evaluation. The purpose of holding<br />
this review is to ”weed out” instruments that are<br />
unlikely to be fully employable under CG<br />
operating scenarios regardless of technical<br />
achievement at this point. In broad terms, the<br />
assessment and decision to proceed is based<br />
on one of two criteria being met:<br />
• The instrument provides vastly superior<br />
analytical performance with similar<br />
physical characteristics.<br />
• The instrument provides similar analytical<br />
performance with vastly superior physical<br />
characteristics.<br />
At-Sea Evaluation<br />
The final step in the evaluation of the Sabre<br />
2000 will be deploying the instrument on a<br />
Coast Guard cutter for use during live<br />
boardings. At the completion of this period,<br />
several qualitative determinations will be made:<br />
• Transportation Requirements – How<br />
difficult is it to transfer the Sabre 2000 from<br />
the cutter to the rigid hull inflatable boat<br />
(RHIB) and then to the vessel being<br />
boarded? How waterproof/water resistant<br />
is the Sabre 2000 during this transfer? Do<br />
special precautions have to be taken to<br />
insure the instrument stays dry? How<br />
capable is the Sabre 2000 of withstanding<br />
an impact during the transfer as well as<br />
while being lifted to and from the RHIB?<br />
• Battery Life – Does the internal battery on<br />
the Sabre 2000 provide sufficient operating<br />
time to conduct a boarding or is an<br />
extended-life external battery pack<br />
required?<br />
• Is the bridge of the ship the best place to<br />
set the Sabre 2000 up? If not, where is the<br />
best place?<br />
Finally, the lessons learned during the at-sea<br />
evaluation will provide valuable insight into the<br />
development of operational protocols.<br />
Conclusions<br />
The Coast Guard has successfully used IMS<br />
technology for several years. Should the Sabre<br />
2000 provide a similar level of analytical<br />
confidence as the Ionscan, the ability of the<br />
Coast Guard to conduct a boarding will be<br />
revolutionized. To this point, the Coast Guard<br />
has never had the ability to conduct on-site<br />
analyses of samples due to the lack of<br />
handheld, high temperature IMS instruments<br />
that would accept wipe samples. In the<br />
ever-changing world of drug smuggling, this<br />
capability is a must if the Coast Guard is to<br />
continue to provide a real deterrent to<br />
smugglers trying to bring narcotics to the<br />
shores of the United States.<br />
Copyright © 2000 by International Society for Ion Mobility Spectrometry
In-situ methylation of methamphetamine during IONSCAN analysis<br />
Chih-Wu Su 1 , Steve Rigdon 2 and Kim Babcock 2<br />
1<br />
United States Coast Guard Research & Development Center, 1082 Shennecossett Road, Groton, CT 06340 USA<br />
2<br />
Anteon Corporation, Rte. 2, P.O. Box 220, North Stonington, CT 06359 USA<br />
INTRODUCTION<br />
The Ionscan, an instrument manufactured by<br />
Barringer Instruments based on ion mobility<br />
spectrometry (IMS) technology, is well known<br />
for its field application in illicit drug interdiction.<br />
It is currently used by the U.S. Coast Guard<br />
(CG) and by the Drug Enforcement Agency<br />
(DEA) to support federal, state and local drug<br />
cases.<br />
complicated the observed interference of<br />
nicotine with Meth detection. In order to<br />
investigate the nature of Meth-2, a study was<br />
launched to isolate and identify it.<br />
Consequently, an interesting in-situ methylation<br />
process during Ionscan analysis was<br />
discovered. This paper reports the results of<br />
this study as well as some possible<br />
applications.<br />
The CG Research and Development Center<br />
(R&DC) carried out an investigation to<br />
determine the source and identity of an extra<br />
peak that appeared in Ionscan results for<br />
methampetamine (Meth), in liquid standard<br />
form, on filter paper. It was observed that the<br />
extra peak, tentatively named Meth-2,<br />
appeared just after Meth on the Ionscan<br />
plasmagram (Figure 1) and had a drift time<br />
similar to that for nicotine. In 1996, Ms. Angela<br />
DeTulleo of the DEA South Central Lab<br />
reported that nicotine interfered with the<br />
detection of Meth 1 . In 1999, Dr. Peter<br />
Harrington’s group from Ohio University in<br />
Athens, Ohio, reported a procedure that could<br />
pre-separate Meth and nicotine using the<br />
difference in their vapor pressures and the<br />
SIMPLISMA (SIMPL-to-use-Interactive<br />
Self-Modeling Mixture Analysis) method 2 .<br />
Although Dr. Harrington’s method solved the<br />
nicotine interference problem, it required the<br />
use of an additional device as well as extra<br />
sample preparation time. The CG Research<br />
and Development Center (R&DC) has always<br />
been involved in the investigation and<br />
development of fast and easy field applicable<br />
methods for CG boarding officers to confirm<br />
and reduce/eliminate interferences on target<br />
compounds detected by the Ionscan. The<br />
unknown peak called Meth-2 further<br />
EXPERIMENTAL RESULTS AND<br />
DISCUSSION<br />
An Ionscan Model 400B with its drift tube, inlet<br />
tube and desorber operated at 235ºC, 290ºC,<br />
and 280ºC, respectively, was used to study<br />
possible sources of Meth-2 formation. A<br />
Finnigan MAT Model INCOS 50 quadrupole<br />
mass spectrometer (MS) coupled to a<br />
Hewlett-Packard Model 5890A gas<br />
chromatograph (GC) and UltraXL data system<br />
were used to identify the chemical structure of<br />
Meth-2. Schleicher and Schuell grade 404 filter<br />
paper (S&S404), Barringer Teflon discs and<br />
140-mesh stainless steel screen were used as<br />
sample holders for the Ionscan 400B.<br />
Investigation of sources of Meth-2: Meth exists<br />
as two optical isomers, d-Meth and l-Meth. If<br />
the Meth-2 was due to the separation of d-Meth<br />
and l-Meth in the Ionscan, the amplitudes of<br />
Meth and Meth-2 should correspond to<br />
plasmagrams of pure samples of each of these<br />
isomers. Analysis of the Ionscan plasmagrams<br />
for d-Meth and l-Meth indicated they have<br />
identical drift times. Therefore, these two<br />
optical isomers of Meth are not separable by<br />
Ionscan analysis and neither can cause the<br />
Meth-2 peak. The possibility that an impurity in<br />
the Meth standard would cause Meth-2 to form<br />
was ruled out after Ionscan tests with Meth (5<br />
[The opinions or assertions contained herein are the private ones of the authors and are not to be construed as official or reflecting the<br />
views of the Commandant or the Coast Guard at large. Any instrument, material or chemical referred to by its brand name does not<br />
Copyright © 2000 by International Society for Ion Mobility Spectrometry<br />
constitute an endorsement by the authors, the Commandant or the Coast Guard at large.]
Chih-Wu Su et al.: „In-situ methylation of ...”, IJIMS 3(2000)1, 48-51, p. 49<br />
Meth Meth Meth-2<br />
Meth-2<br />
Figure 1. 20 ng Meth on S&S404<br />
Figure 2. Plasmagram of Meth-2 Extract<br />
10<br />
75<br />
50<br />
Meth<br />
Meth-2<br />
Ethamph<br />
Ethamph-2<br />
25<br />
0<br />
Figure 3. GC/MS TIC of Meth-2<br />
Figure 5. 80 ng Ethamph on S&S404<br />
72<br />
91<br />
Figure 4. Mass Spectrum of Meth-2 (m/z 45 to 200)<br />
Copyright © 2000 by International Society for Ion Mobility Spectrometry
Chih-Wu Su et al.: „In-situ methylation of ...”, IJIMS 3(2000)1, 48-51, p. 50<br />
ng to 1000 ng) on stainless steel screens or<br />
Teflon consistently indicated a single peak (i.e.,<br />
no Meth-2 formation). Since the Meth-2 peak<br />
maximum amplitude increased with increasing<br />
amounts of Meth during Ionscan analysis,<br />
impurities in the S&S404 filter paper were also<br />
ruled out as the sole source of Meth-2<br />
formation.<br />
Isolation and identification of possible chemical<br />
structures for Meth-2: The formation of Meth-2<br />
was clearly due to the heating of Meth<br />
deposited on S&S404 in the Ionscan desorber.<br />
Large amounts of Meth-2 were extracted from<br />
two S&S404 filter papers pre-spotted with a<br />
total of 1 mg of Meth in methanol after being<br />
heated at 270ºC for 2.5 min. After centrifuging<br />
and concentration, the extract was analyzed by<br />
both Ionscan and GC/MS. The Ionscan<br />
plasmagram for the extract on stainless steel<br />
screen showed a major peak for Meth-2 and a<br />
trace amount of Meth (Figure 2). The total ion<br />
chromatogram (TIC) from the GC/MS analysis<br />
of this extract also showed a small Meth peak,<br />
and a large peak assigned as Meth-2 with a<br />
retention time of 9 min 40 sec (Figure 3). Meth<br />
has a spectrum with m/z=58 (CH 3CH(NHCH 3)) +<br />
as the base peak, m/z=91 from the tropylium<br />
ion with an amplitude about 10% as high as the<br />
base peak and an undetectable molecular ion<br />
at m/z=149. Meth-2 has a spectrum with<br />
m/z=72 as the base peak, m/z=91 about 10%<br />
as high as the base peak and an undetectable<br />
molecular ion (Figure 4). The overall<br />
characteristic of the mass spectrum of Meth-2<br />
resembles that of Meth except its base peak is<br />
14 amu larger. It is logical to assume that this<br />
increase can result from replacing any<br />
hydrogen in the m/z=58 fragment ion with a<br />
methyl group. It was hypothesized, therefore,<br />
that Meth and Meth-2 are homologs. The<br />
subtle difference (about 0.063) between their<br />
reduced mobilities supports this assumption.<br />
Four possible structures can be derived from<br />
Meth by replacing any one of the hydrogen<br />
atoms with a methyl group in the N-methyl<br />
aminoethyl moiety to form Meth-2. They are<br />
ethyl amphetamine (Ethamph), N,a,a,-trimethyl<br />
phenethylamine, N-methyl-1-phenyl propylamine,<br />
and dimethyl amphetamine (Dimeth).<br />
Dimeth is a tertiary amine and the other three<br />
are secondary amines. The NIST/EPA/NIH<br />
mass spectra database shows that all four<br />
compounds have the same mass spectrum as<br />
that of Meth-2. Ethamph was the only one that<br />
was commercially available for this study. The<br />
GC/MS TIC retention times of Ethamph and<br />
Meth-2 were different, indicating they are<br />
different compounds. Although Ionscan<br />
analyses showed that both Ethamph and<br />
Meth-2 have identical drift times, the<br />
plasmagram of Ethamph revealed an extra<br />
peak, Ethamph-2 (Figure 5). This plasmagram<br />
is, therefore, similar to the pattern in the<br />
plasmagram of Meth (Figure 1) where a<br />
primary peak appears for the compound<br />
deposited as well as a secondary peak with a<br />
slightly longer drift time for a related, product<br />
compound. Figure 2 shows that Meth-2 does<br />
not produce this secondary peak. Both Meth<br />
and Ethamph are secondary amines. Other<br />
secondary amines such as dioctylamine (DOA)<br />
and 3,4-methylene dioxymethamphetamine<br />
(MDMA) also show the same two-peak pattern.<br />
It was thus concluded that Meth-2 was not a<br />
secondary amine but a tertiary amine. Dimeth<br />
is the only chemical of the four possible<br />
chemicals that met this requirement.<br />
Synthesis of Dimeth: Two methods are<br />
commonly used to synthesize Dimeth via<br />
methylation of Meth in a liquid solution. The<br />
first is the reaction of Meth with methyl iodide.<br />
The second is the reaction of Meth with formic<br />
acid and formaldehyde (F/FA), known as the<br />
Eschweiler-Clarke reaction. Both methods<br />
were quickly checked by adding the proper<br />
reagent onto an S&S404 filter paper<br />
pre-spotted with Meth followed by analysis in<br />
the Ionscan. Meth-2 was observed in the<br />
reaction of Meth with the solution of F/FA but<br />
not with methyl iodide. Dimeth was then<br />
synthesized using the Eschweiler-Clarke<br />
reaction. The Ionscan plasmagram and the<br />
GC/MS TIC retention time matched those of<br />
Meth-2. Based upon these results, Meth-2 was<br />
identified as Dimeth.<br />
Formation of Meth-2 in the vapor phase:<br />
Samples from the real world contain a myriad<br />
of matrices such that the Meth will most likely<br />
not have direct contact with the cotton fabric as<br />
is the case of pre-spotting a liquid standard<br />
solution. To verify whether Meth has to be in<br />
contact with S&S404 filter paper in the Ionscan<br />
for the methylation reaction to occur, three<br />
pieces of material were used for this<br />
investigation: a) a stainless steel screen<br />
pre-spotted with a Meth standard solution; b) a<br />
Copyright © 2000 by International Society for Ion Mobility Spectrometry
Chih-Wu Su et al.: „In-situ methylation of ...”, IJIMS 3(2000)1, 48-51, p. 51<br />
Barringer Teflon O-ring; and c) a blank S&S404<br />
filter paper. These three materials were<br />
inserted into the Ionscan desorber together in a<br />
sandwich formation with the Teflon O-ring in<br />
the middle which prevented the outer layers<br />
from touching. Analyses were conducted with<br />
the blank S&S404 filter paper either over or<br />
under the pre-spotted screen. Results showed<br />
that Meth-2 was observed in all these tests. It<br />
was concluded that methylation of Meth by<br />
vapor emitted from S&S404 filter paper did<br />
occur.<br />
Application of the Eschweiler-Clarke reaction to<br />
Ionscan analyses: By applying a mixture of<br />
F/FA either directly to where the Meth was<br />
spotted on the filter paper or on a Teflon layer<br />
above or below the Meth (i.e., in the sandwich<br />
configuration) a high yield of Dimeth was<br />
achieved. This indicated that the Eschweiler-Clarke<br />
reaction methylated the Meth<br />
almost completely either in the liquid or gas<br />
phase conditions, thereby becoming a potential<br />
confirmation method for field Meth detection.<br />
This confirmation method can also be applied<br />
to other secondary amines such as the<br />
methylation of MDMA to 3,4-methylene<br />
dioxydimethylamphetamine (MDDMA), and the<br />
methylation of DOA to N-methyl DOA. A<br />
mixture of F/FA in Ionscan analyses will<br />
methylate primary amines and secondary<br />
amines but not tertiary amines. This<br />
phenomenon can be used to confirm whether<br />
an amine detected by the Ionscan is a tertiary<br />
amine or not.<br />
CONCLUSION<br />
The peak that appears in the Ionscan<br />
plasmagram just after the Meth peak, when<br />
Meth is spotted on S&S404 filter paper, has<br />
been identified as dimethyl amphetamine. The<br />
mechanism for its formation is still unresolved<br />
since it is still unknown whether the paper<br />
contains any formaldehyde or formic acid,<br />
regardless of whether they are present in free<br />
form or as by-products from heating the filter<br />
paper during analysis.<br />
Introduction of a mixture of F/FA into the<br />
Ionscan during analysis can be used as a<br />
confirmation method to identify primary and<br />
secondary amines. If an amine does not<br />
respond to this treatment, it is likely a tertiary<br />
amine.<br />
REFERENCES<br />
[1] DeTulleo-Smith, A.M., “Methamphetamine<br />
Versus Nicotine Detection on the Barringer Ion<br />
Mobility Spectrometer,” Proceedings of the 5 th<br />
International Workshop on Ion Mobility<br />
Spectrometry, Jackson, WY, August 20-22,<br />
1996.<br />
[2] Reese, E.S., Harrington, P.B., “The Analysis of<br />
Methamphetamine Hydrochloride by Thermal<br />
Desorption Ion Mobility Spectrometry and<br />
SIMPLISMA”, Journal of Forensic Sciences, Vol.<br />
14, No. 1, 1999, pp. 68 - 76.<br />
Copyright © 2000 by International Society for Ion Mobility Spectrometry
Ion mobility spectrometry in helium with corona discharge ionization source<br />
M. Tabrizchi* and T. Khayamian<br />
Chemistry Department, Isfahan University of Technology, Isfahan 84154, Iran<br />
ABSTRACT<br />
An ion mobility spectrometer is described using<br />
helium as the drift gas and corona discharge as<br />
its ionization source. The observed ion current<br />
is approximately seventy times larger than that<br />
noted for the conventional system having 63 Ni<br />
as the ionization source. The selectivity factors<br />
in helium are close to those in nitrogen. The<br />
relative separation of the peaks in helium is<br />
almost twice as much as that observed in<br />
nitrogen. This results in a major enhancement<br />
of the resolution. A two-fold increase in the<br />
capacity factor (k') for ions in helium is also<br />
realized.<br />
INTRODUCTION<br />
IMS has been considered as a relatively<br />
low-resolution technique. Many attempts,<br />
including the use of long drift tubes [1] and<br />
increasing the electric field [2], have been<br />
made to enhance the resolution of IMS. It is<br />
commonly believed that the resolving power will<br />
not be improved by changing the drift gas [3].<br />
We report here the use of helium instead of<br />
air/nitrogen in IMS with corona discharge<br />
ionization source and show that, this not only<br />
enhances the resolution of IMS but also<br />
increases its ion current considerably.<br />
EXPERIMENTAL<br />
The corona discharge ion mobility spectrometer<br />
used in this study was constructed in our<br />
laboratory at Isfahan University of Technology<br />
and has been described elsewhere [4,5]. A<br />
corona discharge ionization source with a<br />
point-to-plane geometry was used in this<br />
instrument. The electric field strength was 310<br />
V/cm and typically a 30 µs pulse was used<br />
during the measurements in helium and a 150<br />
µs pulse in nitrogen. Flow rates of the carrier<br />
and drift gases were about 100 and 500 ml/min<br />
respectively. The gases used in this work was<br />
chromatographic grade helium and nitrogen<br />
(99.9995% Internmar B.V., Netherlands). Eight<br />
chemicals were used in this study including;<br />
acetophenone, n-butyl acetate, ethyl acetate,<br />
methyl methacrylate, dimethyl sulfoxide<br />
(DMSO), dimethyl methylphosphonate (DMMP),<br />
acetone, and methyl iso-butyl ketone (Fluka).<br />
RESULTS AND DISCUSSION<br />
The total ion current observed for helium<br />
corona was a quadratic function of the drift field<br />
and was about 40 nA at about 300 V/cm, which<br />
is almost four times greater than that of<br />
nitrogen corona and almost fifty times greater<br />
than that of 63 Ni source. The mobility spectra of<br />
all 8 compounds were obtained in helium and<br />
nitrogen at room temperature. As an example,<br />
the positive ion mobility spectra of acetone and<br />
DMMP recorded in helium and nitrogen are<br />
shown in Figure 1. Although the drift times are<br />
considerably shorter in helium, the number of<br />
peaks and the general shape of IMS spectra<br />
are similar to those observed in nitrogen.<br />
Therefore a correlation between each pair of<br />
spectra can be speculated. The dominant<br />
reactant ions in nitrogen are (H 2O) nH + . It has<br />
also been shown that the main reactant ions in<br />
helium are (H 2O) nH + [6]. The product ions are<br />
generated by a reaction between sample<br />
molecules and reactant ions. Since the reactant<br />
ions are the same, the product ions are also<br />
expected to be the same for a specific sample,<br />
provided the buffer gas does not attach to ions.<br />
Hill and his coworkers have observed the same<br />
product ions (protonated molecules) in different<br />
drift gases, nitrogen, helium, argon and carbon<br />
dioxide [3]. Assuming the existence of the<br />
same ions in helium and nitrogen for each<br />
Copyright © 2000 by International Society for Ion Mobility Spectrometry
M. Tabrizchi and T. Khayamian: „Ion mobility Spectrometry...”, IJIMS 4(2001)1, 52-56, p. 53<br />
sample, their corresponding spectra can be<br />
compared with each other, just as the<br />
comparing chromatograms, which are obtained<br />
from two different columns. The correlation<br />
between the two sets of spectra will be<br />
explored based on the selectivity factors, the<br />
resolution and the capacity factors.<br />
The selectivity factor<br />
The selectivity factor, α, for two species A and<br />
B is defined in chromatography as [7]:<br />
tB<br />
−tM<br />
α =<br />
(1)<br />
tA<br />
−tM<br />
where, t A and t B are the retention times for<br />
species A and B, and t M is the retention time of<br />
a species that is not retained by the stationary<br />
phase. If t M is replaced in IMS by t R, the drift<br />
time of the reactant ions peak (RIP), then the<br />
selectivity factor will be;<br />
tB<br />
−tR<br />
α =<br />
(2)<br />
tA<br />
−tR<br />
The drift times of the main product ions, usually<br />
referred to the monomer and dimer protonated<br />
molecules, in helium and nitrogen are displayed<br />
in Table1. The selectivity factors are calculated<br />
using a reactant ion drift time of 1.95 ms and<br />
10.70 ms in helium and nitrogen respectively.<br />
As Table 1 shows, apart from DMSO, the<br />
selectivity factors for each compound in helium<br />
and nitrogen are almost the same.<br />
The resolution<br />
The generally accepted resolving power for IMS<br />
is based on a single-peak [8], which is defined<br />
by R = t d /w 1/2 , where t d is the ion drift time and<br />
w 1/2 is the ion pulse duration at the detector<br />
measured at half maximal intensity. Because<br />
the drift time of the reactant ions in helium is<br />
typically 1/5 of that in nitrogen, an injection<br />
pulse of 30 µs was selected for helium as<br />
compared to 150 µs for nitrogen, for a<br />
reasonable comparison of resolving power.<br />
Generally, the resolving power for spectra in<br />
helium is slightly less than that in nitrogen<br />
mainly due to the shorter drift times. However<br />
for slower moving ions the resolving power<br />
increases.<br />
The resolution can also be defined on the basis<br />
of separation of pairs of adjacent peaks, as<br />
follows [7]:<br />
tB−t<br />
A<br />
RS<br />
=<br />
wA<br />
+ wB<br />
(3)<br />
where, t A and t B are the drift times of the two<br />
peaks, and w A and<br />
R w B are their<br />
s = 2(t B−t a )<br />
w a −w b b respective widths.<br />
A high improvement in resolution (R S) is<br />
observed when helium is used. In order to<br />
compare the resolution, spectra were<br />
normalized by dividing them by t R, the reactant<br />
ion drift time. The normalized spectra of methyl<br />
iso-butyl ketone in helium and nitrogen are<br />
demonstrated in Figure 2. Apart from the peak<br />
widths, which are approximately the same, the<br />
separation in helium is about twice, resulting in<br />
a better resolution. The two-fold increase in<br />
peak separations was observed for all spectra.<br />
The IMS spectra of acetophenone and n-butyl<br />
acetate are presented in Figure 3. The<br />
separation between the first product ion peaks<br />
is increased in helium and the second product<br />
peaks are completely resolved where as in<br />
nitrogen they are strongly overlapped. Similar<br />
behavior is observed for DMMP and methyl<br />
iso-butyl ketone.<br />
The capacity factor<br />
The capacity factor, is an important<br />
experimental parameter in chromatography [7].<br />
It is defined as, k' = (t/t M)-1, where t M is the<br />
retention time of a species that is not retained<br />
by the stationary phase. If again, t M is replaced<br />
in IMS by t R, the drift time of the reactant ion<br />
peak (RIP), then the capacity factor will be k' =<br />
(t/t R)-1. A two-fold increase in the capacity<br />
factor for all product ions was observed by<br />
switching from nitrogen to helium. This is<br />
demonstrated in Table 2 where capacity factors<br />
are calculated and compared for all spectra.<br />
The increase in the capacity factor of the<br />
product ions of each sample is generally the<br />
same. Therefore, for the selected compounds,<br />
the IMS spectra in helium and nitrogen match<br />
together if they are plotted versus the capacity<br />
factors and the nitrogen spectrum is multiplied<br />
by a factor of about 2.<br />
CONCLUSIONS<br />
It is generally believed that there is no<br />
fundamental advantage in terms of resolving<br />
power for the different drift gases [3]. However,<br />
the resolution depends not only on the<br />
resolving power but also on the capacity factor,<br />
(8)<br />
Copyright © 2000 by International Society for Ion Mobility Spectrometry
M. Tabrizchi and T. Khayamian: „Ion mobility Spectrometry...”, IJIMS 4(2001)1, 52-56, p. 54<br />
Table 1: Drift Times and Selectivity Factors in Helium and Nitrogen<br />
Sample<br />
Acetophenone<br />
n-Butyl acetate<br />
Ethyl acetate<br />
Methyl methacrylate<br />
t A (ms) a<br />
2.670<br />
2.836<br />
2.351<br />
2.437<br />
In Helium<br />
t B (ms) a<br />
4.110<br />
4.358<br />
3.424<br />
3.529<br />
Selectivity<br />
Factor b (α)<br />
3.00<br />
2.72<br />
3.67<br />
3.24<br />
t A (ms) a<br />
12.70<br />
13.15<br />
11.65<br />
11.95<br />
In Nitrogen<br />
t B (ms) a Selectivity<br />
Factor b (α)<br />
16.60 2.95<br />
17.00 2.57<br />
14.06 3.55<br />
14.60 3.12<br />
DMSO<br />
DMMP<br />
Acetone<br />
Methyl iso-butyl<br />
ketone<br />
2.054<br />
2.475<br />
2.110<br />
2.605<br />
2.946<br />
3.647<br />
2.490<br />
3.885<br />
9.59<br />
3.23<br />
3.37<br />
2.95<br />
11.05<br />
12.00<br />
11.24<br />
12.49<br />
13.00<br />
14.89<br />
12.20<br />
15.51<br />
6.57<br />
3.22<br />
2.77<br />
2.68<br />
a. A and B are the first and the second product ions respectively.<br />
b. Calculated using Equation 2 with a drift time of 1.95 ms and 10.7 ms for the reactant ion (t R) in helium<br />
and nitrogen respectively.<br />
Table 2. Capacity factors (k') for the first (A) and the second (B) product ions of the selected compounds<br />
Sample<br />
k’ A in N 2<br />
k’ A in He<br />
k’ B in N 2<br />
k’ B in He<br />
k’ A in He<br />
k’ A in N 2<br />
k’ B in He<br />
k’ B in N 2<br />
Acetophenone<br />
n-Butyl acetate<br />
Ethyl acetate<br />
Methyl methacrylate<br />
DMSO<br />
DMMP<br />
Acetone<br />
Methyl iso-butyl<br />
ketone<br />
0.187<br />
0.229<br />
0.088<br />
0.117<br />
0.033<br />
0.122<br />
0.051<br />
0.167<br />
0.369<br />
0.454<br />
0.206<br />
0.250<br />
0.053<br />
0.269<br />
0.084<br />
0.336<br />
0.551<br />
0.589<br />
0.314<br />
0.364<br />
0.215<br />
0.391<br />
0.140<br />
0.449<br />
1.108<br />
1.235<br />
0.756<br />
0.810<br />
0.511<br />
0.870<br />
0.281<br />
0.992<br />
1.9<br />
1.9<br />
2.3<br />
2.1<br />
1.6<br />
2.2<br />
1.65<br />
2.0<br />
2.0<br />
2.1<br />
2.4<br />
2.2<br />
2.3<br />
2.2<br />
2.0<br />
2.2<br />
k'. This work shows that, using helium as the<br />
drift gas instead of nitrogen or air in IMS<br />
increases the capacity factor and consequently<br />
improves the resolution.<br />
ACKNOWLEDGMENT<br />
The authors would like to thank Dr. M. K. Amini<br />
and Professor M. Amirnasr for valuable<br />
discussion and their help in this work. Isfahan<br />
University of Technology and the National<br />
Researches Council of Iran supported this<br />
work.<br />
REFERENCES<br />
[1] G. A. Eiceman, Ion Mobility Spectrometry, Boca<br />
Raton, CRC Press, (1993).<br />
[2] W. F. Siems, C. Wu, E. E. Tarver, H.H. Jr. Hill, P. R.<br />
Larsen, D. G. McMinn, Anal.Chem., 66 (1994) 4195.<br />
[3] G.R.Asbury and H. H. Jr. Hill, Anal. Chem., 72 (2000)<br />
580.<br />
[4] M. Tabrizchi, T. Khayamian, and N.Taj, Rev. Sci.<br />
Inst., l 71 (2000), 2321.<br />
[5] M. Tabrizchi, T. Khayamian and N. Taj, "Corona<br />
Discharge Ion Mobility Spectrometry" The 8th<br />
International Conference on Ion Mobility<br />
Spectrometry, Buxton,UK August 8-12, (1999).<br />
[6] D.R. Kojiro, M.J. Cohen, R.M. Stimac, R.F. Wernlund,<br />
D.E. Humphry, N. Takeuchi, Anal. Chem., 63, (1991),<br />
2295.<br />
[7] D. A. Skoog, D. M. West and F. J. Holler, Analytical<br />
Chemistry, Philadelphia, Saunders Golden Sunburst<br />
Series, 1994.<br />
[8] C. Wu, W. F. Siems, G. R. Asbury, H.H. Jr. Hill, Anal.<br />
Chem., 70 (1998) 4929.<br />
Copyright © 2000 by International Society for Ion Mobility Spectrometry
M. Tabrizchi and T. Khayamian: „Ion mobility Spectrometry...”, IJIMS 4(2001)1, 52-56, p. 55<br />
DMMP<br />
in He<br />
in N 2<br />
Acetone<br />
0 5 10 15 20<br />
Drift Time (ms)<br />
Figure 1. Selected ion mobility spectra in helium and nitrogen.<br />
RIP<br />
A<br />
in N 2<br />
DMMP in He<br />
B<br />
RIP<br />
A<br />
DMMP in He<br />
B<br />
DMMP in N 2<br />
0.5 1.0 1.5 2.0<br />
Relative Drift Time (t / t R )<br />
Figure 2. The detectore responce versus the relative drift time (t/t R )<br />
for methyl-iso-buthyl ketone. The t R is the reactant ion drift time.<br />
Copyright © 2000 by International Society for Ion Mobility Spectrometry
M. Tabrizchi and T. Khayamian: „Ion mobility Spectrometry...”, IJIMS 4(2001)1, 52-56, p. 56<br />
RIP<br />
In Helium<br />
a<br />
b<br />
0 1 2 3 4 5 6 7<br />
RIP<br />
In Nitrogen<br />
a<br />
b<br />
0 5 10 15 20 25<br />
Drift Time (msec)<br />
Figure 3. IMS spectra of a) acetophenone and b) n-buthyl acetate,<br />
recrded in helium (top spectra) and in nitrogen (bottom) spectra.<br />
Copyright © 2000 by International Society for Ion Mobility Spectrometry
External exit gate Fourier transform ion mobility spectrometry<br />
Ed Tarver*, James F. Stamps, Richard T. Jennings, William F. Siems<br />
Sandia National Laboratories, Livermore, California 94551-0969, USA<br />
Ion mobility spectrometry (IMS) has been<br />
recognized as one of the most sensitive and<br />
robust techniques for the detection of<br />
explosives, narcotics and chemical warfare<br />
agents. The extreme sensitivity and electronic<br />
simplicity of IMS instrumentation has offered<br />
tremendous theoretical potential for this<br />
analytical technique. While the detection limits<br />
achievable with IMS are rivaled by relatively few<br />
alternative methods (e.g., mass spectrometry,<br />
biochemical detection, and flame photometric<br />
or other chemically specific detectors interfaced<br />
to gas chromatographs), none can match the<br />
combination of sensitivity and speed of<br />
response. Coupled with low cost, ruggedness<br />
and atmospheric pressure operation, IMS has<br />
promised to be the solution for a variety of<br />
analytical challenges. We have recently<br />
demonstrated improved spectral resolution as<br />
well as significant signal-to-noise enhancement<br />
by implementing the external exit gate Fourier<br />
transform technique on both commercial and<br />
Sandia National Laboratory proprietary IMS<br />
instruments.<br />
The problem in IMS has always been resolution<br />
of the complex mobility spectra resulting from<br />
the inherent sensitivity of the method. The<br />
broad, tailing and sometimes overlapping<br />
peaks of the spectra have necessitated the<br />
development of complex peak de-convolution<br />
and recognition algorithms or the introduction of<br />
pre-separation methods, which lead to loss of<br />
sensitivity and increased analysis time. The<br />
challenge in IMS is to maintain the chemical<br />
sensitivity and response time while increasing<br />
the spectral resolution to aid in accurate<br />
identification of target analytes. In common<br />
IMS instruments, spectra are generated by<br />
pulsing open the entrance to the drift region for<br />
0.2 ms and then monitoring the ion current after<br />
a 20 ms drift time period. This brief entrance<br />
pulse represents only 1% of the 20 ms duty<br />
cycle. A longer ”gate” pulse would allow more<br />
ions to be collected and increase the signal, but<br />
short entrance pulse duration is necessary to<br />
prevent unacceptable peak broadening and<br />
decreased resolution. The poor resolution<br />
typical of conventional IMS instruments is the<br />
result of this trade-off for increased sensitivity.<br />
Even so, acceptable signal-to-noise (S/N) is<br />
achieved by repeating and storing many scans<br />
and then summing the signals with a computer.<br />
Signal averaging IMS has limited ability to<br />
resolve adjacent peaks in a complex spectrum,<br />
which is critical to unambiguous sample<br />
identification and elimination of false positives.<br />
An alternative to the signal-averaging<br />
methodology is Fourier transform ion mobility<br />
spectrometry (FT-IMS). In this mode of<br />
operation two ion gates are employed, an<br />
entrance gate and an external exit gate. The<br />
entrance gate admits ions into the drift region<br />
of the spectrometer in a manner similar to<br />
signal-averaging IMS with the distinction being<br />
the 50% duty cycle of the gates in FT-IMS. The<br />
downstream exit gate is pulsed synchronously<br />
with the entrance gate at increasing frequency<br />
to interact with the flowing ion stream and<br />
generate a frequency domain interferogram.<br />
This interferogram which contains velocity<br />
information about all of the ions in the spectrum<br />
is then fast Fourier transformed to recover the<br />
complete time domain mobility spectrum. We<br />
have demonstrated the increased S/N resulting<br />
from the 50% duty cycle of the gates (S/N<br />
increases as v50). Also, ion-molecule reactions<br />
and labile clustering during ion transit through<br />
the drift tube results in peak broadening due to<br />
Copyright © 2000 by International Society for Ion Mobility Spectrometry
E. Tarver: „External exit gate Fourier transform...”, IJIMS 3(2000)1, 57-59, p. 58<br />
random variations in ion velocities. We have<br />
demonstrated the phasing action of the gates in<br />
FT-IMS eliminates this noise signal and greatly<br />
improves spectral resolution.<br />
Signal Averaged Ion Mobility Spectrometry<br />
Ion mobility spectrometry (IMS) is an important<br />
trace analytical method used for the vapor<br />
phase detection of drugs, explosives, chemical<br />
warfare agents, and hazardous workplace<br />
pollutants. The low cost and relative simplicity<br />
of the electronics as well as atmospheric<br />
pressure operation have allowed this<br />
instrument to be miniaturized for use in the field<br />
by the military as sensor/alarm for chemical<br />
warfare agents. Because IMS responds to<br />
numerous organic functionalities, the resulting<br />
spectra are complicated and often poorly<br />
resolved when complex sample matrices are<br />
introduced into the spectrometer. These<br />
spectra may be simplified by modification of the<br />
reagent ion chemistry (similar to chemical<br />
ionization mass spectrometry), selective ion<br />
gating, or chromatographic separation prior to<br />
introduction into the detector. To better identify<br />
target compounds from mobility spectra,<br />
improvements in resolution and signal-to-noise<br />
ratio are critical. In typical IMS instruments,<br />
where the entrance gate is open for ion<br />
collection for 1% of the analytical cycle, the<br />
short entrance pulse duration is necessary to<br />
prevent unacceptable peak broadening and<br />
decreased resolution. (1) Acceptable S/N ratio is<br />
achieved by repeating many scans and<br />
averaging with a computer. In addition,<br />
significant contributions to peak broadening<br />
result from random ion-molecule reactions and<br />
labile cluster formation occurring during ion<br />
transit through the drift tube. When events such<br />
as these occur in the drift region on the time<br />
scale of the separation, peak broadening is<br />
observed in the signal averaged spectra due to<br />
the summation of the variations in ion<br />
velocities. This dynamic peak broadening is<br />
recorded in the signal-averaged spectrum and<br />
serves to compound diffusional broadening and<br />
further degrade the peak resolution. Figure 1<br />
shows the signal-averaged trace produced from<br />
the unmodified Barringer IonScan 400 by the<br />
major background reactant ion peak at 8.5 ms<br />
and the calibrant peak at 11.3 ms.<br />
Fourier Transform Ion Mobility<br />
Spectrometry<br />
An alternative method of signal acquisition<br />
used in IMS involves the Fourier transformation<br />
of a mobility interferogram generated when the<br />
entrance and exit gates of a two gate IMS are<br />
simultaneously opened and closed by a<br />
frequency sweeping generator. (2) The entrance<br />
gate creates a continuous stream of ion pulses,<br />
which drift down the tube with their<br />
characteristic drift time, t d. As the square wave<br />
frequency is varied, ions of different drift time<br />
pass in and out of phase with the exit gate<br />
generating a mobility interferogram. With this<br />
Fourier Transform IMS (FT-IMS) technique the<br />
hardware gates inside the drift tube are pulsed<br />
opened (50% of the time) and closed (50% of<br />
the time) at increasing frequency over the total<br />
duty cycle. This allows half of the initial ion<br />
population approaching the first gate to be<br />
admitted into the drift tube and of this ion<br />
population half passes through the second gate<br />
used to generate the interferogram. This<br />
interferogram is Fourier transformed to recover<br />
the complete time dispersive mobility spectrum.<br />
As a result a 25% duty cycle is achieved and<br />
the S/N is improved. By the removing second<br />
hardware gate and performing its function,<br />
outside of the drift tube, in the electronics, the<br />
ion loss at the second hardware gate is<br />
eliminated. Utilizing this ”external second gate”<br />
technique we have developed a rapid scanning<br />
FT-IMS system capable of achieving a 50%<br />
duty cycle. We have also demonstrated the<br />
phasing action of the dual FT-IMS gates<br />
eliminates the peak broadening caused by<br />
random variation in ion velocities and greatly<br />
improves spectral resolution. In order for an ion<br />
to contribute to the maximum measured signal<br />
it must maintain a constant velocity to be in<br />
phase with a corresponding gate opening<br />
frequency. If the ion randomly changes velocity<br />
it loses the necessary phase correspondence<br />
with the gates and does not contribute to the<br />
measured signal.<br />
The electronic and software modifications we<br />
have developed enable us to adapt common<br />
single gate instruments to this external second<br />
gate FT-IMS method. A working bench-top<br />
prototype has been constructed and the<br />
performance demonstrated. No major<br />
alterations or fabrication of new hardware was<br />
required to adapt the instrument (Barringer<br />
Instruments IonScan 400) to achieve external<br />
Copyright © 2000 by International Society for Ion Mobility Spectrometry
E. Tarver: „External exit gate Fourier transform...”, IJIMS 3(2000)1, 57-59, p. 59<br />
Figure 1:<br />
Typical IMS spectrum of reactant ion peak (8.5 ms)<br />
and calibrant peak (11.3 ms) produced from<br />
Barringer Ionscan 400 operating in normal mode<br />
(multiple scans, signal averaged). The peak tailing<br />
is due to variations in ion velocity (mobilities)from<br />
scan to scan caused by ion-molecule reactions.<br />
The contributions from each individual scan are<br />
recorded in the final signal averaged spectrum.<br />
Figure 2:<br />
FT-IMS spectrum of Reactant Ion Peak (8.5 ms)<br />
and Calibrant Peak (11.3 ms) produced from a<br />
Barringer Ionscan 400 modified for FT-IMS<br />
operation. The S/N is is improved because the<br />
gates are operating at 50% duty cycle allowing<br />
more ions to be collected in FT mode. The peak<br />
tailing, caused by variations in ion velocity, is<br />
eliminated due to the phasing action of the gates<br />
which require constant ion velocity to produce a<br />
signal.<br />
All other instrument conditions identical to normal<br />
(signal-averaging) mode.<br />
second gate FT-IMS. While the ease of<br />
adaptability of the commercial IMS was<br />
demonstrated, the limitations of the<br />
(signal-averaging) instrument design did not<br />
allow us to demonstrate the optimal theoretical<br />
performance expected from external second<br />
gate FT-IMS (e.g. theoretical increase in S/N =<br />
√50 = 7).Operating the same Barringer IonScan<br />
400 under identical experimental conditions<br />
following the Fourier transform modifications<br />
we produced the trace shown in Figure 2. The<br />
significant gain in signal-to-noise is the result of<br />
the increased ion transmission efficiency<br />
produced by the 50% duty cycle of the FT-IMS<br />
gate system. Also apparent is the dramatic<br />
improvement in spectral resolution resulting<br />
form the phasing action of the ion gates using<br />
the external second gate Fourier transform<br />
method.<br />
References<br />
[1] Siems, W.F.; Ching Wu; Tarver, E.E.; Hill, H.H.; Anal<br />
Chem (1994) 4195-4201<br />
[2] Knorr, F.J.; Eatherton, R.L.; Siems, W.F.; Hill, H.H.;<br />
Anal Chem (1985) 57, 402-406<br />
Copyright © 2000 by International Society for Ion Mobility Spectrometry
Miniaturized ion mobility spectrometer<br />
M. Teepe 1 , J.I. Baumbach 2 , A. Neyer 1 , H. Schmidt 2 , P. Pilzecker 3<br />
1<br />
University of Dortmund - Dep. Micro-Structure-Technologies, Otto-Hahn-Str. 6, D-44227 Dortmund, Germany<br />
2<br />
Institut für Spektrochemie und Angewandte Spektroskopie (ISAS), Bunsen-Kirchhoff-Str. 11, D-44139 Dortmund,<br />
Germany<br />
3<br />
G.A.S. Gesellschaft für analytische Sensorsysteme mbH, TechnologieZentrumDortmund, Emil-Figge-Str. 76-80,<br />
D-44227 Dortmund, Germany<br />
Introduction<br />
Miniaturization of an ion mobility spectrometer<br />
(IMS) can lead to a handy low cost on-line and<br />
on-site environmental scanning system for<br />
exhausts in chemical, waste and petrochemical<br />
industries.<br />
Ion mobility spectrometry [1] has changed from<br />
a not common known method in the late sixties<br />
[2,3] to a practical method for the detection of<br />
toxic pollutants [3] and explosives [4, 5] and<br />
some other analytes [1] in the atmosphere at<br />
ambient pressure and temperature down to the<br />
ppb V (parts per billion) concentration range.<br />
The size of a common high resolution IMS (in<br />
the range of normal Personal Computers)<br />
makes it useful in process control for industry<br />
[6] and in centralised measurement systems<br />
like gateways at airports. But ion mobility<br />
spectrometry is a more powerful detection<br />
method than it is now used for. Many other<br />
applications are proposed in the scientific<br />
literature [7]. In the growing semiconductor<br />
industries, especially for Reactive Ion Etching<br />
an on-line gas control can lead to a more<br />
reliable process. New fields of application are<br />
possible like ‘intelligent’ on-line control for air<br />
conditions in cars and other vehicles. For these<br />
applications it is useful to have a small, fast,<br />
economical and powerful analytical on-site and<br />
on-line system. A miniaturized IMS with size of<br />
today’s common mobile phones will meet such<br />
needs. A prototype µ-IMS - ten times smaller<br />
than conventional ones - with components<br />
produced by micro-structure-technologies is<br />
presented in this paper. Successful results<br />
using this spectrometer are reported. Finally an<br />
outlook to a modular system design with<br />
respect to mass production is shown.<br />
Concept<br />
Portability is one of the main aspects for<br />
miniaturization of an IMS. It leads to an on-site,<br />
on-line and real-time monitoring system for<br />
volatile organic compounds, regardless of the<br />
origins of these compounds. A size not bigger<br />
than a normal cellular phone should be<br />
reachable with the results of this work. Using a<br />
short - in optimum infinitesimal - gate opening<br />
time a diffusion controlled domain in ion<br />
transport can be reached [8] which then will<br />
lead to a resolution of the IMS independent<br />
from gate opening time. The problem in this<br />
case is to have decreasing amounts of ions to<br />
amplify and the need for direct amplification<br />
nearby the Faraday plate. The connection<br />
between the Faraday plate and the<br />
pre-amplifier should be as short as<br />
implemental. A ”single chip” solution should<br />
lead to the best results in ion mobility<br />
spectrometry. As a result of miniaturization the<br />
costs for the measurement system will be<br />
reduced dramatically because of mass<br />
production techniques and a decreased use of<br />
resources.<br />
A first prototype for the proof of a possible<br />
miniaturization has been designed without<br />
decreasing the size of the supporting electronic<br />
except the amplifier to obtain a direct<br />
amplification. In respect to a flexible drift length<br />
modification and field shaping a<br />
sandwich-design has been chosen. Figure 1<br />
shows an example of a working miniaturized<br />
drift tube in comparison to a conventional one.<br />
In miniaturization imprecise alignment of the<br />
free space electrodes of the ion gate leads to<br />
high electric field forces and results in<br />
deformation of the grid. In worst case a short<br />
circuit is the consequence. Thus a stiff<br />
conducting material has to be selected for the<br />
Copyright © 2000 by International Society for Ion Mobility Spectrometry
M. Teepe et al.: „Miniaturized ion mobility spectrometer”, IJIMS 4(2001)1, 60-64, p. 61<br />
Figure 1:<br />
Conventional drift tube and drift tube<br />
used in a µ-IMS<br />
Figure 2:<br />
Conventional ion gate and a<br />
laser-structured component<br />
ion gate. A highly precise microstructuring of<br />
such a material is possible by etching,<br />
micro-milling,<br />
micro-electro-discharge-machining (micro-edm)<br />
or laser-ablation. Micro-milling and micro-edm<br />
are no real batch processes and therefore not<br />
cheap enough for mass fabrication. Etching<br />
always comes along with masking techniques<br />
which usually are (expensive) photolithography<br />
processes or equivalent procedures.<br />
Laser-ablation and laser cutting are well known<br />
techniques for micro-structure-technologies and<br />
are available at low costs considering the sizes<br />
and the number of units needed here. In Figure<br />
2 a conventional ion gate is compared to a<br />
laser-structured component. Further progress<br />
has been made for the stability of the prototype.<br />
Figure 3 shows a complete set-up of a working<br />
device with the electronic for the ion gate, the<br />
drift tube with the Faraday plate, the ion gate<br />
Figure 3: µ-IMS-Prototype<br />
and the connectors. The coin in the front has a<br />
diameter of 15 millimeters.<br />
The total length of this device is less than 6 cm.<br />
The total ion drift length in this unit is 3.6 cm,<br />
the inner diameter is 3 mm. A 63 Ni-ß-radiation<br />
source is modularly implemented in order to<br />
enable a quick change of two different sources<br />
with 400 kBq and 16 MBq. The laser-structured<br />
Bradbury-Nielsen ion gate (Fig. 2) is also built<br />
in. As mentioned before in this phase of the<br />
project the supporting unts like high voltage<br />
supply and flow controllers have not been<br />
minimized.<br />
The shown arrangement (Fig. 3) is meant to<br />
compare characteristics of a conventional IMS<br />
with the miniaturized prototype and therefore<br />
was built compatible to existing big supporting<br />
units.<br />
Experimental Results<br />
Successful results obtained with the described<br />
prototype are shown in Fig. 4 - 5. The graphic<br />
in Fig. 4 shows the Reactant Ion Peak in<br />
nitrogen at different ion gate times down to<br />
100 µs. The applied drift voltage is in the range<br />
of 2 kV. As expected from a conventional<br />
device the intensity of the ion signal of the<br />
µ-IMS decreases with decreasing opening time<br />
of the ion gate. Even in the 100 µs range an<br />
adequate signal to noise ratio is obtained.<br />
Therefore the opportunity to reach the diffusion<br />
controlled drift domain mentioned before should<br />
be achievable.<br />
The resolution (drift time / full width at half<br />
maximum) is approximately 5 at 1 ms up to 16<br />
at 300 µs. In Fig. 5a a spectrum of acetone in<br />
Copyright © 2000 by International Society for Ion Mobility Spectrometry
M. Teepe et al.: „Miniaturized ion mobility spectrometer”, IJIMS 4(2001)1, 60-64, p. 62<br />
Signal / a.u.<br />
-0.30 µ-IMS<br />
-0.25<br />
-0.20<br />
-0.15<br />
-0.10<br />
-0.05<br />
0.00<br />
5 10 15 20<br />
Drift Time / ms<br />
Ion Gate Time / µs<br />
100<br />
300<br />
1000<br />
Figure 4: Reactant ion peak in nitrogen<br />
nitrogen is shown. The applied gas flow for the<br />
analyte gas inlet was 5 ml/min. The<br />
concentration level of this measurement is in<br />
the range of 1 ppm v. The respective resolution<br />
is discernable to 20.<br />
In Fig. 5b and 5c the spectra with higher ion<br />
gate times of 300 µs and 1 ms are added. As<br />
one would expect a higher intensity of the ion<br />
signal is reached according to increasing ion<br />
gate time. In order to allow a better comparison<br />
of the spectra values are normalized to the<br />
maximum signal of 1 ms. Though every<br />
measurement is shutter time corrected a<br />
Gaussian curve analysis shows a slight<br />
difference between the peak positions of<br />
0.2 ms (Fig. 5b). Considerable are two possible<br />
reasons for this effect: a changing ambit and<br />
the ion gate.<br />
No pressure correction was performed in these<br />
measurements and in this phase of the<br />
development the µ-IMS is not stabilized in<br />
temperature so that the ambient temperature<br />
Signal / a.u.<br />
0.0104<br />
0.0078<br />
0.0052<br />
0.0026<br />
0.0000<br />
µ-IMS<br />
5 6 7 8 9 10<br />
Driftzeit / ms<br />
Ion Gate Time / µs<br />
300<br />
100<br />
Figure 5b:<br />
Gaussian curve analysis of the peak<br />
shape<br />
Gate Time Corrected<br />
and pressure may have changed on different<br />
days of measurements.<br />
Furthermore the Bradbury-Nielsen shutter and<br />
its electronics have been optimised for a 100 µs<br />
pulse width so that the results with other<br />
opening times may differ. It can be seen clearly<br />
that the Gaussian curve analysis shows an<br />
expected regular peak shape at 100 µs ion<br />
gate time but not in the case of the peak with<br />
the 300 µs (Fig. 5b). These results show the<br />
importance for further studies on ion gate<br />
design in miniaturization.<br />
The resulting resolution of the ion mobility<br />
spectrum obtained using a gate time of 1 ms<br />
(Fig. 5c) is insufficient for successful measurements<br />
and a complete characterisation of the<br />
compounds to be detected.<br />
Modular System Design<br />
The next step in this miniaturization project is<br />
asystem design illustrated in Fig. 6. It shows a<br />
5,00<br />
-0,025<br />
3,75<br />
-0,020<br />
Acetone<br />
Signal / a.u.<br />
2,50<br />
1,25<br />
Acetone<br />
Signal / a.u.<br />
-0,015<br />
-0,010<br />
Ion Gate Time / µs<br />
1000<br />
300<br />
100<br />
-0,005<br />
0,00<br />
0,000<br />
5,0 5,5 6,0 6,5 7,0 7,5 8,0 8,5 9,0 9,5<br />
Drift Time / ms<br />
5,0 7,5 10,0 12,5 15,0<br />
Drift Time / ms<br />
Figure 5a:<br />
Ion mobility spectrum of acetone<br />
in nitrogen at 100 µs ion gate time<br />
Figure 5c:<br />
Ion mobility spectra of acetone in<br />
nitrogen at different ion gate times<br />
Copyright © 2000 by International Society for Ion Mobility Spectrometry
M. Teepe et al.: „Miniaturized ion mobility spectrometer”, IJIMS 4(2001)1, 60-64, p. 63<br />
Signal / a.u.<br />
0,4<br />
0,3<br />
0,2<br />
0,1<br />
0,0<br />
-0,1<br />
Figure 6:<br />
A modular system design<br />
Figure 7:<br />
Prototypes of molecular design<br />
4 5 6 7<br />
Drift Time / ms<br />
Trichloroethene<br />
Tetrachloroethene<br />
Perfluorohexane<br />
Figure 8:<br />
Gaussian curve analysis of<br />
ion mobility spectra from different volatile<br />
organic compounds (negative ions)<br />
modular arrangement for a Micro-IMS (µ-IMS)<br />
with respect to mass fabrication, optimized field<br />
shaping and a higher signal to noise ratio. The<br />
three different groups building the functional<br />
parts of a onventional IMS are still maintained<br />
i.e. the ionisation chamber, the drift tube and<br />
the Faraday plate. This concept has certain<br />
advances considering the miniaturized IMS<br />
prototype: first of all the whole concept is<br />
worked out taking mass fabrication into<br />
account. The different electrical components<br />
are compatible to printed circuit board<br />
technology which is a commonly known and<br />
very low cost fabrication technique. The<br />
micro-structured grids can be changed quickly<br />
which leads to a flexible design modification for<br />
optimisation of ion gate design. The new drift<br />
tube design is one solid and therefore stable<br />
component. Standard fittings for gas inlets are<br />
implemented. Modular ionisation sources for<br />
63<br />
Ni, UV-ionisation and partial discharges have<br />
been taken into consideration and are partly<br />
realised today.<br />
The Fig. 7 shows the final arrangement of this<br />
concept with a size comparison.<br />
First results from this spectrometer are given in<br />
Fig. 8. Spectra of trichloroethene, tetrachloroethene,<br />
perfluorohexane are presented to<br />
show the feasibility of such a device. The<br />
applied settings for this measurement are<br />
summarized in Fig. 9. A Gaussian curve<br />
analysis show characteristic differences<br />
between fluorinated and chlorinated<br />
compounds. As expected from conventional<br />
IMS both two chlorinated substances show<br />
comparable ions assuming three Gauss curves<br />
beneath.<br />
Summary and Outlook<br />
The results mentioned above prove a<br />
successful miniaturization of an IMS. A<br />
demonstrator has been built and successful<br />
results obtained by this demonstrator show an<br />
adequate performance. Further developments<br />
have to be made on ion gate design and in field<br />
shaping for higher resolutions. Tests with<br />
ionisation sources different to the 63 Ni source<br />
like UV-light and partial discharges are taken<br />
into consideration for further developments.<br />
With miniaturized electronics and high voltage<br />
supplies this demonstrator leads to a working<br />
device in the size of a common cellular phone.<br />
Copyright © 2000 by International Society for Ion Mobility Spectrometry
M. Teepe et al.: „Miniaturized ion mobility spectrometer”, IJIMS 4(2001)1, 60-64, p. 64<br />
Acknowledgments<br />
The financial support of the Bundesministerium<br />
für Bildung, Wissenschaft, Forschung und<br />
Technologie and the Ministerium für<br />
Wissenschaft und Forschung des Landes<br />
Nordrhein-Westfalen is gratefully acknowledged.<br />
References<br />
[1] J.I. Baumbach.; G.A. Eiceman,.: Ion mobility<br />
spectrometry: Arriving on-site and moving beyond a<br />
low profile. - Applied Spectroscopy 53(1999)9,<br />
338A-355A<br />
[2] M.J. Cohen, F.W. Karasek: Plasma chromatography -<br />
a new dimension for gas chromatography and mass<br />
spectrometry, J. Chromatogr. Sci.8, 330-337, 1970.<br />
[3] G.A. Eiceman, Z. Karpas: Ion Mobility Spectrometry,<br />
CRC Press Inc., Boca Raton - Ann Arbor - London -<br />
Tokyo, 1994.<br />
[4] F.W. Karasek, D.W. Denney: Detection of<br />
2,4,6-trinitrotoluene vapours in air using plasma<br />
chromatography, J. Chromatogr. 93, 141-147, 1974.<br />
[5] M.J. Cohen, R.F. Wernlund, R.M. Stimac: The ion<br />
mobility spectrometer for high explosive vapor<br />
detection, Nucl. Mater. Manage. XIII, 220-240, 1984.<br />
[6] W.J. Holzapfel, K.J. Budde: Ultratrace analysis for<br />
volatile organic compounds in semiconductor<br />
industry, Fresenius J. Anal. Chem. 343, 769770,<br />
1992.<br />
[7] T. Kotiaho, F.R. Lauritsen, H. Degn, H. Paakkanen:<br />
Membran inlet ion mobility spectrometry for on-line<br />
measurements of ethanol in beer and in yeast<br />
fermentation, Anal. Chim. Acta 309, 317-325, 1995.<br />
[8] J.I. Baumbach, D. Klockow,: Diffusion controlled<br />
transport of ion swarms in gases and its relevance for<br />
the resolution of ion mobility spectrometers,<br />
Proceedings of XXI International Conference on<br />
Phenomena in Ionized Gases, Bochum,<br />
19.-24.9.1993<br />
Copyright © 2000 by International Society for Ion Mobility Spectrometry
Evolution of IMS technology within the Australian Customs Service<br />
G. Webster<br />
INTRODUCTION:<br />
Customs has been using IMS technology since<br />
1997, in the form of the Barringer Ionscan,<br />
when an air cargo examination team at Sydney<br />
International Airport commenced an operational<br />
evaluation of the equipment. The location of<br />
this one unit and the specially selected officers<br />
to manage it have proven critical to the overall<br />
success of the technology. Without the<br />
initiative of these officers we may not have had<br />
the first taste of success that ultimately led to<br />
the introduction of further units. This initial<br />
success involved the seizure of 330 grams of<br />
cocaine concealed in the frame of a mountain<br />
bike. The presence of the cocaine “alarm”<br />
confirmed suspicions regarding the bike, which<br />
led to discovery of the illicit drug.<br />
IMS TECHNOLOLGY INTRODUCED<br />
The success of the trial paved the way for the<br />
introduction of the first 20 Ionscan units<br />
purchased by Australian Customs. Eighteen<br />
months later a further 21 units were deployed<br />
and in May this year our total number of<br />
Ionscans rose to 51. These are deployed in all<br />
Australian seaports and airports, from Hobart,<br />
Tasmania in the far south to Darwin in the<br />
tropical north to some of our more remote<br />
localities. These Ionscans form part of the<br />
arsenal of drug detection tools used by<br />
Customs. These include drug detector dogs,<br />
X-ray systems and Closed Circuit TV.<br />
EDUCATION OF IONSCAN USERS<br />
One of the greatest challenges following the<br />
introduction of the Ionscan was to get our<br />
officers to use it proactively. Internal marketing<br />
and training has ensured the best use of these<br />
resources. Late last year saw the development<br />
of a national training program for Ionscan<br />
users. We found that the training program<br />
resulted in the units being better maintained,<br />
with better results. The following program was<br />
implemented in March this year:<br />
v A fully trained Competency Assessment<br />
Training Officer, or “CATO”, oversees the<br />
National Ionscan Training Program in each<br />
region. These officers are qualified to<br />
deliver training in their area;<br />
v The program caters for two levels of<br />
operator. The Basic Level Operator course<br />
is a one-day course designed for those<br />
officers who use the Ionscan as part of their<br />
everyday duties. The Advanced Level<br />
Operator course is another day long course<br />
and is for those officers who are required to<br />
conduct more complex operations and<br />
routine Ionscan maintenance;<br />
v The training program has ensured national<br />
consistency in the use of the Ionscan and a<br />
strong network of users and information<br />
sharing has been established.<br />
The message in education of users is that<br />
whilst IMS technology, in the form of the<br />
Ionscan, is not difficult to use, interpretation of<br />
results is the key to more effective utilisation.<br />
THE EVOLUTIONARY PROCESS:<br />
There are numerous examples of how the<br />
Ionscan has assisted Australian Customs in the<br />
detection of significant illicit drug seizures and<br />
the education program has provided our<br />
officers with the skills to use this technology in<br />
its most innovative and aggressive fashion. For<br />
example, IMS technology was instrumental in<br />
the detection and seizure of 115 kilograms of<br />
Copyright © 2000 by International Society for Ion Mobility Spectrometry
G. Webster: „Evolution of IMS technology...”, IJIMS 4(2001)1, 65-66, p. 66<br />
black cocaine – the first seizure of its type in<br />
Australia.<br />
Customs has, until very recently, been the only<br />
law enforcement user of IMS technology in<br />
Australia. As we are geographically quite<br />
isolated from those countries which have been<br />
using this tool for quite some time, we built<br />
upon the technical skills and knowledge<br />
provided by the manufacturer in developing our<br />
own procedure and policies for use. We are<br />
now in a position to assist other agencies in<br />
Australia and the Pacific who are embarking on<br />
an IMS program. We have trained officers<br />
from Australian State Police Forces and Fiji<br />
Customs, and provided New Zealand Customs<br />
with details of our training program.<br />
IMS TECHNOLOGY IS ONLY A TOOL<br />
Despite its reliability and proven success in<br />
narcotic interdiction, the Ionscan is only a tool<br />
and is to be used in the same way we use our<br />
other tools, such as x-ray and dogs. As with all<br />
technology an important fact remains:<br />
“Ionscan’s’ don’t find drugs, Customs Officers<br />
find drugs.”<br />
FUTURE OF IMS TECHNOLOGY:<br />
As the term “evolution” suggests, we must<br />
continue to learn and grow if we are to<br />
accomplish what we believe is possible with this<br />
technology. The future of the program will see<br />
the following:<br />
♦<br />
Continued development of our national<br />
Ionscan training program to cater for<br />
scientific and operational changes &<br />
training of further regional Competency<br />
Assessment Training Officers to allow for<br />
succession planning;<br />
♦ Liaison with other law enforcement<br />
agencies using the technology in Australia<br />
and overseas to attempt to create an “IMS<br />
User’s Network” to workshop ideas and<br />
theories;<br />
CONCLUSION:<br />
Until quite recently the very latest technology to<br />
assist a customs officer with the search of<br />
vessels, cargo and aircraft was a torch and a<br />
mirror. Today officers have a vast array of drug<br />
detection tools at their disposal – the Drug Dog,<br />
the X-ray, access to a national CCTV network<br />
and of course, the Ionscan.<br />
In just three years Australian Customs has<br />
introduced a total of 51 Ionscan units to all<br />
Australian air and seaports. The acceptance<br />
and successful use of the technology by such a<br />
large number of officers is proof that this drug<br />
detection initiative – IMS - is the outstanding<br />
success. The enthusiasm for the technology<br />
has spread to other Australian law enforcement<br />
agencies that regularly ask us to provide<br />
assistance, either in the form of training or<br />
operational support.<br />
One of the exciting things about this technology<br />
is that we really have only just begun to tap its<br />
potential. I believe that the use of the Ionscan<br />
in Australia will continue to develop and<br />
“evolve”.<br />
Copyright © 2000 by International Society for Ion Mobility Spectrometry
VIP sources for ion mobility spectrometry<br />
H.-R. Döring 1) , G. Arnold 1) , V. L. Budovich 2)<br />
1<br />
Bruker Saxonia <strong>Analytik</strong> <strong>GmbH</strong>, Permoserstr. 15, 04318 Leipzig, Germany<br />
2<br />
Fa. CHROMDET Ekologija, Pleteshkovskij per. 22, Moscow 107005, Russia<br />
Ion Mobility Spectrometry (IMS) for the<br />
detection of chemical warfare agents (CWAs),<br />
toxic industrial chemicals (TICs), drugs and<br />
explosives is mainly based on the ionization by<br />
radioactive sources such as 63 Ni, 241 Am and 3 H,<br />
since these sources optimally meet the<br />
requirements made on a portable device for<br />
field use: They are small-sized and very<br />
lightweight, they have an extremely good<br />
mechanical stability and do not require any<br />
additional power. They are very reliable while<br />
displaying an excellent sensitivity with regard to<br />
the detection of quite a large number of<br />
compounds of interest.<br />
However, for well-known reasons (radiation<br />
safety, disposal problems) there is a growing<br />
interest in replacing radioactive sources by<br />
alternative ionization techniques. In the past the<br />
most promising candidates for replacing<br />
radioactive ionization sources were<br />
photoionization (PI) and coronadischarge<br />
ionization (CD).<br />
Developments of Ultra-Violet (UV) IMS have<br />
shown that the analytical performance of an<br />
UV-IMS is only insignificantly higher than that<br />
of a simple photoionization detector (PID). An<br />
improved performance could be reached by<br />
adding special dopants [1,2]. Nevertheless, the<br />
conclusions were that there was no full<br />
replacement found for radioactive sources.<br />
CD sources provide an excellent response for<br />
TICs and CWAs whenever they are detected in<br />
the positive mode (i. e. where positive ions are<br />
involved). Detection limits are not sufficient for<br />
TICs and CWAs which need to be monitored in<br />
the negative IMS operation mode. Even after<br />
several years of reasearch and development<br />
the insufficient overall detection performance<br />
as well as the stability and reliability of CD<br />
sources are, according to today’s knowledge,<br />
an unsolvable outstanding problem [3].<br />
The new non-radioactive variable ionization<br />
potential (VIP) source [4, 5], also called<br />
„electron lamp“, consists of a small evacuated<br />
glass tube in which electrons emitted by a<br />
heated cathode are accelerated in the direction<br />
of a special window (Photograph 1). By<br />
variation of the accelerating voltage and<br />
selection of the window (material, thickness),<br />
the electrons can pass through the window into<br />
the reaction chamber of the IMS and ionize<br />
there as in the case of a 63 Ni source or a CD<br />
source, or they get absorbed in the window<br />
causing in addition to secondary electrons, an<br />
X-ray radiation typical for the window material.<br />
In the first case the lamp is usually fitted with a<br />
mica window having a thickness of 5...7 µm. If<br />
the primary electrons are accelerated with such<br />
a high voltage that they are able to penetrate<br />
through the window e. g. higher than 15 kV, a<br />
large number of substances including<br />
hydrocarbons can be ionized. Thus, they may<br />
be detected by the IMS with a relatively good<br />
sensitivity. However, if this broad-band<br />
detectibility is not intended the accelerating<br />
voltage must be reduced resulting in a poorer<br />
sensitivity as may be seen from Fig. 2. In this<br />
case ionization of substances is only effected<br />
by the characteristic X-ray radiation of the<br />
elements in the mica window (Si, K, Al,...).<br />
But if it is necessary to detect such substances<br />
like organic phosphorous compounds or<br />
halogenated thioethers selectively and with a<br />
high sensitivity, a beryllium foil is used as<br />
Copyright © 2000 by International Society for Ion Mobility Spectrometry
H.-R. Döring et al.: „VIP sources for ion mobility spectrometry...”, IJIMS 4(2001)1, 67-70, p. 68<br />
glass tube<br />
heated cathode<br />
Wehnelt<br />
cylinder<br />
Figure 1: Electron lamp<br />
window, e. g. a foil having a thickness of 25 µm<br />
that is coated with an aluminium anode at the<br />
vacuum side. The typical radiation emitted by<br />
aluminium is utilized then for the ionization of<br />
the compounds. In addition, this window has<br />
the following advantages: i) the heat that is<br />
generated during<br />
slowing down of<br />
electrons is conducted<br />
well, ii) the larger<br />
thickness of the<br />
window ensures a<br />
higher lifetime of the<br />
lamp, iii) it is possible<br />
to increase the energy<br />
transfer through the<br />
window that results in<br />
stronger IMS signals.<br />
An experimental setup<br />
was constructed<br />
based on the<br />
window<br />
well-known RAID<br />
technology. An<br />
electron lamp was<br />
fixed axially on the<br />
IMS tube. This<br />
experimental setup<br />
was used for the<br />
detection of acetates,<br />
organic phosphorous<br />
compounds,<br />
halogenated and non-halogenated<br />
hydrocarbons like hexane (see Fig. 3), of toxic<br />
industrial chemicals like HCN, COCl2, Cl2, SO2,<br />
NO2, NH3 and all known nerve and blister<br />
agents (see Fig. 4 and 5). The normalized ion<br />
mobilities (so-called K0-values) determined<br />
peak area [pA•ms]<br />
100<br />
80<br />
60<br />
positive<br />
reactant<br />
ion peak<br />
acetone<br />
(10 ppm)<br />
40<br />
ethyl acetate<br />
(150 ppb)<br />
20<br />
0<br />
n-hexane<br />
(50 ppm)<br />
0 5 10 15 20 25<br />
anode voltage [kV]<br />
Figure 2:<br />
Ionization of selected compounds in dependence on the anode voltage<br />
Copyright © 2000 by International Society for Ion Mobility Spectrometry
H.-R. Döring et al.: „VIP sources for ion mobility spectrometry...”, IJIMS 4(2001)1, 67-70, p. 69<br />
AIR<br />
2.09<br />
acceleration<br />
voltage 24 kV<br />
HEXANE<br />
1.90<br />
2.39<br />
Fig. 3: Detection of 50 ppm hexane<br />
NH 3<br />
2.23 RIP<br />
2.08<br />
acceleration<br />
voltage 2,5 kV<br />
5s<br />
1.67<br />
1.54<br />
1.28<br />
1.16<br />
acceleration<br />
Fig. 4: Detection of 130 µg/m³Sarin<br />
Cl -<br />
2.80<br />
(HD)O 2<br />
-<br />
2.80<br />
voltage 2,5 kV<br />
5s<br />
Fig. 5: Detection of 150 µg/m³ HD<br />
Copyright © 2000 by International Society for Ion Mobility Spectrometry
H.-R. Döring et al.: „VIP sources for ion mobility spectrometry...”, IJIMS 4(2001)1, 67-70, p. 70<br />
during these measurements are absolutely<br />
identical with those gained with radioactive ion<br />
sources.<br />
With an accelerating voltage of 2 kV and an<br />
anode current of 5 µA sensitivities were<br />
reached which were equal to those gained<br />
using a 63 Ni source with an activity of 555 Mbq.<br />
Moreover, the investigations have shown that<br />
the detection limit of the IMS can be<br />
considerably reduced by increasing the anode<br />
current of the lamp (100 µA are possible). The<br />
lifetime of the electron lamp is equal to that of<br />
PID lamps.<br />
Summary:<br />
A new nonradioactive ion source, the so-called<br />
„electron lamp“, has been developed. It<br />
consists of a small evacuated glass tube in<br />
which electrons are generated and accelerated<br />
in direction towards a window. Depending on<br />
the design of the window and the value of the<br />
accelerating voltage, this lamp either emits a<br />
very soft X-ray radiation or electrons by help of<br />
which the substances to be detected are<br />
ionized in the IMS. It was proved that an IMS<br />
equipped with such a lamp has shown<br />
absolutely the same analytical performance as<br />
a 63 Ni IMS with an activity of the source of 555<br />
MBq or even a better one.<br />
References:<br />
[1] Photoionization Ion Mobility Spectrometer, Glenn E.<br />
Spangler et al., US Patent 5, 338,931, Int. Cl. 301 D<br />
59/44 H01 J 49/00, August 16, 1994<br />
[2] Photoionization Ion Mobility Spectrometry, H.-R.<br />
Döring, G. Arnold, US Patent 5,968,837, Int.Cl. g01<br />
N33; H0149/00; October 19, 1999<br />
[3] J. Adler, H.-R. Döring, G. Arnold, V. Starrock, E.<br />
Wülfing, First Results with the Bruker Corona<br />
Discharge IMS, Paper held on the 6. International<br />
IMS Workshop in Dresden, August 1997<br />
[4] Ion Mobility Spectrometer, V. Budovich, A. Mikhailov,<br />
G. Arnold, US Patent No. 5,969,349, Int. Cl.<br />
H01J49/00<br />
[5] Ionization Chamber with Electron Source, H.-R.<br />
Döring, Patent Application in July, 1999 in Europe,<br />
USA, Canada, Japan, Korea<br />
Copyright © 2000 by International Society for Ion Mobility Spectrometry
RELATIONSHIPS FOR ION DISPERSION IN<br />
ION MOBILITY SPECTROMETRY<br />
Glenn E. Spangler<br />
Technispan LLC, 1133C Greenwood Road, Pikesville, MD 21208, USA<br />
INTRODUCTION<br />
In recent years, the field of ion mobility<br />
spectrometry (IMS) has grown to include not<br />
only linear DC-field IMS, but also asymmetric<br />
RF-field IMS. 1-2 These two approaches to ion<br />
mobility spectrometry produce two types of<br />
data that have not yet been correlated with<br />
each other. Approaches to achieving such a<br />
correlation is described here.<br />
DISCUSSION<br />
The equation describing the motion of ions in<br />
”local equilibrium” in the gas phase is the<br />
continuity equation 3-5<br />
∂n<br />
v t v<br />
T<br />
v v<br />
−∑∇• xD<br />
i i•∇ nT + ∑xv i di•∇ nT + ∑xiα<br />
inT=<br />
0<br />
∂t<br />
i i i<br />
(1.1)<br />
where n T is the total ion concentration, x i is the<br />
mole fractional contribution to the i-th ion<br />
species, D i is the diffusion tensor, v di is the drift<br />
velocity and α i is the rate of ion loss during<br />
migration; and the momentum transfer<br />
equation 5 2v<br />
v<br />
⎛dr<br />
⎞ ⎛dr<br />
⎞ v v<br />
mi⎜<br />
+ µν<br />
2 i i( εi) ⎜ ⎟ − qE<br />
i ( rt , ) = 0<br />
dt<br />
⎟<br />
⎝ ⎠<br />
dt<br />
i<br />
⎝ ⎠i<br />
(1.2)<br />
where m i is the mass, µ i is the reduced mass, ν i<br />
is the collision frequency, ε i is the energy, q i is<br />
the charge on the i-th ion; r v is the most<br />
probable location of the ion cloud in electric<br />
field E v<br />
; and the first derivative of equation 1.2<br />
corresponds to the drift velocity in equation 1.1.<br />
The momentum transfer equation describes the<br />
ion trajectory, and the continuity equation<br />
describes the dispersion of the ion cloud as it<br />
drifts through the drift region.<br />
Since in a linear DC-field IMS the ions travel<br />
with a constant velocity, the acceleration or<br />
second-derivative term of equation 1.2 is zero,<br />
and the drift velocity is<br />
v<br />
v ⎛ dr ⎞ q v<br />
i v v v<br />
di<br />
= ⎜ ⎟ = E( r, t) ≡ KE<br />
i ( r,<br />
t)<br />
⎝ dt ⎠i µν<br />
i i( εi)<br />
(1.3)<br />
where K is the mobility of the ion. Furthermore<br />
since the ions in an asymmetric RF-field IMS do<br />
not travel with a constant velocity, the<br />
acceleration term of equation 1.2 is not zero<br />
and the momentum transfer equation remains a<br />
second order non-linear equation. For an<br />
oscillatory electric field, the momentum transfer<br />
equation corresponds to the Mathieu equation<br />
of quadrupole mass spectrometry. 6 The<br />
first-order term can be handled by adding a<br />
second order harmonic to the oscillatory field.<br />
Perturbation theory allows the drift velocity for<br />
the ions to be written as<br />
v = xv v +δ<br />
v<br />
where<br />
∑ xv<br />
v<br />
i di<br />
i<br />
(1.4)<br />
is the low-field drift velocity for<br />
the ions under the thermal conditions of the<br />
IMS, and δ v is the change in that drift velocity<br />
v d<br />
∑<br />
d i di d<br />
i<br />
due to the action of the electric field. The<br />
electric field increases the drift velocity by<br />
declustering the ions, and decreases the drift<br />
Copyright © 2000 by International Society for Ion Mobility Spectrometry
G.E. Spangler: „Relationships of ion dispersion...”, IJIMS 4(2001)1, 71-74, p. 72<br />
velocity by increasing the collision cross<br />
section. These ideas are contained in<br />
v<br />
v v δ T<br />
δ d<br />
= f ( xK<br />
i i) E( rt , )<br />
T<br />
(1.5)<br />
where f(x iK i) is defined by Spangler, 5 and δT is<br />
the increase in the effective temperature of the<br />
ion over the drift temperature T. f(x iK i) may be<br />
positive or negative depending upon whether<br />
declustering or the change in the collision cross<br />
section dominates.<br />
While the relationship that describes the<br />
change in effective temperature is not firmly<br />
established, Wannier’s work with high electric<br />
fields suggests that 7-9<br />
(1.6)<br />
where M is the total mass of the colliding<br />
particles and k is Boltzmann’s gas constant.<br />
When equation 1.6 is substituted in equation<br />
1.7, δ v becomes proportional to the cube of<br />
v d<br />
the electric field. For the asymmetric RF-field<br />
IMS, this electric field is the dispersion field.<br />
The complementary field E C is related to δ v<br />
through 5 τ<br />
v v<br />
− KECτ<br />
=∫δvdt<br />
d<br />
0<br />
(1.7)<br />
where K is the mobility of the ion cloud and τ is<br />
one complete cycle of the exciting RF<br />
waveform. Differentiation of equation 1.7 yields<br />
τ<br />
dEC<br />
E ⎡<br />
3<br />
⎤<br />
C<br />
= dK + Ed<br />
C<br />
ln ⎢ f ( xK<br />
i i) Edt<br />
dK K<br />
∫<br />
⎥<br />
⎣0<br />
⎦<br />
(1.8)<br />
that is similar to<br />
dt<br />
M<br />
δ T = v<br />
3k<br />
d<br />
2<br />
d<br />
td<br />
=− dK<br />
K<br />
d<br />
(1.9)<br />
for the linear DC-field IMS. The<br />
complementary field E C of equation 1.8 is<br />
functionally similar to the drift time t d of<br />
equation 1.9 provided the differential<br />
logarithmic term is small. Equation 1.8<br />
contains a positive sign, and equation 1.9 a<br />
negative sign.<br />
Equation 1.8 seems to describe the<br />
compensation versus dispersion voltage data of<br />
Riegner, et al. with a small differential<br />
logarithmic term. 10 An exception is the DMMP<br />
data that apparently deviates from the trend<br />
due to declustering activity. The compensation<br />
versus dispersion voltage data of Buryakov, et<br />
al., however, does not satisfy equation 1.8<br />
without the differential logarithmic term. 11 Since<br />
the RF potentials used to excite the two<br />
systems were different, the method used to<br />
exite ion motion may directly impacts the ability<br />
of an asymmetric RF-field IMS to produce data<br />
that can be compared to a linear DC-field IMS.<br />
Work is continuing on this <strong>issue</strong>.<br />
It has been noted that the declustering of ion<br />
clusters in a high electric field can lead to<br />
changes in drift velocity. A question related to<br />
this <strong>issue</strong> is whether the asymmetric RF-field<br />
IMS is a useful device, or only an academic<br />
curiosity. For example, do the ions form<br />
adducts with the drift gas to frustrate the<br />
measurement of ion mobilities? Very little data<br />
exists to answer this question, and the facility of<br />
a mass spectrometer is needed to address the<br />
topic.<br />
Over the years, a variety of data has been<br />
collected on the nature of the reactant ions in<br />
IMS using IMS / MS. 12-14 More recently, a more<br />
comprehensive data set has been collected<br />
under controlled conditions of water, and<br />
compiled and compared to other previously<br />
published data. 15 All the data suggest that the<br />
ions arriving at the detector of the mass<br />
spectrometer are ions clustered with water and<br />
drift gas molecules (e.g., N 2 for air, and Ar for<br />
argon)<br />
(1.10)<br />
where n, m and p are integers. However when<br />
± ±<br />
M ( HO) ( N) ( Ar) HO M ( HO)( N) ( Ar)<br />
l<br />
2 n− 1 2 m p+<br />
2 2 n 2 m p<br />
amplitude ratios are computed and compared<br />
to published thermodynamic data, the<br />
calculated water concentration does not agree<br />
with the experimentally measured concentration<br />
(1 to 3 ppm) in the IMS, and the free energies<br />
Copyright © 2000 by International Society for Ion Mobility Spectrometry
G.E. Spangler: „Relationships of ion dispersion...”, IJIMS 4(2001)1, 71-74, p. 73<br />
associated with the drift gas adducts are<br />
endothermic. These results suggest that the<br />
expansion region immediately behind the ion<br />
sampling pinhole significantly alters the<br />
distribution of the ions as they are sampled.<br />
The gas dynamics for the expanding gas is free<br />
jet expansion. 16 The density of the gas and the<br />
gas kinetic temperature decreases until the<br />
speed of the flow eventually exceeds that of the<br />
local speed of sound. The expanding zone<br />
(sometimes referred to as the zone of silence)<br />
is surrounded by a concentric barrel shock<br />
terminated by a perpendicular Mach disc. As<br />
the gas adiabatically expands within this barrel<br />
shock, the equilibria that previously existed in<br />
the IMS tend to shift to lower temperature. This<br />
continues until there are an inadequate number<br />
of collisions to support the equilibrium<br />
dynamics, at which point the equilibrium<br />
freezes. 17 Since the relative concentrations<br />
(assumed to be in excess) in the expanding<br />
gas remain constant, it is possible to deduce<br />
the temperature where freezing occurs by<br />
tallying amplitude ratios in the mass<br />
spectrometer data. For the water adducts, the<br />
freezing temperature is found to decrease<br />
linearly with the number of adducts.<br />
When the above arguments are applied to<br />
adducts of drift gas, a different result is<br />
obtained. The equilibria associated with these<br />
adducts appear to shift continuously through<br />
the zone of silence and reach a new equilibrium<br />
with the background gas beyond the Mach disk.<br />
The free energy of reaction ∆G n-1,n /RT is on the<br />
order of –12.9 ± 0.6. 15 Hundreds of amplitude<br />
ratios were considered before arriving at this<br />
value that is both independent of the nature of<br />
the adduct (N 2 or Ar), number of adducts, etc.<br />
Since a free energy with this order of<br />
magnitude arises from a very weak interaction<br />
(such as an ion-induced dipole interaction<br />
possibly involving a third body for complex<br />
stabilization), the enthalpy of reaction can be<br />
estimated from the polarizability of the adducts<br />
and the temperature of the gas within the<br />
vacuum system. When the thermodynamics<br />
0.693 ⎛ ∆G<br />
1,<br />
2 exp<br />
n−<br />
n ⎞<br />
τ<br />
r<br />
=<br />
kfP<br />
⎜ −<br />
RT ⎟<br />
STP ⎝ ⎠<br />
are extrapolated to the atmospheric pressure<br />
conditions of the IMS, the lifetime of the<br />
adducts can be found from<br />
(1.11)<br />
that is on the order of 0.013 nanoseconds,<br />
assuming a forward rate constant of<br />
2.6x10 -30 cc 2 /molecule 2 sec. Since this<br />
lifetime is less than the collision time<br />
between molecules under atmospheric<br />
pressure conditions (0.6 nanoseconds),<br />
evidence for adduct formation within an<br />
IMS is lacking. One might continue to<br />
argue for momentary adduct formation, but<br />
these clusters impact minimally the<br />
measurement of mobility values due to their<br />
instability.<br />
CONCLUSIONS<br />
The ability to correlate IMS data generated<br />
by an asymmetric RF-field IMS with data<br />
generated by a linear DC-field IMS<br />
depends upon the waveform used to excite<br />
the RF-field IMS. Other methods of<br />
excitation can provide variable resolution,<br />
but such methods destroy the mobility<br />
information contained in the ionogram.<br />
Momentary adduct formation between ion<br />
and drift gas molecules may momentarily<br />
occur under the atmospheric pressure<br />
conditions of an IMS. However, it is<br />
doubtful that these adducts significantly<br />
change drift velocities and associated<br />
mobility values. This is particularly true for<br />
the asymmetric RF-field IMS where the<br />
effective temperature of the ion is<br />
increased by the high electric field. This<br />
comment may not apply to water adducts<br />
that have higher associative bond energies.<br />
REFERENCES<br />
[1] Cohen, M.J.; Karasek, F.W. J. Chrom. Sci.<br />
1970, 8(6), 330-337.<br />
[2] Buryakov, I.A.; Krylov, E.V.; Nazarov, E.G.;<br />
Rasulev, U. Kh. Int. J. Mass Spectrom. Ion<br />
Proc. 1993, 128, 143-148.<br />
[3] Moseley, J.T.; Gatland, I.R.; Martin, D.W.;<br />
McDaniel, E.W. Phys. Rev. 1969, 178, 234-239.<br />
[4] Spangler, G.E.; Collins, C.I. Anal. Chem. 1975,<br />
47, 403-407.<br />
[5] Spangler, G.E., Field Analytical Chemistry and<br />
Technology, 4/5(2000)255-267.<br />
[6] Quadrupole Mass Spectrometry and Its<br />
Applications, P.H. Dawson, Ed.; Elsevier,<br />
Amsterdam, 1976.<br />
Copyright © 2000 by International Society for Ion Mobility Spectrometry
G.E. Spangler: „Relationships of ion dispersion...”, IJIMS 4(2001)1, 71-74, p. 74<br />
[7] Wannier, G.H. Phys. Rev. 1951, 83, 281-289.<br />
[8] Wannier, G.H. Bell Syst. Tech. J. 1953, 32,<br />
170-254.<br />
[9] Mason, E.A. McDaniel, E.W. Transport<br />
Properties of Ions in Gases, Wiley: NY, 1988,<br />
pp. 233, 280, 298, 358.<br />
[10] Riegner, D.E.; Harden, C.S.; Shoff, D.B.; Ewing,<br />
R.G. Proc. 1997 ERDEC Scientific Conf.<br />
Chemical & Biological Defense Research, July<br />
1998.<br />
[11] Buryakov, I.A.; Krylov, E.V.; Nazarov, E.G.;<br />
Rasulev, U.Kh. Int. J. Mass Spectrom. Ion Proc.<br />
1993, 128, 143-148.<br />
[12] Kim, S.H.; Betty, K.R.; Karasek, F.W. Anal.<br />
Chem. 1978, 50, 2006-2012.<br />
[13] Kim, S.H.; Karasek, F.W.; Rokushika, S. Anal.<br />
Chem. 1978, 50, 152-155.<br />
[14] Kim, S.H. Ph.D. Dissertation, University of<br />
Waterloo, Ontario, Canada, 1977.<br />
[15] Spangler, G.E., accepted for publication, Int. J.<br />
Mass Spectrom. (2001)<br />
[16] Douglas, D.J.; French, J.B. J. Anal. Atom.<br />
Spectrom. 1988, 3, 743-747.<br />
[17] Bray, K.N.C. In GasDynamics, Volume I:<br />
Nonequilibrium Flows, Part II, P.P. Wegener,<br />
Ed.; Marcel Dekker: New York, 1970, chapter 3.<br />
Copyright © 2000 by International Society for Ion Mobility Spectrometry
P. de B. Harrington: „Strategies for smarter...”, IJIMS 3(2000)1, -, p. 75
P. de B. Harrington: „Strategies for smarter...”, IJIMS 3(2000)1, -, p. 76
A novel Method for the Detection of MTBE:<br />
Ion Mobility Spectrometry coupled to Multi Capillary Column<br />
Z. Xie 1 , St. Sielemann 2 , H. Schmidt 1 , J.I. Baumbach 1<br />
1<br />
Institut für Spektrochemie und Angewandte Spektroskopie (ISAS),<br />
Bunsen-Kirchhoff-Str. 11, D-44139 Dortmund, Germany<br />
2<br />
G.A.S. Gesellschaft für analytische Sensorsysteme mbH,<br />
TechnologieZentrumDortmund, Emil-Figge-Str. 76-80, D-44227 Dortmund,Germany<br />
Abstract<br />
A combination of an ion mobility spectrometer<br />
with radioactive ionization source and equipped<br />
with a multi capillary column was used as a<br />
new analytical method for the detection of<br />
MTBE, a gasoline additive, which has become<br />
a potential water pollution problem. To extract<br />
MTBE out of the water a membrane extraction<br />
unit was set up, which is simple, effective and<br />
easy to automate with respect to further<br />
applications. The analyte was extracted on the<br />
one hand directly out of the water, thus the<br />
membrane was completely steeped in the<br />
water. On the other hand, the membrane was<br />
held in the gas phase over the surface of the<br />
water (head space). The minimum detectable<br />
limit for both methods was about 50 ppb vl of<br />
MTBE in water and the reproducibility with a<br />
standard deviation of 8.9 % (head space) and<br />
11.5 % (aqueous phase) rather high. Finally the<br />
utilizability of the system for on-site and on-line<br />
measurements is briefly discussed.<br />
Introduction<br />
Methyl tert-butyl ether (MTBE, CAS 1634-04-4)<br />
has been used as an octane-enhanced<br />
replacement for lead, primarily in mid- and<br />
high-grade gasoline at concentrations as high<br />
as 8 % (by volume) since 1979. As part of two<br />
US EPA programs it is also used as<br />
oxygenates at higher concentrations (11 to 15<br />
% per volume) to reduce ozone and carbon<br />
monoxide levels in polluted areas of the country<br />
[1-3].<br />
MTBE is highly soluble in water (4.8 weight %),<br />
does not really degrade in the environment,<br />
and most public water systems are not<br />
equipped to completely remove it from drinking<br />
water. MTBE is considered a potential human<br />
carcinogen and the Comprehensive<br />
Environmental Response, Compensation, and<br />
Liability Act (CERCLA), commonly known as<br />
Superfund, listed MTBE as a hazardous<br />
substance. Due to the use of MTBE the number<br />
of reports concerning its detection in<br />
groundwater and surface water increase.<br />
Current methods to detect MTBE are based on<br />
capillary gas chromatography with flame<br />
ionization detection (FID) or mass spectrometry<br />
(MS) [4-7]. In other studies FT near-IR and FT<br />
Raman spectroscopy are used as<br />
non-destructive methods to quantify the amount<br />
of MTBE in gasoline [8, 9].<br />
As a new analytical method for the detection of<br />
MTBE in air and water a method based on ion<br />
mobility spectrometry is introduced in this<br />
paper. Ion mobility spectrometers (IMS) are<br />
very fast, sensitive and inexpensive devices<br />
which permits the efficient analysis and<br />
characterization of gaseous analytes [10-20].<br />
IMS can operate at ambient temperature and<br />
pressure without requiring a vacuum. During<br />
the last 10 years dramatic changes have<br />
occurred in the practical aspects of ion mobility<br />
spectrometry and the understanding of<br />
underlying principles of response. IMS, in the<br />
early 1970 mostly used for the detection of<br />
chemical warfare agents [10, 11, 21, 22], are<br />
more and more applied for the use in industrial<br />
and environmental venues, not only because of<br />
the simplicity of the instrumentation but also<br />
due to the astonishing detection limits in the<br />
range of some µg/L, sometimes even down to<br />
ng/L [23-27].<br />
For the detection of MTBE in mixtures the IMS<br />
was coupled to a multi capillary column (MCC,<br />
28-32] to realize an effective pre-separation.<br />
Such columns consists of about 1000 parallel<br />
capillaries with an inner diameter of 43 µm.<br />
Because of a total diameter of 3 mm of the<br />
Copyright © 2000 by International Society for Ion Mobility Spectrometry
Z. Xie et al.: „A novel method for the detection of MTBE...”, IJIMS 4(2000)1, 77-83, p. 78<br />
Table 1:<br />
Main parameters of the ISAS custom designed<br />
63<br />
Ni-IMS coupled to a multi capillary column<br />
(MCC)<br />
Parameter<br />
Ionization source<br />
Length of the drift tube<br />
Electrical field strength<br />
Shutter opening time<br />
Drift gas<br />
Drift gas flow<br />
Sample gas<br />
Sample gas flow<br />
Temperature (IMS)<br />
Stationary phase of the MCC<br />
Length of the column<br />
Carrier gas of the MCC<br />
Carrier gas flow<br />
Temperature (MCC)<br />
MCC- 63 Ni-IMS<br />
63<br />
Ni (510 MBq)<br />
120 mm<br />
326 V/cm<br />
100 µs<br />
N 2 (99.999%)<br />
100 mL/min<br />
N 2 (99.999%)<br />
100-1500 mL/min<br />
23 °C<br />
nonpolar<br />
25 cm<br />
N 2 (99.999%)<br />
400 mL/min<br />
23 °C<br />
whole column it is possible to operate the<br />
column with carrier gas flows between 100 and<br />
800 mL/min, which are the optimum flow rates<br />
to introduce gaseous samples into IMS. In the<br />
past the connection of MCC with IMS with a<br />
UV-ionization source was successfully used for<br />
the fast separation and sensitive detection of<br />
mixtures of different volatile organic substances<br />
(VOC) [33, 34].<br />
In this present short communication the<br />
arrangement of an IMS with MCC was used for<br />
the detection of MTBE in gaseous and aqueous<br />
matrix and the detection limits and calibration<br />
curves will be presented. The results of the<br />
experiments on separations of different<br />
mixtures will be finished soon and published<br />
in a following paper.<br />
The extraction of MTBE from the water was<br />
realized in a single step by using a<br />
membrane sampling device, which is a<br />
frequently used technique as separator in a<br />
wide variety of analytical determinations<br />
[35-47]. Blanchard and Hardy [48]<br />
introduced this separation method based on<br />
the permeation of volatile organic<br />
compounds through a silicone poly<br />
carbonate membrane from an aqueous<br />
sample matrix into an inert gas stream.<br />
Extraction using this kind of membranes<br />
achieve high selectivity, because the<br />
solubility of the organic molecules in silicone<br />
is higher than that in water. In such non<br />
porous structures, the molecules first<br />
dissolve in the membrane and then diffuse<br />
due to a concentration gradient.<br />
The purpose of this paper is to illustrate that ion<br />
mobility spectrometry in combination with a<br />
membrane extraction unit is a fast and sensitive<br />
method for the on-line and near real-time<br />
detection of MTBE in the gas phase and in<br />
aqueous sample matrix.<br />
Experimental Section<br />
Instrumentation<br />
For the measurements a system consisting of<br />
an ISAS custom designed ion mobility<br />
spectrometer with a radioactive ionization<br />
source ( 63 Ni, 555 MBq) coupled to a rod-sharp<br />
multi capillary column (Institute of Applied<br />
carrier gas<br />
inlet<br />
stainless steel<br />
connection<br />
carrier gas<br />
outlet<br />
stainless<br />
steel needle<br />
teflon seal<br />
stainless steel ring<br />
stainless steel seal<br />
stainless steel wire<br />
membrane<br />
Figure 1:<br />
Schematic diagram of the membrane extraction unit<br />
Copyright © 2000 by International Society for Ion Mobility Spectrometry
Z. Xie et al.: „A novel method for the detection of MTBE...”, IJIMS 4(2000)1, 77-83, p. 79<br />
Table 2:<br />
Drift times t d, peak half time width w and resolving power<br />
R for monomer and dimer ions of MTBE using the<br />
63<br />
Ni-IMS (see figure 2)<br />
Peak<br />
t d / ms w / ms R<br />
Physics, Novosibirsk, Russia) was used. The<br />
relevant parameters of the system are<br />
summarized in table 1. The sample is<br />
introduced on the MCC using an electric<br />
six-port-valve (Valco, Supelco, Deisenhofen,<br />
Germany) and a stainless steel loop with a<br />
volume of 1 mL. The IMS was driven only in the<br />
positive mode.<br />
Drift Time / ms<br />
Monomer ion peak<br />
Dimer ion peak<br />
Signal / V<br />
-0.06<br />
-0.04<br />
-0.02<br />
0.00<br />
MTBE<br />
RIP<br />
monomer ion peak<br />
MIP<br />
1.72 cm 2 /Vs<br />
dimer ion peak<br />
DIP<br />
1.45 cm 2 /Vs<br />
15 20 25 30<br />
Drift Time / ms<br />
Figure 2:<br />
Ion mobility spectrum of the positive ions of MTBE<br />
using the MCC- 63 Ni-IMS<br />
25<br />
20<br />
25<br />
20<br />
25<br />
20<br />
RIP<br />
RIP<br />
RIP<br />
DIP<br />
DIP<br />
MIP<br />
MIP<br />
DIP<br />
1.981<br />
2.355<br />
Copyright © 2000 by International Society for Ion Mobility Spectrometry<br />
positive ions<br />
300 ppb vg<br />
1510 ppb vg<br />
0 2 4 6 8 10<br />
Retention Time / s<br />
MIP<br />
0.4<br />
0.6<br />
160 ppb vg<br />
50<br />
39<br />
Figure 3:<br />
2D-IMS-Chromatogramm of MTBE test gas of<br />
concentrations of 160, 300 and 1510 ppb vg<br />
(MCC- 63 Ni-IMS, RIP: reactant ion peak, MIP:<br />
monomer ion peak, DIP: dimer ion peak)<br />
Sample preparation and data processing<br />
To generate the gaseous samples of MTBE<br />
(99,5%, Fischer Scientific, Schwerte,<br />
Germany) with different concentrations a<br />
permeation system was used. The pure and<br />
fluid substance was filled into a 2 mL glass<br />
flask (permeation tubes) which was covered<br />
with a PTFE coated caoutchouc membrane<br />
(1 mm). The tube was kept at a constant<br />
temperature of 23 °C with the help of a<br />
thermostat to achieve reproducible and stable<br />
permeation rates through the membrane. The<br />
sample gas stream to carry the gaseous<br />
substance was kept constant by the use of flow<br />
controllers. The permeation rate of the<br />
substance was determined by the<br />
weight loss in a defined time period. By<br />
changing the sample carrier gas stream<br />
different concentrations were achieved.<br />
The test gas was flowing continuously to<br />
the 1 mL loop of the six-port-valve.<br />
For the detection of MTBE in water an<br />
extraction unit was set up which is<br />
shown in figure 1. The extraction unit<br />
consists of a stainless steel vessel<br />
covered gas tightly with a stainless steel<br />
cap with a seal. In the cap there are two<br />
stainless steel screws pierced by a<br />
needle (outer diameter: 700 µm;<br />
Hamilton Deutschland <strong>GmbH</strong>,<br />
Darmstadt, Germany). A silicon high<br />
temperature tube (length: 18 cm; inner<br />
diameter: 300 µm; outer diameter: 700<br />
µm; Reichelt Chemietechnik,<br />
Heidelberg, Germany) is used as<br />
membrane. The gas tight connection of<br />
the membrane with the needle was<br />
realized by submerging the end of the<br />
membrane in toluene and after it had<br />
swollen to insert the needle into the<br />
hollow fibre. When the toluene<br />
evaporated, the membrane shrunk and<br />
a gas tight connection between needle<br />
and membrane is formed. Additional<br />
there is a wire to hold the membrane.<br />
MTBE was extracted from the water by<br />
two different ways: On the one hand 50<br />
mL of the solution with different<br />
concentrations of MTBE were filled into<br />
the vessel, so that the membrane was<br />
only in contact with the gas phase<br />
('head space') above the aqueous<br />
phase, on the other hand 200 mL were<br />
filled into the vessel and the whole<br />
membrane was covered with water. The
Z. Xie et al.: „A novel method for the detection of MTBE...”, IJIMS 4(2000)1, 77-83, p. 80<br />
Area / a.u.<br />
0,1<br />
C<br />
D<br />
E<br />
The solutions with different<br />
concentrations were prepared<br />
by adding pure MTBE to<br />
distilled water and to dilute it.<br />
The areas of the peaks were<br />
calculated using Origin 6.0<br />
(Microcal, Northampton, MA,<br />
USA). The standard deviations<br />
were determined by analyzing<br />
the same solution with a<br />
concentration of 200 ppb vl nine<br />
times [vl: concentratation of<br />
MTBE in the liquid phase].<br />
100 1000<br />
Concentration / ppb vg<br />
Figure 4:<br />
Peak areas of the monomer, dimer and the sum of the monomer and<br />
dimer ions vs the concentrations of the MTBE test gas samples in<br />
ppb vg (MCC- 63 Ni-IMS)<br />
Table 3:<br />
Polynomial functions and correlation coefficients of the calibration<br />
curves (see figure 4) for the peak areas of monomer, dimer and the<br />
sum of the monomer and dimer ions of MTBE test gas<br />
Function: y=A+B1*x+B2*x 2<br />
Monomer peak area<br />
Dimer peak area<br />
Sum of both<br />
Table 4:<br />
Peak areas and relative standard deviations (RSD) for a concentration<br />
of 200 ppb vl<br />
MTBE in water (the extraction of the substances was<br />
performed in the gas phase over the water (head space) and directly in<br />
the aqueous phase)<br />
Measurement Gas phase Aqueous phase<br />
1<br />
0.03<br />
0.07<br />
2<br />
0.03<br />
0.07<br />
3<br />
0.03<br />
0.07<br />
4<br />
0.04<br />
0.05<br />
5<br />
6<br />
7<br />
8<br />
9<br />
Mean value<br />
RSD (%)<br />
-4.38<br />
-6.46<br />
-4.09<br />
0.04<br />
0.04<br />
0.03<br />
0.03<br />
0.04<br />
0.03<br />
8.9<br />
B1<br />
2.26<br />
3.37<br />
2.07<br />
continuous and constant gas flow of 50 mL of<br />
nitrogen (5.0, 99,999%, Messer Griesheim,<br />
Dortmund, Germany) through the membrane<br />
transported the extracted analytes to the valve.<br />
Copyright © 2000 by International Society for Ion Mobility Spectrometry<br />
A<br />
B2<br />
-0.34<br />
-0.50<br />
-0.36<br />
0.07<br />
0.05<br />
0.07<br />
0.05<br />
0.05<br />
0.06<br />
11.5<br />
Correlation<br />
coefficient<br />
0.986<br />
0.991<br />
0.847<br />
Results and Discussion<br />
Calibration of the 63 Ni-IMS using<br />
the permeation system:<br />
A single spectrum of the<br />
positive ions of MTBE displayed<br />
in figure 2 is showing two sharp<br />
peaks with reduced mobilities of<br />
1.72 and 1.45 cm 2 /Vs.<br />
Analogous to ethers, esters,<br />
ketones and alcohols to form<br />
monomer and dimer ions, the<br />
peaks can be ascribed to be the<br />
peaks is equivalent to the sum of<br />
the functions for the monomer<br />
and dimer ions. Corresponding to<br />
what is shown in the 2D-graphs,<br />
for low concentrations the area of<br />
the monomer peak is larger than<br />
for the dimer one. This changes<br />
when the concentration of the<br />
substance is higher than 350 ppb vg,<br />
and the area of the dimer ion peak<br />
increased while the amount of<br />
monomer ions seems to be nearly<br />
constant. The minimum detectable<br />
limit (MDL) is lower than 160 ppb vg<br />
(figure 4) and the saturation level is<br />
reached at a 1.5 ppm vg.<br />
Calibration of the 63 Ni-IMS for the<br />
detection of MTBE in water:<br />
For the detection of MTBE directly in<br />
water and in the head space over the<br />
contaminated water, the<br />
reproducibility was determined<br />
analyzing the same solution with a<br />
concentration of 200 ppb vl nine<br />
times. The results for the sum of the monomer<br />
and dimer peak areas as well as the mean<br />
values and the relative standard deviations<br />
(RSD) are summarized in table 4. For the gas
Z. Xie et al.: „A novel method for the detection of MTBE...”, IJIMS 4(2000)1, 77-83, p. 81<br />
Signal Area / a.u.<br />
Signal Area / a.u.<br />
0.1<br />
0.01<br />
Signal / a.u.<br />
RIP<br />
Head space<br />
50 ppb vl -0.1<br />
750 ppb vl<br />
MIP<br />
0.0<br />
-0.06<br />
DIP<br />
15 20 25<br />
MIP<br />
RIP<br />
Drift Time / ms<br />
-0.03<br />
0.00<br />
15 20 25<br />
Figure 5:<br />
Peak areas as the sum of the monomer and dimer ions vs the<br />
concentrations of MTBE in water extracted directly from the gas phase<br />
over the water (head space)<br />
RIP: reactant ion peak, MIP: monomer ion peak, DIP: dimer ion peak<br />
0.1<br />
0.01<br />
Signal / a.u.<br />
-0.10<br />
-0.05<br />
0.00<br />
RIP<br />
phase (head space) the RSD was about 9 %,<br />
for the aqueous phase about 12 %, which is<br />
rather low. Thus, the extraction process can be<br />
regarded as a reproducible step for both<br />
phases.<br />
The calibration curve in figure 5 shows the<br />
result of the extraction of MTBE out of the gas<br />
Copyright © 2000 by International Society for Ion Mobility Spectrometry<br />
100 1000<br />
Concentration / ppbvl<br />
Aqueous Matrix<br />
Signal / a.u.<br />
50 ppb vl<br />
MIP<br />
750 ppb vl<br />
20 25<br />
DIP<br />
-0.050 RIP<br />
Drift Time / ms<br />
MIP<br />
-0.025<br />
0.000<br />
20 25<br />
Drift Time / ms<br />
Drift Time / ms<br />
100 1000<br />
Concentration / ppbvl<br />
Figure 6:<br />
Peak areas as the sum of the monomer and dimer ions vs the<br />
concentrations of MTBE in water extracted directly from the aqueous<br />
phase - RIP: reactant ion peak, MIP: monomer ion peak,<br />
DIP: dimer ion peak<br />
Signal / a.u.<br />
phase (head space) over<br />
the surface of water<br />
containing different<br />
concentrations (50 up to<br />
750 ppb vl) of MTBE. Single<br />
Spectra are displayed for<br />
the lowest and highest<br />
measured concentration.<br />
The illustrated curve<br />
shows the sum of the<br />
monomer and dimer peak<br />
areas, and just as for the<br />
calibration curves for the<br />
test gas measurements a<br />
polynomial function was<br />
used (table 5). As<br />
demonstrated in the<br />
graph, 50 ppb vl was the<br />
lowest detectable<br />
concentration of MTBE in<br />
water.<br />
Larger<br />
concentrations than 750<br />
ppb vl have not been<br />
investigated.<br />
For the extraction of<br />
MTBE directly out of water<br />
the calibration curve for the<br />
sum of the monomer and<br />
dimer peak area and the<br />
graphs for concentrations of<br />
50 and 750 ppb vl are shown if<br />
figure 6. The minimum<br />
detectable limit is as for the<br />
extraction out of the head<br />
space about 50 ppb vl and also<br />
the correlation coefficient for<br />
the polynomial function is with<br />
0.996 similar to the one<br />
achieved for the head space<br />
measurements.<br />
A comparison (figure 7) of the<br />
calibration curves for the<br />
aqueous matrix and the head<br />
space exhibits larger peak<br />
areas for the direct extraction<br />
of MTBE out of water,<br />
whereby the calibration curve<br />
for the extraction from the<br />
aqueous matrix reached a saturation level. For<br />
further measurements, the membrane will be<br />
introduced completely into the aqueous matrix.<br />
With the set up system it is possible to detect<br />
MTBE in aqueous as well as in gaseous<br />
environmental matrices. With the possibility to
Z. Xie et al.: „A novel method for the detection of MTBE...”, IJIMS 4(2000)1, 77-83, p. 82<br />
use the extraction unit also as a<br />
flow through unit, the system can<br />
be applied for a nearly continuous<br />
monitoring e.g. of groundwater,<br />
so that sudden appearance of<br />
contaminations or changes in the<br />
concentration can be detected<br />
immediately. Also, the connection<br />
with the MCC should enable a<br />
separation of MTBE and different<br />
by-products, e.g. Benzene or<br />
other gasoline components, which<br />
will be investigated in the future.<br />
Signal Area / a.u.<br />
0,1<br />
0,01<br />
MTBE<br />
Aqueous Matrix<br />
Head space<br />
Conclusion<br />
It has been demonstrated that the<br />
63<br />
Ni-IMS coupled to a MCC is a<br />
fast (time of analysis of a few<br />
seconds) and a sensitive<br />
(detection limit about 50 ppb vl of<br />
MTBE in water) method for the<br />
detection of the gasoline additive<br />
MTBE, which provides in addition<br />
with the membrane extraction unit<br />
the advantage of on-line and on-site<br />
measurements.<br />
Acknowledgments<br />
The financial support of the<br />
Bundesministerium für Bildung und<br />
Forschung and the Ministerium für<br />
Schule, Wissenschaft und Forschung<br />
des Landes Nordrhein-Westfalen are<br />
gratefully acknowledged. The first impulse to<br />
detect MTBE using IMS by Peter Popp,<br />
Department of Analytical Chemistry of the UFZ<br />
Centre for Environmental Research<br />
Leipzig-Halle should be mentioned thankfully.<br />
References<br />
[1] Agency, U. S. E. P. MTBE Fact Sheet 2 January<br />
1998, EPA 510-F-97-015, 1-5.<br />
[2] Agency, U. S. E. P. MTBE Fact Sheet 3 January<br />
1998, EPA 510-F-97-014, 1-3.<br />
[3] Agency, U. S. E. P. MTBE Fact Sheet 1 January<br />
1998, EPA 510-F-97-014, 1-5.<br />
[4] Prazen, B. J.; Bruckner, C. A.; Synovec, R. E.;<br />
Kowalski, B. R. Anal. Chem. 1999, 71, 1093-1099.<br />
[5] Quach, D. T.; Ciszkowski, N. A.; Finlayson, B. J. J.<br />
Chem. Educ. 1998, 75, 1595-1598.<br />
[6] Cassada, D. A.; Zhang, Y.; Snow, D. D.; Spalding, R.<br />
F. Anal. Chem. 2000, 72, 4654-4658.<br />
[7] Miller, M. E.; Stuart, J. D. Anal. Chem. 2000, 72,<br />
622-625.<br />
Table 5:<br />
Polynomial functions and correlation coefficients of the<br />
calibration curves (see figures 5 and 6) for the peaks areas<br />
(as a sum of the monomer and dimer ions) for MTBE<br />
extracted from the head space and the aqueous phase<br />
Function: y=A+B1*x+B2*x 2<br />
Head space<br />
Aqueous phase<br />
100 1000<br />
Concentration / ppb<br />
Figure 7:<br />
Comparison of the peak areas (sum of the monomer and<br />
dimer ions) vs the concentrations of MTBE in water extracted<br />
from the gas phase over the water (head space) and the<br />
aqueous phase<br />
A<br />
-3.44<br />
-4.65<br />
B1<br />
1.11<br />
2.20<br />
B2<br />
-0.10<br />
-0.32<br />
[8] Choquette, S. J.; Chesler, S. N.; Duewer, D. L.;<br />
Wang, S.; O'Haver, T. C. Anal. Chem. 1996, 68,<br />
3525-3533.<br />
[9] Hansen, S.; Berg, R. W.; Stenby, E. H. Asian<br />
Chemical Letter 2000, 4, 65-74.<br />
Correlation<br />
coefficient<br />
0.999<br />
0.996<br />
[10] Cohen, M. J.; Karasek, F. W. J. Chromatogr. Sci.<br />
1970, 8, 330-337.<br />
[11] Karasek, F. W. Anal. Chem. 1971, 43, 1982-1986.<br />
[12] Baumbach, J. I.; Eiceman, G. A. Appl. Spectrosc.<br />
1999, 53, 338A-355A.<br />
[13] Sielemann, S.; Soppart, O.; Baumbach, J. I.; v.Irmer,<br />
A.; Walendzik, G.; Klockow, D. Recycling Waste<br />
Management Remediation of Contaminated Sites<br />
1995, 8.<br />
[14] Sielemann, S.; Baumbach, J. I.; Eiceman, G. A.;<br />
Jauzein, M.; Walendzik, G.; Klockow, D. Field<br />
Screening Europe 1997.<br />
[15] Sielemann, S.; Baumbach, J. I.; Pilzecker, P.;<br />
Walendzik, G. Int. J. Ion Mobility Spectrom. 1999, 2,<br />
15-21.<br />
[16] Leonhardt, J. W.; Bensch, H.; Berger, D.; Nolting, M.;<br />
Baumbach, J. I. 3rd International Workshop on IMS,<br />
Galveston, TX, Oct. 16-19, 1994 1994, 49-56.<br />
Copyright © 2000 by International Society for Ion Mobility Spectrometry
Z. Xie et al.: „A novel method for the detection of MTBE...”, IJIMS 4(2000)1, 77-83, p. 83<br />
[17] Eiceman, G. A.; Snyder, A. P.; Blyth, D. A. Int. J.<br />
Environ. Anal. Chem. 1989, 38, 415-425.<br />
[18] Eiceman, G. A.; Karpas, Z. CRC Press, Boca Raton,<br />
Ann Arbor, London, Tokyo 1994, 1-228.<br />
[19] Eiceman, G. A.; Bell, S. E.; Wang, Y. F. 3rd<br />
International Workshop on IMS, Galveston, TX, Oct.<br />
16-19, 1994 1994.<br />
[20] Eiceman, G. A.; Garcia-Gonzalez, L.; Wang, Y. F.;<br />
Pittman, B.; Burroughs, G. E. Talanta 1992, 39,<br />
459-467.<br />
[21] Karasek, F. W.; Denney, D. W., J. Chromatogr .<br />
1974, 93, 141-146.<br />
[22] Preston, J. M.; Karasek, F. W.; Kim, S. H. Anal.<br />
Chem. 1977, 49, 1746-1750.<br />
[23] Pilzecker, P.; Baumbach, J. I.; Trindade, E. Proc. of<br />
the IEEE International Symposium on Electrical<br />
Insulation, Anaheim, April 2-5 2000.<br />
[24] Kotiaho, T.; Lauritzen, F. R.; Degn, H. Anal. Chim.<br />
Acta 1995, 309, 317-325.<br />
[25] Hatano,H.; Rokushika, S.; Ohkawa,T. Instrum. Trace<br />
Org. Monit. 1992, 27-48.<br />
[26] Bacon, A. T. Pittsburgh Conference 1992, Paper 258<br />
1992.<br />
[27] Lawrence, A. H.; Barbour, R. J.; Sutcliffe, R. Anal.<br />
Chem. 1991, 63, 1217-1221.<br />
[28] Aleksander, J. J. Chromatogr. Sci. 1976, 14, 589.<br />
[29] Golay, M. J. E. Chromatographia 1975, 8, 421.<br />
[30] Hawkes, S. J. J. Chromatogr. Sci. 1977, 15, 89.<br />
[31] Pierce, H. D.; Unrau, J. A. M.; Oelschlager, A. C.;<br />
Cutteridge, A. M. J. Chromatogr. Sci. 1979, 17, 297.<br />
[32] Schmitt, V. O.; Pereiro, I. R.; Lobinski, R. Anal.<br />
Commun. 1997, 34, 141-143.<br />
[33] Baumbach, J. I.; Eiceman, G. A.; Klockow, D.;<br />
Sielemann, S.; Irmer, A. v. Int. J. Environ. Anal.<br />
Chem. 1997, 66, 225-239.<br />
[34] Baumbach, J. I.; Sielemann, S.; Soppart, O. Fifth Int.<br />
Workshop on IMS, Jackson, Wyoming 1996, 431-436.<br />
[35] Wan, C.; Harrington, P.; Davis, D. M. Talanta 1998,<br />
46, 1169-1179.<br />
[36] Yang, M. J.; Pawliszyn, J. Anal. Chem. 1993, 65,<br />
1758-63 CODEN ANCHAM; ISSN 0003-2700.<br />
[37] Wong, P. S. H.; Cooks, R. G.; Cisper, M. E. Environ.<br />
Sci. Technol. 1995, 29, 215-218.<br />
[38] Spangler, G. E.; Carrico, J. P. Int. J. Mass Spectrom.<br />
Ion Phys. 1983, 52, 267-287.<br />
[39] Silvon, L. E.; Bauer, M. R.; Ho, J. S.; Budde, W. L.<br />
Anal. Chem. 1991, 63, 1335-1340.<br />
[40] Slivon, L. E.; Ho, J. S.; Budde, W. L. ACS Symp. Ser.<br />
1992, 508, 169-77 CODEN ACSMC8; ISSN<br />
0097-6156.<br />
[41] Rautenbach, R.; Welsch, K. J. Membrane Sci. 1994,<br />
87, 107-118.<br />
[42] Pratt, K. F.; Pawliszin, J. Anal. Chem. 1992, 64,<br />
2101-2106.<br />
[43] Motomizu, S.; Yoden, T. Anal. Chim. Acta 1992, 261,<br />
461-469.<br />
[44] Marquardt, K. Stuttg. Ber. Abfallwirtsch. 1987, 24,<br />
187-234.<br />
[45] Kotiaho, T.; Ketola, R. A.; Ojala, M. Am. Environ. Lab.<br />
1997, 9, 19--21.<br />
[46] Hauser, B.; Popp, P.; Paschke, A. Int. J. Environm.<br />
Anal. Chem. 1999, 74, 107-121.<br />
[47] Harland, B. J.; Nicholson, P. J. D.; Gillings, E. Water<br />
Res. 1987, 21, 107-13 CODEN WATRAG; ISSN<br />
0043-1354.<br />
[48] Blanchard, J. B.; Hardy, J. K. Anal. Chem. 1986, 58,<br />
1529-1532.<br />
[49] Siems, W. F.; Wu, C.;<br />
Tarver, E. E.; Hill, H. H. Anal. Chem. 1994, 66,<br />
4195-4201.<br />
[50] Rokushika, S.; Hatano, H.; Baim, M. A.; Hill, H. H. J.<br />
Anal. Chem. 1985, 57, 1902-1907.<br />
[51] Wu, C.; Siems, W. F.; Asbury, G. R.; Hill, H. H. Anal.<br />
Chem. 1998, 70, 4929-4938.<br />
Copyright © 2000 by International Society for Ion Mobility Spectrometry
Finalisation of a IUPAC/JCAMP-DX data transfer<br />
standard for ion mobility spectrometry data<br />
A.N. Davies*, J.I.Baumbach, P. Lampen, H. Schmidt<br />
ISAS, Institute of Spectrochemistry and Applied Spectroscopy, Bunsen-Kirchhoff-Str.11, Postfach 10 13 52, 44013<br />
Dortmund, Germany<br />
ABSTRACT<br />
In the last few years the rapid developments in<br />
the field of ion-mobility spectrometry many<br />
several different sites around the world has<br />
made it imperative to establish an agreed<br />
protocol for the storage and exchange of<br />
experimental data. Under the auspices and<br />
guidance of IUPAC through the Working Party<br />
on Spectroscopic Data Standards (JCAMP-DX)<br />
and the development work of the members of<br />
the International Society for Ion Mobility<br />
Spectrometry such a standard has been<br />
developed which is now in it’s final stages. It<br />
will be published as the Appendix to this paper<br />
and placed on the IUPAC web sites for final<br />
comment. An example of the usefulness of<br />
these standards as chemical MIME types for<br />
the display of spectroscopic data on the web<br />
will be described and an example is available<br />
for viewing on the JCAMP-DX web site as well<br />
as the web site of the ISIMS.<br />
INTRODUCTION<br />
The ability to compare and contrast<br />
experimental data is a pre-requisite in a<br />
modern rapidly developing field like ion-mobility<br />
spectrometry. Although the exchange of the<br />
data points via spreadsheet programs or simple<br />
x-y ASCII tables is possible it is often only the<br />
inclusion of subsidiary supporting information<br />
which makes a data file valuable. Work on this<br />
critical data dictionary has been ongoing for<br />
several years including presentations at<br />
international conferences in order to gain the<br />
widest possible input and has been reported<br />
previously in this journal . The drafts have also<br />
been available for comment on the Web site of<br />
the co-ordinating IUPAC working party. It was<br />
decided that the form which the standard<br />
should take was to follow the successful ASCII<br />
data exchange protocols of the Joint<br />
Committee on Atomic and Molecular Physical<br />
Data commonly known as the JCAMP-DX<br />
standards. These standards have also been<br />
adopted for use for the transport and display of<br />
spectroscopic data on the Internet as the<br />
Chemical Multipurpose Internet Mail Extension<br />
or Chemical MIME type and examples of their<br />
implementation are described below.<br />
The development of a JCAMP-DX standard file<br />
format for Ion Mobility Spectrometry (IMS)<br />
follows the development and implementation of<br />
such standards for Infrared Spectroscopy in<br />
1988 , Chemical Structures in 1991 , Nuclear<br />
Magnetic Resonance Spectrometry (NMR) in<br />
1993 and Mass Spectrometry in 1994 .<br />
Following the transfer of responsibility of the<br />
development and maintenance of these<br />
standards to the International Union of Pure<br />
and Applied Chemistry (IUPAC) a new<br />
extension to the protocols which includes<br />
additional standardisation of audit trail<br />
information and a long date format as well as<br />
new NMR labels was published in 1999 .<br />
RESULTS<br />
The results of the work to date can be seen in<br />
the appendix which forms the final draft of the<br />
standard protocol and is reproduced here to<br />
encourage last-minute comments or corrections<br />
before being adopted as a IUPAC<br />
Recommendation in 2001.<br />
The appendix comes with the usual warnings in<br />
that this has currently the status of a final draft<br />
for comment only and should under no account<br />
be implemented by manufacturers or end users<br />
until the final document is adopted by IUPAC in<br />
the Spring of 2001.<br />
Copyright © 2000 by International Society for Ion Mobility Spectrometry
A.N. Davies et al.: „Finalisation of a IUPAC/JCAMP-DX...”, IJIMS 4(2001)1,84-108, p. 85<br />
Figure 11:<br />
An IMS JCAMP-DX spectroscopic data file displayed directly<br />
Use in building Web Pages<br />
The use of JCAMP-DX spectroscopic data files<br />
within the environment of a web page has been<br />
described elsewhere and there are some<br />
excellent examples authored by the pioneer of<br />
this method of publishing spectroscopic data,<br />
Robert Lancashire, on the web site of the<br />
University of West Indies, Jamaica and can be<br />
viewed under the URL:<br />
http://wwwchem.uwimona.edu.jm:1104/spectra/<br />
chime/chime.html. Much<br />
information is available on the<br />
pages on this site. In order to<br />
use the Chemical MIME types it<br />
is necessary to have your web<br />
browser enabled for these<br />
chemical file formats and this<br />
can be easily achieved by<br />
installing the CHIME plug-in<br />
freely available from the web<br />
site of MDL Informations<br />
systems Inc. at<br />
http://www.mdli.com/download/<br />
chime/index.html. Further links<br />
for test sites for other chemical<br />
data MIME types are also to be<br />
found at the home page of the<br />
IUPAC Working Party at<br />
http://jcamp.isas-dortmund.de.<br />
Figure 1 shows an example of<br />
an ion mobility spectrometry<br />
data set in the draft file format displayed in a<br />
web browser with the CHIME plug-in installed.<br />
The data is not displayed a fixed graphic file but<br />
as real data and as such may be analysed<br />
more closely by zooming or rescaling for<br />
example. The spectrum is loaded directly into<br />
the browser from the JCAMP-DX file.<br />
In a more creative use of the options available<br />
for implementing JCAMP-DX files into HTML<br />
pages for display on the internet one of the<br />
early examples created by<br />
Robert Lancashire has been<br />
adapted to display the same<br />
file as shown in figure 1 but<br />
this time the chemical<br />
structure is also displayed as<br />
well as some explanatory text.<br />
The graphic shown in Figure 2<br />
is also available ‘live’ following<br />
the IMS links on the IUPAC<br />
working party home page.<br />
Figure 12:<br />
An IMS file this time displayed as part of an HTML web page<br />
including additional explanatory text and the associated chemical<br />
structure.<br />
CONCLUSIONS<br />
As has been described above<br />
the new file format for ion<br />
mobility spectrometry has now<br />
been all but completed. This<br />
short article is intended<br />
principally to encourage any<br />
last-minute requests for<br />
changes and to show some of<br />
the possible uses to which the<br />
new format can be put once it<br />
Copyright © 2000 by International Society for Ion Mobility Spectrometry
A.N. Davies et al.: „Finalisation of a IUPAC/JCAMP-DX...”, IJIMS 4(2001)1,84-108, p. 86<br />
has been officially adopted by IUPAC in the<br />
Spring of 2001.<br />
Acknowledgments<br />
The financial support of the Bundesministerium<br />
für Bildung, Wissenschaft, Forschung und<br />
Technologie and the Ministerium für<br />
Wissenschaft und Forschung des Landes<br />
Nordrhein-Westfalen is gratefully acknowledged.<br />
REFERENCES<br />
[1] J.I. Baumbach, P. Lampen and A.N. Davies, IUPAC /<br />
JCAMP-DX: An International Standard for the<br />
Exchange of Ion Mobility Spectrometry Data.<br />
International Journal for Ion Mobility Spectrometry,<br />
1998, 1(1) p.64-67.<br />
[2] R.S. McDonald and P.A. Wilks Jr., JCAMP-DX: A<br />
Standard Form for Exchange of Infrared Spectra in<br />
Computer Readable Form. Applied Spectroscopy,<br />
1988, 42(1) p.151-162.<br />
[3] J. Gasteiger, et al., JCAMP-CS: A Standard<br />
Exchange Format for Chemical Structure Information<br />
in Computer-Readable Form. Applied Spectroscopy,<br />
1991 45(1) p.4-11.<br />
[4] A.N. Davies and P. Lampen, JCAMP-DX for NMR.<br />
Applied Spectroscopy, 1993 47(8) p.1093-1099.<br />
[5] P. Lampen, H. Hillig, A.N. Davies and M. Linscheid,<br />
JCAMP-DX for Mass Spectrometry. Applied<br />
Spectroscopy, 1994 48(12) p.1545-1552.<br />
[6] P. Lampen, et al., An Extension to the JCAMP-DX<br />
Standard File Format, JCAMP-DX V.5.01. Pure and<br />
Applied Chemistry, 1999 71(8) p.1549-1556.<br />
Copyright © 2000 by International Society for Ion Mobility Spectrometry
J.I. Baumbach, A.N. Davies, P. Lampen, H. Schmidt - JCAMP-DX for Ion Mobility Spectrometry<br />
Draft manuscript for Pure and Applied Chemistry<br />
INTERNATIONAL UNION OF PURE<br />
AND APPLIED CHEMISTRY<br />
COMMITTEE ON PRINTED AND<br />
ELECTRONIC PUBLICATIONS<br />
Working Party on Spectroscopic Data Standards (JCAMP-DX)<br />
JCAMP-DX – A Standard Format for<br />
the Exchange of Ion Mobility<br />
Spectrometry Data<br />
(IUPAC Recommendations 2000)<br />
Prepared for publication by<br />
Jörg Ingo Baumbach * , Antony N. Davies, Peter Lampen,<br />
Hartwig Schmidt<br />
ISAS, Inst. für Spektrochemie und Angewandte Spektroskopie, Bunsen-Kirchhoff-Str.11, 44139 Dortmund,<br />
Germany<br />
* Author to whom comments should be sent.<br />
Members of the International Society for Ion Mobility Spectrometry Working Party, IUPAC Working Party on<br />
Spectroscopic Data Standards (JCAMP-DX) and others during the development of this standard:<br />
J.I. Baumbach, O. Soppart, A. Von Irmer, A.N. Davies, T. Fröhlich, P. Lampen, R. Lancashire,<br />
R.S. McDonald, P.S. McIntyre, D.N. Rutledge, G.A. Eiceman, H.H. Hill<br />
Thursday, December 5, 2000 ims dx 5g.doc Page 1 of 22
J.I. Baumbach, A.N. Davies, P. Lampen, H. Schmidt - JCAMP-DX for Ion Mobility Spectrometry<br />
Draft manuscript for Pure and Applied Chemistry<br />
JCAMP-DX – A Standard Format for<br />
the Exchange of Ion Mobility<br />
Spectrometry Data<br />
J.I. Baumbach, A.N. Davies, P. Lampen, H. Schmidt<br />
Institut für Spektrochemie und Angewandte Spektroskopie,<br />
Bunsen-Kirchhoff-Str. 11, 44139 Dortmund, Germany<br />
ABSTRACT<br />
The relatively young field of ion mobility spectrometry has now advanced to the stage where<br />
the need to reliably exchange the spectroscopic data obtained world-wide by this technique<br />
has become extremely urgent. To assist in the validation of the various new spectrometer<br />
designs and to assist in inter-comparisons between different laboratories reference data<br />
collections are being established for which an internationally recognized electronic data<br />
exchange format is essential.<br />
To make the data exchange between users and system administration possible, it is important<br />
to define a file format specially made for the requirements of ion mobility spectrometry. The<br />
format should be computer readable and flexible enough for extensive comments to be<br />
included. In this document we define a data exchange format, agreed on a working group of<br />
the International Society for Ion Mobility Spectrometry at Hilton Head Island (1998) and<br />
Buxton U.K. (1999).<br />
This definition of this format is based on the IUPAC JCAMP-DX protocols, which were<br />
developed for the exchange of infrared spectra [1] and extended to chemical structures [2],<br />
nuclear magnetic resonance data [3] and mass spectra [4]. This standard of the Joint<br />
Committee on Atomic and Molecular Physical Data is of a flexible design. The International<br />
Union of Pure and Applied Chemistry have taken over the support and development of these<br />
standards and recently brought out an extension to cover year 2000 compatible date strings<br />
and good laboratory practice [5]. The aim of this paper is to adopt JCAMP-DX to the special<br />
requirements of ion mobility spectra [6].<br />
KEY WORDS<br />
Data exchange, ion mobility spectrometry, JCAMP-DX, data standards<br />
Thursday, December 5, 2000 ims dx 5g.doc Page 2 of 22
J.I. Baumbach, A.N. Davies, P. Lampen, H. Schmidt - JCAMP-DX for Ion Mobility Spectrometry<br />
Draft manuscript for Pure and Applied Chemistry<br />
1 INTRODUCTION<br />
JCAMP-DX is an electronic file based format using ASCII characters (American Standard<br />
Code of Information Interchanging) reduced to the printable character. This guarantees the<br />
acceptance on all computer systems. The main components to describe the ion mobility<br />
spectrometer (IMS) and the spectra are shown in Figure 1.<br />
##.carrier gas=<br />
##sample description=<br />
##cas name=<br />
##cas registry no=<br />
##concentrations=<br />
##.reduced mobility=<br />
##.electric field=<br />
##.ionization chamber=<br />
##.ionization mode=<br />
##.ionization energy=<br />
##.ims temperature=<br />
##.ims pressure=<br />
##.drift gas=<br />
##.drift chamber=<br />
##.repetition rate=<br />
Figure 1. The main ion mobility spectrometry specific and generic terms to be stored in a<br />
JCAMP-DX data file are shown here.<br />
2 DEFINITIONS<br />
The following definitions are important for the understanding of the JCAMP-DX protocol:<br />
2.1 Labeled-Data-Records<br />
Labeled-Data-Records (LDR) consist of a flagged data-label and an associated data-set. An<br />
LDR begins with a data-label-flag (##) and ends with the next data-label-flag. LDRs are<br />
divided into lines of 80 or fewer characters, terminated by . End-of-line is equivalent<br />
to a blank, except for certain special cases. Each LDR occupies as many lines as necessary. A<br />
data-label is the name of an LDR. It is delimited by a data-label-flag (##) and a data-labelterminator<br />
(=), for example ##TITLE= is a data-label for the definition of the working title of<br />
the following spectrum. A line contains no more than one data-label. When labels are parsed,<br />
alphabetic characters are converted to upper case, and all spaces, dashes, slashes, and<br />
underlines are discarded. Thus, XUNITS and xunits are equivalent.<br />
There are two kinds of LDR: Core and Note. Core LDRs are required. Notes are optional.<br />
Every definition of an LDR should include if it is a core or a note.<br />
In part 2.2 - 2.5 we discuss the forms used for defined data-sets.<br />
Thursday, December 5, 2000 ims dx 5g.doc Page 3 of 22
J.I. Baumbach, A.N. Davies, P. Lampen, H. Schmidt - JCAMP-DX for Ion Mobility Spectrometry<br />
Draft manuscript for Pure and Applied Chemistry<br />
2.2 TEXT<br />
The LDR contain descriptive information for humans, not normally intended to be parsed by<br />
computers, i.e., title, comments, origin, etc.<br />
2.3 STRING<br />
Some LDR contain predefined text fields intended to be parsed by computers and read by<br />
humans. The format of each string field is specified under the LDR in which it is used.<br />
2.4 AFFN<br />
The easiest way to write the data is to use the ASCII free format numeric. This format is<br />
important to simplify direct user input. It is a format similar to freeform input in BASIC. A<br />
field starts either with +, -, decimal point or digit. E is the only allowed character to give the<br />
power of 10 by which the field must be multiplied. It is followed by + or - and two or three<br />
digits. The numeric field is terminated either by E, comma or blank.<br />
2.5 ASDF<br />
This is the ASCII squeezed difference form. Tabular data using JCAMP-DX data<br />
compression scheme (see section 3.4.1).<br />
2.6 Comments<br />
##=. Comments may be specified by a data-label-flag plus a data-label-terminator, with a null<br />
data-label. Such comments may continue for more than one line, terminating at the next datalabel-flag.<br />
$$. Comments may be entered at any point in a line by prefixing the first word of the<br />
comment by $$. Such comments continue only to the end of the current line, and they do not<br />
terminate an LDR.<br />
3 THE CORE<br />
This section describes the data labels for the JCAMP-DX core data.<br />
The Core consists of four parts. The first part, called the 'Fixed Header Information', contains<br />
generic LDRs which are required for all JCAMP-DX files and which appear at the beginning<br />
of each file in a given order. The 'Variable Header Information' contains records which are<br />
data type specific (in this case IMS specific) or which are only used in special types of<br />
JCAMP-DX files (e.g. compound files). Whether a particular is required or not depends on<br />
the application. The third section 'Core Data' contains the relevant parameters for the fourth<br />
section the 'Data Table'. The type of data in the data table determines the parameters which<br />
must appear in the core data. Only one data table may appear per JCAMP-DX block (a block<br />
being a part of the JCAMP-DX file starting with ##TITLE= and ending with ##END=).<br />
Thursday, December 5, 2000 ims dx 5g.doc Page 4 of 22
J.I. Baumbach, A.N. Davies, P. Lampen, H. Schmidt - JCAMP-DX for Ion Mobility Spectrometry<br />
Draft manuscript for Pure and Applied Chemistry<br />
3.1 Core Fixed Header Information<br />
3.1.1 ##TITLE= (TEXT)<br />
Title and/or reason of the measurement.<br />
(Required)<br />
3.1.2 ##JCAMP-DX= (STRING)<br />
The version number of this protocol is 5.01. A description of the software used to generate<br />
the file follows the version number as a comment.<br />
For example:<br />
##JCAMP-DX= 5.01 $$ JCAMP-DX for IMS (NT4 version 1.0 ISAS Germany)<br />
(Required)<br />
3.1.3 ##DATA TYPE= (STRING)<br />
Keywords:<br />
ION MOBILITY SPECTRUM or<br />
IMS PEAK TABLE or<br />
IMS PEAK ASSIGNMENTS or<br />
LINK<br />
Distinguishes between different kinds of spectra such as IMS-, NMR- or IR-data. The string<br />
ION MOBILITY SPECTRUM reports a continuous spectrum located at the ##XYDATA=<br />
LDR and IMS PEAK ASSIGNMENTS reports distinct and analyzed peaks located in the<br />
##PEAK ASSIGNMENTS= LDR.<br />
(Required)<br />
3.1.4 ##DATA CLASS= (STRING)<br />
Keywords:<br />
XYDATA or<br />
XYPOINTS or<br />
PEAK TABLE or<br />
ASSIGNMENTS<br />
This label defines the type of tabular data within the data block and is not to be used for link<br />
blocks.<br />
(Required)<br />
3.1.5 ##ORIGIN= (TEXT)<br />
Here the name of organization, address, telephone number, name of individual contributor,<br />
email, etc., as appropriate must be added. This information is not optional.<br />
(Required)<br />
Thursday, December 5, 2000 ims dx 5g.doc Page 5 of 22
J.I. Baumbach, A.N. Davies, P. Lampen, H. Schmidt - JCAMP-DX for Ion Mobility Spectrometry<br />
Draft manuscript for Pure and Applied Chemistry<br />
3.1.6 ##OWNER= (TEXT)<br />
It is possible to set here a copyright linked to the spectrum that has the form: "COPYRIGHT<br />
(C) by ". If ##OWNER= contains "PUBLIC DOMAIN", the implication is<br />
that the data may be copied without permission on the authority of whoever is named under<br />
##ORIGIN=<br />
(Required)<br />
3.1.7 ##END=<br />
It is important to have a mark at the end of file in the data format to know that transfer has<br />
been complete and to distinguish between the blocks of a multi spectrum file.<br />
(Required)<br />
3.2 CORE VARIABLE HEADER INFORMATION<br />
The JCAMP-DX standard is easy to understand and expand. Many LDRs are already defined<br />
in previous JCAMP-DX protocols and they should be used for Ion Mobility Spectrometry.<br />
However, in the case of the equipment parameters the particular requirements of this<br />
technique call for some special LDRs. Data-type specific LDRs start with "##." (see 4.2<br />
below). In the following part definitions are given for LDRs which will allow a precise<br />
description of the equipment parameters.<br />
3.2.1 ##BLOCKS= (AFFN) and ##BLOCK_ID= (AFFN)<br />
Blocks are used as suggested in the JCAMP-DX 4.24 protocol (3.2) [1] with the extensions<br />
defined in the JCAMP-CS protocol (5.13) [2] to provide inter-block referencing.<br />
For ease of use it is recommended to use separate files and to avoid the use of blocks.<br />
However, when, for example, XYDATA and a PEAKTABLE must be stored in the same file,<br />
these must be written as a compound file [1]. The use of compound data files is, of course,<br />
optional but when more than one block per file is stored the ##BLOCKS= LDR has the<br />
priority REQUIRED.<br />
A compound JCAMP-DX file consists of a LINK block (##DATA TYPE=LINK)<br />
surrounding the DATA blocks and the total number of DATA blocks (N) must appear in the<br />
LINK block header (##BLOCKS=N). A unique positive integer (n) should be assigned to<br />
each DATA block inside the compound file (##BLOCK_ID=n) . Linking of the blocks can<br />
then be achieved using ##CROSS REFERENCE= (see example 1). These records are to be<br />
used in compound JCAMP-DX files to provide inter-block referencing.<br />
(Required only for compound files)<br />
EXAMPLE 1.<br />
##TITLE= example compound data file $$ title of the whole compound file<br />
##JCAMP-DX= 5.01<br />
$$ Name & Version No. of JCAMP-DX software<br />
##DATA TYPE= LINK<br />
##BLOCKS= 2<br />
$$ number of data blocks<br />
##ORIGIN=<br />
$$ name of contributor, organization, address, telephone etc.<br />
##OWNER=<br />
$$ COPYRIGHT (C)’year’ by ‘name’ or PUBLIC DOMAIN<br />
##TITLE=<br />
$$ title of the first data block<br />
##JCAMP-DX= 5.01<br />
##DATA TYPE= ION MOBILITY SPECTRUM<br />
Thursday, December 5, 2000 ims dx 5g.doc Page 6 of 22
J.I. Baumbach, A.N. Davies, P. Lampen, H. Schmidt - JCAMP-DX for Ion Mobility Spectrometry<br />
Draft manuscript for Pure and Applied Chemistry<br />
##DATA CLASS= XYDATA<br />
##BLOCK_ID= 1<br />
##ORIGIN=<br />
$$ name of contributor, organization, address, telephone etc.<br />
##OWNER=<br />
$$ COPYRIGHT (C)’year’ by ‘name’ or PUBLIC DOMAIN<br />
##CROSS REFERENCE= IMS PEAK TABLE:BLOCK_ID=2<br />
. . .<br />
##END= $$ end of first data block<br />
##TITLE=<br />
$$ title of the second data block<br />
##JCAMP-DX= 5.01<br />
##DATA TYPE= IMS PEAK TABLE<br />
##DATA CLASS= PEAK TABLE<br />
##BLOCK_ID= 2<br />
##ORIGIN=<br />
$$ name of contributor, organization, address, telephone etc.<br />
##OWNER=<br />
$$ COPYRIGHT (C)’year’ by ‘name’ or PUBLIC DOMAIN<br />
##CROSS REFERENCE= ION MOBILITY SPECTRUM: BLOCK_ID=1<br />
. . .<br />
##END= $$ end of second data block<br />
##END= $$ end of link block and file<br />
3.2.2 ##.IMS PRESSURE= (AFFN)<br />
Pressure inside the IMS-System. (in SI units – Kilo Pascal).<br />
(Required)<br />
3.2.3 ##.CARRIER GAS= (TEXT)<br />
A description of the carrier gas is required here.<br />
(Required)<br />
3.2.4 ##.DRIFT GAS= (TEXT)<br />
A description of the drift gas is required when used in addition to the carrier gas.<br />
(Required)<br />
3.2.5 ##.ELECTRIC FIELD= (AFFN, AFFN)<br />
The electric field description is divided in two parts: The field in the ionization chamber and<br />
the one in the drift chamber (in Volt / cm) separated by commas, including the polarity (+ for<br />
positive ions detected and – for negative ions respectively).<br />
(Required)<br />
3.2.6 ##.ION POLARITY= (STRING)<br />
The polarity of the measured ions. Allowed values are POSITIVE or NEGATIVE.<br />
(Required)<br />
3.2.7 ##.IONIZATION MODE= (STRING)<br />
The following keywords define how the system ionizes the gas:<br />
UV ultraviolet source<br />
BR beta radiation source<br />
AL alpha radiation source<br />
PD partial discharge<br />
Thursday, December 5, 2000 ims dx 5g.doc Page 7 of 22
J.I. Baumbach, A.N. Davies, P. Lampen, H. Schmidt - JCAMP-DX for Ion Mobility Spectrometry<br />
Draft manuscript for Pure and Applied Chemistry<br />
CD corona discharge<br />
ESI electrospray ionization<br />
LI laser ionization<br />
LD laser desorption<br />
SY synchrotron radiation<br />
For more detailed information it is possible to give a comment like $$Ni63-source.<br />
(Required)<br />
3.2.8 ##.IMS TEMPERATURE= (AFFN[, AFFN])<br />
Here the first value is characterizing the temperature in the drift chamber, the second the<br />
temperature in the ionization chamber in °C. The second value is optional and separated by a<br />
comma.<br />
(Required)<br />
3.2.9 ##.SHUTTER OPENING TIME= (AFFN)<br />
Shutter opening time in microseconds.<br />
Without knowing the time the shutter was open it is not possible to calculate the individual<br />
mobilities.<br />
(Required)<br />
3.3 CORE DATA<br />
3.3.1 ##XUNITS= (STRING) and ##YUNITS= (STRING)<br />
Here the units of the axis can be given. The following keywords are defined:<br />
For ##XUNITS=: SECONDS, MILLISECONDS, MICROSECONDS and<br />
NANOSECONDS,<br />
For ##YUNITS=: MICROAMPERES, NANOAMPERES, and PICOAMPERES.<br />
(Required)<br />
3.3.2 ##FIRSTX= (AFFN) and ##LASTX= (AFFN)<br />
First and last actual abscissa values of ##XYDATA=. First tabulated abscissa times<br />
##XFACTOR= should equal ##FIRSTX=.<br />
(Required for ##DATA CLASS=XYDATA)<br />
3.3.3 ##FIRSTY= (AFFN)<br />
Here the actual Y-value corresponding to ##FIRSTX= is meant. ##FIRSTY= should be equal<br />
##YFACTOR= times the first Y-value in ##XYDATA=.<br />
(Required for ##DATA CLASS=XYDATA)<br />
Thursday, December 5, 2000 ims dx 5g.doc Page 8 of 22
J.I. Baumbach, A.N. Davies, P. Lampen, H. Schmidt - JCAMP-DX for Ion Mobility Spectrometry<br />
Draft manuscript for Pure and Applied Chemistry<br />
3.3.4 ##XFACTOR= (AFFN) and ##YFACTOR= (AFFN)<br />
The values of a spectrum may be converted to integer to save space and allow the DIFDUP<br />
format (see 3.4.1). It is important to select a convenient scaling to keep the file within<br />
reasonable limits but to store all significant digits. In such a case the ##XFACTOR= and<br />
##YFACTOR= LDR contain a floating point number to be multiplied by the values in<br />
##XYDATA= to arrive at the original data point value.<br />
In most cases ±32767 is sufficient, therefore this is the recommended ordinate scaling. If a<br />
larger scaling is necessary it is required to give the actual unscaled maximum and minimum<br />
of the ordinates in the records ##MAXY= and ##MINY=. This avoids a 2-byte integer<br />
overflow in the program reading the data table.<br />
For example if a Y-value with 9 significant figures (e.g. 0.002457194) needs to be converted<br />
to an integer value for ASDF coding then:<br />
a) divide by the maximum of the absolute Y-value (say 0.346299765)<br />
b) and then multiply by the largest integer value (MAXINT) necessary to place all significant<br />
figures left of the decimal point<br />
c) convert to integers<br />
for this example -<br />
Y integer =INTEGER((Y real / MAX(ABS(Y real )))*MAXINT)<br />
=INTEGER(0.002457194/0.346299765)*1.0E+11<br />
=INTEGER(709556935.4487)<br />
=709556935<br />
then ##YFACTOR= (MAX(ABS(Y real ))/MAXINT)<br />
(Required for ##DATA CLASS=XYDATA)<br />
3.3.5 ##NPOINTS= (AFFN)<br />
The numbers of points are required for all cases: IMS-peak tables, peak assignments and ion<br />
mobility spectra.<br />
(Required)<br />
3.4 CORE DATA TABLE<br />
Data must be stored in one of the following data formats (3.4.1 – 3.4.4). Only one of these<br />
formats is allowed per DATA block and the selected data table is given in the header e.g.<br />
##DATA CLASS=XYDATA.<br />
3.4.1 ##XYDATA= (AFFN or ASDF).<br />
This LDR contains a table of spectral data with abscissa values at equal intervals specified by<br />
parameters defined in section 3.3. The label is followed by a variable list,<br />
(X++(Y..Y)) where .. indicate indefinite repeat of Y-values until the end of line and ++<br />
indicates that X is incremented by (LASTX-FIRSTX)/(NPOINTS-1) between two Y-values.<br />
For discrete point the AFFN form is allowed where each Y value is written out in full. This<br />
form creates large files, but is easily human readable. The following ASDF forms produce<br />
smaller files at the cost of reduced human readability.<br />
Thursday, December 5, 2000 ims dx 5g.doc Page 9 of 22
J.I. Baumbach, A.N. Davies, P. Lampen, H. Schmidt - JCAMP-DX for Ion Mobility Spectrometry<br />
Draft manuscript for Pure and Applied Chemistry<br />
SQUEEZED FORM (SQZ)<br />
To have a better data compression it is possible to use the squeezed form (SQZ) in which the<br />
delimiter, the leading digit and sign are replaced by a pseudo-digit from Table 1.<br />
For example the Y-values 30, 32 would be represented as C0C2.<br />
DIFFERENCE FORM (DIF)<br />
For a better compression, it is possible to use the difference form (DIF) where the delimiter,<br />
leading digit and sign of the difference between adjacent values are transformed in a pseudodigit<br />
from Table 1.<br />
For example the Y-values 30, 32 would now be represented as C0K.<br />
To ensure data coding is correct a Y-value check is built-in. Each line starts with the absolute<br />
X- and Y-value, which is the same as the last calculated value of the previous line. The last<br />
line of a block of DIF data contains only the abscissa and ordinate for a Y-value check of the<br />
last ordinate.<br />
DUPLICATE SUPPRESION (DUP)<br />
Another possible variation is to include duplicate suppression (DUP) replacing two or more<br />
adjacent and identical numbers with pseudo-digits as given in Table 1. This can be used with<br />
all ASDF forms.<br />
For example 50 50 50 50 becomes E0V when combining DUP with SQZ.<br />
The best compression (but the least human-readable form) can be achieved when DIF and<br />
DUP are combined to provide the form called DIFDUP. In this format the duplicate count is<br />
obtained by counting identical differences.<br />
The example above becomes E0%%% in DIF form and E0%U in DIFDUP form.<br />
Table 1:<br />
Pseudo digits used to compress spectra data in SQZ-, DIF- and DUP-format<br />
ASCII digits 0 1 2 3 4 5 6 7 8 9<br />
Positive SQZ @ A B C D E F G H I<br />
Negative SQZ a b c d e f g h i<br />
Positive DIF % J K L M N O P Q R<br />
Negative DIF j k l m n o p q r<br />
DUP S T U V W X Y Z s<br />
Example for uncompressed data storage<br />
##TITLE= Incomplete example file for uncompressed data!<br />
..........<br />
##XUNITS= MILLISECONDS<br />
##YUNITS= NANOAMPERES<br />
##XFACTOR= 1<br />
##YFACTOR= 0.1<br />
##FIRSTX= 4<br />
##LASTX= 56<br />
##NPOINTS= 53<br />
Thursday, December 5, 2000 ims dx 5g.doc Page 10 of 22
J.I. Baumbach, A.N. Davies, P. Lampen, H. Schmidt - JCAMP-DX for Ion Mobility Spectrometry<br />
Draft manuscript for Pure and Applied Chemistry<br />
##FIRSTY= 0<br />
##XYDATA= (X++(Y..Y)<br />
4 0 0 0 0 2 4 4 4 7<br />
13 5 4 4 5 5 7 10 11 11<br />
22 6 5 7 6 9 9 7 10 10<br />
31 9 10 11 12 15 16 16 14 17<br />
40 38 38 35 38 42 47 54 59 66<br />
49 75 78 88 96 104 110 121 128<br />
##END=<br />
Example for DIFDUP-form<br />
##TITLE= Incomplete example file for DIFDUP data form!<br />
......<br />
##XUNITS= MILLISECONDS<br />
##YUNITS= NANOAMPERES<br />
##XFACTOR= 1<br />
##YFACTOR= 0.1<br />
##FIRSTX= 4<br />
##LASTX= 56<br />
##NPOINTS= 53<br />
##FIRSTY= 0<br />
##XYDATA= (X++(Y..Y)<br />
4@VKT%TLkj%J%KLJ%njKjL%kL%jJULJ%kLK1%lLMNPNPRLJ0QTOJ1P<br />
56A28<br />
##END=<br />
3.4.2 ##XYPOINTS= (AFFN)<br />
This LDR contains a table of spectral data with unequal abscissa increments. The label is<br />
followed by a variable list, (XY..XY). X and Y are separated by commas, data pairs are<br />
separated by semi-colons or blanks. This LDR should not be used for peak tables.<br />
3.4.3 ##PEAK TABLE= (STRING)<br />
It is recommended to store peak information using ##PEAK ASSIGNMENTS=, however, for<br />
backward compatibility this definition is included. This data table contains a table of peaks<br />
where the peak data starts on the following line. The label is followed by the variable list<br />
(XY) or (XYW) for peak position, intensity and width, where known, on the same line. The<br />
function used to calculate the peak width should be defined by a $$ comment in the line<br />
below the label. The peak groups are separated by semi-colon or space, components of a<br />
group are separated by commas.<br />
3.4.4 ##PEAK ASSIGNMENTS= (STRING)<br />
Variable list: (XA), (XYA) or (XYWA)<br />
Thursday, December 5, 2000 ims dx 5g.doc Page 11 of 22
J.I. Baumbach, A.N. Davies, P. Lampen, H. Schmidt - JCAMP-DX for Ion Mobility Spectrometry<br />
Draft manuscript for Pure and Applied Chemistry<br />
After this LDR a list of peaks and their assignments for each components are given in the<br />
following form:<br />
(X 1 [, Y 1 ][, W 1 ], )<br />
. . . .<br />
(X i [, Y i ][, W i ], )<br />
X and Y indicates the location and height of each peak in units given by ##XUNITS= and<br />
##YUNITS=. W stands for width in ##YUNITS= and A represents a string describing the<br />
assignment enclosed in angle brackets.<br />
The parentheses provide a start and end flag of each assignment. Square brackets indicate<br />
optional information. It is important for the technical readability to have the same format for<br />
the whole peak assignment table and describe it after the ##PEAK ASSIGNMENTS= LDR<br />
with (XA), (XYA) or (XYWA). This LDR should be followed by a comment, which gives<br />
the method of finding the peak.<br />
For example –<br />
##PEAK ASSIGNMENTS= (XYWA)<br />
(15, 20.0, 1.0 ,)<br />
(30, 40.0, 2.0,)<br />
(60, 45.0, 4.0,)<br />
......<br />
4 THE NOTES<br />
The notes portion of a JCAMP-DX file or block complements the core. Notes describe an<br />
experiment in greater detail than does ##TITLE=, including descriptions of equipment,<br />
method of observation, and data processing, as appropriate. Notes may contain information<br />
which is not found in the native file in which data is originally collected by an instrument.<br />
Notes are placed before the core data section to permit them to be viewed without listing the<br />
whole file. The contents of the notes depend on the user as well as the technique or<br />
application. Notes will vary for different samples, sites, data systems, and applications.<br />
4.1 Global Notes<br />
These have been already defined in JCAMP-DX and are common to all spectroscopy types.<br />
The file headers, spectral and sample parameters are often the same for different analytical<br />
techniques. This allows us to implement many of the standard LDRs from the existing<br />
JCAMP-DX protocols. The list given below is only a selection from those allowed. A<br />
complete list can be found in the references [1-5].<br />
At least one of the optional LDRs described in section 4.1.4 - 4.1.8 should be included in<br />
each JCAMP-DX file. This is important for later archiving as these fields will yield more<br />
detailed information on the content of the data stored than a simple ##TITLE= field.<br />
Thursday, December 5, 2000 ims dx 5g.doc Page 12 of 22
J.I. Baumbach, A.N. Davies, P. Lampen, H. Schmidt - JCAMP-DX for Ion Mobility Spectrometry<br />
Draft manuscript for Pure and Applied Chemistry<br />
4.1.1 ##LONG DATE= (STRING)<br />
Date of measurement is required by many agencies and recommended in the year 2000 form:<br />
YYYY/MM/DD [HH:MM:SS[.SSS] [±XXXX]]. YYYY is the long format of the year, MM<br />
the number of the month, DD the number of the day, HH the hour, MM the minutes, SS.SSS<br />
the seconds and fractions of a second of the measurement, ±XXXX is the difference to the<br />
UTC (e.g. +0100 is one hour difference to UTC).<br />
(Optional)<br />
4.1.2 ##SOURCE REFERENCE= (TEXT)<br />
Here an identification of the original spectrum file in native format or library name and serial<br />
number is possible for example.<br />
(Optional)<br />
4.1.3 ##CROSS REFERENCE= (TEXT)<br />
Used to link additional data for the same sample such as other types of spectra or chemical<br />
structures for example:<br />
##CROSS REFERENCE=<br />
ION MOBILITY SPECTRUM: EXTERNAL_FILE= FILENAME.DX<br />
IMS PEAK TABLE: BLOCK_ID=16<br />
STRUCTURE: BLOCK_ID=4<br />
.....<br />
(Optional)<br />
4.1.4 ##SAMPLE DESCRIPTION= (TEXT)<br />
If the sample is not a pure compound, this field should contain its description, i.e.,<br />
composition, origin, appearance, results of interpretation, etc. If the sample is a known<br />
compound, the following LDRs specify structure and properties, as appropriate.<br />
(Optional)<br />
4.1.5 ##CAS NAME= (STRING)<br />
Name according to Chemical Abstracts naming conventions as described in the CAS Index<br />
Guide is required here. Examples can be found in Chemical Abstracts indices or the Merck<br />
Index. Greek letters are spelled out, and standard ASCII capitals are used for small capitals,<br />
Sub-/Superscribts are indicated by prefixes / and /\. Example: alpha-D-glucopyranose, 1-<br />
(dihydrogen phosphate).<br />
(Optional)<br />
4.1.6 ##NAMES= (STRING)<br />
Here the common, trade or other names are allowed. Multiple names are placed on separate<br />
lines.<br />
(Optional)<br />
Thursday, December 5, 2000 ims dx 5g.doc Page 13 of 22
J.I. Baumbach, A.N. Davies, P. Lampen, H. Schmidt - JCAMP-DX for Ion Mobility Spectrometry<br />
Draft manuscript for Pure and Applied Chemistry<br />
4.1.7 ##MOLFORM= (STRING)<br />
Another possibility of describing the sample is to write down the molecular formula.<br />
Elemental symbols are arranged with carbon first, followed by hydrogen, and then remaining<br />
element symbols in alphabetic order.<br />
The first letter of each elemental symbol is capitalized. The second letter, if required, is lower<br />
case. One-letter symbols must be separated from the next symbol by a blank or digit. Sub-<br />
/Superscripts are indicated by the prefixes: / and /\, respectively. Sub- and superscripts are<br />
terminated by the next non digit. Slash may be omitted for subscripts.<br />
For readability, each atomic symbol may be separated from its predecessor by a space. For<br />
substances that are represented by dot disconnected formulas (hydrates, etc.), each fragment<br />
is represented in the above order, and the dot is represented by *. Isotopic mass is specified<br />
by a leading superscript. D and T may be used for deuterium and tritium.<br />
(Optional)<br />
Examples:<br />
C2H4O2 or C2 H4 O2(acetic acid)<br />
H2 /\17O (water, mass 17 oxygen)<br />
4.1.8 ##CONCENTRATIONS= (STRING)<br />
The list of the known components and their concentrations has the following form, where N<br />
stands for the name and C for the concentration of each component in units given with U in<br />
the form:<br />
##CONCENTRATIONS= (NCU)<br />
(N 1 , C 1 , U 1 )<br />
. . .<br />
(N i , C i , U i )<br />
The group for each component is enclosed in parentheses. Each group starts a new line and<br />
may continue on following lines.<br />
(Optional in JCAMP-DX but in this case strongly recommended)<br />
4.1.9 ##SPECTROMETER/DATA SYSTEM= (TEXT)<br />
This LDR contains manufacturers’ name, model of spectrometer, software system, and<br />
release number, as appropriate in the form used by the manufacturer.<br />
(Optional)<br />
4.1.10 ##DATA PROCESSING= (TEXT)<br />
Here all mathematical procedures used before storing the data in the JCAMP-DX file are<br />
described. This LDR is also important in peak assignments.<br />
(Optional)<br />
4.1.11 ##XLABEL= (TEXT) and ##YLABEL= (TEXT)<br />
These LDRs give the possibility of labeling the axis.<br />
(Optional)<br />
Thursday, December 5, 2000 ims dx 5g.doc Page 14 of 22
J.I. Baumbach, A.N. Davies, P. Lampen, H. Schmidt - JCAMP-DX for Ion Mobility Spectrometry<br />
Draft manuscript for Pure and Applied Chemistry<br />
4.2 Data-type specific notes<br />
DATATYPE-SPECIFIC-LABELS are RESERVED labels which are defined by qualified<br />
user groups for a particular DATATYPE. A DATATYPE-SPECIFIC-LABEL is<br />
distinguished by a DATATYPE-SPECIFIC-LABEL-NAME which starts with a period e.g.<br />
(##.REDUCED MOBILITY=). Choice of period as distinguishing character is by analogy<br />
with the convention for data-structure names in Pascal and C. Effectively, the full LABEL-<br />
NAME is the concatenation of the DATATYPE NAME and the LABEL NAME, with a<br />
period in between, i.e., ##ION MOBILITY SPECTRUM.REDUCED MOBILITY=.<br />
4.2.1 ##.REDUCED MOBILITY= (STRING)<br />
After this LDR a list of reduced mobilities and their assignments for each of the components<br />
where K is the reduced mobility and A a string describing the assignment in closed angle<br />
brackets in the form:<br />
(K 01 , )<br />
(K 02 , )<br />
....<br />
(K 0i , )<br />
where the K 0 values are the known reduced mobilities in cm 2 V -1 s -1 given according to the<br />
formula:<br />
P T 0<br />
K 0 = K.<br />
.<br />
P0<br />
T<br />
The variable list (KA) MUST be given in the labeled-data-record and followed on the next<br />
line by the list of reduced mobilities each on its own line as shown in the example below:<br />
##.REDUCED MOBILITY=(KA)<br />
(2.38, )<br />
(2.27, )<br />
(2.06, )<br />
(1.83, )<br />
.......<br />
(Optional)<br />
4.2.2 ##.IONIZATION ENERGY= (AFFN)<br />
The ionization energy in eV.<br />
(Optional)<br />
4.2.3 ##.IONIZATION CHAMBER= (STRING, AFFN, AFFN[, AFFN]) and<br />
4.2.4 ##.DRIFT CHAMBER= (STRING, AFFN, AFFN[, AFFN])<br />
Different geometrical parameters of the ionization or drift chamber are distinguished by the<br />
following keywords:<br />
RECT<br />
Thursday, December 5, 2000 ims dx 5g.doc Page 15 of 22
J.I. Baumbach, A.N. Davies, P. Lampen, H. Schmidt - JCAMP-DX for Ion Mobility Spectrometry<br />
Draft manuscript for Pure and Applied Chemistry<br />
This means a rectangular chamber. It is followed by the size of the three dimensions length,<br />
width and height in mm.<br />
CYL<br />
Stands for a cylindrical form of the chamber. It is followed by its length and radius in mm.<br />
(Optional)<br />
4.2.5 ##.CARRIER GAS FLOW= (AFFN, AFFN)<br />
This LDR is divided in two flow values. The first value is linked to the ionization chamber<br />
and the second to the drift chamber. All values have the unit liter/minute.<br />
(Optional)<br />
4.2.6 ##.DRIFT GAS FLOW= (AFFN)<br />
This LDR defines the drift gas flow into the drift chamber when a separate gas is used here to<br />
the carrier gas. All values have the unit liter/minute.<br />
(Optional)<br />
4.2.7 ##.CARRIER GAS MOISTURE= (AFFN)<br />
The water concentration in the carrier gas is relevant to the different ionization processes. It is<br />
strongly recommended that this value be reported. This label has the units parts per million<br />
volume (ppmv).<br />
(Optional)<br />
4.2.8 ##.IONIZATION SOURCE= (TEXT)<br />
A description of the relevant ionization source details.<br />
For partial discharges (##.ionization mode=PD) this would include for example the materials<br />
used in the construction of the source and the needle/plate gap in the form;<br />
##.IONIZATION SOURCE= Partial Discharge: Needle = Steel, Plate = Silver, Gap = 5 mm,<br />
Voltage = 5000 V<br />
or for an ultraviolet lamp as source the energy and the lamp mounting position (on or off<br />
axis);<br />
##.IONIZATION SOURCE= UV Lamp: 10.6 eV, off-axis<br />
or for a radioactive source the type nature and intensity such as<br />
##. IONIZATION SOURCE= 63 Ni, 555 MBq<br />
or<br />
##. IONIZATION SOURCE= 3 H, 150 kBq<br />
for laser ionization the type of laser used, the wavelength selected and any relevant pulse<br />
information in the form<br />
##. IONIZATION SOURCE= Nd:YAG laser, 266 nm, pulse energy 10 mJ, pulse width 30 ps<br />
(Optional)<br />
Thursday, December 5, 2000 ims dx 5g.doc Page 16 of 22
J.I. Baumbach, A.N. Davies, P. Lampen, H. Schmidt - JCAMP-DX for Ion Mobility Spectrometry<br />
Draft manuscript for Pure and Applied Chemistry<br />
4.2.9 ##.SHUTTER GRID POTENTIAL= (AFFN)<br />
The potential difference between the wires of the Bradbury-Nielsen shutter in Volts.<br />
e.g.<br />
##.SHUTTER GRID POTENTIAL=100<br />
(Optional)<br />
4.2.10 ##.REPETITION RATE= (AFFN)<br />
The time between subsequent shutter openings in milliseconds.<br />
e.g.<br />
##.REPETITION RATE=100<br />
(Optional)<br />
Thursday, December 5, 2000 ims dx 5g.doc Page 17 of 22
J.I. Baumbach, A.N. Davies, P. Lampen, H. Schmidt - JCAMP-DX for Ion Mobility Spectrometry<br />
Draft manuscript for Pure and Applied Chemistry<br />
5 SUMMARY<br />
The following tables list the LDRs discussed with their basic parameters shown.<br />
THE CORE<br />
Core Fixed Header Information<br />
LDR Data-form Keyword Status Location<br />
##TITLE= (TEXT) Required 3.1.1<br />
##JCAMP-DX= (STRING) 5.01 Required 3.1.2<br />
##DATA TYPE= (STRING) ION MOBILITY Required 3.1.3<br />
SPECTRUM,<br />
IMS PEAK TABLE,<br />
IMS PEAK<br />
ASSIGNMENTS or<br />
LINK<br />
##DATA CLASS= (STRING) XYDATA,<br />
Required 3.1.4<br />
XYPOINTS, PEAK<br />
TABLE, or<br />
ASSIGNMENTS<br />
##ORIGIN= (TEXT) Required 3.1.5<br />
##OWNER= (TEXT) Required 3.1.6<br />
##END= Required 3.1.7<br />
Core Variable Header Information<br />
LDR Data-form Keyword Status Location<br />
##BLOCK_ID= (AFFN) Required for 3.2.1<br />
compound files<br />
##BLOCKS= (AFFN) Required for 3.2.1<br />
compound files<br />
##.IMS PRESSURE= (AFFN) Required 3.2.2<br />
##.CARRIER GAS= (TEXT) Required 3.2.3<br />
##.DRIFT GAS= (TEXT) Required 3.2.4<br />
##.ELECTRIC FIELD= (AFFN, AFFN) Required 3.2.5<br />
##.ION POLARITY (STRING) Required 3.2.6<br />
##.IONIZATION MODE= (STRING) UV, BR, AL, PD, CD, Required 3.2.7<br />
ESI, LI, LD, SY<br />
##.IMS TEMPERATURE= (AFFN[,AFFN]) Required 3.2.8<br />
##.SHUTTER OPENING<br />
TIME=<br />
(AFFN) Required 3.2.9<br />
Core Data<br />
LDR Data-form Keyword Status Location<br />
##XUNITS= (STRING) SECONDS,<br />
Required 3.3.1<br />
MILLISECONDS,<br />
MICROSECONDS;<br />
NANOSECONDS<br />
##YUNITS= (STRING) MICROAMPERES,<br />
NANOAMPERES;<br />
PICOAMPERES<br />
Required 3.3.1<br />
Thursday, December 5, 2000 ims dx 5g.doc Page 18 of 22
J.I. Baumbach, A.N. Davies, P. Lampen, H. Schmidt - JCAMP-DX for Ion Mobility Spectrometry<br />
Draft manuscript for Pure and Applied Chemistry<br />
##FIRSTX= (AFFN) Required for 3.3.2<br />
##DATACLASS=<br />
XYDATA<br />
##LASTX= (AFFN) Required for 3.3.2<br />
##DATACLASS=<br />
XYDATA<br />
##FIRSTY= (AFFN) Required for 3.3.3<br />
##DATACLASS=<br />
XYDATA<br />
##XFACTOR= (AFFN) Required for 3.3.4<br />
##DATACLASS=<br />
XYDATA<br />
##YFACTOR= (AFFN) Required for 3.3.4<br />
##DATACLASS=<br />
XYDATA<br />
##NPOINTS= (AFFN) Required 3.3.5<br />
Core Data Table<br />
LDR Data-form Keyword Status Location<br />
##XYDATA= (AFFN or ASDF) (X++(Y..Y)) 3.4.1<br />
##XYPOINTS= (AFFN) (XY..XY) 3.4.2<br />
##PEAK TABLE= (STRING) (XY) or (XYW) 3.4.3<br />
##PEAK ASSIGNMENTS= (STRING) (XA), (XYA) or<br />
(XYWA)<br />
3.4.4<br />
THE NOTES<br />
Global Notes<br />
LDR Data-form Keyword Status Location<br />
##LONG DATE= (STRING) Optional 4.1.1<br />
##SOURCE REFERENCE= (TEXT) Optional 4.1.2<br />
##CROSS REFERENCE= (TEXT) Optional 4.1.3<br />
##SAMPLE DESCRIPTION= (TEXT) Optional 4.1.4<br />
##CAS NAME= (STRING) Names defined by CAS Optional 4.1.5<br />
Index Guide<br />
##NAMES= (STRING) Optional 4.1.6<br />
##MOLFORM= (STRING) see Def. Optional 4.1.7<br />
##CONCENTRATIONS= (STRING) (NCU) Optional but strongly 4.1.8<br />
recommended<br />
##SPECTROMETER/ (TEXT) Optional 4.1.9<br />
DATA SYSTEM=<br />
##DATA PROCESSING= (TEXT) Optional 4.1.10<br />
##XLABEL= (TEXT) Optional 4.1.11<br />
##YLABEL= (TEXT) Optional 4.1.11<br />
Data type Specific Notes<br />
LDR Data-form Keyword Status Location<br />
##.REDUCED MOBILITY= (STRING) (KA) Optional 4.2.1<br />
##.IONIZATION ENERGY= (AFFN) Optional 4.2.2<br />
##.IONIZATION<br />
(STRING, AFFN, RECT or CYL Optional 4.2.3<br />
CHAMBER=<br />
AFFN[, AFFN])<br />
##.DRIFT CHAMBER= (STRING, AFFN, RECT or CYL Optional 4.2.4<br />
AFFN [, AFFN])<br />
##.CARRIER GAS FLOW= (AFFN, AFFN) Optional 4.2.5<br />
Thursday, December 5, 2000 ims dx 5g.doc Page 19 of 22
J.I. Baumbach, A.N. Davies, P. Lampen, H. Schmidt - JCAMP-DX for Ion Mobility Spectrometry<br />
Draft manuscript for Pure and Applied Chemistry<br />
##.DRIFT GAS FLOW= (AFFN) Optional 4.2.6<br />
##.CARRIER GAS (AFFN) Optional 4.2.7<br />
MOISTURE=<br />
##.IONIZATION SOURCE= (TEXT) Optional 4.2.8<br />
##.SHUTTER GRID (AFFN) Optional 4.2.9<br />
POTENTIAL=<br />
##.REPETITION RATE= (AFFN) Optional 4.2.10<br />
Thursday, December 5, 2000 ims dx 5g.doc Page 20 of 22
J.I. Baumbach, A.N. Davies, P. Lampen, H. Schmidt - JCAMP-DX for Ion Mobility Spectrometry<br />
Draft manuscript for Pure and Applied Chemistry<br />
EXAMPLE JCAMP-DX-FILE FOR IMS DATA EXCHANGE<br />
##TITLE=EXAMPLE JCAMP-DX FILE FOR IMS<br />
##JCAMP-DX=5.01<br />
$$ ISAS JCAMP-DX program for IMS (V.1.0)<br />
##DATA TYPE=ION MOBILITY SPECTRUM<br />
##DATA CLASS=XYDATA<br />
##ORIGIN=J.I.Baumbach, H. Schmidt, ISAS Dortmund, Germany<br />
##OWNER=COPYRIGHT (C) 2000 by ISAS Dortmund, Germany<br />
##LONG DATE=2000/09/28 14:24:38 +0100<br />
##SOURCE REFERENCE=P:\Hartwig\Messung\000928\H1092801<br />
##SPECTROMETER/DATA SYSTEM=ISAS/TE/TE-lang<br />
##NAMES=Tetrachloroethene<br />
##CAS REGISTRY NO=127-18-4<br />
##CONCENTRATIONS=(NCU)<br />
(TETRACHLOROETHENE, 0.46, ppmv)<br />
##.IMS PRESSURE=101<br />
##.CARRIER GAS=NITROGEN<br />
##.DRIFT GAS=NITROGEN<br />
##.ELECTRIC FIELD=-158,-294<br />
##.ION POLARITY=NEGATIVE<br />
##.IONIZATION MODE=PD<br />
##.IMS TEMPERATURE=25.0<br />
##.SHUTTER OPENING TIME=300 $$ microseconds<br />
##.REPETITION RATE= 100<br />
$$ milliseconds<br />
##.IONIZATION CHAMBER=CYL,30,7.5<br />
##.IONIZATION SOURCE= Partial Discharge, Needle= Stainless Steel, Gap = 4.6 mm<br />
##.DRIFT CHAMBER=CYL,120,7.5<br />
##.CARRIER GAS FLOW=0.2<br />
##.DRIFT GAS FLOW=0.11<br />
##.CARRIER GAS MOISTURE=0.03<br />
##.SHUTTER GRID POTENTIAL=100<br />
##.REDUCED MOBILITY=(KA)<br />
(2.38, )<br />
(2.27, )<br />
(2.06, )<br />
(1.83, )<br />
##XUNITS=MILLISECONDS<br />
##YUNITS=PICOAMPERES<br />
##XLABEL=Drift Time / ms<br />
##YLABEL=Ion Current / pA<br />
##FIRSTX=0<br />
##LASTX=59.975<br />
##FIRSTY=0. 4491087E+01<br />
##XFACTOR=0.1830348E-02<br />
##YFACTOR=0.1037643E-01<br />
##NPOINTS=2400<br />
##XYDATA=(X++(Y..Y))<br />
0D33k31J0844J6532N189j595k202m79K87J50R4r4k02m3J42m808j8005q458M14K093Q14<br />
273H75l8j74q4j41m8K64r9j27J22p5l3M3%J27m3j03J9k4N6R5m3j13%Q5O6r4j18N2J4%<br />
683D61J41q5m7o1Q5K3J0q5Q5j27n2J93l8J04j22r0M3P9j8Q0j13N6P5j17N2l3Rk3j23J79<br />
...<br />
32426C53L7K45m2r0j17M2J04q5J41l3j93J46rJ8K4o6K8J0j41Q9o1J13n2j4O6<br />
32767E13<br />
##END=<br />
Thursday, December 5, 2000 ims dx 5g.doc Page 21 of 22
J.I. Baumbach, A.N. Davies, P. Lampen, H. Schmidt - JCAMP-DX for Ion Mobility Spectrometry<br />
Draft manuscript for Pure and Applied Chemistry<br />
6 REFERENCES<br />
1. R.S. McDonald, and P.A. Wilks Jr., JCAMP-DX: A Standard Form for Exchange of Infrared<br />
Spectra in Computer Readable Form. Applied Spectroscopy, 1988. 42: p. 151-162.<br />
2. J Gasteiger, B.M.P. Hendriks, P. Hoever, C. Jochum and H. Somberg., JCAMP-CS: A Standard<br />
Exchange Format for Chemical Structure Information in Computer-Readable Form. Applied<br />
Spectroscopy, 1991. 45: p. 4-11.<br />
3. A.N. Davies, and P. Lampen, JCAMP-DX for NMR. Applied Spectroscopy, 1993. 47: p. 1093-<br />
1099.<br />
4. P. Lampen, H. Hillig, A.N. Davies and M. Linscheid, JCAMP-DX for Mass Spectrometry. Applied<br />
Spectroscopy, 1994. 48: p. 1545-1552.<br />
5. P. Lampen, J. Lambert, R.J. Lancashire, R.S. McDonald, P.S. McIntyre, D.N. Rutledge, T. Fröhlich<br />
and A.N. Davies, An Extension to the JCAMP-DX Standard File Format, JCAMP-DX V.5.01 (IUPAC<br />
Recommendations 1999). Pure and Applied Chemistry, 1999. 71 p. 1549-1556.<br />
6. J.I. Baumbach, P. Lampen, A.N. Davies, IUPAC / JCAMP-DX: An International Standard for the Exchange<br />
of Ion Mobility Spectrometry Data. International Journal for Ion Mobility Spectrometry 1998 1 p. 64-67.<br />
Thursday, December 5, 2000 ims dx 5g.doc Page 22 of 22
1Compound 1<br />
2Compound2<br />
3Compound3<br />
4Compound4<br />
5Compound 5<br />
6Compound 6<br />
7Compound 7<br />
8RIPSignal<br />
9Compound8<br />
10Compound9<br />
11Compound10<br />
12Compound11<br />
13Compound12<br />
14Compound13<br />
15Compound14<br />
16RIPSignal<br />
THE PROTECTIONOF CIVIL FACILITIES<br />
BY MEANS OF ASTATIONARY IMS<br />
H. Bensch,J.W.Leonhardt,IUTLtd.Berlin, G.Bendisch,E.Wolters,Dräger Sicherheitstechnik<strong>GmbH</strong>,K.M.Baether, DrägerwerkAG<br />
THEPROBLEM<br />
Terrorists attacks are directed to various civil and<br />
public facilities: parliament, governmental buildings,<br />
banks, hotels, subway stations and other facilities.<br />
Chemical warfare agents and industrial poisons were<br />
used frequently and have an increasing importance.<br />
Therefore the monitoring of air flows in the<br />
conditioning systems of the facilities wide range of<br />
possible chemical compounds, which are used in<br />
buildings there is ahigh potential of false alarms by<br />
crosssensitivities.<br />
GermanParliament<br />
covered by Christo and protected by IUT-IMS<br />
SCHEMEOFTHESTATIONARYIMS<br />
AMBIENT<br />
AIR<br />
INPUT<br />
DUST<br />
FILTER<br />
EXIT<br />
SAM-<br />
PLING<br />
I<br />
SAM-<br />
PLING<br />
II<br />
P<br />
P<br />
P<br />
FILTER<br />
IMS<br />
(+)Mode<br />
IMS<br />
(-)Mode<br />
FILTER<br />
Ampl.<br />
HV<br />
Pulse<br />
generator.<br />
Ampl.<br />
HV<br />
pulse<br />
Generator<br />
M-P<br />
MEMORY<br />
M-P<br />
MEMORY<br />
EXIT<br />
4-20 mA<br />
VOLTAGE<br />
HEATING<br />
FLOW<br />
RIP<br />
VOLTAGE<br />
HEATING<br />
FLOW<br />
RIP<br />
SPECIFICATIONS<br />
The IMS-stations being used as monitors under these conditions have to<br />
meet the following conditions:<br />
! Highreliability - theuserdemandsan5yearsnonstop<br />
operation<br />
! Highsensitivity - aslowertheMDCthanbetter<br />
! Nofalsealarms - theevacuationofpeoplehavetobedone<br />
Immediately<br />
! Reducedcrosssensitivities - the matrix of the ambient air has<br />
to be analysed due to painting, cleaning,<br />
contraction(weldingprocedures)<br />
PARAMETERS<br />
1 Minimal detectable concentrations in microgram per cubmeter are<br />
arrived:<br />
The Stationary IMS inEXPROOF Version<br />
GB0,7/GA0,4/GD4,2/VX 0,4/L15,0/HD2,1/HN3<br />
19,0/<br />
COCl<br />
2<br />
GC-IMS FOR INDUSTRIAL USE<br />
H.Bensch,J.W.Leonhardt,IUTLtd. Berlin,Germany<br />
IUT<br />
Institut für<br />
Umwelttechnologien<br />
<strong>GmbH</strong><br />
Introduction<br />
PICTUREOFTHEGC-IMS<br />
The analysis of mixturesby means ofan IMS as detectorcan only be avery difficultor even<br />
impossibletask.<br />
Depending on thematrix composition the driftspectra can change. Mixed ions can be<br />
created or charge transfer takesplace.<br />
The preseparation of gas samples by gaschromatographiccolumnsgives some<br />
improvement.<br />
The chromatographicseparation also depends on thecomposition of gas samples.The<br />
analysis of an unknown mixture is problematicand time consuming.<br />
An adapted GC can be helpfulin cases when only afew compoundsshould be measuredin<br />
acomplex matrix.<br />
For process controlin industry thecondition oflow complexity issometimes given. Agood<br />
reproducibility of the results is demanded during months.<br />
The influence ofvarying water concentration can be reduced with GC preseparation<br />
dramatically.<br />
The use of externalcarrier gas is helpfuldepending on the special application.<br />
Software<br />
SCHEMEOFTHE GC-IMS<br />
The internalmicrocomputeris programmable fordifferentconfigurationsand applications via<br />
a<br />
scriptlanguage.<br />
Thereare twoprograms (on lineand off line) running on externalPC.<br />
P<br />
Collector<br />
Filter<br />
Emitter<br />
On line version<br />
•<br />
•<br />
•<br />
•<br />
•<br />
•<br />
•<br />
•<br />
•<br />
•<br />
•<br />
Compound specificcalibration data<br />
rel. position to the RIP<br />
polarity<br />
declaration of monomer,dimer,trimeror<br />
dissoziated products<br />
zerovalue<br />
offset<br />
11 approximation points of calibration curve<br />
internalcalibration due totheRIP drifttime<br />
showing allpeaksrelated to one compound<br />
different reports and averaging<br />
•<br />
•<br />
Offlineversion<br />
•<br />
•<br />
•<br />
•<br />
•<br />
Library of300 compounds with<br />
monomer,dimer..<br />
Showing 25 spectraatonce for<br />
preselection<br />
Chromatographic cut through the<br />
collected spectra maximumpeak<br />
heightin an defined window<br />
Automated signalprocessing<br />
denoising with wavelets<br />
deconvolution with modified van Cittert<br />
iteration<br />
Filter<br />
Tube<br />
P<br />
Column<br />
Valve<br />
samp.<br />
loop<br />
CHROMATOGRAMOFAMMONIA<br />
P<br />
Devicedescription<br />
Adjustable temperature fordetector,inletsystem and column<br />
2adjustable temperatures for the column<br />
Internalpump forcolumn carrier gas pressure<br />
Multicapillarorpacked column<br />
Radioactivetritium sourceof
G.A.S. Gesellschaft<br />
für analytische Sensorsysteme mbH<br />
Ion Mobility Spectrometer<br />
GAS-MPD-SA<br />
INSTRUMENT TO MONITOR ONLINE AND<br />
ON-SITE SF 6 -DECOMPOSITION CAUSED BY ARCING<br />
OR PARTIAL DISCHARGES<br />
PORTABLE<br />
STANDALONE VERSION FOR INSPECTIONS<br />
IN COMBINATION WITH LAPTOP<br />
(NOT SHOWN)<br />
DEVELOPED AND MANUFACTURED BY:<br />
G.A.S. Gesellschaft für analytische Sensorsysteme mbH<br />
TechnologieZentrumDortmund, Emil-Figge-Str. 76-80,<br />
D-44227 Dortmund, Germany<br />
Phone: +49 231 9742 288 - FAX: +49 231 9742 289<br />
E-Mail: GAS@GAS-DORTMUND.DE<br />
WWW.GAS-DORTMUND.DE, WWW.GAS-DORTMUND.COM<br />
Technical Information, 24.06.01
Ion Mobility Spectrometer<br />
G.A.S. Gesellschaft<br />
für analytische Sensorsysteme mbH<br />
Changes without further notice<br />
Function<br />
The basic principle of the instrument is the measurement of the drift time of ions provided by an<br />
ionisation source (in this cause a partial discharge). Decomposition Products causes changes in the<br />
ion swarm. Thus a peakshift arises and the peakshift is used as signal about the quality of SF 6 gas<br />
within the compartment under investigation.<br />
Application Fields<br />
Gas Insulated Substations, Curcuit Breakers, Gas Insulated Lines, Gas Insulated Transformers,<br />
Bus Bars, etc.<br />
Concentration Area<br />
500 ppb v - 1000 ppm v concentration of decomposition products (1ppb v = 1 ng/l, 1 ppm v = 1 µg/l)<br />
Installation<br />
Easily connectable to existing<br />
valves, automatic shut down.<br />
Included Software<br />
GASoszi2001<br />
Currentime<br />
Viewer13<br />
Morepeaks<br />
Instrumentation Parameter<br />
Power Supply<br />
Power Consumption<br />
Output Signal<br />
Output Trigger<br />
Weight<br />
Size<br />
Pressure<br />
115/230 V AC // 50-60 Hz<br />
30 W<br />
0 - 10 V DC<br />
0 - 10 V DC<br />
8,8 kg<br />
185 x 340 x 320 mm<br />
Max. 14 bar<br />
DEVELOPED AND MANUFACTURED BY:<br />
G.A.S. Gesellschaft für analytische Sensorsysteme mbH<br />
TechnologieZentrumDortmund, Emil-Figge-Str. 76-80,<br />
D-44227 Dortmund, Germany<br />
Phone: +49 231 9742 288 - FAX: +49 231 9742 289<br />
E-Mail: GAS@GAS-DORTMUND.DE<br />
WWW.GAS-DORTMUND.DE, WWW.GAS-DORTMUND.COM
G.A.S. Gesellschaft<br />
für analytische Sensorsysteme mbH<br />
Ion Mobility Spectrometer<br />
Ion Mobility Spectrometer<br />
GAS-MCC-UV-IMS<br />
SEPARATION AND IDENTIFICATION<br />
OF MIXTURES OF THE GASOLINE COMPOUNDS<br />
METHYL -TERT-BUTYLETHER (MTBE) NEXT TO<br />
BENZENE, TOLUENE AND XYLENE (BTX)<br />
MTBE<br />
Signal / a.u.<br />
-1,0<br />
-0,5<br />
0,0<br />
Chromatogram<br />
Benzene<br />
20 40 60<br />
Retention Time / s<br />
Toluene<br />
m-Xylene<br />
Drift Time / ms<br />
30<br />
20<br />
10<br />
0<br />
10 20 30 40 50 60 70<br />
Retention Time / s<br />
PID<br />
IMS-Chromatogram<br />
Drift Time / ms<br />
25<br />
20<br />
15<br />
MTBE MCCUV-IMS<br />
Toluene<br />
m-Xylene<br />
Benzene<br />
10 20 30 40 50 60 70<br />
Retention Time / s<br />
Peakheightdiagram<br />
IMS-Chromatogram of a mixture of MTBE, Benzene, Toluene and m-Xylene<br />
APPLICATION NOTE # MTBE-BTX<br />
DEVELOPED AND MANUFACTURED BY:<br />
G.A.S. Gesellschaft für analytische Sensorsysteme mbH<br />
TechnologieZentrumDortmund, Emil-Figge-Str. 76-80,<br />
D-44227 Dortmund, Germany<br />
Phone: +49 231 9742 288 - FAX: +49 231 9742 289<br />
E-Mail: GAS@GAS-DORTMUND.DE<br />
WWW.GAS-DORTMUND.DE, WWW.GAS-DORTMUND.COM<br />
Technical Information, 24.06.01
G.A.S. Gesellschaft<br />
für analytische Sensorsysteme mbH<br />
Ion Mobility Spectrometer<br />
Compounds<br />
Mixture of Methyl -tert-Butylether (MTBE) next to Benzene, Toluene and Xylene (BTX)<br />
Concentration Area<br />
Detection limits in the µg/L-Range<br />
(e.g. MTBE 2 µg/L)<br />
1<br />
MCC-UV-IMS<br />
- MTBE-Testgas -<br />
Instrumentation Parameter<br />
Ionization source<br />
UV (10.6 eV)<br />
Length of the drift tube<br />
120 mm<br />
Electrical field strenght<br />
326 V/cm<br />
Shutter opening time<br />
100 µs<br />
Drift gas<br />
N 2 (99.999%)<br />
Drift gas flow<br />
200 mL/min<br />
Sample gas<br />
N 2 (99.999%)<br />
Sample gas flow<br />
100 mL/min<br />
Temperature (IMS)<br />
23 °C<br />
Stationary phase of the MCC nonpolar<br />
Length of the column<br />
25 cm<br />
Carrier gas of the MCC<br />
N 2 (99.999%)<br />
Carrier gas flow<br />
21.5 cm<br />
Temperature (MCC)<br />
23 °C<br />
Peak Area / a.u.<br />
0,1<br />
0,01<br />
-0,02<br />
0,00<br />
MTBE: 2.0 µg/L<br />
Peak 1<br />
15 20<br />
Sum Peak 1 and Peak 2<br />
Peak 1<br />
Peak 2<br />
1 10 100 1000<br />
Concentration / µg/L<br />
Peak 2<br />
-0,2 Peak 1<br />
-0,1<br />
0,0<br />
MTBE: 2150 µg/L<br />
20 30<br />
Signal / V<br />
-1,0<br />
-0,5<br />
MTBE<br />
Benzene<br />
Toluene<br />
Chromatogram<br />
m-Xylene<br />
Drift Time / ms<br />
0,0<br />
25<br />
20<br />
15<br />
MTBE<br />
Benzene<br />
IMS-Chromatogram Ion Mobility Spectra<br />
MTBE<br />
m-Xylene<br />
Toluene<br />
Benzene<br />
MTBE<br />
20 40 60 0,0 -0,1 -0,2<br />
Retention Time / s<br />
Signal / V<br />
Toluene<br />
m-Xylene<br />
IMS-Chromatogram,<br />
Chromatogram of a mixture and<br />
Ion Mobility Spectra of the single<br />
substances of MTBE, Benzene,<br />
Toluene and m-Xylene recorded<br />
using the GAS-MCC-UV-IMS<br />
DEVELOPED AND MANUFACTURED BY:<br />
G.A.S. Gesellschaft für analytische Sensorsysteme mbH<br />
TechnologieZentrumDortmund, Emil-Figge-Str. 76-80,<br />
D-44227 Dortmund, Germany<br />
Phone: +49 231 9742 288 - FAX: +49 231 9742 289<br />
E-Mail: GAS@GAS-DORTMUND.DE<br />
WWW.GAS-DORTMUND.DE, WWW.GAS-DORTMUND.COM
G.A.S. Gesellschaft<br />
für analytische Sensorsysteme mbH<br />
Ion Mobility Spectrometer<br />
Ion Mobility Spectrometer<br />
GAS-MCCUV-IMS<br />
INSTRUMENT TO MONITOR ONLINE AND ON-SITE<br />
MIXTURES OF VOLATILE ORGANIC COMPOUNDS<br />
PORTABLE STANDALONE VERSION<br />
FOR MONITORING<br />
IN COMBINATION WITH LAPTOP<br />
(NOT SHOWN)<br />
DEVELOPED AND MANUFACTURED BY:<br />
G.A.S. Gesellschaft für analytische Sensorsysteme mbH<br />
TechnologieZentrumDortmund, Emil-Figge-Str. 76-80,<br />
D-44227 Dortmund, Germany<br />
Phone: +49 231 9742 288 - FAX: +49 231 9742 289<br />
E-Mail: GAS@GAS-DORTMUND.DE<br />
WWW.GAS-DORTMUND.DE, WWW.GAS-DORTMUND.COM<br />
Technical Information, 24.06.01
Signal / V<br />
G.A.S. Gesellschaft<br />
für analytische Sensorsysteme mbH<br />
Ion Mobility Spectrometer<br />
Characteristics<br />
• Fast (spectra are provided within 50 ms)<br />
• Sensitive (detection limits in the pg or<br />
ppb v range and partly even below)<br />
• Selective (UV-lamps with ionization<br />
energies from 8.4 - 11.8 eV)<br />
• Non-Radioactive Ionization Source<br />
• Cheap and Environmentally Favorable<br />
• Portable<br />
Application Fields<br />
• Environmental Analysis<br />
(air, gas, water, soil)<br />
• Process Control<br />
(water treatment, energy distribution)<br />
• Work Place Control<br />
(organic compounds)<br />
Spectra<br />
Signal / V<br />
1,5<br />
1,0<br />
0,5<br />
0,0<br />
PID<br />
Acetone<br />
Trichloroethene<br />
Tetrachloroethene<br />
0 20 40<br />
Retention Time / s<br />
Software<br />
GASoszi2001<br />
-0,6<br />
-0,4<br />
-0,2<br />
0,0<br />
10<br />
Acetone<br />
20<br />
Retention Time / s<br />
Chromatogram and IMS-Chromatogram of a mixture of<br />
Acetone, Trichloroethene and Tetrachloroethene<br />
30<br />
40<br />
Trichloroethene<br />
50<br />
0<br />
10<br />
UV-IMS<br />
Tetrachloroethene<br />
20<br />
Drift Time / ms<br />
Compounds<br />
Compound detectable with GAS-UV-IMS<br />
• Alkanes (e.g. Hexane)<br />
• Alcohols (e.g. Ethanol, Ethoxypropanol)<br />
• Halogenated Hydrocarbons<br />
(e.g. Tetrachloroethene)<br />
• Aromatic Hydrocarbons<br />
• Aromatoc Hydrocarbons with Chains<br />
(e.g. BTX)<br />
• Halogenated Aromatic Hydrocarbons<br />
• Halogenated Biphenyls (e.g. PCP)<br />
• Carbonyl Compounds<br />
• Aldehyds (e.g. Formaldehyd)<br />
• Ketons (e.g. Aceton)<br />
• Ether (e.g. MTBE, 2,2 Dichloroethylether)<br />
• Phosphorous Compounds<br />
Instrumentation Parameter<br />
Power Supply<br />
Ionization Source<br />
Available Energies<br />
of UV-Lamps<br />
Column<br />
Power Consumption<br />
Output Signal<br />
Output Trigger<br />
Weight<br />
Size<br />
115/230 V AC // 50-60 Hz<br />
Photoionization<br />
8.4 / 9.6 / 10.0 / 10.6 / 11.8 eV<br />
Muli-Capillary Column<br />
30 W<br />
0 - 10 V DC<br />
0 - 10 V DC<br />
8,8 kg<br />
185 x 340 x 320 mm<br />
Concentration Area<br />
1 ppb v - 1000 ppm v<br />
DEVELOPED AND MANUFACTURED BY:<br />
G.A.S. Gesellschaft für analytische Sensorsysteme mbH<br />
TechnologieZentrumDortmund, Emil-Figge-Str. 76-80,<br />
D-44227 Dortmund, Germany<br />
Phone: +49 231 9742 288 - FAX: +49 231 9742 289<br />
E-Mail: GAS@GAS-DORTMUND.DE<br />
WWW.GAS-DORTMUND.DE, WWW.GAS-DORTMUND.COM
G.A.S. Gesellschaft<br />
für analytische Sensorsysteme mbH<br />
Ion Mobility Spectrometer<br />
Ion Mobility Spectrometer<br />
GAS-UV-IMS<br />
INSTRUMENT TO MONITOR ONLINE AND ON-SITE<br />
VOLATILE ORGANIC COMPOUNDS<br />
PORTABLE STANDALONE VERSION<br />
FOR CONTINUOUS MONITORING<br />
IN COMBINATION WITH LAPTOP<br />
(NOT SHOWN)<br />
DEVELOPED AND MANUFACTURED BY:<br />
G.A.S. Gesellschaft für analytische Sensorsysteme mbH<br />
TechnologieZentrumDortmund, Emil-Figge-Str. 76-80,<br />
D-44227 Dortmund, Germany<br />
Phone: +49 231 9742 288 - FAX: +49 231 9742 289<br />
E-Mail: GAS@GAS-DORTMUND.DE<br />
WWW.GAS-DORTMUND.DE, WWW.GAS-DORTMUND.COM<br />
Technical Information, 24.06.01
G.A.S. Gesellschaft<br />
für analytische Sensorsysteme mbH<br />
Ion Mobility Spectrometer<br />
Characteristics<br />
Spectra<br />
• Fast (spectra are provided within 50 ms)<br />
• Sensitive (detection limits in the pg or ppb v<br />
range and partly even below)<br />
• Selective (UV-lamps with ionization<br />
energies from 8.4 - 11.8 eV)<br />
• Non-Radioactive Ionization Source<br />
• Cheap and Environmentally Favorable<br />
• Portable<br />
Signal / a.u.<br />
-0,06<br />
-0,04<br />
-0,02<br />
0,00<br />
-0,05<br />
K 0 =1.99 cm 2 /Vs<br />
K 0 =1.43 cm 2 /Vs<br />
10 20 30<br />
K 0 =1.90 cm 2 /Vs<br />
MTBE<br />
Toluene<br />
-0,05<br />
0,00<br />
-0,05<br />
Benzene<br />
K 0 =2.00 cm 2 /Vs<br />
10 20 30<br />
m-Xylene<br />
K 0 =1.81 cm 2 /Vs<br />
Application Fields<br />
• Environmental Analysis<br />
(air, gas, water, soil)<br />
• Process Control<br />
(water treatment, energy distribution)<br />
• Work Place Control<br />
(organic compounds)<br />
0,00<br />
0,00<br />
Software<br />
GASoszi2001<br />
10 20 30<br />
Drift Time / ms<br />
10 20 30<br />
Compounds<br />
Compound detectable with GAS-UV-IMS<br />
• Alkanes (e.g. Hexane)<br />
• Alcohols (e.g. Ethanol, Ethoxypropanol)<br />
• Halogenated Hydrocarbons<br />
(e.g. Tetrachloroethene)<br />
• Aromatic Hydrocarbons<br />
• Aromatoc Hydrocarbons with Chains<br />
(e.g. BTX)<br />
• Halogenated Aromatic Hydrocarbons<br />
• Halogenated Biphenyls (e.g. PCP)<br />
• Carbonyl Compounds<br />
• Aldehyds (e.g. Formaldehyd)<br />
• Ketons (e.g. Aceton)<br />
• Ether (e.g. MTBE, 2,2 Dichloroethylether)<br />
• Phosphorous Compounds<br />
Instrumentation Parameter<br />
Power Supply<br />
Ionization Source<br />
Available Energies<br />
of UV-Lamps<br />
Power Consumption<br />
Output Signal<br />
Output Trigger<br />
Weight<br />
Size<br />
115/230 V AC // 50-60 Hz<br />
Photoionization<br />
8.4 / 9.6 / 10.0 / 10.6 / 11.8 eV<br />
30 W<br />
0 - 10 V DC<br />
0 - 10 V DC<br />
8,8 Kg<br />
185 x 340 x 320 mm<br />
Concentration Area<br />
1 ppb v - 1000 ppm v<br />
DEVELOPED AND MANUFACTURED BY:<br />
G.A.S. Gesellschaft für analytische Sensorsysteme mbH<br />
TechnologieZentrumDortmund, Emil-Figge-Str. 76-80,<br />
D-44227 Dortmund, Germany<br />
Phone: +49 231 9742 288 - FAX: +49 231 9742 289<br />
E-Mail: GAS@GAS-DORTMUND.DE<br />
WWW.GAS-DORTMUND.DE, WWW.GAS-DORTMUND.COM