A high resolution IMS for environmental studies - Iut-berlin.info
A high resolution IMS for environmental studies - Iut-berlin.info
A high resolution IMS for environmental studies - Iut-berlin.info

Create successful ePaper yourself
Turn your PDF publications into a flip-book with our unique Google optimized e-Paper software.
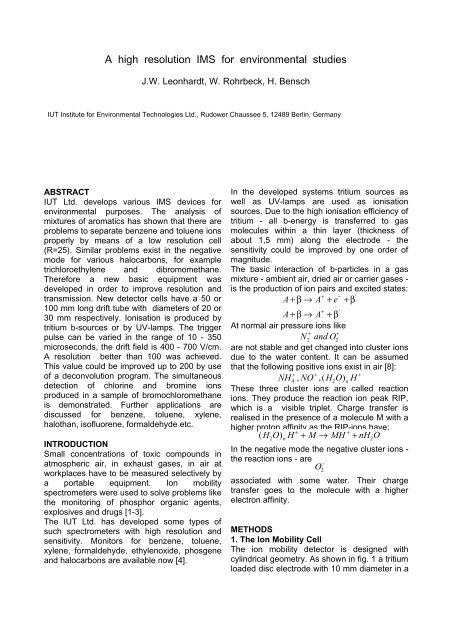
A <strong>high</strong> <strong>resolution</strong> <strong>IMS</strong> <strong>for</strong> <strong>environmental</strong> <strong>studies</strong><br />
J.W. Leonhardt, W. Rohrbeck, H. Bensch<br />
IUT Institute <strong>for</strong> Environmental Technologies Ltd., Rudower Chaussee 5, 12489 Berlin, Germany<br />
ABSTRACT<br />
IUT Ltd. develops various <strong>IMS</strong> devices <strong>for</strong><br />
<strong>environmental</strong> purposes. The analysis of<br />
mixtures of aromatics has shown that there are<br />
problems to separate benzene and toluene ions<br />
properly by means of a low <strong>resolution</strong> cell<br />
(R=25). Similar problems exist in the negative<br />
mode <strong>for</strong> various halocarbons, <strong>for</strong> example<br />
trichloroethylene and dibromomethane.<br />
There<strong>for</strong>e a new basic equipment was<br />
developed in order to improve <strong>resolution</strong> and<br />
transmission. New detector cells have a 50 or<br />
100 mm long drift tube with diameters of 20 or<br />
30 mm respectively. Ionisation is produced by<br />
tritium b-sources or by UV-lamps. The trigger<br />
pulse can be varied in the range of 10 - 350<br />
microseconds, the drift field is 400 - 700 V/cm.<br />
A <strong>resolution</strong> better than 100 was achieved.<br />
This value could be improved up to 200 by use<br />
of a deconvolution program. The simultaneous<br />
detection of chlorine and bromine ions<br />
produced in a sample of bromochloromethane<br />
is demonstrated. Further applications are<br />
discussed <strong>for</strong> benzene, toluene, xylene,<br />
halothan, isofluorene, <strong>for</strong>maldehyde etc.<br />
INTRODUCTION<br />
Small concentrations of toxic compounds in<br />
atmospheric air, in exhaust gases, in air at<br />
workplaces have to be measured selectively by<br />
a portable equipment. Ion mobility<br />
spectrometers were used to solve problems like<br />
the monitoring of phosphor organic agents,<br />
explosives and drugs [1-3].<br />
The IUT Ltd. has developed some types of<br />
such spectrometers with <strong>high</strong> <strong>resolution</strong> and<br />
sensitivity. Monitors <strong>for</strong> benzene, toluene,<br />
xylene, <strong>for</strong>maldehyde, ethylenoxide, phosgene<br />
and halocarbons are available now [4].<br />
In the developed systems tritium sources as<br />
well as UV-lamps are used as ionisation<br />
sources. Due to the <strong>high</strong> ionisation efficiency of<br />
tritium - all b-energy is transferred to gas<br />
molecules within a thin layer (thickness of<br />
about 1,5 mm) along the electrode - the<br />
sensitivity could be improved by one order of<br />
magnitude.<br />
The basic interaction of b-particles in a gas<br />
mixture - ambient air, dried air or carrier gases -<br />
is the production of ion pairs and excited states:<br />
+ −<br />
'<br />
A + β → A + e + β<br />
+<br />
'<br />
A + β → A + β<br />
At normal air pressure ions like<br />
+ +<br />
N<br />
2<br />
and O2<br />
are not stable and get changed into cluster ions<br />
due to the water content. It can be assumed<br />
that the following positive ions exist in air [8]:<br />
+ + +<br />
NH 4<br />
, NO , ( H 2<br />
O ) n<br />
H<br />
These three cluster ions are called reaction<br />
ions. They produce the reaction ion peak RIP,<br />
which is a visible triplet. Charge transfer is<br />
realised in the presence of a molecule M with a<br />
<strong>high</strong>er proton affinity as the RIP-ions have:<br />
+ +<br />
( H O ) H + M → MH + nH O<br />
2 n<br />
2<br />
In the negative mode the negative cluster ions -<br />
the reaction ions - are<br />
O2<br />
−<br />
associated with some water. Their charge<br />
transfer goes to the molecule with a <strong>high</strong>er<br />
electron affinity.<br />
METHODS<br />
1. The Ion Mobility Cell<br />
The ion mobility detector is designed with<br />
cylindrical geometry. As shown in fig. 1 a tritium<br />
loaded disc electrode with 10 mm diameter in a<br />
Copyright © 2000 by International Society <strong>for</strong> Ion Mobility Spectrometry
J.W. Leonhardt et al.: „A <strong>high</strong> <strong>resolution</strong> <strong>IMS</strong>...”, IJ<strong>IMS</strong> 3(2000)1,43-49, p. 44<br />
d r i f t<br />
gas<br />
shutter g r i d potential<br />
rings<br />
aperture grid<br />
insulator<br />
c o l l e c t o r<br />
emitter<br />
Betasource<br />
S<br />
a<br />
exit<br />
L d<br />
distance of 1..10 mm to a shutter grid electrode<br />
is used as ionisation source. Between these<br />
electrodes are the gas inlet and outlet. The<br />
ionisation volume may vary from 50 µl to 1,5<br />
ml. The drift tube is behind the shutter grid with<br />
ring electrodes. The collector electrode is also<br />
a disc protected by an aperture grid at the last<br />
ring electrode. The b-source can be substituted<br />
by an UV-lamp.<br />
2. Ionisation Sources<br />
Beta 3 H-sources.<br />
Beta-tritium-ionisation sources were developed<br />
in a joint venture with the Radium Institut in St.<br />
Petersburg. This special type of a ionisation<br />
source is used as emitter electrode, its energy<br />
spectrum is given in fig. 2.<br />
The spectrum demonstrates that tritium is<br />
gettered in a thin titanium layer only. The mean<br />
energy of emitted Beta particles is equal to<br />
=3.6 keV. The absolute activity may vary<br />
from a c = 0.42 MBq (free limit) up to 10 GBq.<br />
The ion production rate q(z) at a given distance<br />
from the emitter z can be evaluated by the<br />
<strong>for</strong>mula (1).<br />
ac<br />
q ( z<br />
) = ⋅ ∆ε<br />
( z<br />
)<br />
( 1 )<br />
w<br />
Figure 1: Scheme of an IUT - IM cell<br />
where w is the mean energy necessary to<br />
produce one ion pair. De(z) can be evaluated<br />
by Bethe’s <strong>for</strong>mula <strong>for</strong> b-absorption in the non<br />
relativistic case as follows:<br />
( 2 )<br />
ε o<br />
= 0.<br />
5 1 1MeV<br />
2,0x10 6<br />
1,5x1<br />
0<br />
1,0x10 6<br />
counts<br />
6<br />
5,0x10 5<br />
∆ε<br />
N εo<br />
1 16ε<br />
z<br />
− = 0.<br />
3ϕ<br />
⋅<br />
∆z<br />
A ε<br />
( z<br />
) ln , ( )<br />
I<br />
;<br />
0,0<br />
0 20<br />
keV<br />
Copyright © 2000 by International Society <strong>for</strong> Ion Mobility Spectrometry<br />
Figure 2:<br />
Beta spectrum of a tritium source with<br />
low activity
J.W. Leonhardt et al.: „A <strong>high</strong> <strong>resolution</strong> <strong>IMS</strong>...”, IJ<strong>IMS</strong> 3(2000)1,43-49, p. 45<br />
s h u t t e r<br />
g r i d<br />
insulator<br />
potential<br />
rings<br />
aperture g r i d<br />
grid<br />
drift g a s<br />
protection g r i d<br />
g r i d g r i d<br />
collector<br />
lamp<br />
w i n d o w<br />
S<br />
a<br />
exit<br />
L d<br />
N, A: atomic and mass numbers; I=94.5eV, j =<br />
density. The mean number of ion pairs<br />
produced by one b-tritium particle is<br />
=102.8. About 30 % of the tritium in the<br />
emitter will contribute to the ionisation of the<br />
gas. That kind of ionisation source is available<br />
at IUT and Radium<br />
Institute in the range of 0.5<br />
MBq up to 0.5 GBq.<br />
Figure 3: Scheme of the IUT - <strong>IMS</strong> with a photoionisation discharge tube<br />
UV-photoionisation<br />
lamps.<br />
Hydrogen plasma discharge lamps were<br />
successfully checked <strong>for</strong> <strong>IMS</strong>-application too.<br />
The scheme of an ionisation source using<br />
photoionisation is given in fig. 3 - the exit<br />
window of the lamp is placed at the same<br />
position as the b-source. A special grid acts as<br />
an „emitting“ electrode, which avoids windows<br />
charging. There is the problem that photons<br />
should not enter the drift space. The geometry<br />
of the ionisation source has to be optimised<br />
with respect to the „shining“ into the drift space<br />
and to the carrier production rate. Un<strong>for</strong>tunately<br />
the ion distribution along z is much smoother as<br />
in the case of a b-source. This reduces the<br />
efficiency of such an arrangement. Photons flux<br />
of the lamp is typically 10 12 cm -2 s -1. .<br />
3. <strong>IMS</strong>-Resolution<br />
As discussed by R. St. Louis and H. H. Hill jr.<br />
[5] the defined <strong>resolution</strong> R is dominated by 1)<br />
the pulse width, t Pulse, 2) the diffusion<br />
Copyright © 2000 by International Society <strong>for</strong> Ion Mobility Spectrometry<br />
R<br />
=<br />
1 6 l<br />
n<br />
2<br />
U<br />
U<br />
T<br />
d<br />
broadening, t diff., 3) the capacitive coupling<br />
between aperture and collector, t ap, 4) the gate<br />
depletion, t g, 5) temperature changes, 6)<br />
pressure changes, 7) coulombic repulsion and<br />
8) the amplifiers’ rise time, t R. The modified<br />
<strong>for</strong>mula is equal to<br />
2 2<br />
K U ⎛<br />
S<br />
d<br />
+ 4<br />
t<br />
Pulse<br />
−<br />
L ⎜<br />
d ⎝ KU<br />
1<br />
Pulse<br />
⎞<br />
⎟<br />
⎠<br />
2 2<br />
+ ⎛ ⎜<br />
⎝<br />
2<br />
a U<br />
2<br />
L U<br />
t K U<br />
where K = mobility, U T = temperature voltage,<br />
U ap = voltage at aperture grid, U d = drift voltage,<br />
a - distance between aperture grid and<br />
collector, S = distance between space charge<br />
and gate, L d = drift length. The discussion of (3)<br />
shows that R can reach 150 and even more at<br />
L d = 10 cm, t R < 10 µs and E = 1.5 kV/cm.<br />
These <strong>high</strong> field strengths may produce some<br />
problems in routine devices. The cells designed<br />
have the following specific parameters:<br />
System Drift U d<br />
length [kV]<br />
[cm]<br />
IUT-25 2,5 0,8<br />
ß/UV<br />
IUT-50 5,0 2,0<br />
ß/UV<br />
IUT-100<br />
ß/UV<br />
10,0 5 - 7<br />
t Pulse<br />
[µs]<br />
350<br />
30<br />
10<br />
In fig. 4 the <strong>resolution</strong>s of the reaction ion<br />
peaks <strong>for</strong> these three cell types are shown.<br />
d<br />
d<br />
ap<br />
U pulse<br />
[kV]<br />
0,2-2<br />
0,2-2<br />
0,2-2<br />
2<br />
⎞<br />
⎟ +<br />
⎠<br />
t R<br />
[µs]<br />
30<br />
30<br />
30<br />
2 2 2<br />
Pulse d<br />
4<br />
L<br />
d<br />
R<br />
25<br />
50<br />
120<br />
(3)<br />
T<br />
0,03<br />
0,3<br />
0,3
J.W. Leonhardt et al.: „A <strong>high</strong> <strong>resolution</strong> <strong>IMS</strong>...”, IJ<strong>IMS</strong> 3(2000)1,43-49, p. 46<br />
1,0<br />
0,8<br />
0,6<br />
0,4<br />
0,2<br />
0,0<br />
0,000 0,002 0,004 0,006 0,008 0,010 0,012 0,014<br />
1,0<br />
0,8<br />
0,6<br />
amu0,4<br />
0,2<br />
0,0<br />
0,000 0,002 0,004 0,006 0,008 0,010 0,012 0,014<br />
1,0<br />
0,8<br />
0,6<br />
0,4<br />
0,2<br />
0,0<br />
0,000 0,002 0,004 0,006 0,008 0,010 0,012 0,014<br />
Figure 4:<br />
Reaction ion peaks of 3 IM - detectors<br />
demonstrating the progress in the<br />
<strong>resolution</strong><br />
4. Transmission<br />
The total charge picked off by the collector<br />
electrode with reference to the DC-ionisation<br />
current at saturation, I o, multiplied by t FWHM may<br />
characterise the transmission, that means the<br />
quality of the system:<br />
∫ i ( t ) dt<br />
o<br />
T =<br />
I t<br />
( 4 ) o<br />
⋅<br />
FWHM<br />
.<br />
∞<br />
The transmission of a photoionisation <strong>IMS</strong> can<br />
be determined by a given compound at a<br />
suitable concentration. The determination of I o<br />
may demand a special calibration arrangement.<br />
The used amplifier has a sensitivity of 5 × 10 9<br />
V/A and a rise time of 30 µs. Pulses with<br />
voltages between 0,2 - 2 kV were applied to the<br />
b-source. The IUT-50 system can be used as<br />
portable, hand held device or as a stationary<br />
unit. The data processing is carried out by<br />
means of a 32-bit processor. There is an<br />
alpha-numerical display <strong>for</strong> certain compounds<br />
in the mixture. The spectrum can be transferred<br />
to a PC. A special output is prepared <strong>for</strong> data<br />
transfer. The printed circuit board is designed in<br />
SMD-technology.<br />
RESULTS<br />
The photoionisation IUT-50 is designed <strong>for</strong> the<br />
sensitive detection of benzene down to the<br />
10 ppb level and in presence of other aromatics<br />
like toluene, xylene, cumene - often in much<br />
<strong>high</strong>er concentrations. The first version of a<br />
hand held system was checked in a chemical<br />
Copyright © 2000 by International Society <strong>for</strong> Ion Mobility Spectrometry<br />
t[s]<br />
factory. It works with a membrane inlet system<br />
(fig. 5). Benzene could be measured down to<br />
30 ppb in ambient air. Benzene ions get<br />
quenched in presence of toluene, xylene and<br />
also cumene. As long as the device is used in<br />
0,8<br />
0,6<br />
0,4<br />
amu<br />
0,2<br />
0,0<br />
Figure 5:<br />
Peaks of benzene, toluene and xylene<br />
measured by means of an IUT - <strong>IMS</strong> - 25,<br />
photoionisation<br />
0,008 0,010 0,012 0,014 0,016 0,018 0,020<br />
t [s]<br />
Figure 6:<br />
Mixture of toluene (1.4 ppm ) plus different<br />
concentration of benzene<br />
the trace level c < 1 ppm the benzene content<br />
still can be evaluated from the remaining<br />
benzene peak in the spectrum as shown in fig.<br />
6.<br />
The probability of the quenching reaction, like<br />
between benzene and toluene, j, is rather <strong>high</strong>:<br />
+ K B T<br />
+<br />
,<br />
B + T ⎯ ⎯ → B + T<br />
Toluol 1.4<br />
+ Benzol 62.4<br />
+ Benzol 33<br />
+ Benzol 17,5<br />
+ Benzol 9,2<br />
+ Benzol 4,9<br />
+ Benzol 2,6<br />
+ Benzol 1,37<br />
+ Benzol 0.72<br />
+ Benzol 0,38<br />
+ Benzol 0,2<br />
+ Benzol 0,11<br />
At benzene concentration of 1 ppm 1,4 ppm<br />
toluene cause a charge transfer of 80 % of the<br />
benzene ions.<br />
The region of response is up to 100 ppm. The<br />
situation could remarkably improved by the<br />
pre-separation of the aromatic compounds after<br />
sampling using an integrated column inside the
J.W. Leonhardt et al.: „A <strong>high</strong> <strong>resolution</strong> <strong>IMS</strong>...”, IJ<strong>IMS</strong> 3(2000)1,43-49, p. 47<br />
0,00<br />
-0,05<br />
-0,10<br />
-0,15<br />
current [amu]<br />
RIP<br />
-0,20<br />
-0,25<br />
Cl -<br />
-0,30<br />
0,002 0,003 0,004 0,005 0,006<br />
t [s]<br />
Figure 7:<br />
3D spectrum of 1 ppm benzene in toluene,<br />
xylene<br />
inner loop of the system. No additional carrier<br />
gas is needed.<br />
A 3-dimensional spectrum of about 1 ppm<br />
benzene in toluene, xylene is shown in fig. 7.<br />
Similar applications are thinkable <strong>for</strong> all<br />
compounds with a suitable photoionisation<br />
cross section at 10,2 or 10,6 eV. A typical<br />
1,6<br />
1,4<br />
1,2<br />
1,0<br />
0,8<br />
0,6<br />
0,4<br />
0,2<br />
0,0<br />
cell (R » 100) gives 2 peaks in the spectrum:<br />
Cl - and P(-Cl) - . This situation can be used to<br />
identify the mentioned compound.<br />
The detection of anaesthetic gases is described<br />
by Eiceman [7] and has been carried out by<br />
means of the 25/50 devices. Spectra are given<br />
in fig. 10 <strong>for</strong> halothane, isoflurane and<br />
enflurane.<br />
This system can be applied excellently <strong>for</strong> the<br />
halocarbon determination in the GC-<strong>IMS</strong> mode.<br />
0,00<br />
Figure 9a:<br />
5 ppm phosgene in air, <strong>resolution</strong> 25<br />
-0,02<br />
10<br />
phosgene ion<br />
retention time<br />
-0,04<br />
20<br />
0,000 0,005 0,010<br />
drift time<br />
-0,06<br />
Cl -<br />
Figure 8:<br />
IM - Spectrum of a gasoline sample<br />
(Super Plus, BP)<br />
current [amu]<br />
-0,08<br />
application is the 3D-spectrum of gasoline<br />
(British Petrol, Super plus) shown in fig. 8, in<br />
which aromatics and alcanes produce a<br />
fingerprint picture. The identification of gasoline<br />
is possible.<br />
The determination of phosgene in ambient air is<br />
a classical industrial application. The typical<br />
spectra are given in fig. 9 (a) and (b). While (a)<br />
mainly resolves the Cl-ion, the <strong>high</strong> <strong>resolution</strong><br />
-0,10<br />
-0,12<br />
0,0045 0,0050 0,0055 0,0060<br />
t [s]<br />
RIP<br />
Figure 9b:<br />
Phosgene ion peaks and reaction ion peak,<br />
<strong>resolution</strong> 100<br />
Copyright © 2000 by International Society <strong>for</strong> Ion Mobility Spectrometry
J.W. Leonhardt et al.: „A <strong>high</strong> <strong>resolution</strong> <strong>IMS</strong>...”, IJ<strong>IMS</strong> 3(2000)1,43-49, p. 48<br />
current [amu]<br />
0,05<br />
0,00<br />
-0,05<br />
-0,10<br />
-0,15<br />
-0,20<br />
monomer ion<br />
dimer ion<br />
current [amu]<br />
350<br />
300<br />
250<br />
200<br />
150<br />
100<br />
50<br />
0<br />
(a) Cl + Br in air, normal spectrum<br />
Cl -<br />
RIP<br />
(b) Cl + Br in air, deconvoluted spectrum<br />
Cl -<br />
Br -<br />
Br -<br />
4,00 4,25 4,50 4,75 5,00 5,25 5,50 5,75 6,00<br />
RIP<br />
Figure 11:<br />
Simultaneous<br />
detection of<br />
chloride and<br />
bromide ions in a<br />
sample of<br />
bromochlorometha<br />
ne a: normal<br />
spectrum b:<br />
deconvoluted<br />
spectrum<br />
-0,25<br />
drift time t [ms]<br />
The <strong>resolution</strong> power of 100 is demonstrated in<br />
fig. 11. (1) shows the Cl - - and Br - -Peaks being<br />
produced from bromochloromethane. Using the<br />
mathematical deconvolution [6] the spectrum<br />
could be improved again by a factor 2.<br />
0,7<br />
0,6<br />
-0,30<br />
-0,35<br />
-0,40<br />
Figure 10:<br />
Ion mobility spectrum of isofluran (narcotic)<br />
in the negative mode with membrane -<br />
inletsystem, 2.4 ppm)<br />
RIP<br />
RIP<br />
0,010 0,015 0,020 0,025<br />
monomer ion M +<br />
t [s]<br />
+<br />
dimer ion M 2<br />
In fig. 12 the spectrum of malonacidester as<br />
somane simulance is shown. At a concentration<br />
of 100 ppb the monomer and dimer peaks can<br />
be seen clearly. Other examples <strong>for</strong> the positive<br />
mode are acrolein in fig. 13 and <strong>for</strong>maldehyde<br />
in fig. 14. In case of <strong>for</strong>maldehyde the gas inlet<br />
system is rather sophisticated.<br />
DISCUSSION<br />
The application of <strong>IMS</strong>-equipment is limited<br />
obviously by the still incomplete basic<br />
knowledge about reactions and mechanisms<br />
and furthermore by missing data bases.<br />
There<strong>for</strong>e the suggestion of Karpas et al [3] to<br />
use calibration standards of the mobility scale<br />
is a very useful method to make comparable<br />
various systems. The GC-<strong>IMS</strong> is an interesting<br />
feature to improve the acceptance of this<br />
method [11]. An interesting contribution to the<br />
<strong>IMS</strong> application activities may be the system<br />
with an integrated column in the gas loop. This<br />
0,5<br />
0,4<br />
0,4<br />
RIP<br />
current [amu]<br />
0,3<br />
RIP (air)<br />
0,3<br />
0,2<br />
0,1<br />
current [amu]<br />
0,2<br />
0,0<br />
0,002 0,004 0,006 0,008 0,010 0,012 0,014<br />
drift time t [s]<br />
0,1<br />
Figure 12:<br />
0.1 mg/m 3 soman-simulance<br />
(malonacidester) and reaction<br />
ion peak (RIP) - positive mode<br />
Copyright © 2000 by International Society <strong>for</strong> Ion Mobility Spectrometry<br />
0,0<br />
0,008 0,010 0,012 0,014 0,016 0,018<br />
t [s]<br />
Figure 13: Acrolein in air - positive mode
J.W. Leonhardt et al.: „A <strong>high</strong> <strong>resolution</strong> <strong>IMS</strong>...”, IJ<strong>IMS</strong> 3(2000)1,43-49, p. 49<br />
0,014<br />
0,012<br />
RIP<br />
REFERENCES<br />
[1] Eiceman, G.A., Karpas, Z., Ion Mobility Spectrometry,<br />
CRG Press, Boca Raton, FL (1994)<br />
[2] Eiceman, G.A. Crit. Rev. Anal. Chem., 22, 471 (1991)<br />
current [amu]<br />
0,010<br />
0,008<br />
0,006<br />
0,004<br />
0,002<br />
0,000<br />
0,008 0,010 0,012 0,014 0,016<br />
Figure 14:<br />
Formaldehyde spectrum - positive mode<br />
system equipped with a photoionisation source<br />
is able to avoid and toluene. Fingerprints of<br />
flammable and other organic mixtures can be<br />
evaluated by a portable system. The<br />
PI-GC-<strong>IMS</strong> has good prospects to reach the<br />
sub-ppb range <strong>for</strong> many compounds. So far we<br />
are convinced that this method will have a good<br />
future also in emission determination. New<br />
application fields of <strong>IMS</strong>-devices are coming up<br />
in electrotechnical engineering [9] and<br />
microelectronics. The control of gas purity but<br />
also the characterisation of outgassings of<br />
polymers are topics of <strong>high</strong> interest [10].<br />
Acknowledgments<br />
The basic principles of this work were<br />
sponsored by the Federal Ministry of Science<br />
and Technology.No. 01 VQ 916B/O, 1991.<br />
t [s]<br />
[3] Karpas, Z., Wang, Y.F., Eiceman, G.A., Harden, C.S.<br />
Chemical Standards <strong>for</strong> Calibration of the Mobility<br />
Scale in Ion Mobility Spectrometry - in press -<br />
[4] PREVAC GmbH, Mikro-Ionisations-Gassensor<br />
(MIGA) zur Schadstoffbestimmung, speziell für<br />
halogenierte Kohlenwasserstoffe, BMFT.<br />
Förderkennzeichen 01 Q 916B/O. (1991 - 1994)<br />
[5] St. Louis, R.M., Hill, H.H. Jr. Ion Mobility<br />
Spectrometry in Analytical Chemistry. Anal. Chem.,<br />
21, 321 (1985)<br />
[6] Ehart Bell, S., Wang, Y.F., Walsh, M.K., Qishi Du,<br />
Ewing, R.G., Eicemann, G.A. Qualitative and<br />
quantitative Evaluation of Deconvolution <strong>for</strong> Ion<br />
Mobility Spectrometry. An. Chim. Acta 303, 163 - 174<br />
(1995)<br />
[7] Eiceman, G.A., Shoff, D.B., Harden, C.S., nyder, A.P.<br />
Ion Mobility Spectrometry of Halothane, Enflurane<br />
and Isoflurane/Anesthetics in Air and Respired<br />
Gases. Anal. Chem. 61, 1093 (1989)<br />
[8] Caroll, D.I., Dzidic, I., Stillwell, R.N. and Horning, E.C.<br />
Identification of positive Reactions Observed <strong>for</strong><br />
Nitrogen Carrier Gas in Plasma Chromatography<br />
Mobility Studies. Anal. Chem. 47, 12 (1975)<br />
[9] Baumbach, J.I. <strong>IMS</strong> Application in SF 6-switchers,<br />
private communication<br />
[10] Budde, K.I., Holzapfel W.I., Beyer, M.M. Application<br />
of Ion Mobility Spectrometry to Semiconductor<br />
Technology: Outgassings of Advenced Polymers<br />
under Thermal Stress, J. Electrochem. Soc., 142, 3<br />
(1995)<br />
[11] Snyder, A.P., Harden, C.S., Brittain, A.H., Man Goo<br />
Kim, Arnold, N.S., Menzelaev, H.L.C. Portable<br />
Hand-Held Gas Chromatographie/Ion Mobility<br />
Spectrometry Device. Anal. Chem 65, 299 - 306<br />
(1993)<br />
Copyright © 2000 by International Society <strong>for</strong> Ion Mobility Spectrometry