SUFFiciENcy EcONOMy ANd GRASSROOtS DEvElOPMENt
SUFFiciENcy EcONOMy ANd GRASSROOtS DEvElOPMENt
SUFFiciENcy EcONOMy ANd GRASSROOtS DEvElOPMENt

Create successful ePaper yourself
Turn your PDF publications into a flip-book with our unique Google optimized e-Paper software.
286<br />
The Meaning of Sufficiency Economy <br />
International Conference<br />
Results and Discussion<br />
The occupation status of the respondents reveal that, out of 401 members<br />
agricultural<br />
study aim at<br />
labours<br />
organizing<br />
with/<br />
the<br />
without<br />
poor people.<br />
animal<br />
Initially<br />
husbandry<br />
the groups<br />
activities<br />
which<br />
form<br />
emerged<br />
the single<br />
naturally<br />
largest<br />
majority consisted (81.79%). of members It who is also came found forward that voluntarily. 92% of the members Invariably are the Hindus poorest followed people<br />
by<br />
were<br />
6.48%<br />
diffident<br />
of Christians.<br />
and unwilling<br />
The<br />
to<br />
NGOs<br />
join<br />
involved<br />
the groups.<br />
in the<br />
But<br />
formation<br />
on seeing<br />
of<br />
the<br />
groups<br />
successful<br />
of the<br />
present study aim at organizing the poor people. Initially the groups which emerged<br />
naturally experience consisted of the other of members the who poor came agreed forward to form groups. voluntarily. Keeping Invariably the criteria the<br />
poorest of family people income were of Rs.11,000/- diffident and as the unwilling cut off to point, join it the is groups. found that But 54.11% on seeing of the the<br />
successful experience of the other members the poor agreed to form groups.<br />
total members are below the poverty line. The poorest with annual income below<br />
Keeping the criteria of family income of Rs.11,000/- as the cut off point, it is found<br />
that Rs.6,000/- 54.11% are of found the total more members among are the below group the members poverty of line. MYRADA The poorest (21.05%). with<br />
annual Vikasana income (18%) below and Pragathi Rs.6,000/- (17.78%). are found Economic more among status of the group group members members the of<br />
MYRADA (21.05%). Vikasana (18%) and Pragathi (17.78%). Economic status of<br />
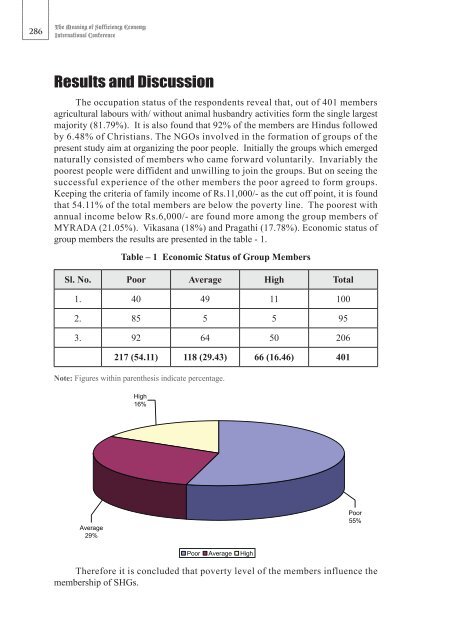
group results members are presented the results in the table are presented - 1. in the table - 1.<br />
Table – 1 Economic Status of Group Members<br />
Table – 1<br />
Sl. No. Poor Economic Status Average of Group Members High Total<br />
Sl. No. 1. Poor 40 Average 49 High 11 Total 100<br />
1. 40 49 11 100<br />
2. 2. 8585 5 5 5 5 95 95<br />
3. 92 64 50 206<br />
3.<br />
217<br />
92<br />
118<br />
64<br />
66<br />
50 206<br />
401<br />
<br />
(54.11)<br />
217 (54.11)<br />
(29.43)<br />
118 (29.43)<br />
(16.46)<br />
66 (16.46) 401<br />
Note: Figures within parenthesis indicate percentage.<br />
Note: Figures within parenthesis indicate percentage.<br />
<br />
High<br />
16%<br />
Average<br />
29%<br />
Poor<br />
55%<br />
Poor Average High<br />
Therefore it is concluded that poverty level of the members influence the<br />
membership of SHGs.<br />
Therefore it is concluded that poverty level of the members influence the<br />
membership of SHGs.