The LINOS Optics Software - Qioptiq Q-Shop
The LINOS Optics Software - Qioptiq Q-Shop
The LINOS Optics Software - Qioptiq Q-Shop

Create successful ePaper yourself
Turn your PDF publications into a flip-book with our unique Google optimized e-Paper software.
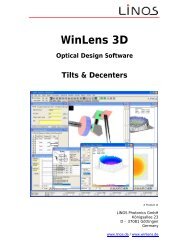
<strong>Optics</strong> <strong>Software</strong><br />
Analyze<br />
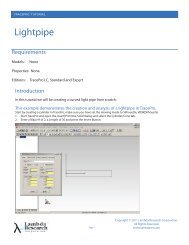
TracePro’s Analysis menu provides a<br />
comprehensive set of tools to view and<br />
analyze the results of the raytrace.<br />
Irradiance and Illuminance Maps<br />
An Irradiance Map shows irradiance<br />
incident or absorbed on a selected<br />
surface.<br />
Map types include the quantities to plot:<br />
••<br />
Irradiance, a plot of power in watts<br />
per unit area or lux, incident or<br />
absorbed by a surface<br />
••<br />
CIE (x,y) and CIE (u1,v1), plots of color<br />
in CIE coordinates<br />
••<br />
Bitmap RGB and True Color<br />
Display Options control the plot output.<br />
<strong>The</strong> results of an irradiance calculation<br />
can be exported to other software<br />
packages such as Excel and the data and<br />
plot may be saved as text and bitmap<br />
files.<br />
Luminance/Radiance Maps<br />
After a Luminance Map is raytraced, it<br />
may be displayed as true color or a<br />
photorealistic rendering based on the<br />
wavelengths traced. <strong>The</strong> results of the<br />
ray trace may be displayed as either a<br />
Luminance or Radiance Map with<br />
photometric units (cd/m 2 , foot-lambert,<br />
or millilambert) or radiometric units (W/<br />
m 2 ) respectively.<br />
3-D Irradiance Plots<br />
3-D Irradiance Plots map the incident flux<br />
on selected surfaces or objects.<br />
Candela Plots<br />
Polarization Maps<br />
Polarization Maps map the polarization<br />
ellipse for the incident flux on the<br />
selected surface. Color levels graphically<br />
display the degree of polarization at<br />
points on the surface.<br />
Incident Ray Tables<br />
An Incident Ray Table shows data for rays<br />
incident on a selected surface.<br />
Ray Sorting<br />
Ray Sorting affects the display of rays in<br />
the model window and may be applied<br />
to plots and tables. <strong>The</strong> display of rays<br />
may be sorted by:<br />
••<br />
All rays<br />
••<br />
Only rays hitting a selected surface<br />
••<br />
Only specular and no scattered rays<br />
••<br />
Only rays undergoing a single or<br />
undergoing multiple scatter<br />
••<br />
Wavelength<br />
••<br />
% of starting rays<br />
Reports<br />
TracePro generates raytrace and property<br />
reports.<br />
<strong>The</strong> Flux Report provides a summary of<br />
surface area, number of incident rays,<br />
incident and absorbed fluxes and lost<br />
flux. Data is displayed for bulk absorption<br />
and incident flux for each object.<br />
<strong>The</strong> Property Data Report contains the<br />
model’s property data and may be<br />
exported to a *.txt file.<br />
<strong>The</strong> Raytrace Report displays physical and<br />
virtual memory usage and elapsed<br />
raytrace time.<br />
Design, Macro Language<br />
TracePro includes the Scheme programming<br />
language, a powerful and flexible<br />
macro language for manipulating views,<br />
editing geometry and writing macro<br />
programs. TracePro’s Macro Recorder<br />
captures the TracePro commands used<br />
during a session and stores the equivalent<br />
Scheme commands to a file. <strong>The</strong> file<br />
can then be executed.<br />
TracePro Applications<br />
••<br />
Life Sciences<br />
••<br />
Industrial Manufacturing<br />
••<br />
Metrology<br />
••<br />
Inspection<br />
••<br />
Material Processing<br />
••<br />
Machine Vision<br />
••<br />
Process Control<br />
••<br />
Automation and Robotics<br />
••<br />
Semiconductor Processing and<br />
Metrology<br />
••<br />
Information Technology<br />
••<br />
Data and Telecommunications<br />
••<br />
Data Storage<br />
••<br />
Supply Chain: Bar Code and RFID<br />
••<br />
Printing and Reprographics<br />
••<br />
Scanning<br />
••<br />
Imaging<br />
••<br />
Aerospace<br />
••<br />
Aviation<br />
••<br />
Astronomy<br />
••<br />
Defense<br />
••<br />
Environmental Monitoring and Sensing<br />
••<br />
Remote Sensing and LIDAR<br />
••<br />
Security<br />
••<br />
Power and Energy: Laser Fusion<br />
••<br />
Stray Light Analysis<br />
Candela Plots plot luminous intensity or<br />
flux per solid angle. <strong>The</strong>se intensity plots<br />
are displayed in photometric units<br />
(candelas or lumens per steradian) and in<br />
radiometric units (watts per steradian).<br />
Irradiance/Illuminance Viewer<br />
<strong>The</strong> Irradiance/Illuminance Viewer allows<br />
users to view Irradiance/Illuminance<br />
Maps that have been saved as text files<br />
and combine data from multiple maps.<br />
<strong>Optics</strong> <strong>Software</strong><br />
Germany-Phone: +49 (0) 551/ 6935-0 France-Phone: +33 - 47 25 20 420<br />
597