Working Without Laws: A Survey of Employment and Labor Law
Working Without Laws: A Survey of Employment and Labor Law
Working Without Laws: A Survey of Employment and Labor Law

Create successful ePaper yourself
Turn your PDF publications into a flip-book with our unique Google optimized e-Paper software.
est breaks<br />
ff the clock work<br />
eal breaks<br />
vertime<br />
inimum wage<br />
ight <strong>Working</strong> to organize<br />
etaliation<br />
orkers’ comp<br />
est<br />
A <strong>Survey</strong><br />
breaks<br />
<strong>of</strong> <strong>Employment</strong> <strong>and</strong><br />
ff the clock work<br />
By<br />
eal<br />
Annette Bernhardt,<br />
breaks<br />
Diana Polson <strong>and</strong> James DeFilippis<br />
vertime<br />
inimum wage<br />
ight to organize<br />
etaliation<br />
orkers’ comp<br />
est breaks<br />
<strong>Without</strong> <strong><strong>Law</strong>s</strong>:<br />
<strong>Labor</strong> <strong>Law</strong> Violations in New York City<br />
With Ruth Milkman, Nik Theodore, Douglas Heckathorn, Mirabai Auer,<br />
Ana Luz González, Victor Narro, Jason Perelshteyn <strong>and</strong> Michael Spiller
Advisory Boards<br />
New York City Community<br />
<strong>and</strong> <strong>Labor</strong> Advisory Board<br />
African Services Committee<br />
Andolan—Organizing South Asian Workers<br />
Asian American Legal Defense<br />
<strong>and</strong> Education Fund<br />
Community Voices Heard<br />
Consortium for Worker Education<br />
Domestic Workers United<br />
El Centro del Inmigrante<br />
Fifth Avenue Committee<br />
Garment Industry Development Corporation<br />
Greater New York <strong>Labor</strong>ers—Employers<br />
Cooperation <strong>and</strong> Education Trust (LECET)<br />
Latin American Workers’ Project<br />
LatinoJustice PRLDEF<br />
Make the Road New York<br />
MinKwon Center for Community Action<br />
New York <strong>and</strong> Vicinity Carpenters <strong>Labor</strong><br />
Management Corporation<br />
New York City Central <strong>Labor</strong> Council<br />
New York Committee for Occupational<br />
Safety <strong>and</strong> Health (NYCOSH)<br />
New York Hotel <strong>and</strong> Motel Trades Council<br />
New York Jobs with Justice<br />
New York Taxi Workers Alliance<br />
Northwest Bronx Community<br />
<strong>and</strong> Clergy Coalition<br />
Queens Community House<br />
Retail, Wholesale <strong>and</strong><br />
Department Store Union, UFCW<br />
Seedco<br />
SEIU Local 32BJ<br />
SEIU Local 1199<br />
The Bronx Defenders<br />
The Legal Aid Society<br />
The New York Immigration Coalition<br />
UFCW Local 1500<br />
Urban Justice Center —<br />
Community Development Project<br />
Workers United<br />
National Advisory Board<br />
Eileen Appelbaum<br />
Rutgers University<br />
Jennifer Gordon,<br />
Fordham <strong>Law</strong> School<br />
Mark H<strong>and</strong>cock,<br />
University <strong>of</strong> Washington<br />
Marielena Hincapie,<br />
National Immigration <strong>Law</strong> Center<br />
Martin Iguchi,<br />
UCLA/R<strong>and</strong><br />
Manuel Pastor,<br />
University <strong>of</strong> Southern California<br />
Cathy Ruckelshaus<br />
National <strong>Employment</strong> <strong>Law</strong> Project<br />
Restaurant Opportunities Center <strong>of</strong> New York<br />
ii
Acknowledgements<br />
We incurred numerous debts in conducting this<br />
study in New York City. Above all, we thank the<br />
1,432 New Yorkers who took valuable time out<br />
<strong>of</strong> their lives to participate in our survey. We also<br />
are grateful to the members <strong>of</strong> our national <strong>and</strong><br />
local advisory boards, as well as the staff <strong>of</strong> the<br />
National <strong>Employment</strong> <strong>Law</strong> Project, for invaluable<br />
help throughout all phases <strong>of</strong> the project.<br />
The fielding <strong>of</strong> our survey could not have<br />
happened without the talented <strong>and</strong> dedicated<br />
team <strong>of</strong> interviewers <strong>and</strong> translators we<br />
had in New York. This team included Zayne<br />
Abdessalam, Ingrid Baez, Mame-Yaa Bosumtwo,<br />
Lana Cheung, Lourdes Diaz, Beatriz Gil, Ilsoon<br />
Han, Julia Heming, Marta Kuersten, Julita<br />
Kwapinska, Emmanuel Louizaire, Olga Mexina,<br />
Eliseo Perez, Kwanza Price, Mohammed<br />
Rahman, Gabriela Reardon <strong>and</strong> Rachel Soltis.<br />
Majed Abbadi, Ju Bum Cha, Ewa Grigar <strong>and</strong><br />
Humayun Kabir assisted with written translation<br />
early on in the project.<br />
We are enormously grateful to the Joseph S.<br />
Murphy Institute for Worker Education <strong>and</strong> <strong>Labor</strong><br />
Studies for donating vital space <strong>and</strong> resources<br />
for the fielding <strong>of</strong> our survey. Gregory Mantsios,<br />
Paula Finn, Jeannette Gabriel, <strong>and</strong> the rest <strong>of</strong> the<br />
staff at the Institute warmly welcomed us into<br />
their <strong>of</strong>fices <strong>and</strong> provided us with an invaluable<br />
home base for our project.<br />
This research was generously funded by<br />
the Ford Foundation, the John R<strong>and</strong>olph<br />
Haynes <strong>and</strong> Dora Haynes Foundation, the<br />
Joyce Foundation <strong>and</strong> the Russell Sage<br />
Foundation. We greatly appreciate the<br />
support we received from Whitney Smith,<br />
Diane Cornwell <strong>and</strong> Héctor Cordero-Guzmán.<br />
We are especially indebted to Eric Wanner,<br />
Aixa Cintrón-Veléz <strong>and</strong> Katherine McFate,<br />
without whom this project would not have<br />
been possible. The views expressed in this<br />
report are solely those <strong>of</strong> the authors.<br />
Similarly, we thank the following institutions <strong>and</strong><br />
individuals for generously donating space for<br />
conducting our surveys: Carlos Molina, Lorraine<br />
Altman <strong>and</strong> Chief Arnaldo Bernabe at Hostos<br />
Community College; Aldrin Rafael Bonilla <strong>and</strong><br />
Lesley Vann at CUNY in the Heights; David<br />
Andersson, Nahar Alam <strong>and</strong> Liliana Tovar at the<br />
Diversity Center <strong>of</strong> Queens; Ron Thomas at York<br />
College; <strong>and</strong> Ingrid Schwazki<strong>of</strong>, Carol Summar<br />
<strong>and</strong> George Miles at the Brooklyn Friends<br />
Meeting House.<br />
A special thanks goes out to the following people<br />
for enthusiastically responding to our many<br />
requests for help during the project: Dimple<br />
Abich<strong>and</strong>ani, Rajani Adhikary, Chitra Aiyar, Steve<br />
Choi, Carrie Cleason, Darly Corniel, Francine<br />
Delgado, Bhairavi Desai, Jeff Eichler, Nai Fowler,<br />
Andrew Friedman, Daniel Gross, Artemio<br />
Guerra, Annabelle Heckler, Janet Hines, Sherry<br />
Kane, Chauncey Lennon, Rebecca Lurie, James<br />
Mumm, Ed Ott, Lenore Palladino, Amadou Papa<br />
Diao, Ai-jen Poo, Rizwan Raja, Christine Riordan,<br />
Kate Rubin, Sekou Siby, Zoe Sullivan, Ron<br />
Thomas <strong>and</strong> Sondra Youdelman.<br />
For their invaluable comments on drafts <strong>of</strong><br />
this report, we thank Laura Caruso, Andrew<br />
Friedman, Priscilla Gonzalez, Saru Jayaraman,<br />
Raj Nayak, Chris Owens, Cathy Ruckelshaus,<br />
Joel Shufro, Rebecca Smith, Paul Sonn<br />
<strong>and</strong> Elly Spicer.<br />
Madonna Camel, Yuteh Cheng, Jay Fraser<br />
<strong>and</strong> Bob Lee <strong>of</strong> the <strong>Survey</strong> Research Center<br />
at the University <strong>of</strong> California, Berkeley provided<br />
expert assistance with interviewer training <strong>and</strong><br />
the programming <strong>of</strong> the survey instrument.<br />
The survey instrument was translated into<br />
Spanish by Juanita Norori, <strong>and</strong> Alfredo Burgos<br />
created the pictographs we used in our<br />
recruitment documents.<br />
iii
Acknowledgements continued…<br />
We also benefited from the legal expertise <strong>of</strong><br />
Nathan Barksdale, Laurie Burgess, Michael<br />
Ettlinger, Natalia Garcia, Tsedeye Gebreselassie,<br />
Janet Herold, Mark Humowiecki, E. Tammy Kim,<br />
Kevin Kish, Samuel Krinsky, Sarah Leberstein,<br />
Becky Monroe, Raj Nayak, Oscar Ospino, Luis<br />
Perez, Cathy Ruckelshaus, Paul Sonn, Nancy<br />
Steffan, Jennifer Sung, Khari Taustin <strong>and</strong> Chris<br />
Williams, as well as the many lawyers who<br />
responded to our queries to NELP’s National<br />
Wage <strong>and</strong> Hour Clearinghouse. For advice on<br />
the intricacies <strong>of</strong> workers’ compensation, we<br />
are grateful to Danielle Lucido, Jeremy Smith<br />
<strong>and</strong> Tom Rankin. Thanks also go to Nina Martin,<br />
Jamie Peck <strong>and</strong> Noah Zatz for their input on<br />
the survey design, <strong>and</strong> to Terri Zhu for her<br />
assistance at the analysis stage. Mark H<strong>and</strong>cock,<br />
Martin Iguchi <strong>and</strong> <strong>Law</strong>rence Ouellet <strong>of</strong>fered<br />
helpful advice about the intricacies <strong>of</strong> RDS<br />
fielding <strong>and</strong> data analysis. Christine D’On<strong>of</strong>rio,<br />
Michael Ettlinger, Mark Levitan <strong>and</strong> Jeremy<br />
Reiss provided us expert advice about payroll<br />
tax deductions. Jeffrey Passel <strong>and</strong> John Schmitt<br />
provided invaluable analysis <strong>of</strong> demographic <strong>and</strong><br />
wage data from the Current Population <strong>Survey</strong>.<br />
And <strong>of</strong> course, we would like to thank our<br />
collaborators, Ruth Milkman, Nik Theodore,<br />
Douglas Heckathorn, Mirabai Auer, Ana Luz<br />
González, Victor Narro, Jason Perelshteyn<br />
<strong>and</strong> Michael Spiller, for their extraordinary<br />
collaborative work on this project.<br />
About the Authors<br />
Annette Bernhardt, Ph.D., is policy co-director<br />
<strong>of</strong> the National <strong>Employment</strong> <strong>Law</strong> Project, where<br />
she coordinates policy analysis <strong>and</strong> research<br />
support for campaigns around living wage<br />
jobs, workplace enforcement <strong>and</strong> accountable<br />
development. She has published widely on<br />
low-wage work, <strong>and</strong> recently co-edited<br />
The Gloves-Off Economy: Workplace St<strong>and</strong>ards<br />
at the Bottom <strong>of</strong> America’s <strong>Labor</strong> Market.<br />
Diana Polson is a policy analyst at the National<br />
<strong>Employment</strong> <strong>Law</strong> Project <strong>and</strong> a political science<br />
Ph.D. student at the City University <strong>of</strong> New<br />
York. Her research focuses on the low-wage<br />
labor market, care-giving work <strong>and</strong> new forms <strong>of</strong><br />
community-labor organizing.<br />
James DeFilippis, Ph.D., is associate pr<strong>of</strong>essor<br />
at the Bloustein School <strong>of</strong> Planning <strong>and</strong> Public<br />
Policy at Rutgers University. He has published<br />
extensively on the politics <strong>and</strong> economics <strong>of</strong><br />
cities. His books include Unmaking Goliath<br />
(named “Best Book in Urban Politics, 2004”<br />
by the American Political Science Association)<br />
<strong>and</strong> The Community Development Reader.<br />
Collaborators: Ruth Milkman, UCLA <strong>and</strong> CUNY<br />
Graduate Center; Nik Theodore, University <strong>of</strong><br />
Illinois at Chicago; Douglas D. Heckathorn,<br />
Cornell University; Mirabai Auer, University <strong>of</strong><br />
Illinois at Chicago; Ana Luz González, UCLA;<br />
Victor Narro, UCLA Downtown <strong>Labor</strong> Center;<br />
Jason Perelshteyn, Cornell University; <strong>and</strong><br />
Michael Spiller, Cornell University.<br />
iv
Contents<br />
Executive Summary 2<br />
1: Introduction 7<br />
2: A L<strong>and</strong>mark <strong>Survey</strong> <strong>of</strong> the Low-Wage <strong>Labor</strong> Market in New York City 11<br />
3: The Prevalence <strong>of</strong> Workplace Violations in New York City 17<br />
4: The Role <strong>of</strong> Job <strong>and</strong> Employer Characteristics 25<br />
5: The Role <strong>of</strong> Worker Characteristics 37<br />
6: Wage Theft in New York City 43<br />
7: The Solution: How New York Can Strengthen Worker Protections 45<br />
Appendix A: Data <strong>and</strong> Methods 53<br />
Endnotes 58<br />
References 61
Executive Summary<br />
This report exposes a world <strong>of</strong> work in which America’s core labor <strong>and</strong> employment laws are failing<br />
to protect significant numbers <strong>of</strong> workers in the nation’s largest city. These protections—the right<br />
to be paid at least the minimum wage, the right to be paid for overtime hours, the right to take meal<br />
breaks, access to workers’ compensation when injured <strong>and</strong> the right to advocate for better working<br />
conditions—are being violated at alarming rates in the city’s low-wage labor market. The sheer breadth<br />
<strong>of</strong> the problem, spanning key industries in the economy, as well as its pr<strong>of</strong>ound impact on workers <strong>and</strong><br />
their communities, entailing significant economic hardship, dem<strong>and</strong> urgent attention.<br />
In 2008, we conducted a l<strong>and</strong>mark survey <strong>of</strong> 1,432 workers in low-wage industries in New York City.<br />
We used an innovative, rigorous methodology that allowed us to reach vulnerable workers who <strong>of</strong>ten<br />
are missed in st<strong>and</strong>ard surveys, such as unauthorized immigrants <strong>and</strong> those paid in cash. Our goal was<br />
to obtain accurate <strong>and</strong> statistically representative estimates <strong>of</strong> the prevalence <strong>of</strong> workplace violations.<br />
All findings are adjusted to be representative <strong>of</strong> front-line workers (excluding managers, pr<strong>of</strong>essional or<br />
technical workers) in low-wage industries in New York City—a population that we estimate numbers<br />
more than a half-million (586,322) workers.<br />
Finding 1: Workplace violations are severe <strong>and</strong><br />
widespread in New York’s low-wage labor market<br />
We found that many employment <strong>and</strong> labor laws regularly <strong>and</strong> systematically are violated, impacting a<br />
significant part <strong>of</strong> the low-wage workforce in New York City. Here we summarize only key violations;<br />
Table 3.1 lists all the violations measured in our study.<br />
Minimum wage violations:<br />
•Fully 21 percent <strong>of</strong> workers in our sample were paid less than the legally required minimum<br />
wage in the previous workweek. *<br />
•These minimum wage violations were not trivial in magnitude: 51 percent <strong>of</strong> workers were<br />
underpaid by more than $1 per hour.<br />
Overtime violations:<br />
• More than one-third <strong>of</strong> our respondents had worked more than 40 hours during the previous<br />
week. Of those, 77 percent were not paid the legally required overtime rate by their employer<br />
• Like minimum wage violations, overtime violations were substantial in magnitude. The average<br />
worker with a violation had worked 13 hours <strong>of</strong> overtime in the previous week—hours that either<br />
were underpaid or not paid at all.<br />
•New York also has a daily overtime requirement when employees work more than 10 hours in<br />
a single day. The vast majority <strong>of</strong> workers (93 percent) who qualified for this daily overtime pay<br />
did not receive it.<br />
2<br />
* In this summary we are not able to elaborate the complexity <strong>of</strong> employment <strong>and</strong> labor laws; see the main report for details on federal <strong>and</strong> state<br />
legal st<strong>and</strong>ards <strong>and</strong> coverage.
“Off-the-clock” violations:<br />
• Nearly one-third (29 percent) <strong>of</strong> the workers in our sample came in early <strong>and</strong>/or stayed late after<br />
their shift during the previous workweek. Of these workers, 69 percent did not receive any pay at<br />
all for the work they performed outside <strong>of</strong> their regular shift.<br />
Meal break violations:<br />
•The large majority <strong>of</strong> our respondents (90 percent) worked enough consecutive hours to be<br />
legally entitled to at least one meal break during the previous week. Of these workers, more than<br />
two-thirds (70 percent) received no break at all, had their break shortened, were interrupted by<br />
their employer or worked during the break—all <strong>of</strong> which constitute a violation <strong>of</strong> meal break law.<br />
Pay stub violations <strong>and</strong> illegal deductions:<br />
•According to New York state law, workers are required to receive documentation <strong>of</strong> their earnings<br />
<strong>and</strong> deductions, regardless <strong>of</strong> whether they are paid in cash or by check. However, 55 percent <strong>of</strong><br />
workers in our sample did not receive this m<strong>and</strong>atory documentation in the previous workweek.<br />
•In New York, employers generally are not permitted to take deductions from a worker’s pay for<br />
damage or loss, work-related tools or materials or transportation. But 33 percent <strong>of</strong> respondents<br />
who reported deductions from their pay in the previous workweek were subjected to these types<br />
<strong>of</strong> illegal deductions.<br />
Tipped job violations:<br />
• In New York State, workers who receive tips have a separate, lower minimum wage requirement.<br />
Of the tipped workers in our sample, 37 percent were paid less than the tipped worker minimum<br />
wage in the previous workweek.<br />
Illegal employer retaliation:<br />
We found that when workers complained about their working conditions or tried to organize a union,<br />
employers <strong>of</strong>ten responded by retaliating against them. Just as importantly, many workers never made<br />
complaints in the first place, <strong>of</strong>ten because they feared retaliation by their employer.<br />
•Nearly one-quarter (23 percent) <strong>of</strong> the workers in our sample reported they had made a complaint<br />
to their employer or government agency, or attempted to form a union, in the last year. Of those,<br />
42 percent experienced one or more forms <strong>of</strong> illegal retaliation from their employer. For example,<br />
employers cut workers’ hours <strong>and</strong>/or pay, fired or suspended workers or threatened to call<br />
immigration authorities.<br />
• Another 23 percent <strong>of</strong> workers reported they did not make a complaint to their employer during<br />
the past 12 months, even though they had experienced a serious problem such as dangerous<br />
working conditions or not being paid the minimum wage. Of these workers, 41 percent were<br />
afraid <strong>of</strong> losing their job <strong>and</strong> 40 percent thought it would not make a difference. Fear <strong>of</strong> retaliation<br />
<strong>and</strong> expectations <strong>of</strong> employer indifference, then, figure strongly in workers’ decisions about<br />
whether to make a complaint.<br />
3
Executive Summary continued…<br />
Workers’ compensation violations:<br />
We found that the workers’ compensation system is not functioning for many workers in the low-wage<br />
labor market.<br />
•Of the workers in our sample who recently experienced a serious injury on the job, only 11<br />
percent filed a workers’ compensation claim. In addition, fully 47 percent reported they were<br />
required to work despite their injury, <strong>and</strong> an additional 33 percent said their employer refused to<br />
help them with the injury.<br />
•When the injured workers in our sample sought medical attention, 75 percent either had to pay<br />
their bills out <strong>of</strong> pocket or use their health insurance to cover expenses. Only 6 percent had their<br />
medical expenses paid by workers’ compensation insurance.<br />
•When workers told their employer about the injury, 16 percent experienced an illegal employer<br />
reaction; for example, employers fired or threatened to fire workers if they filed a claim, called or<br />
threatened to call immigration authorities, or instructed the workers not to file for<br />
workers’ compensation.<br />
When workers are exempt from workplace laws:<br />
•Some workers either are partially or completely exempt from employment <strong>and</strong> labor laws—<br />
because <strong>of</strong> archaic exemptions <strong>of</strong> specific industries <strong>and</strong> occupations, or because they are<br />
considered to be independent contractors.<br />
•We surveyed one group <strong>of</strong> workers <strong>of</strong>ten considered exempt from coverage—“in-home” child<br />
care workers who provide care in their own homes. When we analyzed their working conditions<br />
(separately from the rest <strong>of</strong> the sample), we found that 88 percent earned less than the minimum<br />
wage. This finding underscores the need to ensure that all workers who are in an employment<br />
relationship receive full legal protection.<br />
Finding 2: Job <strong>and</strong> employer characteristics<br />
are key to underst<strong>and</strong>ing workplace violations<br />
Workplace violations are the result <strong>of</strong> decisions made by employers—whether to pay the minimum wage<br />
or overtime, whether to give workers meal breaks <strong>and</strong> how to respond to complaints about working<br />
conditions. We found that workplace violations are pr<strong>of</strong>oundly shaped by job <strong>and</strong> employer characteristics.<br />
•Workplace violation rates vary significantly by industry <strong>and</strong> occupation. For example, minimum<br />
wage violation rates ranged from as little as 2 percent in some industries to as much as 53<br />
percent in other industries, <strong>and</strong> the range across occupations was similarly wide.<br />
Some industries <strong>and</strong> occupations are rife with multiple types <strong>of</strong> violations; for example,<br />
•<br />
laundry, dry-cleaning <strong>and</strong> private household workers faced very high rates <strong>of</strong> minimum wage,<br />
overtime <strong>and</strong> <strong>of</strong>f-the-clock violations. Other industries <strong>and</strong> occupations had high rates <strong>of</strong> some<br />
violations but not others; for example, home health care workers had relatively few minimum<br />
wage violations but high rates <strong>of</strong> overtime, <strong>of</strong>f-the-clock <strong>and</strong> meal break violations. Workers<br />
in industries such as restaurants, retail <strong>and</strong> manufacturing usually fell into the middle <strong>of</strong> the<br />
distribution. (See Figures 4.1 to 4.9 for complete industry <strong>and</strong> occupation results.)<br />
4
•Workers who were paid a flat weekly rate or paid in cash had much higher violation rates than<br />
those paid a st<strong>and</strong>ard hourly rate or by company check. In particular, non-hourly pay arrangements<br />
virtually guarantee that workers will experience overtime violations.<br />
•Workers employed by companies with less than 100 employees were at greater risk <strong>of</strong><br />
experiencing violations than those employed by larger companies. But the problem <strong>of</strong> workplace<br />
violations is by no means limited to small firms; more than one out <strong>of</strong> 10 workers at large<br />
companies experienced a minimum wage violation, <strong>and</strong> among those who worked overtime, 58<br />
percent were underpaid or not paid at all for the extra hours.<br />
•Not all employers violate the law. We found a range <strong>of</strong> workplace practices—<strong>of</strong>fering health<br />
insurance, providing paid vacation <strong>and</strong> sick days <strong>and</strong> giving raises—that were associated with<br />
lower violation rates. This suggests that employers’ decisions about whether to comply with the<br />
law are part <strong>of</strong> a broader business strategy shaping the workplace.<br />
Finding 3: All workers are at risk <strong>of</strong> workplace violations<br />
Women, immigrants <strong>and</strong> people <strong>of</strong> color are disproportionately likely to be employed in low-wage<br />
industries, <strong>and</strong> therefore are at greater risk <strong>of</strong> workplace violations. But violations are not limited to<br />
immigrant workers or other vulnerable groups in the labor force—everyone is at risk, albeit to<br />
different degrees.<br />
We found that a range <strong>of</strong> worker characteristics were correlated with higher minimum wage violations:<br />
• Foreign-born workers were more than twice as likely as their U.S.-born counterparts to have a<br />
minimum wage violation. The higher rates were concentrated among women—especially women<br />
who were unauthorized immigrants, 40 percent <strong>of</strong> whom had a minimum wage violation in the<br />
previous week.<br />
•U.S.-born workers <strong>of</strong> color had minimum wage violation rates ranging from 8 percent to 17<br />
percent, in stark contrast to U.S.-born white workers, who in our sample did not have any<br />
minimum wage violations in the previous workweek.<br />
•Higher levels <strong>of</strong> education <strong>of</strong>fered some protection from minimum wage violations, but even<br />
college-educated workers still were at significant risk.<br />
By contrast, worker characteristics were only weakly correlated with overtime, <strong>of</strong>f-the-clock <strong>and</strong><br />
meal break violations. On the whole, job <strong>and</strong> employer characteristics were more powerful predictors<br />
<strong>of</strong> the workplace violations considered in this study than the demographic characteristics <strong>of</strong><br />
the workers.<br />
5
Executive Summary continued…<br />
Finding 4: Weekly wage theft in New York City<br />
Wage theft not only depresses the already meager earnings <strong>of</strong> low-wage workers, but also adversely<br />
impacts their communities <strong>and</strong> the local economies <strong>of</strong> which they are a part.<br />
• Workers:<br />
More than half (54 percent) <strong>of</strong> our sample experienced at least one pay-related violation<br />
in the previous workweek. The average worker lost $58 out <strong>of</strong> average weekly earnings <strong>of</strong> $397.<br />
Assuming a full-time, full-year work schedule, we estimate that these workers lost an average <strong>of</strong><br />
$3,016 annually due to workplace violations, out <strong>of</strong> total earnings <strong>of</strong> $20,644. That translates into<br />
wage theft <strong>of</strong> almost 15 percent <strong>of</strong> earnings.<br />
C • ommunities: We estimate that in a given week, approximately 317,263 workers in New York<br />
City have at least one pay-based violation. Extrapolating from this figure, front-line workers in<br />
low-wage industries in the five boroughs lose more than $18.4 million per week as a result <strong>of</strong><br />
employment <strong>and</strong> labor law violations.<br />
How New York can strengthen worker protections<br />
Everyone has a stake in addressing the problem <strong>of</strong> workplace violations. When impacted workers <strong>and</strong><br />
their families struggle in poverty <strong>and</strong> constant economic insecurity, the strength <strong>and</strong> resiliency <strong>of</strong> local<br />
communities suffer. When unscrupulous employers violate the law, responsible employers are forced into<br />
unfair competition, setting <strong>of</strong>f a race to the bottom that threatens to bring down st<strong>and</strong>ards throughout the<br />
labor market. And when significant numbers <strong>of</strong> workers are underpaid, tax revenues are lost.<br />
Policy reforms are needed at the federal level, but state <strong>and</strong> local governments have a significant role to<br />
play as well. This report lays out a comprehensive policy agenda to protect the rights <strong>of</strong> workers in New<br />
York (see Section 7), driven by two core principles:<br />
• Strengthen state <strong>and</strong> city enforcement <strong>of</strong> employment <strong>and</strong> labor laws: New York is<br />
well-placed to tackle the problem <strong>of</strong> workplace violations, given the state’s strong labor laws,<br />
significant enforcement resources <strong>and</strong> energized community advocates. In recent years, state<br />
enforcement has been improved substantially through the use <strong>of</strong> proactive investigations <strong>and</strong><br />
outreach to community groups, but recent budget cuts have strained resources <strong>and</strong> slowed<br />
progress. New York State must recommit resources toward enforcement, institutionalize recent<br />
successes <strong>and</strong> enact new legislation to strengthen enforcement tools. New York City must<br />
do its part by enforcing the labor st<strong>and</strong>ards that fall under its authority. It also should dedicate<br />
resources to public education campaigns <strong>and</strong> support enforcement efforts by community-based<br />
organizations, worker centers <strong>and</strong> legal services providers.<br />
• Update legal st<strong>and</strong>ards for the 21st century labor market: Strong enforcement is important,<br />
but so are strong legal st<strong>and</strong>ards that recognize the changing organization <strong>of</strong> work in the United<br />
States. The strength <strong>of</strong> laws <strong>and</strong> the strength <strong>of</strong> their enforcement are deeply intertwined—weak<br />
employment <strong>and</strong> labor laws send the wrong signal, opening the door to low-road business<br />
strategies to cut labor costs. Raising the minimum wage, closing loopholes that exclude workers<br />
from key protections <strong>and</strong> ensuring state <strong>and</strong> city resources are used to create living wage jobs are<br />
all key improvements that would raise compliance in the workplace <strong>and</strong> improve the competitive<br />
position <strong>of</strong> employers who play by the rules.<br />
6
1<br />
Introduction<br />
In February 2009, a leading chain <strong>of</strong> gourmet grocery<br />
stores in New York City agreed to pay nearly<br />
$1.5 million in unpaid wages to 550 workers. Behind<br />
those numbers lies a grim set <strong>of</strong> business practices.<br />
Amish Markets denied its employees overtime pay,<br />
despite requiring many to work more than 40 hours<br />
a week. Some employees were paid only $300 a<br />
week for 60 to 70 hours <strong>of</strong> work, which translates<br />
into four to five dollars an hour, well below the<br />
state’s minimum wage. Individual workers reported<br />
additional abuses: being fired after injuring a leg on<br />
the job, having delivery tips stolen by management<br />
<strong>and</strong> being fired for talking to state investigators. 1<br />
In August 2008, the New York State Department<br />
<strong>of</strong> <strong>Labor</strong> completed a comprehensive investigation<br />
into 84 r<strong>and</strong>omly selected car washes across the<br />
state. The results <strong>of</strong> that investigation are striking:<br />
78 percent <strong>of</strong> the car washes in New York City had<br />
violated both minimum wage <strong>and</strong> overtime laws, <strong>and</strong><br />
39 percent engaged in tip stealing from their workers.<br />
One <strong>of</strong> the major car wash chains in the region<br />
recently settled a multiyear suit, agreeing to pay<br />
$3.4 million in lost wages <strong>and</strong> damages to 1,187<br />
current <strong>and</strong> former employees. 2<br />
And in October 2008, a federal judge ordered Saigon<br />
Grill to pay $4.6 million in back wages <strong>and</strong> damages<br />
to its delivery workers. The delivery men earned<br />
as little as $1.60 an hour for working up to 13 hours<br />
a day, six or seven days a week. Illegal deductions<br />
were taken from their pay, in the form <strong>of</strong> fines <strong>and</strong><br />
kickbacks. The scale <strong>of</strong> the wage theft in this case is<br />
astonishing—some workers were owed as much as<br />
$328,000. A separate ruling by the National <strong>Labor</strong><br />
Relations Board found the restaurant’s owners had<br />
illegally fired 28 workers as retaliation for filing the<br />
wage theft lawsuit. 3 7<br />
7
Introduction continued…<br />
Unfortunately, these cases are not unusual, nor are they limited to a few sectors or just small<br />
businesses. A decade into the 21st century, our country’s employment <strong>and</strong> labor laws are failing to<br />
protect New York City’s workers. These are laws that most <strong>of</strong> us consider absolute <strong>and</strong> inviolate <strong>and</strong><br />
that date back to the New Deal. Employers must pay workers at least the minimum wage, <strong>and</strong> time <strong>and</strong><br />
a half for overtime hours. They must follow regulations to protect workers’ health <strong>and</strong> safety, <strong>and</strong> carry<br />
workers’ compensation insurance in case <strong>of</strong> injury. They may not discriminate against workers on the<br />
basis <strong>of</strong> age, race, religion, national origin, gender, sexual orientation or disability. And they must respect<br />
workers’ right to organize <strong>and</strong> bring complaints about working conditions.<br />
Yet there is growing evidence that employers are breaking these bedrock laws. The severity <strong>of</strong> cases<br />
brought by workers <strong>and</strong> government agencies in recent years, like the ones described above, as well<br />
as a small but growing body <strong>of</strong> research, suggest the need to take a closer look at the state <strong>of</strong> worker<br />
protections in New York City. 4<br />
To date, very few studies have been able to estimate the proportion <strong>of</strong> workers experiencing workplace<br />
violations across the full range <strong>of</strong> industries in our economy. As a result, we lack robust data on the<br />
magnitude <strong>of</strong> the problem, the industries with the biggest <strong>of</strong>fenders, or the workers who are most<br />
affected. The limited data, in turn, hamper effective policy responses.<br />
This report presents research findings that begin to fill the gap. In 2008, we surveyed almost 1,500<br />
workers in low-wage industries in New York City. Using a rigorous survey methodology that allowed us<br />
to reach vulnerable workers who <strong>of</strong>ten are missed in st<strong>and</strong>ard surveys, we attempted to answer the<br />
following questions: How common are workplace violations, such as the percentage <strong>of</strong> workers earning<br />
less than the minimum wage or working overtime without pay? Which industries <strong>and</strong> occupations have<br />
high concentrations <strong>of</strong> violations? And who are the workers most affected?<br />
We think <strong>of</strong> this survey as a census <strong>of</strong> the invisible, because from the st<strong>and</strong>point <strong>of</strong> public policy,<br />
government regulation <strong>and</strong> immigration policy, these jobs (<strong>and</strong> the workers who hold them) all too <strong>of</strong>ten<br />
are <strong>of</strong>f the radar screen.<br />
We found that there are significant, pervasive violations <strong>of</strong> core workplace laws in many low-wage<br />
industries. Workers are being paid less than the minimum wage <strong>and</strong> not receiving overtime pay.<br />
They are working <strong>of</strong>f the clock without pay, <strong>and</strong> not getting meal breaks. When injured, they are not<br />
receiving workers’ compensation. And they are retaliated against when they try to assert their rights<br />
or attempt to organize.<br />
These problems are not limited to the underground economy or a few unscrupulous employers; we<br />
found that both large <strong>and</strong> small employers violate the law, in a wide range <strong>of</strong> industries spanning the<br />
city’s economy. Nor are these abuses limited to specific parts <strong>of</strong> the workforce. Although women,<br />
immigrants <strong>and</strong> people <strong>of</strong> color are disproportionately affected, we found that all workers in the lowwage<br />
labor market are at risk <strong>of</strong> workplace violations.<br />
To be clear, not all employers violate the law. Our study suggests that even within high-violation<br />
industries, there are responsible employers who comply with core employment <strong>and</strong> labor laws. Both<br />
those employers, <strong>and</strong> the workers who regularly experience workplace violations, urgently need a new<br />
commitment to full enforcement <strong>of</strong> labor st<strong>and</strong>ards.<br />
8
This study was done as part <strong>of</strong> a larger coordinated research effort that surveyed more than 4,300<br />
workers in low-wage industries in Chicago, Los Angeles <strong>and</strong> New York City. A national report on our<br />
findings, Broken <strong><strong>Law</strong>s</strong>, Unprotected Workers, combined data from all three cities <strong>and</strong> was released in<br />
the fall <strong>of</strong> 2009. 5 Here, we present findings for New York City only, in order to document the extent<br />
to which the city’s employers are complying with state <strong>and</strong> federal laws. A cross-city comparison<br />
<strong>of</strong> violations lies outside the scope <strong>of</strong> this report, given the variation in legal st<strong>and</strong>ards, industry <strong>and</strong><br />
workforce composition, but is planned for future research.<br />
Better enforcement <strong>of</strong> worker protections is part <strong>of</strong> the solution, but alone won’t solve the problem.<br />
Our system <strong>of</strong> employment <strong>and</strong> labor laws is badly out <strong>of</strong> date <strong>and</strong> riddled with weak st<strong>and</strong>ards. Some<br />
occupations <strong>and</strong> industries either are partly or completely exempted from coverage. Many health<br />
<strong>and</strong> safety st<strong>and</strong>ards have not been updated in years, <strong>and</strong> the minimum wage is worth less today<br />
(controlling for inflation) than it was 40 years ago. Many employers are treating workers as independent<br />
contractors or hiring them through subcontractors, straining a legal framework predicated on a traditional<br />
employment relationship.<br />
But the high rates <strong>of</strong> workplace violations we document in this report raise an urgent, resounding<br />
warning that even existing protections are failing New York’s workers. Our data were collected in<br />
2008, but there is reason to believe that the situation has deteriorated further since then. Legal<br />
services organizations <strong>and</strong> community groups are reporting the recession has intensified exploitation,<br />
as employers are ever more focused on cutting costs <strong>and</strong> workers feel increased pressure to accept<br />
subminimum wages <strong>and</strong> unpaid overtime in the face <strong>of</strong> high unemployment.<br />
Rebuilding our economy on the back <strong>of</strong> illegal working conditions is not only morally but also<br />
economically untenable. When unscrupulous employers break the law <strong>and</strong> drive down labor st<strong>and</strong>ards,<br />
they rob families <strong>of</strong> badly needed money to put food on the table. They rob communities <strong>of</strong> spending<br />
power. They rob state <strong>and</strong> local governments <strong>of</strong> vital tax revenues. And they rob the nation <strong>of</strong> the good<br />
jobs <strong>and</strong> workplace st<strong>and</strong>ards needed to compete in the global economy.<br />
9
2<br />
A L<strong>and</strong>mark <strong>Survey</strong> <strong>of</strong> the<br />
Low-Wage <strong>Labor</strong> Market<br />
in New York City<br />
Studying violations <strong>of</strong> workplace laws is a challenging<br />
task. Employers are unlikely to admit that they<br />
are paying workers less than the minimum wage,<br />
denying workers meal breaks or otherwise breaking<br />
the law. Businesses with the worst conditions may<br />
be operating underground <strong>and</strong> thus difficult to<br />
find. Workers who need to support their families<br />
underst<strong>and</strong>ably are reluctant to talk to researchers<br />
about their employers because <strong>of</strong> possible retaliation,<br />
their immigration status or because they are working<br />
<strong>of</strong>f the books. The result is that existing data largely<br />
are inadequate to assess the current state <strong>of</strong> employer<br />
compliance with U.S. employment <strong>and</strong> labor laws. 6<br />
In this study, we build on an emerging body <strong>of</strong><br />
research that has established the viability <strong>of</strong><br />
gathering reliable data on employment <strong>and</strong> labor<br />
law violations from workers themselves—including<br />
a range <strong>of</strong> innovative studies in New York City. 7<br />
Specifically, in 2008 we conducted a representative<br />
survey <strong>of</strong> low-wage workers in New York City as part<br />
<strong>of</strong> the larger 2008 Unregulated Work <strong>Survey</strong> Project<br />
(which consisted <strong>of</strong> coordinated surveys in Chicago,<br />
Los Angeles <strong>and</strong> New York City). We adopted two<br />
key methodological innovations to overcome the<br />
inadequacies <strong>of</strong> previous studies. First, we used a<br />
cutting-edge sampling methodology that allowed us<br />
to reach the full range <strong>of</strong> workers in the low-wage<br />
labor market, including unauthorized immigrants <strong>and</strong><br />
<strong>of</strong>f-the-books workers. Second, we developed an<br />
extensive questionnaire that allowed us to rigorously<br />
assess whether employment <strong>and</strong> labor laws were<br />
being broken, without relying on workers’ own<br />
knowledge <strong>of</strong> these laws.<br />
11
A L<strong>and</strong>mark <strong>Survey</strong> <strong>of</strong> the Low-Wage <strong>Labor</strong> Market in New York CIty continued…<br />
Whom did we survey?<br />
From January through August 2008, we surveyed a total <strong>of</strong> 1,432 workers in New York City. To qualify<br />
for the survey, workers had to be:<br />
a.<br />
age 18 or older, <strong>and</strong> currently working for an employer located in New York City<br />
(the five boroughs);<br />
b.<br />
a “front-line” worker, i.e., not a manager, pr<strong>of</strong>essional or technical worker; <strong>and</strong><br />
c.<br />
working in a low-wage industry as their primary job (see Appendix A).<br />
We designed the survey to be broad enough to capture a range <strong>of</strong> industries <strong>and</strong> occupations across<br />
New York City’s economy, yet targeted enough to exclude upper-level occupations such as lawyers or<br />
stockbrokers (most <strong>of</strong> whom are exempt from the core requirements <strong>of</strong> the laws <strong>of</strong> interest here).<br />
A note on timing. We fielded the survey in the first half <strong>of</strong> 2008, but the recession had not yet fully<br />
set in when we were conducting our interviews. Unemployment rates—the most relevant measure<br />
in terms <strong>of</strong> labor market conditions—were just starting to edge upward in New York City <strong>and</strong> did not<br />
reach critical levels until late 2008 <strong>and</strong> early 2009, after we had completed our survey. Our assessment,<br />
therefore, is that the workplace violation rates documented in this study were not significantly<br />
influenced by the recession.<br />
How did we conduct our survey?<br />
Our goal was to obtain accurate, statistically representative estimates <strong>of</strong> the prevalence <strong>of</strong> workplace<br />
violations. One key challenge we faced was how to reach the workers in the first place. <strong>Survey</strong>s that<br />
rely on telephone interviews or Census-style home visits are unlikely to gain the participation <strong>of</strong> the<br />
full population <strong>of</strong> low-wage workers, many <strong>of</strong> whom are missing from <strong>of</strong>ficial databases, vulnerable<br />
because <strong>of</strong> their immigration status, <strong>and</strong>/or reluctant to take part in a survey because <strong>of</strong> fear <strong>of</strong><br />
retaliation by their employers or because they are paid <strong>of</strong>f the books.<br />
These problems recently have received significant attention from statisticians <strong>and</strong> social scientists.<br />
In this survey we use an innovative sampling strategy that was developed to overcome the barriers<br />
<strong>of</strong> surveying “hidden” or “hard-to-reach” populations: Respondent-Driven Sampling (RDS), originally<br />
developed by Cornell University sociologist <strong>and</strong> project member Douglas Heckathorn, <strong>and</strong> subsequently<br />
elaborated in collaboration with other scholars.<br />
Appendix A provides a detailed description <strong>of</strong> the RDS method <strong>and</strong> how we implemented it in<br />
this survey, but the basic concept is straightforward: sampling is done through social networks.<br />
In our case, recruiting started with a small number <strong>of</strong> workers who fit the study criteria; after they<br />
were interviewed, they recruited other workers in their existing social networks; in turn, those workers<br />
completed the survey <strong>and</strong> then recruited others; <strong>and</strong> so on. The sample increased through successive<br />
waves <strong>of</strong> recruitment.<br />
12
A key advantage <strong>of</strong> this method is that workers were recruited by trusted friends <strong>and</strong> acquaintances who<br />
already had participated in the survey <strong>and</strong> could vouch for its confidentiality. This provided a powerful<br />
way to overcome barriers <strong>of</strong> fear <strong>and</strong> disclosure.<br />
We took several steps to ensure that our sample is representative <strong>of</strong> the larger population <strong>of</strong> front-line<br />
workers in low-wage industries in New York City. First, by collecting data on the social networks <strong>of</strong> the<br />
respondents, <strong>and</strong> in particular taking into account the size <strong>and</strong> interconnectivity <strong>of</strong> those networks, the<br />
RDS methodology is able to adjust for the fact that some individuals have more social connections than<br />
others, <strong>and</strong> thus are more likely to be recruited into the survey. Second, the RDS methodology also is<br />
able to adjust for the fact that different groups <strong>of</strong> workers have patterns <strong>of</strong> recruitment that vary both<br />
in which types <strong>of</strong> workers they recruit <strong>and</strong> in the effectiveness <strong>of</strong> their recruitment. Finally, we also<br />
included an adjustment to ensure that the distribution <strong>of</strong> industries <strong>and</strong> occupations in our sample fully<br />
reflected the composition <strong>of</strong> New York City’s low-wage labor market.<br />
The survey was fielded at five sites across the city, including community colleges, community-based<br />
organizations <strong>and</strong> churches. All outreach materials were translated into multiple languages, <strong>and</strong> the<br />
surveys themselves were conducted in English, Spanish, Russian, Polish, Bengali, Hindi, Urdu, M<strong>and</strong>arin,<br />
Cantonese, Korean, Portuguese, French <strong>and</strong> Haitian Creole. Including surveyors, translators, field<br />
coordinators <strong>and</strong> researchers, a total <strong>of</strong> 22 staff fielded this survey in New York City (see Appendix A for<br />
more details on the fielding <strong>and</strong> methodology).<br />
How did we measure workplace violations?<br />
The 2008 Unregulated Work <strong>Survey</strong> is unique in that it measures a range <strong>of</strong> violations <strong>of</strong> employment<br />
<strong>and</strong> labor laws using an original battery <strong>of</strong> detailed, in-depth questions. Our interviews typically lasted<br />
between 60 <strong>and</strong> 90 minutes.<br />
The survey instrument was designed to gather information that would allow us to detect violations<br />
<strong>of</strong> laws guaranteeing the minimum wage <strong>and</strong> overtime pay; full <strong>and</strong> timely payment <strong>of</strong> wages owed;<br />
provision <strong>of</strong> legally required meal <strong>and</strong> rest breaks; protection against retaliation by employers for<br />
complaints about working conditions or attempting to organize; <strong>and</strong> access to workers’ compensation<br />
in the case <strong>of</strong> an on-the-job injury (each <strong>of</strong> these types <strong>of</strong> violations is described in more detail in the<br />
next section). Due to time <strong>and</strong> measurement constraints, however, we were not able to measure<br />
violations <strong>of</strong> health <strong>and</strong> safety, family medical leave <strong>and</strong> most anti-discrimination laws, although these,<br />
too, are critical worker protections.<br />
The questionnaire did not rely on workers having any knowledge about their rights under employment<br />
<strong>and</strong> labor laws, or about whether they had experienced a workplace violation. Instead, our strategy<br />
was to gather raw “inputs” from workers—the necessary data about their hours, earnings <strong>and</strong> working<br />
conditions, as well as relevant employer actions. We then used these data to determine whether a law<br />
had been violated. 8<br />
For example, we did not ask workers whether they were being paid the minimum wage. Instead, we<br />
gathered day-by-day data on exactly how many hours the respondent worked the week before the<br />
survey, the amount <strong>of</strong> money he or she received, whether the employer made any deductions (e.g., for<br />
uniforms or meals), <strong>and</strong> whether the respondent worked <strong>of</strong>f the clock. We then calculated the worker’s<br />
effective hourly wage, <strong>and</strong> determined whether it was below the minimum wage. This approach—<br />
gathering raw data <strong>and</strong> then calculating whether a workplace violation occurred—was used for the<br />
majority <strong>of</strong> the measures we report.<br />
13
A L<strong>and</strong>mark <strong>Survey</strong> <strong>of</strong> the Low-Wage <strong>Labor</strong> Market in New York CIty continued…<br />
Table 2.1: Characteristics <strong>of</strong> Workers in the 2008 Unregulated Work <strong>Survey</strong>, New York City<br />
Percent <strong>of</strong> workers<br />
Gender Male 43.0<br />
Female 57.0<br />
Age 18-25 30.4<br />
26-35 21.3<br />
36-45 20.7<br />
46+ 27.6<br />
Race/ethnicity Latino/Latina 55.0<br />
Black 12.5<br />
Asian/other 24.5<br />
White 8.0<br />
Education Less than high school, no GED 30.7<br />
High school graduate or GED 34.4<br />
Some college or higher 34.9<br />
Nativity <strong>and</strong> legal status U.S.-born citizen 29.9<br />
Foreign-born authorized<br />
(includes naturalized citizens)<br />
45.7<br />
Foreign-born unauthorized 24.4<br />
Country <strong>of</strong> Origin United States 29.9<br />
Mexico 11.5<br />
Central America 22.4<br />
South America 12.3<br />
Asian 15.0<br />
Other Foreign-born 8.9<br />
Main industry during<br />
previous week <strong>of</strong> work<br />
Restaurants 19.3<br />
Retail & drug stores 16.8<br />
Private households 11.1<br />
Grocery stores 10.5<br />
Home health care 7.9<br />
Social services, child day care centers &<br />
schools<br />
7.4<br />
Janitorial,* security & grounds services 6.2<br />
Beauty salons, nail salons, barber shops 4.2<br />
Laundry & dry cleaning 4.1<br />
14
Main industry during<br />
previous week <strong>of</strong> work<br />
Food & furniture manufacturing,<br />
transportation & wholesale<br />
4.0<br />
Residential construction 3.4<br />
Apparel & textile manufacturing 2.6<br />
Other (other health care, banking,<br />
auto repair, carwashes)<br />
1.6<br />
Courier & messenger services 0.8<br />
Main occupation during<br />
previous week <strong>of</strong> work<br />
Cooks, dishwashers & food preparers 11.1<br />
Retail salespersons & tellers 9.7<br />
Home health care workers 9.5<br />
Janitors,* building cleaners & grounds workers 8.7<br />
Stock & <strong>of</strong>fice clerks 8.1<br />
Child care workers (private household) 7.9<br />
Cashiers 7.6<br />
Waiters, bussers & bartenders 7.3<br />
Maids & housekeepers 4.7<br />
Laundry & dry-cleaning workers 4.1<br />
Hairdressers & cosmetologists 4.0<br />
Security guards 3.5<br />
Residential construction workers 3.4<br />
Factory & packaging workers 3.0<br />
Sewing & garment workers 2.4<br />
Delivery drivers, parking lot attendants,<br />
car wash & repair workers<br />
Teacher's assistants & child care workers<br />
(center-based)<br />
1.9<br />
1.8<br />
Couriers & messengers 1.3<br />
Hourly wage during previous<br />
work week (in 2008 dollars)<br />
Median hourly wage $8.36<br />
Total number <strong>of</strong> workers in the sample 1432<br />
Source: Authors’ analysis <strong>of</strong> 2008 Unregulated Work <strong>Survey</strong>.<br />
* Janitors in small commercial & residential buildings only.<br />
15
A L<strong>and</strong>mark <strong>Survey</strong> <strong>of</strong> the Low-Wage <strong>Labor</strong> Market in New York CIty continued…<br />
Finally, in calculating the various violation measures, we were careful never to double-count. For<br />
example, if a respondent worked five overtime hours but was not paid for those hours, we recorded an<br />
overtime violation; once these five hours were “tagged” as unpaid, they did not contribute to any other<br />
violation (for example, they could not also trigger a minimum wage violation).<br />
The workers <strong>and</strong> their characteristics<br />
We close this section with an initial look at the 1,432 workers in our sample. Table 2.1 <strong>of</strong>fers an<br />
overview <strong>of</strong> key demographic <strong>and</strong> employment characteristics. Like the low-wage workforce in cities<br />
<strong>and</strong> towns across the United States, our sample has more women than men; significant numbers <strong>of</strong><br />
persons <strong>of</strong> color, especially Latino workers; 9 <strong>and</strong> a range <strong>of</strong> age groups <strong>and</strong> education levels, although<br />
about two-thirds <strong>of</strong> the sample had reached only a high school degree or less.<br />
Consistent with recent trends in the low-wage labor market, immigrants comprise a large part <strong>of</strong> our<br />
sample—30 percent <strong>of</strong> the sample was U.S.-born, with the remainder composed <strong>of</strong> naturalized citizens<br />
<strong>and</strong> authorized <strong>and</strong> unauthorized immigrants. 10 (The sizeable number <strong>of</strong> the latter category is an indicator<br />
<strong>of</strong> our success in capturing this hard-to-reach part <strong>of</strong> the labor market.) The upshot is that women,<br />
immigrants <strong>and</strong> people <strong>of</strong> color are disproportionately employed in low-wage industries in New York<br />
City—which, as we will see, puts them at significant risk <strong>of</strong> workplace violations. 11<br />
Not surprisingly, workers in our sample also earn very low wages. The median wage (in 2008 dollars)<br />
for our sample was $8.36 an hour, with few respondents earning significantly more than this amount:<br />
71 percent <strong>of</strong> our sample earned less than $10 an hour.<br />
Finally, this sample represents a range <strong>of</strong> industries (types <strong>of</strong> businesses) <strong>and</strong> occupations (job tasks<br />
or functions). Reflecting the larger economy, most workers in our sample are employed in the service<br />
sector—in industries such as restaurants, retail stores <strong>and</strong> home health care—but workers also are<br />
employed in residential construction, manufacturing, transportation <strong>and</strong> wholesale. Similarly, many <strong>of</strong><br />
the occupations in our sample are service jobs, such as cashiers, cooks, child care workers, waiters<br />
<strong>and</strong> sales workers, but residential construction laborers <strong>and</strong> factory workers also are well represented.<br />
In short, our sample represents a rich <strong>and</strong> diverse mix <strong>of</strong> the industries <strong>and</strong> occupations that comprise<br />
America’s urban economies.<br />
The scope <strong>and</strong> scale <strong>of</strong> the survey findings<br />
Readers naturally will ask themselves what percentage <strong>of</strong> the overall workforce is represented in<br />
this study. All <strong>of</strong> the workplace violation rates <strong>and</strong> other findings reported in the following sections<br />
have been weighted so that they are representative <strong>of</strong> the larger population <strong>of</strong> front-line workers (i.e.,<br />
excluding managers, pr<strong>of</strong>essional or technical workers) in low-wage industries in New York City in 2008.<br />
By our estimate, that population includes more than a half-million (586,322) workers, which is about 31<br />
percent <strong>of</strong> all front-line workers <strong>and</strong> about 14 percent <strong>of</strong> all workers in the city’s five boroughs (see Table<br />
A.1 in Appendix A).<br />
16
3<br />
The Prevalence <strong>of</strong> Workplace<br />
Violations in New York City<br />
The American workplace is governed by a core set <strong>of</strong><br />
employment <strong>and</strong> labor laws that establish minimum<br />
st<strong>and</strong>ards for wages, health <strong>and</strong> safety on the job,<br />
fair treatment <strong>and</strong> the right to organize. 12 But our<br />
findings show these laws <strong>and</strong> st<strong>and</strong>ards are violated<br />
systematically, impacting a significant part <strong>of</strong> the lowwage<br />
labor force in New York City. The framework <strong>of</strong><br />
worker protections established over the last 75 years<br />
is not working. As we demonstrate in the following<br />
pages, low-wage workers regularly experience<br />
violations <strong>of</strong> laws m<strong>and</strong>ating minimum wage <strong>and</strong><br />
overtime pay, <strong>and</strong> are frequently forced to work <strong>of</strong>f<br />
the clock or during their breaks.<br />
Table 3.1 summarizes the workplace violations<br />
experienced by our respondents. We computed these<br />
violation rates using two distinct measures. The first<br />
measure is designed to specify what proportion <strong>of</strong><br />
all the workers in our survey experienced a violation,<br />
whereas the second measure specifies the proportion<br />
<strong>of</strong> workers experiencing a violation who were “at<br />
risk” for that violation. For example, in the case <strong>of</strong><br />
weekly overtime pay laws, a worker is only at risk <strong>of</strong><br />
a violation if she or he works more than 40 hours a<br />
week. Table 3.1 shows, in separate columns, both the<br />
percentage <strong>of</strong> all workers surveyed who experienced<br />
each violation, <strong>and</strong> the percentage <strong>of</strong> workers “at<br />
risk” who experienced each violation. In this section,<br />
we present both violation measures; later sections<br />
focus on the risk-set measures alone. 13 17<br />
17
The Prevalence <strong>of</strong> Workplace Violations in New York City continued…<br />
Minimum wage violations<br />
Minimum wage laws constitute the basic st<strong>and</strong>ard <strong>of</strong> pay for front-line workers in the U.S. labor market.<br />
Employers are required to pay covered workers at or above the minimum wage set by federal or state<br />
law, whichever is higher. At the time <strong>of</strong> our survey, New York state’s minimum wage rate, at $7.15 per<br />
hour, was higher than the federal st<strong>and</strong>ard. Minimum<br />
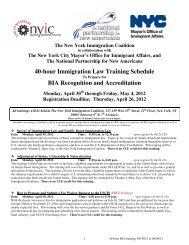
Figure 3.1: Amount Paid Below the Hourly<br />
Minimum Wage for Workers with a Minimum<br />
Wage Violation, New York City<br />
4.1%<br />
wage laws apply to workers regardless <strong>of</strong> whether they<br />
are employed full- or part-time, or whether they are<br />
paid by the hour, by the piece or in some other manner.<br />
Minimum wage laws also cover unauthorized workers,<br />
as do all <strong>of</strong> the other laws considered in this study.<br />
8.2%<br />
$1 per hour or less<br />
$1.01–$2 per hour<br />
As noted in Section 2, to measure the prevalence<br />
<strong>of</strong> minimum wage violations, we did not rely on our<br />
respondents’ knowledge <strong>of</strong> employment <strong>and</strong> labor<br />
17.5%<br />
48.8%<br />
laws, but instead gathered detailed information from<br />
$2.01–$3 per hour<br />
each worker about the workweek immediately prior to<br />
his or her interview. We calculated each respondent’s<br />
$3.01–$4 per hour<br />
21.5%<br />
hourly wage rate for the job(s) in which he or she<br />
More than $4 per hour worked that week, dividing total weekly earnings by<br />
the number <strong>of</strong> hours worked after taking into account<br />
bonuses, taxes, deductions <strong>and</strong> overtime pay. We then<br />
compared this calculated hourly wage rate with the<br />
state’s minimum wage to determine whether there<br />
was a minimum wage violation. Thus, workers in New York City who were paid less than $7.15 an hour<br />
at any <strong>of</strong> their jobs in the previous workweek were identified as having a minimum wage violation.<br />
Source: Authors’ analysis <strong>of</strong> 2008 Unregulated Work <strong>Survey</strong>.<br />
As Table 3.1 shows, about one-fifth (21 percent) <strong>of</strong> the workers in our sample were paid less than the<br />
minimum wage in the previous workweek. Moreover, these minimum wage violations were not trivial<br />
in magnitude: as Figure 3.1 shows, more than 50 percent <strong>of</strong> workers in our sample were underpaid by<br />
more than $1 per hour.<br />
Overtime violations<br />
Federal <strong>and</strong> state law requires that covered employees must be paid “time <strong>and</strong> a half” (one-<strong>and</strong>-a-half<br />
times their regular rate <strong>of</strong> pay) for all hours worked in excess <strong>of</strong> 40 during each week for a single employer.<br />
More than one-third (36 percent) <strong>of</strong> our respondents worked more than 40 hours during the previous<br />
workweek for a single employer <strong>and</strong> were therefore at risk for an overtime violation. As Table 3.1<br />
indicates, 77 percent <strong>of</strong> these “at-risk” workers were not paid the legally required overtime rate by their<br />
employers. The overtime violation rate among all workers in our sample (that is, regardless <strong>of</strong> whether<br />
they worked overtime or not in the previous week) was 26 percent. 14<br />
Nonpayment or underpayment for overtime work takes a variety <strong>of</strong> forms. Seventy-seven percent <strong>of</strong><br />
respondents who had an overtime violation were paid only their regular hourly rate for the hours they<br />
worked in excess <strong>of</strong> 40; another 13 percent were not paid at all for those hours; <strong>and</strong> 10 percent were<br />
paid less than their usual hourly rate or were promised “comp time” in lieu <strong>of</strong> overtime (which<br />
is not legal under New York law). Like minimum wage violations, overtime violations were far from trivial<br />
18
Table 3.1: Workplace Violation Rates, New York City<br />
Percent <strong>of</strong> workers with violations<br />
Violation<br />
Minimum wage violations in week prior to survey<br />
All workers<br />
surveyed*<br />
Workers at risk<br />
<strong>of</strong> a violation**<br />
Worker was paid below the minimum wage 21.2 same<br />
Overtime violations in week prior to survey<br />
Worker did not receive full weekly overtime pay<br />
Worker did not receive full daily overtime pay<br />
Off-the-clock violations in week prior to survey<br />
25.7<br />
4.2<br />
77.3<br />
93.3<br />
Worker was not paid for <strong>of</strong>f-the-clock work 20.5 69.3<br />
Meal break violations in week prior to survey<br />
Worker had any <strong>of</strong> the below meal break violations 59.7 69.7<br />
Worker was denied meal break 22.0 25.9<br />
Meal break was interrupted by employer or supervisor 14.3 19.3<br />
Worker worked through meal break 16.1 21.5<br />
Meal break was shorter than legally required 42.0 49.0<br />
Other pay violations in week prior to survey<br />
Worker did not receive a paystub 54.6 same<br />
Worker was subjected to an illegal pay deduction 1.8 32.7<br />
Tipped worker violations in week prior to survey<br />
Tipped worker did not receive the tipped minimum wage 7.6 37.3<br />
Tips were stolen by employer or supervisor 1.6 6.8<br />
Violations in the 12-month period prior to survey<br />
Worker had any <strong>of</strong> the below pay violations in last 12 months 44.5 same<br />
Worked <strong>of</strong>f-the-clock without pay in last 12 months 32.3 same<br />
Paid late in last 12 months 22.1 same<br />
Paid less than owed in last 12 months 16.2 same<br />
Not paid at all in last 12 months 4.4 same<br />
Regular <strong>and</strong> repeated verbal abuse on the basis <strong>of</strong> a protected category in last 12 months 5.5 same<br />
Retaliation violations for most recent complaint or organizing effort<br />
Worker experienced retaliation by employer for making complaint or organizing a union 4.6 41.5<br />
Workers’ compensation violations for most recent on-the-job injury<br />
Worker experienced an illegal action by employer 1.3 16.0<br />
* Calculated as a percent <strong>of</strong> all workers in our sample.<br />
** Calculated as a percent <strong>of</strong> workers who were at risk <strong>of</strong> a violation.<br />
Source: Authors’ analysis <strong>of</strong> 2008 Unregulated Work <strong>Survey</strong>.<br />
19
The Prevalence <strong>of</strong> Workplace Violations in New York City continued…<br />
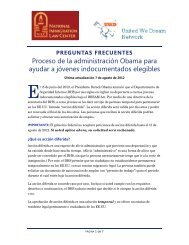
in magnitude. Among those workers with an overtime violation, the average respondent had<br />
worked 13 overtime hours in the previous week, <strong>and</strong> 19 percent had worked more than 20 overtime<br />
hours (see Figure 3.2).<br />
Figure 3.2: Number <strong>of</strong> Hours Worked Overtime<br />
(Beyond 40 Hours) for Workers with an Overtime<br />
Violation, New York City<br />
23.3%<br />
18.8%<br />
32.7%<br />
5 hours or less<br />
5–10 hours<br />
10–20 hours<br />
More than 20 hours<br />
In addition to the weekly overtime requirement, New<br />
York has a daily overtime requirement. Specifically,<br />
employers must pay workers one extra hour (at the<br />
state’s minimum wage rate) if they work more than 10<br />
hours in a single day for a single employer. 15 However,<br />
<strong>of</strong> our respondents who met the state’s daily overtime<br />
criteria, the vast majority—93 percent—did not receive<br />
the legally required wage. 16<br />
“Off-the-clock” violations: unpaid time<br />
before or after a regular shift<br />
25.3%<br />
In addition to unpaid overtime, many front-line workers<br />
in the low-wage labor market perform work that is<br />
unpaid. This is “<strong>of</strong>f-the-clock” work, or work that<br />
takes place before or after a regularly scheduled shift<br />
<strong>and</strong> for which no pay is provided. 17 Off-the-clock<br />
work is technically a type <strong>of</strong> minimum wage violation,<br />
but we chose to measure it separately in this study because it involves workers not being paid at<br />
all for time worked. By law, employees must be paid for all <strong>of</strong> the hours they work. That means any<br />
work performed before or after <strong>of</strong>ficial start <strong>and</strong> end times must be compensated in accordance with<br />
minimum wage laws. In our survey, we asked workers whether they came in before their <strong>of</strong>ficial shift<br />
or stayed late after their <strong>of</strong>ficial ending time <strong>and</strong>, if so, whether they received payment for this time. If<br />
workers came in early <strong>and</strong>/or stayed late <strong>and</strong> were not paid at all for work they performed during those<br />
time periods, they had an <strong>of</strong>f-the-clock violation.<br />
Source: Authors’ analysis <strong>of</strong> 2008 Unregulated Work <strong>Survey</strong>.<br />
Nearly a third <strong>of</strong> workers surveyed (29 percent) stated that they had worked before <strong>and</strong>/or after their<br />
regular shifts in the previous workweek, <strong>and</strong> were thus “at risk” for <strong>of</strong>f-the-clock violations. Of these<br />
“at-risk” workers, 69 percent did not receive any pay at all for the work they performed outside <strong>of</strong> their<br />
regular shift. Those who experienced this type <strong>of</strong> violation typically worked an average <strong>of</strong> two hours per<br />
week without pay.<br />
Meal break violations<br />
New York state law requires most employers to provide workers an uninterrupted meal break during<br />
their shift. 18 The law does not require the employer to pay for the meal break, but if the employee works<br />
during the break, he or she must be compensated. We determined whether workers received all <strong>of</strong> their<br />
required meal breaks <strong>and</strong> if these breaks were <strong>of</strong> the required length.<br />
The large majority <strong>of</strong> our respondents (90 percent) worked enough consecutive hours to be legally<br />
entitled to a meal break. However, as Table 3.1 indicates, more than two-thirds <strong>of</strong> these “at-risk”<br />
workers (70 percent) experienced a meal break violation in the previous workweek.<br />
20
Meal break violations took a variety <strong>of</strong> forms. More than one-quarter (26 percent) <strong>of</strong> respondents with<br />
this violation received no meal break at all at some point during the previous week. Nearly half (49<br />
percent) had a meal break that was shorter than the legally m<strong>and</strong>ated length. Workers also reported<br />
being interrupted by their employer during the break (19 percent) or working during part <strong>of</strong> their meal<br />
break (22 percent).<br />
Other pay violations<br />
In addition to minimum wage, overtime, <strong>of</strong>f-the-clock <strong>and</strong> meal break violations, we collected data<br />
on several other pay-related violations (see Table 3.1). We asked workers whether they had received<br />
a paystub or other documentation <strong>of</strong> their earnings <strong>and</strong> deductions. According to New York state<br />
law, all workers—regardless <strong>of</strong> whether they are paid in cash or by check—are required to receive<br />
documentation <strong>of</strong> their earnings <strong>and</strong> deductions. However, 55 percent <strong>of</strong> workers in our sample did not<br />
receive this m<strong>and</strong>atory documentation. We also asked about deductions from pay during the previous<br />
workweek. In New York, employers generally are not permitted to take deductions from a worker’s pay<br />
for damage or loss, work-related tools, materials or transportation or uniforms. 19 Among respondents<br />
who reported deductions from their pay, 33 percent were subjected to illegal deductions.<br />
Tipped workers<br />
We examined pay-related violations specifically affecting tipped workers. Under New York state law<br />
(<strong>and</strong> under federal law), there is a special provision in minimum wage law for workers who receive tips<br />
as a regular part <strong>of</strong> their wages. In addition to the tips they receive from customers, tipped workers<br />
must be paid at least a minimum base wage by their employer for the hours they work; however, this<br />
base wage is less than the minimum wage for non-tipped workers. 20<br />
We calculated the tipped minimum wage violation rate by comparing each tipped worker’s base wage to<br />
the legally required wage. 21 Twenty-one percent <strong>of</strong> workers in our sample received tips in the previous<br />
week. These tipped workers were employed in a variety <strong>of</strong> jobs, most <strong>of</strong>ten working in restaurants (47<br />
percent), in beauty salons (17 percent) or in grocery stores (9 percent). Of these tipped workers, 37<br />
percent experienced violations <strong>of</strong> the tipped minimum wage.<br />
It also is illegal for employers or managers to appropriate any portion <strong>of</strong> the tips provided by customers<br />
in restaurants or other settings where tips are customary. However, 7 percent <strong>of</strong> tipped workers in our<br />
sample reported such “tip stealing” during the previous workweek.<br />
Workplace violations during the last 12 months<br />
For all <strong>of</strong> the violation rates discussed so far, we calculated whether a violation occurred during<br />
the week prior to the interview, based on information we collected about each worker’s hours <strong>and</strong><br />
earnings. In addition, we asked workers a series <strong>of</strong> questions about their experiences over the previous<br />
12 months across all the jobs they had held. The purpose <strong>of</strong> these questions was to measure the<br />
prevalence <strong>of</strong> workplace violations that occur relatively infrequently <strong>and</strong> thus might be missed by<br />
measures limited to a single workweek.<br />
21
The Prevalence <strong>of</strong> Workplace Violations in New York City continued…<br />
These estimates are likely less reliable than those for the previous workweek, because they rely on<br />
workers remembering incidents that occurred over a much longer time period. That said, 45 percent<br />
<strong>of</strong> respondents experienced at least one pay-related violation (<strong>of</strong>f-the-clock work, late payment, being<br />
paid less than owed, or not being paid at all) in the 12-month period prior to their interview. Thirty-two<br />
percent had worked <strong>of</strong>f the clock without pay at least once in the last year. When workers experienced<br />
this violation, they did so frequently—on average, 24 times in the last year.<br />
Twenty-two percent <strong>of</strong> workers had been paid late at some point in the last year; this group experienced<br />
six incidents <strong>of</strong> late payment, on average, over the year. Sixteen percent <strong>of</strong> workers had been paid<br />
less than they were owed by their employers at least once in the last 12 months; on average, this took<br />
place seven times for those who experienced such underpayment. Finally, 4 percent <strong>of</strong> workers in our<br />
sample were not paid at all for work they had performed at least once in the previous year; among these<br />
workers, nonpayment <strong>of</strong> wages occurred an average <strong>of</strong> six times in the last year.<br />
Another violation we measured over the 12-month period prior to the survey interview was verbal abuse<br />
on the job. Regular <strong>and</strong> repeated verbal abuse by an employer or supervisor is illegal in New York if<br />
such abuse involves race, religion, gender, sexual orientation, national origin, age <strong>and</strong>/or disability. 22 Five<br />
percent <strong>of</strong> workers in our sample experienced verbal abuse based on these protected categories in the<br />
12 months prior to their interview.<br />
Illegal retaliation by employers<br />
Workers who complain to their employer or to a government agency about their working conditions, as<br />
well as those who attempt to organize a union, are protected by law from retaliation by their employer<br />
for these activities. 23 Threatening to fire a worker, actually firing or suspending workers, cutting hours<br />
or pay, harassing or abusing workers or giving workers a worse work assignment are all illegal forms <strong>of</strong><br />
employer retaliation if they occur as a direct result <strong>of</strong> a complaint or union organizing effort.<br />
We asked respondents whether they had made a complaint in the last year to their employer, to their<br />
supervisor or to a government agency. If they had, we gathered information about the reason for their<br />
most recent complaint. Workers identified a variety <strong>of</strong> on-the-job problems, including not being paid for<br />
all hours worked (13 percent <strong>of</strong> all complaints), dangerous working conditions (8 percent), not being paid<br />
for overtime (6 percent), not being paid on time (4 percent) <strong>and</strong> being paid below the minimum<br />
wage (3 percent).<br />
Overall, 23 percent <strong>of</strong> our respondents either made a complaint about a workplace issue or attempted<br />
to form a union in the last year. Of those workers, 42 percent reported illegal retaliation from their<br />
employer or supervisor as a direct result <strong>of</strong> their most recent complaint or organizing effort. For<br />
example, 74 percent had their hours or pay cut or were given worse assignments, 32 percent were fired<br />
or suspended, 32 percent were threatened with deportation or firing, <strong>and</strong> 31 percent were harassed or<br />
abused or had an increase in work load. 24<br />
Despite the existence <strong>of</strong> legal protection from retaliation, many workers chose not to make complaints<br />
to their employers, even when they encountered subst<strong>and</strong>ard conditions in the workplace. In our<br />
sample, 23 percent <strong>of</strong> workers indicated that they did not make a complaint during the past 12 months<br />
even though they had experienced a serious problem such as dangerous working conditions,<br />
22
discrimination or not being paid the minimum wage. Forty-one percent <strong>of</strong> these workers said that they<br />
did not make a complaint because they were afraid <strong>of</strong> losing their job; 40 percent thought it would not<br />
make any difference if they complained; <strong>and</strong> another 5 percent were afraid they would have their hours<br />
or wages cut. Fear <strong>of</strong> retaliation <strong>and</strong> expectations <strong>of</strong> employer indifference, then, figure strongly in<br />
workers’ decisions about whether to make a complaint.<br />
Workers’ compensation<br />
Virtually all employers in New York are required to pay into the state’s workers’ compensation fund <strong>and</strong><br />
carry workers’ compensation insurance in order to cover costs incurred when a worker becomes sick or<br />
injured on the job for work-related reasons. These costs include medical bills as well as wages lost due<br />
to time away from work because <strong>of</strong> the injury or illness.<br />
Eleven percent <strong>of</strong> our respondents experienced a serious on-the-job injury 25 during the last three years<br />
<strong>of</strong> work. For these workers, we gathered information about the most recent work-related injury <strong>and</strong><br />
about the employer’s response to that injury, in order to determine whether a violation <strong>of</strong> workers’<br />
compensation law had occurred.<br />
The workers’ compensation system is very rarely used by our respondents. Of the workers in our<br />
sample who experienced a serious injury during the previous three years, only 11 percent had filed a<br />
workers’ compensation claim for their most recent injury. This finding clearly indicates that the workers’<br />
compensation system is not functioning as intended for front-line workers in the low-wage labor market.<br />
Further, our data suggest this is due at least in part to the ways in which employers respond to cases<br />
<strong>of</strong> on-the-job injury. Fully 47 percent <strong>of</strong> seriously injured respondents reported that they were required<br />
to work despite their injury; an additional 33 percent said their employer refused to help them with the<br />
injury; 10 percent said their employer made them come into work <strong>and</strong> sit around all day; 8 percent were<br />
fired shortly after the injury; 4 percent were threatened with deportation or notification <strong>of</strong> immigration<br />
authorities; <strong>and</strong> 3 percent were told by their employers not to file a workers’ compensation claim. Only<br />
9 percent <strong>of</strong> employers instructed injured workers to file a workers’ compensation claim.<br />
Not all <strong>of</strong> the employer responses to on-the-job injuries reported above are illegal. Table 3.1 shows<br />
workers’ compensation violation rates, but only for illegal employer actions such as: firing or threatening<br />
to fire an injured worker if they filed a workers’ compensation claim; threatening to call immigration<br />
authorities in response to an on-the-job injury <strong>of</strong> an unauthorized worker; or instructing an injured worker<br />
not to file a workers’ compensation claim. 26 In New York City, 16 percent <strong>of</strong> those respondents who<br />
suffered an injury in the past three years experienced a violation <strong>of</strong> workers’ compensation law for their<br />
most recent injury.<br />
We also gathered information on who paid for injured workers’ medical expenses. Fifty-nine percent<br />
<strong>of</strong> respondents who experienced a serious injury at work sought medical attention for that injury, but<br />
within this group, only 28 percent indicated their employers paid for all or part <strong>of</strong> their medical bills.<br />
Three-quarters <strong>of</strong> those who sought medical attention after an on-the-job injury either had to pay their<br />
bills out <strong>of</strong> pocket (35 percent) or used their health insurance to cover the expenses (40 percent).<br />
Workers’ compensation insurance paid the medical expenses for only 6 percent <strong>of</strong> the workers in our<br />
sample who visited a doctor for an on-the-job injury or illness.<br />
23
The Prevalence <strong>of</strong> Workplace Violations in New York City continued…<br />
When workers are exempt from workplace laws<br />
Up to this point, we have analyzed violations <strong>of</strong> employment <strong>and</strong> labor laws for workers who are covered<br />
by those laws. But some workers either are partially or completely exempt from coverage—because<br />
<strong>of</strong> archaic exemptions <strong>of</strong> specific industries <strong>and</strong> occupations, or because they are considered to be<br />
independent contractors. 27<br />
In our survey, we captured one group <strong>of</strong> workers likely to be considered independent contractors—inhome<br />
child care workers. If workers take care <strong>of</strong> one or more children in their own homes, for legal<br />
purposes, they <strong>of</strong>ten are assumed to be running their own businesses. And it is true that some in-home<br />
child care providers are indeed independent contractors who truly set their wages <strong>and</strong> have control over<br />
their working conditions. But others are clearly in an employment relationship, either with the parents<br />
<strong>of</strong> the children they care for, with a non-pr<strong>of</strong>it organization or government agency, or both. Yet under<br />
current application <strong>of</strong> employment <strong>and</strong> labor laws, both cases likely would be treated the same: exempt<br />
from coverage. 28<br />
We were not able to determine which <strong>of</strong> the in-home child care workers in our sample were<br />
independent contractors <strong>and</strong> which were not, so we excluded all <strong>of</strong> them from our analyses in this<br />
report. But we did analyze their working conditions, separately from the rest <strong>of</strong> the sample, in order to<br />
explore the impact <strong>of</strong> their exemption from legal coverage. We found that in-home child care workers<br />
had working conditions that would have resulted in very high workplace violation rates had they been<br />
covered by employment <strong>and</strong> labor law. Most notably, we calculated that 88 percent <strong>of</strong> in-home child<br />
care workers earned less than the New York state minimum wage. This finding underscores the need<br />
to ensure all workers who are clearly in an employment relationship receive full protection under our<br />
system <strong>of</strong> workplace protections (we return to this point in Section 7).<br />
Summary<br />
Front-line workers in New York City are frequently paid below the minimum wage, not paid for overtime,<br />
work <strong>of</strong>f the clock without pay <strong>and</strong> have their meal breaks denied, interrupted or shortened. In fact,<br />
more than half (54 percent) <strong>of</strong> the workers in our sample experienced at least one type <strong>of</strong> pay-related<br />
workplace violation in their previous week <strong>of</strong> work. 29 Twenty-one percent <strong>of</strong> the workers in our sample<br />
were paid less than the minimum wage for their previous workweek. Perhaps the most striking statistic<br />
is that among workers who worked more than 40 hours in their previous workweek, more than threefourths<br />
were not paid the legally required overtime rate.<br />
Our data also show that employer retaliation is common—among those workers in our sample who<br />
made complaints or attempted to organize a union, 42 percent experienced retaliation from their<br />
employer or supervisor. In addition, we found that the workers’ compensation system is not functioning<br />
for workers in the low-wage labor market. The system is very seldom used by injured workers <strong>and</strong> many<br />
employers either directly or indirectly discourage workers from filing claims.<br />
In short, the core workplace laws established during the last century are being regularly violated by<br />
employers in the low-wage labor market. We now explore these violations in more detail, examining<br />
the industries <strong>and</strong> occupations in which they most <strong>of</strong>ten are found, as well as the workers who are<br />
most affected.<br />
24
4<br />
The Role <strong>of</strong> Job <strong>and</strong><br />
Employer Characteristics<br />
Workplace violations are ultimately the result <strong>of</strong><br />
decisions made by employers—whether to pay the<br />
minimum wage or overtime, whether to give workers<br />
meal breaks, or how to respond to complaints<br />
about working conditions. That means we need to<br />
underst<strong>and</strong> more about the employers in this story:<br />
What types <strong>of</strong> businesses tend to violate employment<br />
<strong>and</strong> labor laws? Which types <strong>of</strong> jobs are hardest<br />
hit? Does the size <strong>of</strong> the business play a role? And<br />
are there other workplace practices that enable or<br />
facilitate violations?<br />
This section examines workplace violations through<br />
the lens <strong>of</strong> job <strong>and</strong> employer characteristics—industry<br />
(type <strong>of</strong> business) <strong>and</strong> occupation (job tasks or<br />
functions), as well as the various pay arrangements<br />
that are common in the low-wage labor market.<br />
Diverse job <strong>and</strong> employer characteristics define our<br />
sample, from employer size (37 percent <strong>of</strong> our sample<br />
worked at companies with 100 or more employees)<br />
to pay arrangement (40 percent did not have a<br />
st<strong>and</strong>ard hourly pay relationship with their employer).<br />
Moreover, workers representing a wide range <strong>of</strong><br />
industries were sampled (from retail stores to food<br />
manufacturing plants to home health care), as well<br />
as a wide range <strong>of</strong> occupations (from child care to<br />
sewing machine operator to car washer). As we will<br />
see, these <strong>and</strong> other job <strong>and</strong> employer characteristics<br />
play a central role in determining whether workers are<br />
subject to violations <strong>of</strong> employment laws.<br />
25
The Role <strong>of</strong> Job <strong>and</strong> Employer Characteristics continued…<br />
Minimum wage violations<br />
Minimum wage violation rates vary significantly by industry, as shown in Figure 4.1. 30 Violations were<br />
especially common in the laundry <strong>and</strong> dry-cleaning industries, in private households, in beauty salons,<br />
nail salons <strong>and</strong> barbershops <strong>and</strong> in grocery stores. In these industries, about a third or more <strong>of</strong> workers<br />
were paid less than the minimum wage. Based on our previous qualitative work, the fact that these<br />
industries had high minimum wage violation rates is not surprising. 31 For example, workers employed<br />
directly by private households are structurally at higher risk <strong>of</strong> poor working conditions. Pay is negotiated<br />
between individual families <strong>and</strong> the employee on a case-by-case basis, workers <strong>of</strong>ten are paid a flat<br />
weekly or daily amount regardless <strong>of</strong> hours worked, <strong>and</strong> both regulation <strong>and</strong> enforcement historically<br />
have been weak. 32<br />
Minimum wage violation rates were substantially lower in home health care (7 percent); social services,<br />
child day care centers <strong>and</strong> schools (6 percent); <strong>and</strong> residential construction 33 (2 percent). Industries such<br />
as garment manufacturing, retail, drug stores <strong>and</strong> restaurants fell into the middle <strong>of</strong> the distribution.<br />
As shown in Figure 4.2, minimum wage violation rates also vary by occupation, with much <strong>of</strong> the<br />
variation mirroring that <strong>of</strong> the industries discussed above. Laundry <strong>and</strong> dry-cleaning workers have the<br />
highest minimum wage violation rate at 57 percent. Child care workers who work in private households<br />
had a violation rate <strong>of</strong> 50 percent, <strong>and</strong> 45 percent <strong>of</strong> hairdressers <strong>and</strong> cosmetologists had a minimum<br />
wage violation in the previous workweek. In contrast, workers in the following occupations had<br />
relatively low minimum wage violation rates: residential construction workers (2 percent); teacher’s<br />
assistants <strong>and</strong> center-based child care workers (6 percent); <strong>and</strong> home health care workers (8 percent).<br />
The low rate for residential construction workers is in line with other research showing that these<br />
workers tend to be more vulnerable to other violations, such as non-payment <strong>of</strong> wages or health <strong>and</strong><br />
safety violations. 34<br />
Although many employers in low-wage industries pay their workers a regular hourly wage, others use<br />
weekly, daily or other pay types. 35 Many workers are paid on a flat weekly basis, so their pay does not<br />
increase with the number <strong>of</strong> hours they work. For example, a prep cook might be paid $300 weekly <strong>and</strong><br />
be expected to work between 35 <strong>and</strong> 50 hours each week, depending on how busy the restaurant is<br />
<strong>and</strong> how the manager schedules work shifts. Other workers are paid on a flat daily basis. For example,<br />
a maid might receive $60 for a day’s work, regardless <strong>of</strong> the number <strong>of</strong> hours involved. In apparel <strong>and</strong><br />
textile manufacturing, workers <strong>of</strong>ten are paid by the piece—for example, a garment worker might be<br />
paid seven cents for each shirt sleeve she sews. Overall, 60 percent <strong>of</strong> our sample was paid an hourly<br />
wage; the remaining 40 percent was paid in some other way, mostly a flat weekly or a flat daily amount.<br />
As Table 4.1 shows, workers in our sample who had non-hourly pay types had substantially higher<br />
minimum wage violation rates (32 percent) than those who were paid an hourly wage (14 percent).<br />
These differences can be seen within (as well as across) industries <strong>and</strong> occupations. For example,<br />
cooks, dishwashers <strong>and</strong> food preparers who were paid by the hour had a minimum wage violation<br />
rate <strong>of</strong> 9 percent, while those who were paid on a non-hourly basis had a violation rate <strong>of</strong> 34 percent.<br />
This is not surprising, since when employers use non-hourly pay types, workers’ wages are tied only<br />
loosely to the number <strong>of</strong> hours they work, <strong>and</strong> any increase in hours can result in wages falling below<br />
the legal minimum. Non-st<strong>and</strong>ard pay arrangements do not cause higher violation rates, but they are a<br />
mechanism <strong>of</strong>ten used by employers to disguise the fact that workers are not being paid the minimum<br />
wage or overtime.<br />
26
Figure 4.1: Minimum Wage Violation Rates by Industry, New York City<br />
Laundry & dry cleaning<br />
Private households<br />
Beauty salons, nail salons<br />
& barber shops<br />
Grocery stores<br />
Courier & messenger services<br />
Apparel & textile manufacturing<br />
Food & furniture manufacturing,<br />
transportation & wholesale<br />
Retail & drug stores<br />
Restaurants<br />
Other (other health care,<br />
banking, auto repair, carwashes)<br />
Janitorial,* security & grounds services<br />
Home health care<br />
Social services, child day<br />
care centers & schools<br />
Residential construction<br />
37.5%<br />
36.3%<br />
32.0%<br />
28.7%<br />
23.6%<br />
19.5%<br />
17.9%<br />
16.9%<br />
12.6%<br />
11.2%<br />
7.3%<br />
5.7%<br />
2.0%<br />
52.7%<br />
0% 20% 40% 60% 80% 100%<br />
Violation Rate<br />
Source: Authors’ analysis <strong>of</strong> 2008 Unregulated Work <strong>Survey</strong>.<br />
Figure 4.2: Minimum Wage Violation Rates by Occupation, New York City<br />
Laundry & dry-cleaning workers<br />
Child care workers<br />
(private household)<br />
Hairdressers & cosmetologists<br />
44.9%<br />
50.4%<br />
56.7%<br />
Stock & <strong>of</strong>fice clerks<br />
32.5%<br />
Maids & housekeepers<br />
Retail salespersons & tellers<br />
Sewing & garment workers<br />
Delivery drivers, parking lot<br />
attendants, car wash & repair workers<br />
Couriers & messengers<br />
Cashiers<br />
Factory & packaging workers<br />
Cooks, dishwashers & food preparers<br />
Waiters, bussers & bartenders<br />
Security guards<br />
Janitors,* building cleaners<br />
& grounds workers<br />
Home health care workers<br />
Teacher’s assistants & child care<br />
workers (center-based)<br />
Residential construction workers<br />
25.8%<br />
22.3%<br />
22.2%<br />
22.0%<br />
21.0%<br />
18.7%<br />
17.6%<br />
17.3%<br />
16.4%<br />
12.9%<br />
10.4%<br />
8.4%<br />
6.2%<br />
2.3%<br />
0% 20% 40% 60% 80% 100%<br />
Violation Rate<br />
Source: Authors’ analysis <strong>of</strong> 2008 Unregulated Work <strong>Survey</strong>.<br />
*Janitors in small commercial & residential buildings only.<br />
27
The Role <strong>of</strong> Job <strong>and</strong> Employer Characteristics continued…<br />
Table 4.1: Workplace Violation Rates by Job <strong>and</strong> Employer Characteristics, New York City<br />
Percent <strong>of</strong> workers with violations<br />
Minimum wage<br />
violation rate<br />
Weekly overtime<br />
violation rate*<br />
Off-the-clock<br />
violation rate*<br />
Meal break<br />
violation rate*<br />
All respondents 21.2 77.3 69.3 69.7<br />
Pay type Hourly 13.6 63.2 61.1 68.5<br />
Non-hourly 32.4 94.6 82.3 73.1<br />
Pay method Paid in cash 29.2 91.8 76.2 73.7<br />
Paid by company check 9.4 58.2 60.2 66.0<br />
Company size Less than 100 employees 24.7 80.8 77.2 76.6<br />
100 employees or more 10.3 58.2 55.8 61.6<br />
* Calculated as a percentage <strong>of</strong> all workers who were at risk for a violation<br />
during the previous work week.<br />
Source: Authors’ analysis <strong>of</strong> 2008 Unregulated Work <strong>Survey</strong>.<br />
Minimum wage violation rates also vary sharply depending on whether workers are paid in cash or<br />
by company check. 36 Although it is not illegal for employers to pay employees in cash, state law requires<br />
that employees be provided an itemized statement <strong>of</strong> earnings <strong>and</strong> deductions for each pay period.<br />
As noted in the previous section, 55 percent <strong>of</strong> workers in our sample did not receive the required<br />
statement from their employer—<strong>and</strong> among workers who were paid in cash, 92 percent did not<br />
receive such a statement.<br />
<strong>Without</strong> the transparency afforded by pay statements, workers <strong>of</strong>ten are unable to determine whether<br />
they have received the wages they are due. As Table 4.1 shows, workers who were paid in cash had<br />
more than three times the minimum wage violation rate <strong>of</strong> those paid by company check (29 percent<br />
<strong>and</strong> 9 percent, respectively).<br />
Pay type (hourly vs. non-hourly) <strong>and</strong> pay method (cash vs. company check) are related but not<br />
the same. One might expect that workers who were paid a regular hourly wage generally would be<br />
paid by company check; but in fact, more than a third <strong>of</strong> hourly workers in our sample were paid in<br />
cash. That said, when both pay type <strong>and</strong> pay method were non-st<strong>and</strong>ard, minimum wage violations<br />
were especially high for workers in our sample. As Figure 4.3 shows, workers who were paid on<br />
an hourly basis <strong>and</strong> by company check had the lowest minimum wage violation rate, at 8 percent.<br />
In contrast, non-hourly workers who were paid in cash had a violation rate four times this level<br />
(33 percent).<br />
Finally, company size has a significant relationship to minimum wage violation rates. As Table 4.1<br />
shows, workers employed in companies with less than 100 employees had a violation rate<br />
more than double that <strong>of</strong> workers in larger companies (25 percent <strong>and</strong> 10 percent, respectively).<br />
That said, even workers employed by larger companies were at risk <strong>of</strong> minimum wage violations.<br />
28
Figure 4.3: Minimum Wage Violation Rates by Pay Arrangement, New York City<br />
100%<br />
80%<br />
60%<br />
40%<br />
21%<br />
33.3%<br />
Violation Rate<br />
20%<br />
0%<br />
7.7%<br />
Worker paid hourly,<br />
by company check<br />
21.8% 22.3%<br />
Worker paid<br />
hourly, in cash<br />
Worker paid non-hourly,<br />
by company check<br />
Worker paid nonhourly,<br />
in cash<br />
Source: Authors’ analysis <strong>of</strong> 2008 Unregulated Work <strong>Survey</strong>.<br />
Overtime violations 37<br />
Overtime violations can occur in a number <strong>of</strong> ways. For example, some employers only pay workers<br />
their regular hourly rate—or “straight time”—for overtime hours, rather than the time-<strong>and</strong>-a-half rate<br />
required by law. Other employers fail to pay employees anything at all for their overtime hours. For<br />
example, a full-time child care worker might be paid $400 a week to care for small children <strong>and</strong> to<br />
perform various light housekeeping duties. She routinely may be expected to extend those hours<br />
beyond the 40-hour threshold when family members return home late, though her salary remains the<br />
same. Still other employers may give workers small amounts <strong>of</strong> pay for overtime—say, an extra $20<br />
for five additional hours on Saturday, after a full week’s work. 38<br />
As we saw in the previous section, 77 percent <strong>of</strong> respondents in our sample who worked more than 40<br />
hours during the previous workweek for a single employer did not get paid for overtime as required by<br />
law. Figure 4.4 shows that overtime violation rates were high across all the industries in our sample. 39<br />
Most ranged from 75 percent (in the restaurant industry) to 97 percent (for workers in personal <strong>and</strong><br />
repair services, social services, child day care centers <strong>and</strong> schools). The janitorial, security <strong>and</strong> grounds<br />
services industries had a lower violation rate at 41 percent. (Note: for the janitorial industry, our sample<br />
only includes janitors working in small commercial <strong>and</strong> residential buildings.)<br />
Figure 4.5 shows that overtime violation rates are high across all the occupations in our sample, but there also<br />
is substantial variation in violation rates. Rates are particularly high for hairdressers, cosmetologists, laundry<br />
<strong>and</strong> dry-cleaning workers, with a violation rate <strong>of</strong> 98 percent among those who worked more than 40 hours<br />
during the previous workweek.<br />
Table 4.1 shows the relationship between pay type <strong>and</strong> overtime violations. As was the case for<br />
minimum wage violations, non-hourly workers in our sample experienced disproportionately high<br />
overtime violation rates. Among those who worked more than 40 hours during the previous workweek<br />
29
The Role <strong>of</strong> Job <strong>and</strong> Employer Characteristics continued…<br />
Figure 4.4: Overtime Violation Rates by Industry,* New York City<br />
Personal services (laundries, car<br />
washes, beauty shops), social services,<br />
child day care centers & schools<br />
Grocery stores<br />
85.9%<br />
96.8%<br />
Private households<br />
84.6%<br />
Retail & drug stores<br />
Home health care & other health care<br />
services<br />
80.9%<br />
78.7%<br />
Manufacturing, transportation,<br />
wholesale & residential construction<br />
76.9%<br />
Restaurants<br />
75.2%<br />
Janitorial,** security<br />
& grounds services<br />
40.7%<br />
0% 20% 40% 60% 80% 100%<br />
Violation Rate<br />
Source: Authors’ analysis <strong>of</strong> 2008 Unregulated Work <strong>Survey</strong>.<br />
Figure 4.5: Overtime Violation Rates by Occupation,* New York City<br />
Hairdressers, laundry<br />
& dry-cleaning workers<br />
98.4%<br />
Home health care workers<br />
82.9%<br />
Child care workers, teacher’s<br />
assistants, maids & housekeepers<br />
82.4%<br />
Retail salespersons & tellers<br />
80.5%<br />
Waiters, bussers & bartenders<br />
79.5%<br />
Production, residential construction<br />
& transportation workers<br />
79.3%<br />
Cashiers<br />
76.7%<br />
Cooks, dishwashers<br />
& food preparers<br />
76.1%<br />
Stock & <strong>of</strong>fice clerks<br />
74.6%<br />
Janitors,** building cleaners,<br />
grounds workers & security guards<br />
62.6%<br />
0% 20% 40% 60% 80% 100%<br />
Violation Rate<br />
Source: Authors’ analysis <strong>of</strong> 2008 Unregulated Work <strong>Survey</strong>.<br />
* * Calculated as a percent <strong>of</strong> workers who worked more than 40 hours for a single employer during the previous work week.<br />
** Janitors in small commercial & residential buildings only.<br />
30
for a single employer, 95 percent <strong>of</strong> non-hourly workers had an overtime pay violation. This high<br />
violation rate is not surprising, since flat weekly or flat daily pay rates, by definition, do not vary<br />
with hours worked; but the lesson is that non-hourly pay arrangements virtually guarantee that<br />
workers will experience overtime violations at some point.<br />
But hourly workers also face very high overtime violation rates: 63 percent were not paid or<br />
were underpaid for their overtime hours in the previous workweek. Similarly, when employers<br />
pay workers in cash, violations <strong>of</strong> overtime pay laws are markedly high: 92 percent <strong>of</strong> these<br />
workers experienced an overtime pay violation, compared with 58 percent <strong>of</strong> those who were<br />
paid by company check.<br />
Overtime violation rates also vary with company size. As Table 4.1 shows, front-line workers in<br />
companies with less than 100 employees had an overtime violation rate <strong>of</strong> 81 percent. 40 In contrast,<br />
workers in companies with 100 or more employees had a violation rate <strong>of</strong> 58 percent.<br />
Off-the-clock violations<br />
A large majority (69 percent) <strong>of</strong> workers in our sample who worked before <strong>and</strong>/or after their shift in the<br />
previous workweek were not paid for that part <strong>of</strong> their working time. Figures 4.6 <strong>and</strong> 4.7 show these<br />
<strong>of</strong>f-the-clock violation rates by industry <strong>and</strong> occupation. 41 As was the case for overtime violations,<br />
workers employed by personal <strong>and</strong> repair services, social services, child day care centers <strong>and</strong> schools<br />
had very high <strong>of</strong>f-the-clock violation rates (80 percent). The rate was even higher (84 percent) for<br />
workers in the home health care industry <strong>and</strong> other health care services. When analyzed by occupation,<br />
hairdressers, cosmetologists, laundry <strong>and</strong> dry-cleaning workers <strong>and</strong> home health care workers had high<br />
<strong>of</strong>f-the-clock violation rates, greater than 85 percent.<br />
As Table 4.1 shows, workers with non-hourly pay type (such as flat daily or weekly pay) had higher<br />
<strong>of</strong>f-the-clock pay violation rates than those paid by the hour. Company size was also significant;<br />
77 percent <strong>of</strong> workers in companies with less than 100 employees experienced an <strong>of</strong>f-the-clock<br />
violation, compared with 56 percent <strong>of</strong> workers in larger companies.<br />
Meal break violations<br />
Figures 4.8 <strong>and</strong> 4.9 show meal break violation rates by industry <strong>and</strong> occupation. Overall, among<br />
respondents who worked enough hours to qualify for a meal break, 70 percent had their breaks denied,<br />
shortened or interrupted. Violation rates were especially high for workers in the apparel <strong>and</strong> textile<br />
manufacturing industries (many <strong>of</strong> whom are paid by the piece), the home health care <strong>and</strong> private<br />
household industries (in which many workers have no one to cover them for a meal break) <strong>and</strong> beauty<br />
salons, nail salons <strong>and</strong> barbers. Waiters, table bussers <strong>and</strong> bartenders also experienced relatively high<br />
meal break violation rates, which is commonly reported in the restaurant industry.<br />
Finally, Table 4.1 shows that meal break violations rates vary by company size. More than three-quarters<br />
<strong>of</strong> those employed by companies with less than 100 workers had a meal break violation, compared with<br />
62 percent <strong>of</strong> those employed by larger companies. Pay type <strong>and</strong> pay method did not have significant<br />
effects on meal break violation rates.<br />
31
The Role <strong>of</strong> Job <strong>and</strong> Employer Characteristics continued…<br />
Figure 4.6: Off-The-Clock Violation Rates by Industry,* New York City<br />
Home health care &<br />
other health care services<br />
Personal services (laundries, car<br />
washes, beauty shops), social services,<br />
child day care centers & schools<br />
Private households<br />
76.4%<br />
80.0%<br />
83.9%<br />
Restaurants<br />
73.0%<br />
Manufacturing, transportation,<br />
wholesale & residential construction<br />
69.7%<br />
Janitorial,** security<br />
& grounds services<br />
68.3%<br />
Grocery stores<br />
62.9%<br />
Retail & drug stores<br />
54.8%<br />
0% 20% 40% 60% 80% 100%<br />
Violation Rate<br />
Source: Authors’ analysis <strong>of</strong> 2008 Unregulated Work <strong>Survey</strong>.<br />
Figure 4.7: Off-The-Clock Violation Rates by Occupation,* New York City<br />
Hairdressers, laundry<br />
& dry-cleaning workers<br />
Home health care workers<br />
Janitors,** building cleaners,<br />
grounds workers & security guards<br />
82.2%<br />
87.5%<br />
86.0%<br />
Cooks, dishwashers & food preparers<br />
Child care workers, teacher’s<br />
assistants, maids & housekeepers<br />
Production, residential construction<br />
& transportation workers<br />
Waiters, bussers & bartenders<br />
72.6%<br />
72.2%<br />
70.8%<br />
68.0%<br />
Stock & <strong>of</strong>fice clerks<br />
62.6%<br />
Cashiers<br />
57.4%<br />
Retail salespersons & tellers<br />
46.3%<br />
0% 20% 40% 60% 80% 100%<br />
Violation Rate<br />
Source: Authors’ analysis <strong>of</strong> 2008 Unregulated Work <strong>Survey</strong>.<br />
* Calculated as a percent <strong>of</strong> workers who worked before or after their <strong>of</strong>ficial shift during the previous work week.<br />
** Janitors in small commercial & residential buildings only.<br />
32
Figure 4.8: Meal Break Violation Rates by Industry,* New York City<br />
Apparel & textile manufacturing<br />
Home health care<br />
Beauty salons, nail salons<br />
& barber shops<br />
Private households<br />
Restaurants<br />
Food & furniture manufacturing,<br />
transportation & wholesale<br />
88.4%<br />
84.8%<br />
81.7%<br />
81.3%<br />
78.3%<br />
76.7%<br />
Courier & messenger services<br />
Laundry & dry cleaning<br />
69.5%<br />
69.0%<br />
Retail & drug stores<br />
Grocery stores<br />
Janitorial,** security<br />
& grounds services<br />
Other (other health care,<br />
banking, auto repair, carwashes)<br />
Social services, child<br />
day care centers & schools<br />
Residential construction<br />
40.7%<br />
38.4%<br />
63.1%<br />
59.6%<br />
55.6%<br />
55.2%<br />
0% 20% 40% 60% 80% 100%<br />
Violation Rate<br />
Source: Authors’ analysis <strong>of</strong> 2008 Unregulated Work <strong>Survey</strong>.<br />
Figure 4.9: Meal Break Violation Rates by Occupation,* New York City<br />
Sewing & garment workers<br />
Waiters, bussers & bartenders<br />
Hairdressers & cosmetologists<br />
Home health care workers<br />
Security guards<br />
Factory & packaging workers<br />
Child care workers<br />
& teacher’s assistants<br />
Retail salespersons & tellers<br />
Maids & housekeepers<br />
Cashiers<br />
Delivery drivers, parking lot<br />
attendants, car wash & repair workers<br />
Cooks, dishwashers & food preparers<br />
Laundry & dry-cleaning workers<br />
Stock & <strong>of</strong>fice clerks<br />
Couriers & messengers<br />
91.0%<br />
89.1%<br />
87.2%<br />
83.7%<br />
83.2%<br />
80.1%<br />
74.9%<br />
73.2%<br />
72.1%<br />
69.1%<br />
67.9%<br />
63.9%<br />
58.4%<br />
58.4%<br />
56.8%<br />
Residential construction workers<br />
Janitors,** building cleaners<br />
& grounds workers<br />
27.6%<br />
42.5%<br />
0% 20% 40% 60% 80% 100%<br />
Violation Rate<br />
Source: Authors’ analysis <strong>of</strong> 2008 Unregulated Work <strong>Survey</strong>.<br />
* Calculated as a percent <strong>of</strong> workers who were legally entitled to at least one meal break during the previous work week.<br />
** Janitors in small commercial & residential buildings only.<br />
33
The Role <strong>of</strong> Job <strong>and</strong> Employer Characteristics continued…<br />
Workplace practices associated with lower violation rates<br />
Overall, our findings paint a picture <strong>of</strong> routine violations <strong>of</strong> labor <strong>and</strong> employment laws across the<br />
wide range <strong>of</strong> industries, occupations <strong>and</strong> workplaces in our sample. But the low-wage labor market<br />
is not monolithic; sociologists <strong>and</strong> economists long have documented that there is significant variation<br />
in employers’ business strategies, even within specific industries. 42 Our survey provides additional<br />
evidence along these lines. We asked the workers in our sample about a range <strong>of</strong> employer practices at<br />
their workplace, <strong>and</strong> 56 percent indicated their employers <strong>of</strong>fered them health insurance, provided paid<br />
vacation days or paid sick days or had given them a raise in the past year.<br />
As Table 4.2 shows, these workplace practices—<strong>of</strong>fering health insurance, providing paid vacation <strong>and</strong><br />
sick days <strong>and</strong> raising wages—are associated with lower minimum wage violations. 43 These are strong<br />
correlations, <strong>and</strong> they are not surprising. Employers that <strong>of</strong>fer health benefits, provide paid time <strong>of</strong>f <strong>and</strong> give<br />
regular raises are following a business model <strong>of</strong> investing in workers, leading to greater productivity, lower<br />
turnover <strong>and</strong> other benefits for the company. 44 Compliance with minimum wage laws is aligned with these<br />
workplace practices. But as our data suggest, the alignment is not perfect, pointing to the need for research<br />
on how compliance with (or violation <strong>of</strong>) workplace laws intersects with other business strategies.<br />
Table 4.2: Workplace Violation Rates by Other Employer Practices, New York City<br />
Percent <strong>of</strong> workers with violations<br />
Minimum wage<br />
violation rate<br />
Weekly overtime<br />
violation rate*<br />
Off-the-clock<br />
violation rate*<br />
Meal break<br />
violation<br />
rate*<br />
All respondents 21.2 77.3 69.3 69.7<br />
Employer gave worker a raise<br />
Employer <strong>of</strong>fered worker health insurance<br />
Employer gave worker paid sick<br />
<strong>and</strong> paid vacation time<br />
No 26.8 80.3 73.4 72.4<br />
Yes 12.4 74.0 61.8 65.0<br />
No 25.7 80.0 73.2 71.7<br />
Yes 5.0 67.1 50.5 63.0<br />
No 23.6 82.1 71.4 72.7<br />
Yes 6.5 61.3 63.8 61.7<br />
* Calculated as a percentage <strong>of</strong> all workers who were at risk for a violation<br />
during the previous work week.<br />
Source: Authors’ analysis <strong>of</strong> 2008 Unregulated Work <strong>Survey</strong>.<br />
A note on unionized workers<br />
This study is not able to provide an accurate estimate <strong>of</strong> the impact <strong>of</strong> unionization on the prevalence<br />
<strong>of</strong> workplace violations. Many unionized industries were excluded from our sample because they<br />
had median wages that were higher than our low-wage threshold, <strong>and</strong> therefore were not included in<br />
our sample from the outset (see Appendix A for details on our sampling universe). In addition,<br />
the limited number <strong>of</strong> unionized workers who made it into our sample were concentrated in a very<br />
small set <strong>of</strong> industries, which resulted in a skewed industry distribution. Therefore, any analysis <strong>of</strong><br />
differences in violation rates between unionized <strong>and</strong> non-union workers in our sample would yield<br />
statistically biased results that could not be used to infer conclusions about the impact <strong>of</strong> unionization<br />
on workplace violations.<br />
34
Summary<br />
Job <strong>and</strong> employer characteristics are strong determinants <strong>of</strong> workplace violations—<strong>and</strong> in fact have a<br />
greater impact on violation rates than do worker characteristics, as we will see in Section 6. Specifically:<br />
• Workplace violation rates vary significantly by industry <strong>and</strong> occupation. For example, minimum<br />
wage violation rates ranged from as little as 2 percent in some industries to as much as 53<br />
percent in others, <strong>and</strong> the range across occupations was similarly wide.<br />
• Some industries <strong>and</strong> occupations are rife with multiple violations, suggesting that non-compliance<br />
with employment <strong>and</strong> labor laws may have become a st<strong>and</strong>ard business practice. For example,<br />
laundry <strong>and</strong> dry-cleaning workers face multiple violations; these workers have the highest<br />
minimum wage, overtime <strong>and</strong> <strong>of</strong>f-the-clock violation rates compared with all other occupations.<br />
High violation rates also were typical <strong>of</strong> the private household industry. In other cases, like<br />
residential construction, violation rates tended to be lower (though still significant). Some<br />
industries <strong>and</strong> occupations had very high violation rates for some violations but not for others—<br />
for example, home health care workers had a very low minimum wage violation rate but very high<br />
rates <strong>of</strong> overtime, <strong>of</strong>f-the-clock <strong>and</strong> meal break violations.<br />
• Employers disguise pay-related violations by using non-hourly pay arrangements <strong>and</strong>/or paying<br />
workers in cash without providing a statement <strong>of</strong> earnings <strong>and</strong> deductions. Workers paid a flat<br />
weekly rate or paid in cash had much higher violation rates than those paid a st<strong>and</strong>ard hourly<br />
rate <strong>and</strong> paid by company check. Informal pay systems may facilitate minimum wage <strong>and</strong><br />
other violations, while making it harder for workers to claim their rights under the law. This is<br />
particularly true for overtime violations, which are virtually guaranteed when workers are paid a<br />
flat weekly or daily rate.<br />
• Finally, workers employed by companies with less than 100 employees were at greater risk <strong>of</strong><br />
experiencing violations than those employed by larger companies. But the problem <strong>of</strong> workplace<br />
violations is by no means limited to small firms. In our sample, more than one out <strong>of</strong> 10 workers<br />
at large companies had a minimum wage violation in the previous week, <strong>and</strong> among those who<br />
worked overtime, nearly 60 percent were underpaid or not paid at all for the extra hours.<br />
We also found that there are some workplace practices that result in fewer workplace violations. In our<br />
sample, employers who <strong>of</strong>fered health insurance, paid sick days <strong>and</strong> vacation days, <strong>and</strong> who gave their<br />
workers annual raises, were less likely to violate minimum wage law.<br />
Taken together, our findings suggest that employers’ compliance with labor laws is intimately associated<br />
with the organization <strong>of</strong> work. Some industries consistently have higher violation rates than others—<br />
suggesting there are prevailing industry strategies that shape the decisions individual employers make<br />
about whether to follow the law. Similarly, the fact that informal pay systems are predictive <strong>of</strong> violations<br />
suggests employers who want to violate the law are consciously manipulating how they pay workers to<br />
disguise those violations. And the “bundling” we described above—that employers who don’t follow<br />
the law also don’t provide health insurance or give raises or otherwise invest in their workers—paints a<br />
picture <strong>of</strong> a consistent business strategy on the part <strong>of</strong> the employer.<br />
35
5<br />
The Role <strong>of</strong> Worker<br />
Characteristics<br />
Workplace violations are not evenly distributed<br />
throughout the low-wage labor market, as we have<br />
seen, but vary with industry, occupation <strong>and</strong> other<br />
job <strong>and</strong> employer characteristics. These variations<br />
have a demographic dimension as well. Worker<br />
characteristics play a role in two important ways:<br />
some workers are more likely to hold jobs in the lowwage<br />
labor market than others (women, immigrants<br />
<strong>and</strong> people <strong>of</strong> color, see Section 2), <strong>and</strong> within the<br />
low-wage labor market, some groups <strong>of</strong> workers are<br />
more likely to experience violations than others,<br />
as we will see in this section.<br />
Specifically, we examine workplace violations in<br />
relation to gender, race/ethnicity, nativity, education,<br />
age, training <strong>and</strong> job tenure; <strong>and</strong> among foreign-born<br />
workers, by immigration status, date <strong>of</strong> arrival in the<br />
United States <strong>and</strong> English-language pr<strong>of</strong>iciency.<br />
Each type <strong>of</strong> workplace violation discussed here—<br />
being paid less than the minimum wage, not being<br />
paid properly for overtime work, working <strong>of</strong>f the clock<br />
<strong>and</strong> not receiving legally required meal breaks—has<br />
a distinctive pattern <strong>of</strong> distribution across these<br />
demographic variables; for this reason, we discuss<br />
each one separately below.<br />
37
The Role <strong>of</strong> Worker Characteristics continued…<br />
Minimum wage violations<br />
As Table 5.1 shows, minimum wage violation rates vary significantly with a range <strong>of</strong> demographic<br />
characteristics. For example, 25 percent <strong>of</strong> foreign-born workers had a minimum wage violation in the<br />
previous week, more than twice the rate <strong>of</strong> their U.S.-born counterparts. 45 Among foreign-born workers,<br />
legal status also was significant—36 percent <strong>of</strong> unauthorized immigrants had a minimum wage violation,<br />
compared with 21 percent <strong>of</strong> authorized immigrants.<br />
Race <strong>and</strong> ethnicity were salient factors as well: more than a quarter <strong>of</strong> Latino workers in our<br />
sample experienced minimum wage violations, which was significantly higher than the rates for<br />
Asian/other, black <strong>and</strong> white workers. White workers had a particularly low minimum wage violation<br />
rate, at 3 percent.<br />
But gender, nativity <strong>and</strong> race/ethnicity are deeply intertwined, <strong>and</strong> the aggregate patterns shown in<br />
Table 5.1 do not fully reveal the complex interrelationships among these categories. 46 For example, as<br />
Figure 5.1 shows, the high violation rate for foreign-born workers was concentrated among unauthorized<br />
immigrants, particularly women—40 percent <strong>of</strong> female unauthorized immigrants in our sample had a<br />
minimum wage violation in the previous week (which is significantly higher than the rate for foreign-born<br />
authorized men, <strong>and</strong> U.S.-born men <strong>and</strong> women).<br />
In a similar vein, violation rates were not uniform among workers born in the United States, but<br />
rather were strongly mediated by race/ethnicity. Specifically, U.S.-born workers <strong>of</strong> color had minimum<br />
wage violation rates ranging from 8 percent to 17 percent—in stark contrast to U.S.-born white<br />
workers, who in our sample did not have any minimum wage violations in the previous workweek<br />
(see Figure 5.2).<br />
Education was another important factor. Workers who did not graduate from high school or receive<br />
their GED had a significantly higher minimum wage violation rate (28 percent) compared with those<br />
with some college education (16 percent). That said, higher education does not insulate workers from<br />
minimum wage violations.<br />
Surprisingly, other key demographic characteristics did not have statistically significant effects<br />
on minimum wage violations. For example, among immigrant workers, violation rates varied little<br />
between recent arrivals <strong>and</strong> those who were more settled in the United States. As Table 5.1 shows,<br />
foreign-born respondents who had lived in the United States six or more years at the time <strong>of</strong> the<br />
survey had a minimum wage violation rate similar to that <strong>of</strong> newcomers. In the same vein, job tenure<br />
<strong>and</strong> age <strong>of</strong>ten are strong predictors <strong>of</strong> labor market outcomes. But in our sample <strong>of</strong> workers, neither<br />
<strong>of</strong> these factors—nor job training or English-language ability—had a statistically significant effect<br />
(see Table 5.1). 47<br />
38
Table 5.1: Violation Rates by Worker Characteristics, New York City<br />
Percent <strong>of</strong> workers with violations<br />
Minimum wage<br />
violation rate<br />
Weekly<br />
overtime<br />
violation rate*<br />
Off-the-clock<br />
violation rate<br />
Meal break<br />
violation rate*<br />
All respondents 21.2 77.3 69.3 69.7<br />
Gender Male 17.4 75.0 73.0 63.0<br />
Female 23.6 79.3 64.8 76.8<br />
Race/ethnicity Latino/Latina 27.3 79.8 64.3 66.8<br />
Black 9.9 74.4 71.5 66.6<br />
Asian/other 16.9 79.9 75.8 75.3<br />
White 3.2 84.5 80.5 77.8<br />
Nativity U.S.-born 11.5 63.0 64.9 62.7<br />
Foreign-born 25.4 83.4 71.2 72.7<br />
Education Less than high school, no GED 28.3 78.9 71.0 70.0<br />
High school graduate or GED 18.7 81.7 59.1 72.3<br />
Some college or higher 16.0 71.4 73.7 67.0<br />
Age 18-25 17.2 79.8 60.4 71.7<br />
26-35 27.2 74.8 74.6 71.5<br />
36-45 22.5 77.2 73.4 70.0<br />
46+ 23.6 78.2 75.9 67.7<br />
Vocational<br />
training<br />
None 22.5 78.0 70.3 69.0<br />
Completed training program 18.6 74.3 65.7 73.2<br />
Job tenure Less than 3 years 23.1 80.2 72.7 68.8<br />
3-4 years 20.4 80.0 63.2 67.4<br />
5+ years 16.3 70.8 63.4 74.7<br />
Foreign-born respondents:<br />
Legal status Authorized 21.0 77.5 63.4 68.6<br />
Unauthorized 35.9 92.0 83.4 78.6<br />
Years since<br />
arrival in the<br />
U.S.<br />
Less than 6 years<br />
6+ years<br />
24.9<br />
26.6<br />
N/A<br />
N/A<br />
72.0<br />
66.7<br />
N/A<br />
N/A<br />
English<br />
pr<strong>of</strong>iciency<br />
Speaks very well or well 21.8 67.9 63.7 64.0<br />
Speaks not well or not at all 27.5 88.5 76.0 75.8<br />
N/A indicates that the data were insufficient to permit reliable estimates.<br />
*Calculated as a percentage <strong>of</strong> all workers who were at risk for a violation during the previous work week.<br />
Source: Authors’ analysis <strong>of</strong> 2008 Unregulated Work <strong>Survey</strong>.<br />
39
The Role <strong>of</strong> Worker Characteristics continued…<br />
Figure 5.1: Minimum Wage Violation Rates by Gender, Nativity <strong>and</strong> Legal Status, New York City<br />
100%<br />
Male<br />
Female<br />
80%<br />
60%<br />
Violation Rate<br />
40%<br />
20%<br />
0%<br />
21%<br />
40.1%<br />
29.4%<br />
24.0%<br />
13.0%<br />
15.1%<br />
10.4%<br />
U.S.-born Foreign-born authorized Foreign-born unauthorized<br />
Source: Authors’ analysis <strong>of</strong> 2008 Unregulated Work <strong>Survey</strong>.<br />
Figure 5.2: Minimum Wage Violation Rates by Race/Ethnicity <strong>and</strong> Nativity, New York City<br />
100%<br />
U.S.-born<br />
Foreign-born<br />
80%<br />
60%<br />
40%<br />
31.6%<br />
21%<br />
Violation Rate<br />
20%<br />
0%<br />
17.1%<br />
18.4%<br />
17.4%<br />
12.3%<br />
8.2%<br />
3.4%<br />
0.0%<br />
Latino/Latina Black Asian/other White<br />
Source: Authors’ analysis <strong>of</strong> 2008 Unregulated Work <strong>Survey</strong>.<br />
40
Overtime violations<br />
Overtime violation rates were only weakly correlated with demographic characteristics. For respondents<br />
who worked more than 40 hours for a single employer during the previous workweek, the prevalence <strong>of</strong><br />
overtime violations was high across virtually all demographic groups, as shown in Table 5.1.<br />
Nativity, legal status <strong>and</strong> English-language speaking ability were the only demographic factors that had a<br />
significant effect. Immigrant workers in our sample had an 83 percent overtime violation rate, compared<br />
with 63 percent for the U.S.-born. There also were substantial differences among immigrants by English<br />
pr<strong>of</strong>iciency levels <strong>and</strong> legal status.<br />
Workers who reported they spoke<br />
English “not well” or “not at all”<br />
had an overtime violation rate <strong>of</strong><br />
89 percent, compared with 68<br />
percent <strong>of</strong> workers who reported<br />
speaking “very well” or “well.”<br />
Authorized immigrants had an<br />
overtime violation rate <strong>of</strong> 78<br />
percent, compared to 92 percent<br />
<strong>of</strong> unauthorized immigrants.<br />
Figure 5.3: Overtime Violation Rates by Gender, Nativity<br />
<strong>and</strong> Legal Status,* New York City<br />
100%<br />
80%<br />
60%<br />
Male<br />
51.4%<br />
73.8%<br />
Female<br />
81.8%<br />
75.5%<br />
93.1%<br />
90.2%<br />
40%<br />
Although gender was not<br />
significant by itself, a more<br />
20%<br />
nuanced story emerged when<br />
gender was analyzed together<br />
with nativity <strong>and</strong> legal status.<br />
0%<br />
As shown in Figure 5.3, overtime<br />
violation rates were significantly<br />
lower for U.S.-born men than<br />
for foreign-born authorized men<br />
<strong>and</strong> foreign-born unauthorized men <strong>and</strong> women. It is important to note, however, the violation rate for<br />
U.S.-born men was not small in absolute terms—with more than 50 percent experiencing an overtime<br />
violation in the previous workweek.<br />
Violation Rate<br />
U.S.-born Foreign-born authorized Foreign-born unauthorized<br />
Source: Authors’ analysis <strong>of</strong> 2008 Unregulated Work <strong>Survey</strong>.<br />
* Calculated as a percent <strong>of</strong> workers who worked more than 40 hours for a single employer during the previous work week.<br />
Race, gender, job tenure, vocational training, education <strong>and</strong> age did not appear to have any systematic<br />
relationship to overtime violation rates.<br />
Off-the-clock violations<br />
As shown in Table 5.1, <strong>of</strong>f-the clock violation rates, like overtime, were consistently high across most<br />
demographic characteristics. Immigrants’ legal status was the only characteristic that had a statistically<br />
significant effect: unauthorized immigrants had a higher violation rate (83 percent) than authorized<br />
immigrants (63 percent). In addition, gender <strong>and</strong> age become significant when we look at U.S.-born<br />
workers only. U.S.-born men had a higher <strong>of</strong>f-the-clock violation rate (76 percent) than native-born<br />
women (54 percent). Similarly, older U.S.-born workers had higher <strong>of</strong>f-the-clock violation rates than<br />
younger workers.<br />
41
Meal break violations<br />
Meal break violations also show very limited variation across demographic categories. As Table 5.1<br />
shows, meal break violation rates were significantly higher for women than for men. Immigrant workers<br />
had a higher violation rate than U.S.-born respondents. And among U.S.-born respondents, younger<br />
workers were significantly more likely to experience a meal break violation (82 percent) compared with<br />
all other age groups (whose violation rates ranged from 52 percent to 59 percent).<br />
Summary<br />
Gender, nativity, race <strong>and</strong> ethnicity each play a role in shaping at least some <strong>of</strong> the workplace violations<br />
discussed here. Moreover, these dimensions are deeply intertwined <strong>and</strong> need to be examined together<br />
in order to underst<strong>and</strong> which groups <strong>of</strong> workers are most at risk <strong>of</strong> a violation.<br />
That said, taken as a whole, worker characteristics were only weakly correlated with three <strong>of</strong> the four<br />
violations examined above. The one partial exception was minimum wage violations:<br />
• Foreign-born workers were more than twice as likely as their U.S.-born counterparts to have<br />
a minimum wage violation. The higher rates were concentrated among women—especially<br />
women who were unauthorized immigrants, 40 percent <strong>of</strong> whom had a minimum wage<br />
violation in the previous week.<br />
• U.S.-born workers <strong>of</strong> color had minimum wage violation rates ranging from 8 percent to 17<br />
percent, in stark contrast to U.S.-born white workers, who in our sample did not have any<br />
minimum wage violations in the previous workweek.<br />
• Higher levels <strong>of</strong> education <strong>of</strong>fered some protection from minimum wage violations, but even<br />
college-educated workers still were at significant risk.<br />
In fact, education, which is <strong>of</strong>ten one <strong>of</strong> the strongest predictors <strong>of</strong> labor market outcomes, had<br />
no significant impact on overtime, <strong>of</strong>f-the-clock <strong>and</strong> meal break violations. Similarly, other worker<br />
characteristics that <strong>of</strong>ten are strong predictors—job tenure, age <strong>and</strong> length <strong>of</strong> time in the United<br />
States—did not have a significant impact on any <strong>of</strong> the four workplace violation outcomes examined.<br />
There are several caveats to these findings. First, in some <strong>of</strong> the above analyses, sample sizes became<br />
small, meaning that statistical significance was harder to reach. Second, it is important to remember<br />
that all <strong>of</strong> these analyses were conducted within the low-wage sector only, <strong>and</strong> so one would expect<br />
variation in outcomes by demographic characteristics to be muted (we elaborate on this point in the<br />
next section).
6<br />
Wage Theft in New York City<br />
In this report, we have documented that violations<br />
<strong>of</strong> core employment <strong>and</strong> labor laws are pervasive<br />
in America’s largest city. Minimum wage, overtime,<br />
meal break <strong>and</strong> other violations are not confined<br />
to the periphery <strong>of</strong> the economy or to marginal<br />
employers. On the contrary, such violations are<br />
widespread across demographic categories <strong>and</strong> in<br />
key industries <strong>and</strong> occupations that are at the heart<br />
<strong>of</strong> urban economies in the 21st century.<br />
43
Wage Theft in New York City continued…<br />
Assessing the role <strong>of</strong> worker <strong>and</strong> job characteristics<br />
As we have seen, a range <strong>of</strong> job <strong>and</strong> worker characteristics are correlated with workplace violations.<br />
Further analysis reveals that job <strong>and</strong> worker characteristics have independent effects on the violations<br />
we have documented in this report. Both matter, but they are not always <strong>of</strong> equal importance. In the<br />
low-wage industries studied here, job <strong>and</strong> employer characteristics are more powerful predictors <strong>of</strong><br />
minimum wage, overtime <strong>and</strong> meal break violations than are worker characteristics (ranging between<br />
2.1 <strong>and</strong> 3.6 times as powerful; see Appendix A for details).<br />
This finding should not negate the broader finding from Section 2, which is that women, immigrants <strong>and</strong><br />
people <strong>of</strong> color are disproportionately likely to be employed in these industries, <strong>and</strong> therefore more at<br />
risk <strong>of</strong> workplace violations. But once a worker is employed in a low-wage industry, job characteristics<br />
are more important than worker characteristics in terms <strong>of</strong> predicting violations.<br />
Violation rates vary not only across industries <strong>and</strong> occupations but also with other factors, such as<br />
company size, pay arrangements <strong>and</strong> compensation packages. Indeed, some employer practices, such<br />
as <strong>of</strong>fering health insurance, providing paid sick <strong>and</strong> vacation days <strong>and</strong> providing workers regular pay<br />
raises, are correlated with lower violation rates. More generally, our findings suggest that employers’<br />
business strategies shape their decisions about whether to comply with the law.<br />
The high cost <strong>of</strong> workplace violations<br />
It should come as no surprise that the extensive violations <strong>of</strong> employment <strong>and</strong> labor laws documented<br />
in this report directly impact the earnings <strong>of</strong> low-wage workers. The various forms <strong>of</strong> nonpayment <strong>and</strong><br />
underpayment <strong>of</strong> wages take a heavy monetary toll on these workers <strong>and</strong> their families. For the workers<br />
in our sample who experienced a pay-based violation in the previous week, the average amount <strong>of</strong> lost<br />
wages was $58, out <strong>of</strong> average weekly earnings <strong>of</strong> $397. That amounts to wage theft <strong>of</strong> almost 15<br />
percent <strong>of</strong> what they should have earned, if their employers did not violate employment laws. Assuming<br />
a full-year work schedule, we estimate these workers lost an average <strong>of</strong> $3,016 annually due to<br />
workplace violations, out <strong>of</strong> total annual earnings <strong>of</strong> $20,644.<br />
Furthermore, we estimate that in a given week, approximately 317,263 workers in New York City have<br />
at least one pay-based violation. Extrapolating from this figure, front-line workers in low-wage industries<br />
in New York City lose more than $18.4 million per week as a result <strong>of</strong> employment <strong>and</strong> labor law<br />
violations. The largest portion <strong>of</strong> these lost wages is due to overtime violations (44 percent), followed<br />
by minimum wage violations (40 percent) <strong>and</strong> <strong>of</strong>f-the-clock violations (10 percent). 48<br />
Wage theft not only depresses the already meager earnings <strong>of</strong> low-wage workers, it also adversely<br />
impacts their communities <strong>and</strong> the local economies <strong>of</strong> which they are part. Low-income families spend<br />
the large majority <strong>of</strong> their earnings on basic necessities, such as food, clothing <strong>and</strong> housing. Their<br />
expenditures circulate through local economies, supporting businesses <strong>and</strong> jobs. Wage theft robs<br />
local communities <strong>of</strong> this spending, <strong>and</strong> ultimately limits economic growth <strong>and</strong> vitality in our<br />
city’s neighborhoods.<br />
44
7<br />
The Solution: How New York Can<br />
Strengthen Worker Protections<br />
We have shown that many low-wage workers in New<br />
York City effectively lack the core protections that<br />
Americans <strong>of</strong>ten take for granted—the right to be<br />
paid at least the minimum wage, the right to be paid<br />
for overtime hours, the right to take meal breaks,<br />
access to workers’ compensation when injured, the<br />
right to advocate for better working conditions, <strong>and</strong><br />
more. The magnitude <strong>and</strong> breadth <strong>of</strong> the problem—<br />
spanning the city’s industries <strong>and</strong> communities—<br />
requires urgent attention <strong>and</strong> action.<br />
Our starting point is that everyone has a stake in<br />
addressing the problem <strong>of</strong> workplace violations.<br />
When low-wage workers <strong>and</strong> their families struggle<br />
in poverty <strong>and</strong> face constant economic insecurity, the<br />
strength <strong>and</strong> resilience <strong>of</strong> local communities suffers.<br />
When responsible employers are forced to compete<br />
with unscrupulous employers who pay subminimum<br />
wages or cut costs on worker safety, the result is<br />
a race to the bottom that threatens to bring down<br />
st<strong>and</strong>ards throughout the labor market. And when<br />
significant numbers <strong>of</strong> workers are illegally underpaid,<br />
tax revenues are lost by the wider community.<br />
Government enforcement is the cornerstone <strong>of</strong> any<br />
viable response to these workplace violations. Public<br />
policy must recognize the significant resources <strong>and</strong><br />
power that reside with the agencies responsible for<br />
enforcing wage <strong>and</strong> hour, health <strong>and</strong> safety, prevailing<br />
wage, anti-discrimination <strong>and</strong> right-to-organize laws. 49<br />
Our national report, Broken <strong><strong>Law</strong>s</strong>, Unprotected<br />
Workers, proposed a national policy agenda<br />
to fulfill the promise <strong>of</strong> worker protections in<br />
America. We identified three principles to drive<br />
reform: strengthening government enforcement <strong>of</strong><br />
employment <strong>and</strong> labor laws; updating legal st<strong>and</strong>ards<br />
for the 21st century workplace; <strong>and</strong> establishing<br />
equal status for immigrants in the workplace through<br />
comprehensive immigration reform. 50<br />
But this is not just a federal policy agenda; state <strong>and</strong><br />
local governments have a significant role to play as<br />
well. In what follows, we add to the national policy<br />
agenda laid out in Broken <strong><strong>Law</strong>s</strong>, Unprotected Workers<br />
by mapping the key reforms needed in New York to (a)<br />
strengthen public enforcement <strong>of</strong> workplace laws, <strong>and</strong><br />
(b) update the legal st<strong>and</strong>ards that bolster <strong>and</strong> augment<br />
enforcement, at both the state <strong>and</strong> city level. 51 45<br />
45
The Solution: How New York Can Strengthen Worker Protections continued…<br />
A. Strengthening government enforcement<br />
<strong>of</strong> workplace protections<br />
New York is well-placed to tackle the problem <strong>of</strong> workplace violations, given the state’s strong labor<br />
laws, significant enforcement resources <strong>and</strong> energized community advocates. In fact, during the past<br />
several years, New York state agencies have stepped in to fill a growing gap in enforcement at the<br />
federal level. But recent budget cuts have strained resources <strong>and</strong> slowed progress. In order to build<br />
upon its recent success, New York state must recommit resources toward enforcement, continue to<br />
pursue innovative strategies <strong>and</strong> institutionalize them, <strong>and</strong> enact new legislation to address the reality<br />
that workplace violations remain st<strong>and</strong>ard practice in many low-wage industries.<br />
Similarly, New York City has a compelling interest—even an obligation—to address the high rate <strong>of</strong><br />
workplace violations documented in this report. As detailed in Section 6, our conservative estimate is that<br />
about 317,000 workers experience wage-related violations every week in the city, losing more than $18.4<br />
million in wages per week. The impact <strong>of</strong> this staggering wage theft on families, local communities <strong>and</strong><br />
city c<strong>of</strong>fers requires action, by leveraging city resources to ensure employers comply with the law.<br />
1. Strengthen state-level enforcement<br />
New York’s enforcement reforms have begun to show concrete gains in strengthening employers’<br />
compliance with core workplace laws. But our findings clearly indicate that significant violations<br />
remain, <strong>and</strong> that the scale <strong>of</strong> the problem will require a long-term, sustained commitment <strong>of</strong> resources,<br />
stronger enforcement tools <strong>and</strong> continuation <strong>of</strong> innovative strategies <strong>and</strong> community outreach by<br />
key state agencies (the Department <strong>of</strong> <strong>Labor</strong>, the Attorney General’s <strong>Labor</strong> Bureau <strong>and</strong> the Workers’<br />
Compensation Board).<br />
The New York State Department <strong>of</strong> <strong>Labor</strong>: A National Model <strong>of</strong> Enforcement Reform<br />
During the last three years, the New York State<br />
Department <strong>of</strong> <strong>Labor</strong> (DOL) has implemented a range<br />
<strong>of</strong> innovative reforms to better protect the state’s<br />
workers. For example, the agency now pursues proactive<br />
investigations in low-wage industries instead <strong>of</strong> relying<br />
solely on incoming complaints. It also has taken concrete<br />
steps to publicize enforcement efforts, which helps<br />
workers underst<strong>and</strong> their rights <strong>and</strong> sends industrywide<br />
signals that the likelihood <strong>of</strong> inspections is real. 52<br />
Equally important, the state DOL has reached out to<br />
immigrant worker centers, unions, service providers,<br />
legal advocates <strong>and</strong> (where possible) responsible<br />
employers to enhance enforcement. For example, in 2007,<br />
the agency established a Bureau <strong>of</strong> Immigrant Workers’<br />
Rights to build relationships with immigrant communities<br />
across the state, <strong>and</strong> to improve the agency’s internal<br />
policies <strong>and</strong> procedures for accessibility to workers with<br />
limited English pr<strong>of</strong>iciency. 53 Community groups have<br />
been key stakeholders, providing vital “ears on the<br />
ground” to identify high-violation industries, leading to<br />
a pilot program that trains workers to reach out to their<br />
communities about the state’s enforcement efforts. 54<br />
The agency also has begun to prioritize incoming<br />
claims, allowing it to concentrate resources on the most<br />
pressing cases, including those that involve retaliation<br />
<strong>and</strong> evidence <strong>of</strong> repeated, systemic violations. And<br />
in 2007, the state DOL spearheaded an interagency<br />
Misclassification Task Force to tackle the problem<br />
<strong>of</strong> employees who are improperly misclassified as<br />
independent contractors—an illegal practice that costs<br />
workers <strong>and</strong> taxpayers alike. 55<br />
As a result <strong>of</strong> these efforts, the state assessed $20.3<br />
million in unpaid wages <strong>and</strong> damages on behalf <strong>of</strong> 15,424<br />
workers in 2009—significantly more than the $12.2 million<br />
collected in 2006 (on behalf <strong>of</strong> 10,674 workers). 56<br />
46
To start, the state DOL should build upon <strong>and</strong> institutionalize its new enforcement strategies:<br />
•Continue to pursue the range <strong>of</strong> innovative enforcement strategies described above—<strong>and</strong><br />
institutionalize them. For example, the state DOL should continue <strong>and</strong> exp<strong>and</strong> its innovative<br />
program <strong>of</strong> conducting compliance audits in targeted industries, as well as its outreach to<br />
community groups to enhance enforcement. Retraining investigators, revising regulations<br />
<strong>and</strong> internal agency manuals, <strong>and</strong> conducting regular assessments <strong>of</strong> the effectiveness <strong>of</strong><br />
enforcement strategies will help these reforms endure for future administrations. The state<br />
DOL also should continue to partner with other state agencies, such as the Attorney General’s<br />
<strong>Labor</strong> Bureau, to pursue strategic enforcement efforts.<br />
• Restore enforcement staffing at least to 2007 levels. <strong>Law</strong>makers <strong>and</strong> the governor should<br />
restore the state DOL’s staffing so that the agency can build upon its considerable success.<br />
Attrition <strong>and</strong> hiring freezes have taken their toll on the agency, which has lost 15 labor st<strong>and</strong>ards<br />
positions since 2007 alone. 57<br />
• Improve public job training <strong>and</strong> placement services for immigrant workers. The state’s<br />
workforce development programs must do a better job <strong>of</strong> reaching out to immigrant workers<br />
to help them access job training <strong>and</strong> placement services <strong>and</strong> underst<strong>and</strong> their rights—thereby<br />
helping them to avoid unscrupulous employers <strong>and</strong> predatory private employment agencies.<br />
The state Attorney General’s <strong>Labor</strong> Bureau also has a long history <strong>of</strong> effective advocacy on behalf <strong>of</strong><br />
low-wage workers, pursuing high-pr<strong>of</strong>ile litigation <strong>and</strong> building strong relationships with community<br />
groups, unions <strong>and</strong> other advocates in the process. 58 To continue to build upon these longst<strong>and</strong>ing<br />
efforts, the AG’s <strong>Labor</strong> Bureau should:<br />
• Restore enforcement staffing at least to 2007 levels. The AG’s <strong>Labor</strong> Bureau budget should<br />
be restored, allowing it to rehire lost staff. Like the state DOL, the bureau has lost significant<br />
resources over the past three years—dropping from 18 to 13 attorneys <strong>and</strong> managers. 59<br />
•Continue to draw on the expertise <strong>of</strong> community organizations to choose high-impact<br />
enforcement targets. Priority should be given to litigation <strong>and</strong> other enforcement opportunities<br />
that will recover unpaid wages <strong>and</strong> collect damages for workers, <strong>and</strong> that result in ongoing<br />
monitoring agreements.<br />
•Continue to coordinate enforcement efforts with other agencies, such as the New York<br />
DOL <strong>and</strong> other state attorneys general. Coordination between New York state agencies<br />
already has resulted in effective <strong>and</strong> highly publicized enforcement efforts. 60 In addition, attorneys<br />
general increasingly are working together across state lines to target illegal practices that are<br />
nationwide in scope—endeavors where the AG’s <strong>Labor</strong> Bureau continues to show leadership.<br />
Our survey revealed that strikingly few low-wage workers apply for workers’ compensation when<br />
injured on the job. It is therefore vital that the state Workers’ Compensation Board takes steps to<br />
improve its accessibility for this workforce:<br />
Remove structural obstacles that prevent immigrant workers from accessing workers’<br />
•<br />
compensation benefits. For example, certified medical interpreters should be provided for<br />
independent medical examinations without cost to the worker. The board should maintain its<br />
47
The Solution: How New York Can Strengthen Worker Protections continued…<br />
policy that a worker’s immigration status should not be introduced into evidence at hearings.<br />
The board also should exp<strong>and</strong> its efforts to share data with other government agencies to<br />
strategically target investigations <strong>of</strong> employers who fail to insure or are underinsured.<br />
• <br />
Account for employment law violations when assessing workers’ claims for compensation.<br />
For workers who are paid less than the minimum wage, workers’ compensation benefits should<br />
be calculated using at least the legal minimum wage (<strong>and</strong> their employers should be reported<br />
to the state DOL). Workers’ own testimony should be credited as good evidence <strong>of</strong> their<br />
employment terms <strong>and</strong> conditions, placing the burden on employers to produce records to<br />
refute such evidence.<br />
Finally, new enforcement tools would bolster the efforts <strong>of</strong> these state agencies <strong>and</strong> community<br />
advocates to enforce worker protections. State lawmakers should enact new laws to aid in these efforts:<br />
• <br />
Strengthen damages <strong>and</strong> penalties to deter minimum wage <strong>and</strong> overtime violations.<br />
The current law in New York provides workers with unpaid wages plus 25 percent in additional<br />
damages, which amounts to a slap on the wrist unlikely to deter employers. New York should<br />
follow the lead <strong>of</strong> eight other states <strong>and</strong> require unpaid wages plus 200 percent <strong>of</strong> unpaid wages<br />
owed in additional damages. Other best practices include strengthening criminal penalties;<br />
strengthening the state’s tools for cracking down on employer retaliation; <strong>and</strong> requiring<br />
monitoring <strong>of</strong> violators to ensure future compliance.<br />
• Empower workers to enforce all <strong>of</strong> their workplace rights under New York law by filing<br />
claims in court. Workers need a mechanism to bring litigation to enforce their rights, many <strong>of</strong> which<br />
currently are enforceable only by the state DOL, including the right to a day <strong>of</strong> rest <strong>and</strong> meal breaks.<br />
•Create mechanisms to compensate workers who win their unpaid wage claims but<br />
are unable to collect from employers who simply refuse to pay. Workers should have a<br />
straightforward mechanism to collect their unpaid wages; for example, by filing a wage lien<br />
(available in Wisconsin) or by collecting from an insurance pool for unpaid claims (available in<br />
California). Other important strategies include business registration requirements that help<br />
workers <strong>and</strong> the state DOL track down recalcitrant employers.<br />
•Update employment laws to create a presumption <strong>of</strong> employee status for workers<br />
performing paid labor—including those hired by subcontractors or misclassified as<br />
independent contractors. The law should presume that on-site workers are employees,<br />
<strong>and</strong> should hold employers accountable for subcontractors’ violations when their contracts<br />
are financially insufficient to pay the minimum wage. 61<br />
• Prohibit unscrupulous employers from benefiting from public resources like subsidies <strong>and</strong><br />
licenses. State <strong>and</strong> city agencies that enforce prevailing wage laws have long had the authority<br />
to debar employers from future public works projects for a period <strong>of</strong> time after a violation. Other<br />
state resources, ranging from economic development subsidies to operating licenses (such as<br />
liquor <strong>and</strong> other licenses), should be protected from repeat violators as well.<br />
• Streamline the workers’ compensation system to give workers faster access to benefits.<br />
Penalize insurance companies that have high rates <strong>of</strong> denying, delaying or frivolously appealing<br />
claims. Ensure workers receive immediate access to medical care during the claims process.<br />
48
2. Strengthen New York City’s role in enforcement<br />
At first glance, New York City’s role in enforcing workplace protections might seem limited: for example,<br />
the city currently does not have the authority to set its own minimum wage st<strong>and</strong>ards. But there is<br />
much the city can <strong>and</strong> should do, both directly <strong>and</strong> indirectly, to protect its workers from exploitation.<br />
As a first step, New York City should aggressively enforce all <strong>of</strong> the labor st<strong>and</strong>ards that fall under<br />
its authority:<br />
• <br />
Vigorously enforce the city’s living wage law <strong>and</strong> applicable prevailing wage laws.<br />
New York City’s comptroller has the authority to enforce the city’s living wage law, which<br />
applies to certain city service contractors, <strong>and</strong> the state’s prevailing wage laws that apply to cityfunded<br />
projects. The city’s Department <strong>of</strong> Housing Preservation <strong>and</strong> Development also should<br />
scrutinize carefully the participants in the 421-a tax abatement program, which requires recipients<br />
to pay prevailing wages to building service workers, <strong>and</strong> deny or suspend abatements for those<br />
who fail to pay.<br />
•Criminally charge employers who commit egregious workplace violations, working<br />
closely with community groups <strong>and</strong> advocates to target enforcement. District attorneys in<br />
each <strong>of</strong> the city’s boroughs should dedicate staff to prosecute selected minimum wage, overtime<br />
<strong>and</strong> prevailing wage claims, being careful to protect workers <strong>and</strong> avoid enforcement efforts that<br />
unnecessarily shutter businesses.<br />
• Conduct audits to identify <strong>and</strong> fine abusive employment agencies. Across the city, private<br />
employment agencies knowingly send vulnerable workers to businesses that pay less than<br />
the minimum wage, charging illegal placement fees in the process. The city’s Department <strong>of</strong><br />
Consumer Affairs should continue <strong>and</strong> intensify its efforts to identify these predatory agencies,<br />
fine them <strong>and</strong> suspend their operating licenses if necessary. 62<br />
•Improve safety enforcement on scaffolding <strong>and</strong> construction sites, which have seen<br />
avoidable tragedies in recent years. The Department <strong>of</strong> Buildings <strong>and</strong> its Scaffolding<br />
Enforcement Unit not only should fortify their direct enforcement efforts, but also provide<br />
resources to community groups to conduct outreach <strong>and</strong> in-depth education seminars for<br />
immigrant workers who are most at risk. 63<br />
To supplement these direct enforcement efforts, New York City should leverage other city resources to<br />
encourage compliance with workplace laws more broadly:<br />
Dedicate city resources to support non-government enforcement efforts by community-<br />
•<br />
based organizations, worker centers <strong>and</strong> legal services providers. 64 New York City should<br />
restore its Immigrant Opportunities Initiative funding to 2008 levels ($11.25 million) <strong>and</strong> allow<br />
recipients to use these funds to represent workers who suffer workplace violations. 65 The city<br />
also should implement the recommendations <strong>of</strong> its Temporary Commission on Day <strong>Labor</strong>er<br />
Job Centers by funding community job centers for day laborers, as cities in Maryl<strong>and</strong>, Texas,<br />
California <strong>and</strong> other states currently do. Such centers provide a safe place to search for jobs<br />
<strong>and</strong> an opportunity to receive training on workers’ rights, vocational skills <strong>and</strong> English as a<br />
second language. 66<br />
49
The Solution: How New York Can Strengthen Worker Protections continued…<br />
• Launch public media campaigns to educate workers <strong>and</strong> employers alike. New York<br />
City has been a national leader in public education, using subway posters, service providers,<br />
promotional media <strong>and</strong> community outreach to publicize the Earned Income Tax Credit. This<br />
model should be used to educate low-wage workers about their employment <strong>and</strong> labor rights in<br />
communities across the city. Low-wage employers effectively can be reached through a onestop<br />
website or employment law guides, building upon the successful restaurant industry manual<br />
co-produced by the Restaurant Opportunities Center <strong>of</strong> New York <strong>and</strong> the city’s Department <strong>of</strong><br />
Health <strong>and</strong> Office <strong>of</strong> Immigrant Affairs. 67<br />
•Deny or suspend city permits <strong>and</strong> licenses to applicants with records <strong>of</strong> violating<br />
workplace protections. Denying applicants with serious records <strong>of</strong> workplace safety <strong>and</strong><br />
wage violations would send a strong signal to employers that compliance with these laws is<br />
not optional (for example, when applying for restaurant operating licenses). 68<br />
•Adopt “responsible contractor” st<strong>and</strong>ards for procurement contracts <strong>and</strong> economic<br />
development subsidies. Los Angeles has adopted such st<strong>and</strong>ards, allowing the city to<br />
downgrade applications by contractors, subcontractors <strong>and</strong> vendors with records <strong>of</strong> violating<br />
workplace protections. 69 The city also should dem<strong>and</strong> the return <strong>of</strong> subsidies if recipients fail<br />
to fulfill their hiring commitments or comply with the law.<br />
B. Update legal st<strong>and</strong>ards for the 21st century workplace<br />
Strong enforcement is important, but so are strong legal st<strong>and</strong>ards that recognize the changing<br />
organization <strong>of</strong> work in the United States. The strength <strong>of</strong> laws <strong>and</strong> the strength <strong>of</strong> their enforcement<br />
are deeply intertwined: weak employment <strong>and</strong> labor laws send the wrong signal, opening the door<br />
to low-road business strategies to cut labor costs. When the bar is set too low, employers have little<br />
or no incentive to comply. Raising the minimum wage, closing loopholes that exclude workers from<br />
key protections, ensuring that public resources are being used to create living wage jobs—all are key<br />
improvements that will raise compliance in the workplace <strong>and</strong> improve the competitive position <strong>of</strong><br />
employers who play by the rules.<br />
50<br />
1. Raise state-level st<strong>and</strong>ards<br />
New York State has a range <strong>of</strong> powerful tools available to strengthen st<strong>and</strong>ards in its workplaces.<br />
Specifically, the state should:<br />
• Strengthen the state’s minimum wage. New York’s minimum wage is just $7.25—the same<br />
as the federal minimum wage—even though the state has one <strong>of</strong> the highest costs <strong>of</strong> living in<br />
the country. More than a dozen other states have raised their minimum wages above the federal<br />
benchmark, <strong>and</strong> 10 states automatically adjust their wage level every year. New York should<br />
follow their lead <strong>and</strong> reclaim its historic status as a national model for state minimum wage policy.<br />
• Close loopholes in state law that deny workplace protections to some workers. Proposals<br />
like the Domestic Workers Bill <strong>of</strong> Rights <strong>and</strong> Farmworker Fair <strong>Labor</strong> Practices Act will close<br />
antiquated loopholes <strong>and</strong> establish basic protections on the job for these workers. 70 Regulations<br />
that provide a subminimum wage for tipped workers <strong>and</strong> a lower overtime rate for others,<br />
including home care workers, also should be phased out so that all workers are guaranteed the<br />
full minimum wage <strong>and</strong> premium pay for overtime.
• Ensure public resources are used to create good jobs. Developers that receive public<br />
financing from the state should be required to pay a living wage or the prevailing industry wage,<br />
whichever is higher, to ensure these projects create middle-class jobs. These requirements<br />
should apply not only to construction jobs, but also to the permanent jobs created by public<br />
projects, such as janitorial <strong>and</strong> retail jobs.<br />
• Empower localities to adopt higher wage st<strong>and</strong>ards. Cities around the country are using local<br />
minimum wage laws as a means <strong>of</strong> fine-tuning the right minimum wage for the local economy,<br />
<strong>and</strong> for specific sectors like building services <strong>and</strong> hotels. 71 With its high cost <strong>of</strong> living, New<br />
York City in particular would benefit from a minimum wage higher than the state level. State<br />
lawmakers should grant localities in New York the authority to establish their own local minimum<br />
wages that reflect local economic conditions.<br />
2. Raise city-level st<strong>and</strong>ards<br />
While New York City requires state authorization to enact a citywide minimum wage, it nonetheless can<br />
pursue other efforts, direct <strong>and</strong> indirect, to lift workplace st<strong>and</strong>ards. For example, the city could make a<br />
significant difference by taking these key steps to raise st<strong>and</strong>ards: 72<br />
• Raise the city’s living wage rate. New York City’s living wage law sets a wage <strong>of</strong> $10 per hour<br />
for certain city service contractors <strong>and</strong> subcontractors—including home health care, day care,<br />
food services <strong>and</strong> building services workers. But the living wage rate has not been increased<br />
since 2006, threatening to return thous<strong>and</strong>s <strong>of</strong> families to poverty. The city should raise living<br />
st<strong>and</strong>ards for the workers covered by this law, including more than 50,000 home health care<br />
attendants that provide vital care to the elderly <strong>and</strong> disabled.<br />
•Extend living wage or prevailing wage requirements, whichever is higher, to all projects<br />
subsidized or financed by the city or built on city-controlled l<strong>and</strong>. Even before such<br />
requirements are enacted, the city should use its leverage on major projects to ensure developers<br />
enter into community benefits agreements that create good jobs.<br />
• Ensure that growing industries become a source <strong>of</strong> middle-class jobs for New Yorkers. For<br />
example, the city has adopted a strategy to use zoning changes <strong>and</strong> other incentives to draw food<br />
retailers to underserved neighborhoods. Grocery stores applying for those benefits should be<br />
evaluated, in part, based on the wages, benefits <strong>and</strong> working conditions they <strong>of</strong>fer. 73<br />
In the end, restoring the promise <strong>of</strong> worker protections in New York is about more than just government<br />
enforcement. It’s about immigrant worker centers <strong>and</strong> unions having the resources <strong>and</strong> legal tools<br />
needed to organize low-wage workers <strong>and</strong> monitor workplaces for compliance with the law. It’s about<br />
legal services organizations <strong>and</strong> private attorneys helping workers to claim their rights. And it’s about<br />
responsible employers coming to the table <strong>and</strong> supporting policies to improve working conditions in<br />
their industries. Above all, the goal <strong>of</strong> fair <strong>and</strong> just workplaces must be integrated into the broader policy<br />
agenda to rebuild good jobs <strong>and</strong> economic opportunity in New York.<br />
51
A<br />
Appendix A:<br />
Data <strong>and</strong> Methods<br />
53
Appendix A: Data <strong>and</strong> Methods continued…<br />
An exhaustive, in-depth technical report describing the methods used in this study is available upon<br />
request from the authors; in this appendix we give a non-technical overview <strong>of</strong> our survey methodology.<br />
Defining the survey population<br />
Our goal in this study was to survey workers in low-wage industries in New York City. 74 More precisely,<br />
in order to be included in our study, workers had to be:<br />
a.<br />
age 18 or older, <strong>and</strong> currently working for an employer within the five boroughs <strong>of</strong> New York City;<br />
b.<br />
front-line” workers, i.e., not managers, pr<strong>of</strong>essionals or technical workers (many <strong>of</strong> these groups<br />
are exempted from key provisions <strong>of</strong> the employment <strong>and</strong> labor laws studied in this report); <strong>and</strong><br />
c.<br />
working in a low-wage industry as their primary job.<br />
To determine which industries to include in our sampling universe, we used an analysis <strong>of</strong> the 2006<br />
Current Population <strong>Survey</strong> (CPS) conducted by the Center for Economic Policy Research to identify the<br />
median hourly wage for all workers ages 18 or older who were not self-employed, which was $15.38 in<br />
New York City (in 2006 dollars). We then defined “low-wage industries” as those whose median wage<br />
for front-line workers was less than 85 percent <strong>of</strong> the city’s median wage, or $13.07 in New York City<br />
(in 2006 dollars). This 85 percent threshold is one <strong>of</strong> several commonly used measures used to identify<br />
low-wage industries or jobs. 75<br />
The sample size used in the CPS is too small to allow estimates <strong>of</strong> median wages at the detailed<br />
industry level. We therefore used 2000 Census data to generate a list <strong>of</strong> industries in New York City that<br />
fell below 85 percent <strong>of</strong> the city’s median hourly wage; the resulting industry <strong>and</strong> occupation distribution<br />
for our sample is shown in Table 2.1.<br />
Sampling methodology<br />
As described in Section 2, st<strong>and</strong>ard surveying techniques—phone interviews or Census-style door-todoor<br />
interviews—rarely are able to fully capture the population we are most interested in: low-wage<br />
workers who may be hard to identify from <strong>of</strong>ficial databases, who may be vulnerable because <strong>of</strong> their<br />
immigration status or who are reluctant to take part in a survey because they fear retaliation from their<br />
employers. Trust also is an issue when asking for details about a worker’s job, the wages they receive,<br />
whether they are paid <strong>of</strong>f the books <strong>and</strong> their personal background.<br />
In light <strong>of</strong> these difficulties, we adopted an innovative sampling method that operates through<br />
respondents’ own social networks. Low-wage workers have friends, family or co-workers they have<br />
regular contact with <strong>and</strong> rely on for support; thus our approach relied on a system in which survey<br />
respondents recruited people they already knew into the survey, a recruitment technique known as<br />
chain-referral sampling.<br />
The best known sampling method using this form <strong>of</strong> recruitment is snowball sampling, an approach that<br />
yields only convenience samples that are not representative <strong>of</strong> the target population. Snowball sampling<br />
cannot replicate the desirable properties <strong>of</strong> probability sampling methods that allow one to make<br />
inferences about the population based on sample data. This method therefore would not have fulfilled<br />
the aims <strong>of</strong> our study.<br />
54
To overcome this limitation, we adopted a newer form <strong>of</strong> chain-referral sampling developed by coauthor<br />
Douglas Heckathorn in the late 1990s. 76 This method subsequently was further developed<br />
in collaboration with other scholars. Called Respondent-Driven Sampling (RDS), it is based on a<br />
mathematical model <strong>of</strong> the social networks that connect survey respondents. Since some individuals<br />
or groups tend to have more social connections than others, they are more likely to be recruited into a<br />
survey. To make the results <strong>of</strong> an RDS-based survey representative <strong>of</strong> the whole population (<strong>and</strong> not<br />
just workers with large social networks), we weighted our data based on respondents’ social network<br />
size—that is, based on their probability <strong>of</strong> being captured by our survey technique—as well as other<br />
features <strong>of</strong> the network that can affect the sampling process.<br />
In addition, RDS features an important difference from snowball <strong>and</strong> other traditional chain-referral<br />
methods: it employs a dual-incentive structure. This approach involves remunerating respondents not<br />
only for the time they spend responding to the survey, but also for each eligible population member they<br />
recruit into the survey. To increase the breadth <strong>of</strong> the social network captured by the sample (<strong>and</strong> to<br />
prevent a cottage industry <strong>of</strong> survey recruitment), the number <strong>of</strong> recruitments that each respondent can<br />
make is limited through a coupon-based quota system.<br />
Our RDS survey began with an initial set <strong>of</strong> population members to be surveyed, which we located<br />
through our contacts in New York City. These “seeds” then were given a fixed number <strong>of</strong> uniquely<br />
numbered coupons to pass on to other eligible population members. These recruits then brought the<br />
coupons to one <strong>of</strong> several survey sites, where the number on the coupon was recorded, the recruit was<br />
surveyed <strong>and</strong> then the respondent was given a fixed number <strong>of</strong> coupons with which to recruit other<br />
workers. 77 This process was repeated over a period <strong>of</strong> several months; as recruitment progressed, the<br />
sample became increasingly diverse, eventually becoming independent <strong>of</strong> the initial sample <strong>of</strong> “seeds.”<br />
An important part <strong>of</strong> the RDS method is communicating clearly to recruiters which types <strong>of</strong> workers are<br />
eligible for the survey. We converted the list <strong>of</strong> industries being sampled into simple job titles to use as<br />
criteria for recruitment into the survey. This information was communicated to respondents with fliers in<br />
multiple languages that included drawings <strong>of</strong> the target jobs that were distributed to all recruiters along<br />
with their coupons.<br />
Respondent-driven sampling in the field<br />
Our research team searched for interview sites across New York City that were well recognized <strong>and</strong><br />
welcoming to low-wage workers. Our five sites included spaces in community colleges, churches<br />
<strong>and</strong> community-based organizations—neutral spaces that <strong>of</strong>fered privacy <strong>and</strong> anonymity to workers.<br />
Recruitment coupons served as an ID, so workers did not have to show identification at building<br />
entrances. Fielding <strong>of</strong> the survey started at the beginning <strong>of</strong> March 2008 <strong>and</strong> ended in the first week<br />
<strong>of</strong> August 2008, with a final sample size <strong>of</strong> 1,432 surveys (See Table A.1).<br />
55
Appendix A: Data <strong>and</strong> Methods continued…<br />
Table A.1: Summary <strong>of</strong> 2008 Unregulated Work <strong>Survey</strong>, New York City<br />
New York City<br />
Fielding period March—August 2008<br />
Number <strong>of</strong> interview sites 5<br />
Number <strong>of</strong> interviewers, translators <strong>and</strong> researchers on staff 22<br />
Monetary incentive for being surveyed $50<br />
Number <strong>of</strong> valid surveys completed 1,432<br />
Estimated population <strong>of</strong> front-line workers in low-wage<br />
industries in New York City (five boroughs)<br />
586,322<br />
Percentage <strong>of</strong> all front-line workers in NYC 31.0<br />
Percentage <strong>of</strong> all workers in NYC 14.2<br />
Source: Authors’ analysis <strong>of</strong> 2008 Unregulated Work <strong>Survey</strong>.<br />
Post-stratification adjustments to the data<br />
One feature <strong>of</strong> the RDS methodology is the ability to conduct detailed tracking <strong>of</strong> recruitment patterns<br />
throughout the entire sampling period, in order to identify <strong>and</strong> adjust for deviations from pure r<strong>and</strong>om<br />
recruitment from respondents’ social networks. For example, recruitment might be driven by strong<br />
social identities, such as race, ethnicity or age, so respondents recruit disproportionately within their<br />
own group.<br />
The RDS methodology anticipates that personal networks are not r<strong>and</strong>omly distributed, <strong>and</strong> therefore<br />
adjusts for small to moderate levels <strong>of</strong> network clustering (people having ties to others like them), in<br />
the form <strong>of</strong> post-sampling weights. For example, if the sample contained more members <strong>of</strong> a given<br />
group than would be expected under purely r<strong>and</strong>om sampling, then cases in that group are given less<br />
weight in analyses <strong>of</strong> the data. However, if network clustering becomes pronounced on one or more<br />
dimensions, then it is necessary to use additional, external sources <strong>of</strong> data in order to weight the final<br />
sample to be representative <strong>of</strong> the intended population.<br />
In our study, we identified high levels <strong>of</strong> non-r<strong>and</strong>om recruitment among several racial/ethnic groups,<br />
as well as between U.S.-born <strong>and</strong> foreign-born workers. (We did not find high levels <strong>of</strong> non-r<strong>and</strong>om<br />
recruitment on other dimensions, such as the workers’ industry <strong>and</strong> occupation, employer or, most<br />
importantly, the experience <strong>of</strong> workplace violations).<br />
That meant that RDS generated representative samples within the various race/ethnic/nativity groups,<br />
but not across the sampling universe as a whole—in effect, our study generated multiple sub-samples.<br />
To address this problem, we generated RDS violation rate estimates within each <strong>of</strong> the sub-samples<br />
(which are representative), <strong>and</strong> then recombined them using a weighting system based on estimates <strong>of</strong><br />
the relative sizes <strong>of</strong> the race/ethnic/nativity groups in order to generate an overall estimate.<br />
Specifically, we adjusted New York City’s sample to match the racial/ethnic <strong>and</strong> nativity distribution<br />
<strong>of</strong> the 2007 American Community <strong>Survey</strong> (ACS), with one modification. 78 Since st<strong>and</strong>ard government<br />
surveys tend to undersample unauthorized immigrants, 79 we developed an adjustment to the ACS race/<br />
ethnicity/nativity distribution drawing on estimates <strong>of</strong> the number <strong>of</strong> unauthorized workers in New York<br />
City in 2005. 80<br />
56
These adjustments, combined with the success <strong>of</strong> the RDS methodology in capturing hard-to-reach<br />
populations, are designed to ensure that our sample is representative <strong>of</strong> front-line workers in low-wage<br />
industries in New York City. Such post-stratification adjustments are st<strong>and</strong>ard in complex social surveys;<br />
all surveys are subject to sampling error, <strong>and</strong> thus are almost universally adjusted using demographic<br />
distributions generated by the Census or other large surveys. This is a mechanism to enable the<br />
extra information available in supplementary surveys (in our case the ACS) to be incorporated in the<br />
estimates, improving accuracy.<br />
In Table A.1, we summarize our estimate <strong>of</strong> the number <strong>of</strong> workers in New York City that our sample<br />
represents—more than a half-million (586,322) workers, which we estimate represent roughly 31<br />
percent <strong>of</strong> all front-line workers, <strong>and</strong> 14 percent <strong>of</strong> all workers, in the city’s five boroughs.<br />
Modeling the impact <strong>of</strong> worker <strong>and</strong> job characteristics on violation rates<br />
In Section 6, we discussed the relative weight <strong>of</strong> job/employer characteristics compared with worker<br />
characteristics in accounting for the overall variation in workplace violation rates. That discussion is<br />
based on a series <strong>of</strong> logistic regression models we used to estimate the effects <strong>of</strong> selected independent<br />
variables on minimum wage, overtime, <strong>of</strong>f-the-clock <strong>and</strong> meal break violation rates.<br />
Specifically, we considered two groups <strong>of</strong> independent variables. The job characteristics group<br />
consisted <strong>of</strong> industry, occupation, pay arrangement, company size, whether the employer was a temp<br />
agency <strong>and</strong> whether the worker belonged to a union. The worker characteristics group consisted <strong>of</strong><br />
gender, race, nativity, documentation status, education, age, job tenure <strong>and</strong> whether the worker had<br />
received vocational training.<br />
Our strategy was to estimate (a) the unique contribution <strong>of</strong> the group <strong>of</strong> job characteristics variables,<br />
above <strong>and</strong> beyond the impact <strong>of</strong> worker characteristics, <strong>and</strong> (b) the unique contribution <strong>of</strong> the group<br />
<strong>of</strong> worker characteristics variables, above <strong>and</strong> beyond the job characteristics. Both groups <strong>of</strong> variables<br />
generally were significant. 81 But the strength <strong>of</strong> their impact differed substantially. Job characteristics<br />
were 2.1 times stronger than worker characteristics in predicting minimum wage violation rates; 3.2<br />
times stronger in predicting overtime violation rates; roughly equal in terms <strong>of</strong> predicting <strong>of</strong>f-the-clock<br />
violation rates; <strong>and</strong> 3.6 times stronger in predicting meal break violation rates. 82<br />
57
Endnotes<br />
1 Bhattarai (2009).<br />
2 New York State Department <strong>of</strong> <strong>Labor</strong> (2008b) <strong>and</strong> Nelson (2009).<br />
3 Greenhouse (2008b).<br />
4 Studies specific to New York City are detailed in the next section. For<br />
examples <strong>of</strong> broader research on the problem <strong>of</strong> workplace violations,<br />
see Bernhardt et al. (2008), Bobo (2008), Fine (2006), Flaming,<br />
Haydamack <strong>and</strong> Joassart (2005), Gordon (2005), Greenhouse (2008c),<br />
Hale <strong>and</strong> Wills (2005), Hondagneu-Sotelo (2001), Levin <strong>and</strong> Ginsburg<br />
(2000), McGrath (2005), Mehta et al. (2002), Milkman (2006), Ness<br />
(2005), Southern Poverty <strong>Law</strong> Center (2009), Tucker-Welch (2004),<br />
Valenzuela et al. (2006), Weil <strong>and</strong> Pyles (2005, 2007), <strong>and</strong> Workers<br />
Defense Project (2009). At the international level, see Piore (2007) <strong>and</strong><br />
Schrank <strong>and</strong> Piore (2007).<br />
5 Bernhardt et al. (2009). Both the text <strong>and</strong> the analysis presented here<br />
draws substantially on that report.<br />
6 St<strong>and</strong>ard government surveys such as the decennial Census do not<br />
gather the detailed data one would need to accurately identify<br />
workplace violations. Enforcement agencies usually only document<br />
the relatively small number <strong>of</strong> cases that come before them, leaving<br />
a significant part <strong>of</strong> the labor market unmeasured. Exceptions are: (1)<br />
the r<strong>and</strong>om compliance surveys conducted by the U.S. Department <strong>of</strong><br />
<strong>Labor</strong> in 1999 (United States Department <strong>of</strong> <strong>Labor</strong> 2001), <strong>and</strong> (2) the<br />
misclassification <strong>of</strong> independent contractors, where state agencies have<br />
been able to use administrative data to robustly estimate the extent<br />
<strong>of</strong> misclassification (Carré <strong>and</strong> Wilson (2004), DeSilva et al. (2000) <strong>and</strong><br />
United States General Accountability Office (2006)).<br />
7 Recent surveys documenting workplace violations <strong>and</strong> other working<br />
conditions in low-wage industries in New York City include: Asian<br />
American Legal Defense <strong>and</strong> Education Fund <strong>and</strong> YKASEC (2006),<br />
Bernhardt, McGrath <strong>and</strong> DeFilippis (2007), Cordero-Guzmán, Smith<br />
<strong>and</strong> Grosfoguel (2001), Domestic Workers United <strong>and</strong> DataCenter<br />
(2006), Fiscal Policy Institute (2007a, 2007b), Hum (2003), Make<br />
the Road by Walking <strong>and</strong> Retail, Wholesale <strong>and</strong> Department Store<br />
Union (2005), New York Taxi Workers Alliance (2003), Restaurant<br />
Opportunities Center <strong>of</strong> New York <strong>and</strong> New York City Restaurant<br />
Industry Coalition (2005, 2006, 2009), Ross (2004) <strong>and</strong> Theodore,<br />
Valenzuela <strong>and</strong> Meléndez (2006).<br />
8 With the help <strong>of</strong> employment <strong>and</strong> labor law lawyers, we created an<br />
exhaustive <strong>and</strong> detailed inventory <strong>of</strong> state <strong>and</strong> federal laws relevant to<br />
a particular workplace st<strong>and</strong>ard (such as the minimum wage) in New<br />
York. We then used these legal rules to determine whether the workers<br />
in our sample experienced a given workplace violation (see Section 3<br />
for more details).<br />
9 Respondents self-identified their race/ethnicity to the interviewers,<br />
<strong>and</strong> could choose multiple races/ethnicities. All respondents who<br />
listed Latino/Latina in combination with other races/ethnicities were<br />
coded as Latino/Latina; therefore, the remaining categories are all non-<br />
Hispanic. In addition, because our sample includes only small numbers<br />
<strong>of</strong> Pacific Isl<strong>and</strong>ers, American Indians, Native Hawaiians, Alaska Natives<br />
<strong>and</strong> people <strong>of</strong> mixed race, we included these groups, along with selfidentified<br />
Asians, in the “Asian/other” category shown in the table.<br />
10 The category <strong>of</strong> authorized immigrants includes both those who are<br />
naturalized citizens <strong>and</strong> those with permanent resident status or other<br />
types <strong>of</strong> legal documentation; the category <strong>of</strong> unauthorized immigrants<br />
consists <strong>of</strong> immigrants not authorized to work in the United States.<br />
11 Using data from the 2007 American Community <strong>Survey</strong>, we compared<br />
demographic characteristics <strong>of</strong> the full New York City workforce (all<br />
workers employed in the five boroughs between the ages <strong>of</strong> 18-64 who<br />
were not self-employed) with demographics characteristics <strong>of</strong> workers<br />
in our sample (workers who fit the above criteria, but only those who<br />
worked in front-line occupations in low-wage industries).Women<br />
constituted 47 percent <strong>of</strong> the full New York City workforce, compared to<br />
57 percent <strong>of</strong> our sample. For foreign-born workers, the corresponding<br />
figures were 43 <strong>and</strong> 70 percent, respectively. For Latino workers, the<br />
corresponding figures were 23 percent <strong>and</strong> 55 percent, respectively. For<br />
non-Hispanic black workers, the corresponding figures were 21 percent<br />
<strong>and</strong> 13 percent, respectively. For non-Hispanic Asian/other workers, the<br />
corresponding figures were 14 percent <strong>and</strong> 25 percent, respectively.<br />
And for non-Hispanic white workers, the percentages were 42 percent<br />
<strong>and</strong> 8 percent, respectively.<br />
12 Not all workers are covered by U.S. employment <strong>and</strong> labor laws. But<br />
with the exception <strong>of</strong> a small number <strong>of</strong> in-home child care workers<br />
(examined separately at the end <strong>of</strong> this section), all <strong>of</strong> the workers in our<br />
sample are at least partially covered by one or more <strong>of</strong> the employment<br />
<strong>and</strong> labor laws considered in our study. Depending on the law in<br />
question, workers in certain occupations or industries may be treated<br />
differently or exempted from some protections; we have accounted for<br />
these types <strong>of</strong> provisions in calculating all violation rates in this report.<br />
For more details, see the Unregulated Work <strong>Survey</strong> Technical Report<br />
(available upon request from the authors).<br />
13 All <strong>of</strong> the violation rates reported in this section are statistically<br />
significant, meaning they are significantly different from zero. In the RDS<br />
method, the level <strong>of</strong> significance is determined using a special form <strong>of</strong><br />
bootstrapping process (see Heckathorn (2002) <strong>and</strong> Salganik (2006)).<br />
14 If workers worked more than 40 hours in the previous week, we asked<br />
how much they were paid for those hours. If the stated amount was less<br />
than time <strong>and</strong> a half their regular wage, they were counted as having an<br />
overtime violation. For more details on the laws governing overtime, see<br />
the Unregulated Work <strong>Survey</strong> Technical Report (available upon request<br />
from the authors).<br />
15 Courts have differed on whether the state’s daily overtime requirement<br />
phases out for workers who make more than the minimum wage. In this<br />
study, we have adopted the more generous reading <strong>of</strong> the law, from the<br />
st<strong>and</strong>point <strong>of</strong> low-wage workers. For more details on the ambiguity –<br />
<strong>and</strong> new guidance forthcoming from the Department <strong>of</strong> <strong>Labor</strong> – see the<br />
Unregulated Work <strong>Survey</strong> Technical Report (available upon request from<br />
the authors).<br />
16 In order to avoid double-counting violations, this violation rate does not<br />
include workers who worked more than 40 hours in a week—these are<br />
counted in the 40-hour overtime violation measure.<br />
17 Off-the-clock work can be defined more broadly than how we have<br />
defined it here, <strong>and</strong> can happen during the middle <strong>of</strong> a workday when<br />
workers are instructed to “punch out” but continue to work. Our survey<br />
only captures <strong>of</strong>f-the-clock work that occurred before or after a shift.<br />
18 For more detail regarding New York state laws, see the Unregulated<br />
Work <strong>Survey</strong> Technical Report (available upon request from the authors).<br />
19 For more details about deductions, see the Unregulated Work <strong>Survey</strong><br />
Technical Report (available upon request from the authors).<br />
20 New York’s base wage differs depending on the amount <strong>of</strong> tips earned<br />
<strong>and</strong> the industry <strong>and</strong> occupation <strong>of</strong> the worker. In addition, the law<br />
requires that a worker must earn at least the full minimum wage after<br />
their tips are included.<br />
21 Tipped workers in New York can have two types <strong>of</strong> minimum wage<br />
violations. First, if their base pay <strong>and</strong> tips added together do not equal<br />
the minimum wage, they have a st<strong>and</strong>ard minimum wage violation.<br />
Second, if their employer does not pay the tipped worker base minimum<br />
wage, they have a tipped minimum wage violation.<br />
58
22 These protections stem from a mix <strong>of</strong> federal <strong>and</strong> state laws; see the<br />
Unregulated Work <strong>Survey</strong> Technical Report (available upon request from<br />
the authors).<br />
23 Legal protections vary depending on the subject <strong>of</strong> a worker’s complaint<br />
<strong>and</strong> whether they complained alone or with co-workers. For more<br />
details about retaliation law <strong>and</strong> our measures, see the Unregulated<br />
Work <strong>Survey</strong> Technical Report (available upon request from the authors).<br />
24 Workers could report more than one type <strong>of</strong> retaliation.<br />
25 A serious injury was defined as one that needed medical attention,<br />
whether or not the worker actually received such attention.<br />
26 For more information on workers’ compensation law, see the<br />
Unregulated Work <strong>Survey</strong> Technical Report (available upon request from<br />
the authors).<br />
27 We account for industry- <strong>and</strong> occupation-specific exemptions in<br />
calculating all violation rates in this report. For more details on<br />
exemptions, see the Unregulated Work <strong>Survey</strong> Technical Report<br />
(available upon request from the authors).<br />
28 For more information on independent contractors <strong>and</strong> misclassification,<br />
see Carré et al. (2000), National <strong>Employment</strong> <strong>Law</strong> Project (2009) <strong>and</strong><br />
Ruckelshaus <strong>and</strong> Goldstein (2002).<br />
29 This measure includes the following violations: minimum wage, tipped<br />
minimum wage, overtime, <strong>of</strong>f the clock, being paid in tips only <strong>and</strong><br />
illegal deductions.<br />
30 When interpreting estimates in the tables <strong>and</strong> graphs in this section,<br />
the reader should refer to the text for guidance regarding which<br />
differences are statistically significant. In particular, the reader should<br />
be aware that differences <strong>of</strong> a few percentage points are very likely not<br />
statistically significant, <strong>and</strong> instead may result from stochastic variation<br />
in the sampling process. In the RDS method, the level <strong>of</strong> significance<br />
is determined using a special form <strong>of</strong> bootstrapping process (see<br />
Heckathorn (2002) <strong>and</strong> Salganik (2006)). As is customary, we interpret<br />
differences in violation rates between two or more groups or categories<br />
as statistically significant when p ≤ 0.05. In such cases, the estimates’<br />
95 percent confidence intervals fail to overlap, a procedure that is<br />
equivalent to a Student’s t-test.<br />
31 See Bernhardt, McGrath <strong>and</strong> DeFilippis (2007).<br />
32 See Bernhardt, McGrath <strong>and</strong> DeFilippis (2007), p.61.<br />
33 Construction workers who worked at commercial sites did not qualify<br />
for our survey. Because <strong>of</strong> high union density in New York City’s<br />
commercial construction industry, the median wage for these workers<br />
was above the threshold we used for identifying low-wage industries<br />
<strong>and</strong> occupations.<br />
34 See Theodore, Valenzuela <strong>and</strong> Melendez (2006).<br />
35 See Bernhardt, McGrath <strong>and</strong> DeFilippis (2007), Hondagneu-Sotelo<br />
(2001), New York Jobs with Justice <strong>and</strong> Queens College <strong>Labor</strong> Resource<br />
Center (2005) <strong>and</strong> Valenzuela et al. (2006).<br />
36 The cash category also includes those paid by personal check <strong>and</strong> those<br />
paid in both cash <strong>and</strong> by check. The company check category also<br />
includes those paid by direct deposit. Both categories contain small<br />
numbers <strong>of</strong> workers who reported being paid by other methods.<br />
37 The analysis here was done for weekly overtime violations only (<strong>and</strong><br />
does not include daily overtime).<br />
38 For example, see the detailed industry pr<strong>of</strong>iles in Bernhardt, McGrath<br />
<strong>and</strong> DeFilippis (2007).<br />
39 Some industry <strong>and</strong> occupation categories were aggregated to yield<br />
sufficient sample sizes when calculating overtime rates (because not all<br />
workers are at risk for an overtime violation).<br />
40 This difference is not explained entirely by the pay types used by these<br />
firms. Although small firms are more likely to pay non-hourly, pay type<br />
explains only part <strong>of</strong> the discrepancy between the violation rates <strong>of</strong><br />
small <strong>and</strong> large firms.<br />
41 Some industry <strong>and</strong> occupation categories were aggregated to yield<br />
sufficient sample sizes when calculating <strong>of</strong>f-the-clock violation rates<br />
(because not all workers are at risk for an <strong>of</strong>f-the-clock violation).<br />
42 See Appelbaum <strong>and</strong> Batt (1994), Appelbaum, Bernhardt <strong>and</strong> Murnane<br />
(2003), Beynon et al. (2002) <strong>and</strong> Kochan, Katz <strong>and</strong> McKersie (1994).<br />
43 The correlations <strong>of</strong> these practices with other workplace violations were<br />
weaker. Offering paid sick <strong>and</strong> vacation days was associated with fewer<br />
overtime violations. Offering health insurance was associated with<br />
fewer <strong>of</strong>f-the-clock violations. For meal break violations, these employer<br />
practices <strong>of</strong>fered no significant protection.<br />
44 Appelbaum <strong>and</strong> Batt (1994) <strong>and</strong> Kochan <strong>and</strong> Osterman (1994).<br />
45 When interpreting estimates in the tables <strong>and</strong> graphs in this section,<br />
the reader should refer to the text for guidance regarding which<br />
differences are statistically significant. In particular, the reader should<br />
be aware that differences <strong>of</strong> a few percentage points very likely are<br />
not significant, <strong>and</strong> instead may result from stochastic variation in<br />
the sampling process. In the RDS method, the level <strong>of</strong> significance<br />
is determined using a special form <strong>of</strong> bootstrapping process (see<br />
Heckathorn (2002) <strong>and</strong> Salganik (2006)). As is customary, we interpret<br />
differences in violation rates between two or more groups or categories<br />
as statistically significant when p ≤ 0.05. In such cases, the estimates’<br />
95 percent confidence intervals fail to overlap, a procedure that is<br />
equivalent to a Student’s t-test.<br />
46 Minimum wage violation rates were higher for women than for men,<br />
but the difference was not statistically significant.<br />
47 The lack <strong>of</strong> an age effect may be partly because workers who do<br />
advance in the labor market as they get older leave our sampling<br />
universe, which only includes low-wage jobs. However, in other parts<br />
<strong>of</strong> the labor market, age is <strong>of</strong>ten a good predictor <strong>of</strong> better outcomes,<br />
even for workers who remain in front-line occupations for their entire<br />
careers.<br />
48 In our survey, 54 percent <strong>of</strong> workers had at least one pay-based<br />
violation in the previous workweek. We applied this percentage to the<br />
total number <strong>of</strong> front-line workers in low-wage industries in New York<br />
City, i.e., 586,322 (see Table A.1 in Appendix A).<br />
49 For in-depth analyses <strong>of</strong> public enforcement, see Wial (1999), Weil<br />
(2005, 2007) <strong>and</strong> Weil <strong>and</strong> Pyles (2005, 2007).<br />
50 Bernhardt et al. (2009), pp. 51–54.<br />
51 Pieces <strong>of</strong> this section are adapted from Bernhardt et al. (2009). It also<br />
draws on Ruckelshaus (2008); National <strong>Employment</strong> <strong>Law</strong> Project (2008);<br />
National <strong>Employment</strong> <strong>Law</strong> Project, New York Jobs with Justice <strong>and</strong> Pratt<br />
Center for Community Development (2009); <strong>and</strong> Campaign to End<br />
Wage Theft (2006).<br />
52 See, for example, Greenhouse (2008a); Ludden (2009). See also New<br />
York State Department <strong>of</strong> <strong>Labor</strong> (2009b; 2009c; 2008a; 2008b).<br />
53 New York State Department <strong>of</strong> <strong>Labor</strong> (2007).<br />
54 New York State Department <strong>of</strong> <strong>Labor</strong> (2009a).<br />
55 New York State Department <strong>of</strong> <strong>Labor</strong> (2008c).<br />
56 New York State Department <strong>of</strong> <strong>Labor</strong> (2009d); e-mail from the New<br />
York State Department <strong>of</strong> <strong>Labor</strong> to the National <strong>Employment</strong> <strong>Law</strong><br />
Project, in response to the National <strong>Employment</strong> <strong>Law</strong> Project’s Freedom<br />
<strong>of</strong> Information Act request, received January 5, 2010 (on file with the<br />
National <strong>Employment</strong> <strong>Law</strong> Project).<br />
59
Endnotes continued…<br />
57 E-mail from the New York State Department <strong>of</strong> <strong>Labor</strong> to the National<br />
<strong>Employment</strong> <strong>Law</strong> Project, in response to the National <strong>Employment</strong> <strong>Law</strong><br />
Project’s Freedom <strong>of</strong> Information Act request, received January 4, 2010<br />
(on file with the National <strong>Employment</strong> <strong>Law</strong> Project).<br />
58 See Br<strong>and</strong> (2007).<br />
59 Letter from the New York State Office <strong>of</strong> the Attorney General to<br />
the National <strong>Employment</strong> <strong>Law</strong> Project, in response to the National<br />
<strong>Employment</strong> <strong>Law</strong> Project’s Freedom <strong>of</strong> Information Act request, received<br />
December 30, 2009 (on file with the National <strong>Employment</strong> <strong>Law</strong> Project).<br />
60 See Stonington (2009).<br />
61 See National <strong>Employment</strong> <strong>Law</strong> Project (2009).<br />
62 See, for example, Barnard (2008).<br />
63 The New York Immigration Coalition (2008) <strong>and</strong> Chan (2006).<br />
64 For in-depth analyses <strong>of</strong> immigrant worker centers, see Fine (2006),<br />
Gordon (2005), Jayaraman <strong>and</strong> Ness (2005), Martin, Morales <strong>and</strong><br />
Theodore (2007), Ness (2005), Narro (2005, 2009) <strong>and</strong> Theodore,<br />
Valenzuela <strong>and</strong> Meléndez (2009).<br />
65 New York Nonpr<strong>of</strong>it Press (2009).<br />
76 Heckathorn (1997, 2007).<br />
77 The number <strong>of</strong> coupons given to respondents varied over the course <strong>of</strong><br />
the survey; on average, respondents recruited two other workers into<br />
the sample.<br />
78 These adjustments were made within major occupation groups, in order<br />
to ensure a high level <strong>of</strong> accuracy in the weighting.<br />
79 For example, see Hoefer, Rytina <strong>and</strong> Baker (2008), who estimate an<br />
unauthorized immigrant undercount rate <strong>of</strong> 10 percent.<br />
80 Data on the number <strong>and</strong> characteristics <strong>of</strong> unauthorized immigrants<br />
were generously provided by Jeffrey Passel <strong>of</strong> the Pew Center for<br />
Hispanic Research.<br />
81 The one exception is that worker characteristics as a group were not<br />
significant in predicting overtime violations.<br />
82 We measured the significance <strong>and</strong> the size <strong>of</strong> the effect <strong>of</strong> each group<br />
<strong>of</strong> variables by recording the change in the deviance statistic (-2 log<br />
likelihood measure) when a group <strong>of</strong> variables was added into the<br />
models. We assessed significance at the .05 level using a chi-square test.<br />
We assessed the relative strength <strong>of</strong> the effects <strong>of</strong> the two groups <strong>of</strong><br />
variables by forming the ratio <strong>of</strong> the change in deviance. Full results are<br />
available upon request from the authors.<br />
66 Temporary Commission on Day <strong>Labor</strong>er Job Centers (2009). See also<br />
National Day <strong>Labor</strong>er Organizing Network (2007).<br />
67 Restaurant Opportunities Center <strong>of</strong> New York <strong>and</strong> New York City<br />
Mayor’s Office <strong>of</strong> Immigrant Affairs (2006).<br />
68 See New York City Council (2008).<br />
69 Sonn <strong>and</strong> Gebreselassie (2009).<br />
70 The Domestic Workers Bill <strong>of</strong> Rights was passed in the New York<br />
Assembly (N.Y. A. 1470-A), <strong>and</strong> a more comprehensive version that<br />
also includes benefits has been introduced in the New York Senate<br />
(S. 2311A). The Farmworker Fair <strong>Labor</strong> Practices Act also has been<br />
passed by the New York Assembly (N.Y. A. 1867), but has not received<br />
a vote in the state Senate.<br />
71 See Sonn (2006).<br />
72 This list includes a few <strong>of</strong> the most directly relevant examples <strong>of</strong> what<br />
the city can do. For a comprehensive listing, see National <strong>Employment</strong><br />
<strong>Law</strong> Project, New York Jobs with Justice <strong>and</strong> Pratt Center for<br />
Community Development (2009).<br />
73 See Sonn (2009) <strong>and</strong> Bernhardt, L<strong>and</strong>er <strong>and</strong> Brunk (2009).<br />
74 We wrestled with the question <strong>of</strong> whether to include such independent<br />
contractors as taxi drivers <strong>and</strong> street vendors in our survey. In the end,<br />
we decided to constrain the sample to include employees only; opening<br />
the sampling frame to any type <strong>of</strong> independent contractor would have<br />
made it almost impossible to construct a manageable questionnaire<br />
(that is, one that would work both for employees with wage income<br />
as well as independent contractors, whom we would need to ask<br />
detailed questions about business income <strong>and</strong> costs). However, we hope<br />
future surveys will focus on low-wage independent contractors, such<br />
as taxi drivers, who are effectively in an employment relationship <strong>and</strong><br />
whose working conditions are very similar to the population <strong>of</strong> workers<br />
we surveyed here.<br />
75 The Organisation for Economic Co-operation <strong>and</strong> Development has<br />
used both the measure <strong>of</strong> 85 percent <strong>of</strong> the median wage (Organisation<br />
for Economic Co-operation <strong>and</strong> Development 1994) <strong>and</strong> the measure<br />
<strong>of</strong> two-thirds <strong>of</strong> the median wage (Organisation for Economic Cooperation<br />
<strong>and</strong> Development 1996); see also Freeman <strong>and</strong> Schettkat<br />
(2000), who use two-thirds <strong>of</strong> the mean wage.<br />
60
References<br />
Appelbaum, Eileen, Annette Bernhardt <strong>and</strong> Richard Murnane, eds. 2003.<br />
Low-Wage America: How Employers Are Reshaping Opportunity in the<br />
Workplace. New York: Russell Sage Foundation.<br />
Appelbaum, Eileen <strong>and</strong> Rosemary Batt. 1994. The New American Workplace:<br />
Transforming Work Systems in the United States. Ithaca, NY: Cornell<br />
University Press.<br />
Asian American Legal Defense <strong>and</strong> Education Fund <strong>and</strong> YKASEC. 2006.<br />
“Forgotten Workers”: A Study <strong>of</strong> Low-Wage Korean Immigrant Workers in<br />
the Metropolitan New York Area. New York: AALDEF <strong>and</strong> YKASEC. Found at:<br />
http://www.aaldef.org/docs/KWP_2006Worker<strong>Survey</strong>_analysis.pdf.<br />
Barnard, Anne. 2008. “Inquiry Finds Wrongdoing at <strong>Employment</strong> Agencies.”<br />
The New York Times, November 12, 2008, New York Region section. Found<br />
at: http://www.nytimes.com/2008/11/13/nyregion/13agencies.html?_<br />
r=1&ref=nyregion.<br />
Bernhardt, Annette, Heather Boushey, Laura Dresser <strong>and</strong> Chris Tilly, eds.<br />
2008. The Gloves-<strong>of</strong>f Economy: Workplace St<strong>and</strong>ards at the Bottom <strong>of</strong><br />
America’s <strong>Labor</strong> Market. Ithaca, NY: Cornell University Press.<br />
Bernhardt, Annette, Brad L<strong>and</strong>er <strong>and</strong> Carrie Brunk. 2009. “Recovery with a<br />
New Vision for Economic Development.” In From Disaster to Diversity: What’s<br />
Next for New York City’s Economy?, edited by J. Hicks <strong>and</strong> D. Morris, 40–52.<br />
New York, NY: Drum Major Institute.<br />
Bernhardt, Annette, Siobhán McGrath <strong>and</strong> James DeFilippis. 2007.<br />
Unregulated Work in the Global City: <strong>Employment</strong> <strong>and</strong> <strong>Labor</strong> <strong>Law</strong> Violations<br />
in New York City. New York: Brennan Center for Justice at New York<br />
University School <strong>of</strong> <strong>Law</strong>.<br />
Bernhardt, Annette, Ruth Milkman, Nik Theodore, Douglas Heckathorn,<br />
Mirabai Auer, James DeFilippis, Ana Luz Gonzalez, Victor Narro, Jason<br />
Perelshteyn, Diana Polson <strong>and</strong> Michael Spiller. 2009. Broken <strong><strong>Law</strong>s</strong>,<br />
Unprotected Workers: Violations <strong>of</strong> <strong>Employment</strong> <strong>and</strong> <strong>Labor</strong> <strong><strong>Law</strong>s</strong> in America’s<br />
Cities. New York, NY: Center for Urban Economic Development at UIC,<br />
National <strong>Employment</strong> <strong>Law</strong> Project <strong>and</strong> UCLA Institute for Research on <strong>Labor</strong><br />
<strong>and</strong> <strong>Employment</strong>.<br />
Beynon, Hue, Damian Grimshaw, Jill Rubery <strong>and</strong> Kevin Ward. 2002.<br />
Managing <strong>Employment</strong> Change: The New Realities <strong>of</strong> Work. Oxford: Oxford<br />
University Press.<br />
Bhattarai, Abha. 2009. “Grocery Chain to Pay Back Wages to 550 Workers.”<br />
The New York Times, February 26, 2009, New York Region section. Found<br />
at: http://cityroom.blogs.nytimes.com/2009/02/26/grocer-chain-to-pay-backwages-to-550-workers/.<br />
Bobo, Kim. 2008. Wage Theft in America: Why Millions <strong>of</strong> <strong>Working</strong><br />
Americans Are Not Getting Paid—And What We Can Do About It. New York:<br />
The New Press.<br />
Br<strong>and</strong>, Jennifer. 2007. “Adding <strong>Labor</strong> to the Docket: The Role <strong>of</strong> State<br />
Attorneys General in the Enforcement <strong>of</strong> <strong>Labor</strong> <strong><strong>Law</strong>s</strong>.” Columbia <strong>Law</strong><br />
School, February 2007. Found at: http://www.law.columbia.edu/<br />
null?&exclusive=filemgr.download&file_id=1399&rtcontentdisposition=filena<br />
me%3DBr<strong>and</strong>_<strong>Labor</strong>%20Article.pdf.<br />
Campaign to End Wage Theft. 2006. Protecting New York’s Workers: How<br />
the State Department <strong>of</strong> <strong>Labor</strong> Can Improve Wage-<strong>and</strong>-Hour Enforcement.<br />
New York, NY: National <strong>Employment</strong> <strong>Law</strong> Project.<br />
Carré, Francoise, Marianne A. Ferber, Lonnie Golden <strong>and</strong> Stephen A.<br />
Herzenberg, eds. 2000. Nonst<strong>and</strong>ard Work: The Nature <strong>and</strong> Challenges<br />
<strong>of</strong> Changing <strong>Employment</strong> Arrangements. Champaign: Industrial Relations<br />
Research Association.<br />
Carré, Francoise <strong>and</strong> R<strong>and</strong>all Wilson. 2004. The Social <strong>and</strong> Economic Costs<br />
<strong>of</strong> Employee Misclassification in Construction. Boston: Construction Policy<br />
Research Center, Harvard <strong>Law</strong> School <strong>Labor</strong> <strong>and</strong> Worklife Program <strong>and</strong><br />
Harvard School <strong>of</strong> Public Health.<br />
Chan, Sewell. 2006. “Fatal Construction Accidents in the City Rise Sharply<br />
Over 12 Months.” The New York Times, November 22, 2006, New<br />
York Region section. Found at: http://www.nytimes.com/2006/11/22/<br />
nyregion/22construct.html.<br />
Cordero-Guzmán, Hector R., Robert C. Smith <strong>and</strong> Ramon Grosfoguel, eds.<br />
2001. Migration, Transnationalization, <strong>and</strong> Race in a Changing New York.<br />
Philadelphia: Temple University Press.<br />
DeSilva, Lalith, Adrian Millett, Dominic Rotondi <strong>and</strong> William Sullivan. 2000.<br />
Independent Contractors: Prevalence <strong>and</strong> Implications for Unemployment<br />
Insurance Programs. Report prepared for the United States Department<br />
<strong>of</strong> <strong>Labor</strong>. Rockville, MD: Planmatics. Found at: http://wdr.doleta.gov/<br />
owsdrr/00-5/00-5.pdf.<br />
Domestic Workers United <strong>and</strong> DataCenter. 2006. Home Is Where The Work<br />
Is: Inside New York’s Domestic Work Industry. New York: Domestic Workers<br />
United <strong>and</strong> DataCenter.<br />
Fine, Janice. 2006. Workers Center: Organizing Communities at the Edge <strong>of</strong><br />
the Dream. Ithaca, NY: Cornell University Press.<br />
Fiscal Policy Institute. 2007a. New York State Workers’ Compensation: How<br />
Big Is the Coverage Shortfall? New York: Fiscal Policy Institute.<br />
---. 2007b. The Underground Economy in the New York City Affordable<br />
Housing Construction Industry: Its Fiscal <strong>and</strong> Economic Costs. New York:<br />
Fiscal Policy Institute.<br />
Flaming, Daniel, Brent Haydamack <strong>and</strong> Pascale Joassart. 2005. Hopeful<br />
Workers, Marginal Jobs: LA’s Off-The-Books <strong>Labor</strong> Force. Los Angeles:<br />
Economic Roundtable. Found at: http://www.economicrt.org/summaries/<br />
hopeful_workers_marginal_jobs_synopsis.html.<br />
Freeman, Richard B. <strong>and</strong> Ronald Schettkat. 2000. “Low Wage Services:<br />
Interpreting the US-German Difference.” National Bureau <strong>of</strong> Economic<br />
Research <strong>Working</strong> Paper No. 7611, 2000. Found at: http://www.nber.org/<br />
papers/w7611.<br />
Gordon, Jennifer. 2005. Suburban Sweatshops: The Fight for Immigrant<br />
Rights. Cambridge, MA: The Belknap Press <strong>of</strong> Harvard University Press.<br />
Greenhouse, Steven. 2008a. “Carwashes Violating Wage <strong><strong>Law</strong>s</strong>, State Finds.”<br />
The New York Times, August 15, 2008, New York Region section. Found at:<br />
http://www.nytimes.com/2008/08/16/nyregion/16carwash.html.<br />
---. 2008b. “For $2-an-Hour Restaurant Deliverymen, a $4.6 Million<br />
Judgment.” The New York Times, October 21, 2008, New York Region<br />
section. Found at: http://www.nytimes.com/2008/10/22/nyregion/22saigon.<br />
html?_r=1.<br />
---. 2008c. The Big Squeeze: Tough Times for the American Worker. New<br />
York: Alfred A. Knopf.<br />
Hale, Angela <strong>and</strong> Jane Wills, eds. 2005. Threads <strong>of</strong> Labour: Garment Industry<br />
Supply Chains from the Workers’ Perspective. London: Blackwell.<br />
Heckathorn, Douglas D. 1997. “Respondent-Driven Sampling: A New<br />
Approach to the Study <strong>of</strong> Hidden Populations.” Social Problems<br />
44(2):174–199.<br />
---. 2002. “Respondent-Driven Sampling II: Deriving Valid Population<br />
Estimates from Chain-Referral Samples <strong>of</strong> Hidden Populations.” Social<br />
Problems 49(1):11–34.<br />
61
References continued…<br />
---. 2007. “Extensions <strong>of</strong> Respondent-Driven Sampling: Analyzing Continuous<br />
Variables <strong>and</strong> Controlling for Differential Recruitment,” Sociological<br />
Methodology 37(1):151–207.<br />
Hondagneu-Sotelo, Pierrette. 2001. Doméstica: Immigrant Workers Cleaning<br />
<strong>and</strong> Caring in the Shadows <strong>of</strong> Affluence. Berkeley <strong>and</strong> Los Angeles: University<br />
<strong>of</strong> California Press.<br />
Hoefer, Michael, Nancy Rytina <strong>and</strong> Bryan Baker. 2008. “Estimates <strong>of</strong> the<br />
Unauthorized Immigrant Population Residing in the United States: January<br />
2007.” Office <strong>of</strong> Immigration Statistics, Policy Directorate, U.S. Department <strong>of</strong><br />
Homel<strong>and</strong> Security. Found at: http://www.dhs.gov/xlibrary/assets/statistics/<br />
publications/ois_ill_pe_2007.pdf.<br />
Hum, Tarry. 2003. “Mapping Global Production in New York City’s Garment<br />
Industry: The Role <strong>of</strong> Sunset Park, Brooklyn’s Immigrant Economy.” Economic<br />
Development Quarterly 17(3):294–309.<br />
Jayaraman, Sarumathi <strong>and</strong> Immanuel Ness, eds. 2005. The New Immigrant<br />
Workforce: Innovative Models for <strong>Labor</strong> Organizing. Armonk, NY: M.E.<br />
Sharpe.<br />
Kochan, Thomas, Harry Katz <strong>and</strong> Robert McKersie. 1994. The Transformation<br />
<strong>of</strong> American Industrial Relations. Ithaca, NY: Cornell University Press.<br />
Kochan, Thomas <strong>and</strong> Paul Osterman. 1994. The Mutual Gains Enterprise:<br />
Forging a Winning Partnership Among <strong>Labor</strong>, Management, <strong>and</strong><br />
Government. Boston: Harvard Business School Press.<br />
Levin, Rebekah <strong>and</strong> Robert Ginsburg. 2000. Sweatshops in Chicago: A <strong>Survey</strong><br />
<strong>of</strong> <strong>Working</strong> Conditions in Low-Income <strong>and</strong> Immigrant Communities. Chicago:<br />
Center for Impact Research Sweatshop <strong>Working</strong> Group.<br />
Ludden, Jennifer. 2009. “New York Tackles Wage Theft Against Immigrants.”<br />
National Public Radio’s “All Things Considered,” May 19, 2009. Found at:<br />
http://www.npr.org/templates/story/story.php?storyId=104087809.<br />
Make the Road by Walking <strong>and</strong> Retail, Wholesale <strong>and</strong> Department Store<br />
Union. 2005. Street <strong>of</strong> Shame: Retail Stores on Knickerbocker Avenue. New<br />
York: Department Store Union (RWDSU/UFCW) <strong>and</strong> Make the Road by<br />
Walking.<br />
Martin, Nina, S<strong>and</strong>ra Morales <strong>and</strong> Nik Theodore. 2007. “Migrant Worker<br />
Centers: Contending with Downgrading in Low-Wage <strong>Labor</strong> Markets.”<br />
GeoJournal 68:155–165.<br />
McGrath, Siobhán. 2005. A <strong>Survey</strong> <strong>of</strong> Literature Estimating the Prevalence <strong>of</strong><br />
<strong>Employment</strong> <strong>and</strong> <strong>Labor</strong> <strong>Law</strong> Violations in the U.S. New York: Brennan Center<br />
for Justice at New York University School <strong>of</strong> <strong>Law</strong>. Found at: http://nelp.3cdn.<br />
net/1ef1df52e6d5b7cf33_s8m6br9zf.pdf.<br />
Mehta, Chirag, Nik Theodore, Iliana Mora <strong>and</strong> Jennifer Wade. 2002.<br />
Chicago’s Undocumented Immigrants: An Analysis <strong>of</strong> Wages, <strong>Working</strong><br />
Conditions, <strong>and</strong> Economic Contributions. Chicago: Center for Urban<br />
Economic Development, University <strong>of</strong> Illinois at Chicago.<br />
Milkman, Ruth. 2006. L.A. Story: Immigrant Workers <strong>and</strong> the Future <strong>of</strong> the<br />
U.S. <strong>Labor</strong> Movement. New York: Russell Sage Foundation.<br />
National Day <strong>Labor</strong> Organizing Network. 2007. “Building Community: An<br />
Integral Approach to Day <strong>Labor</strong>er Related Concerns.” Paper presented at the<br />
Mayors Innovation Project, Annual Meeting, Los Angeles, June 2007. Found<br />
at: http://www.mayorsinnovation.org/pdf/PabloAlvarado.pdf.<br />
National <strong>Employment</strong> <strong>Law</strong> Project. 2008. Rebuilding a Good Jobs Economy:<br />
A Blueprint for Recovery <strong>and</strong> Reform. New York: National <strong>Employment</strong> <strong>Law</strong><br />
Project.<br />
---. 2009. Summary <strong>of</strong> Independent Contractor Reforms. July 2009. New<br />
York: National <strong>Employment</strong> <strong>Law</strong> Project. Found at: http://www.nelp.org/<br />
page/-/Justice/SummaryIndependentContractorReformsJuly2009.pdf.<br />
National <strong>Employment</strong> <strong>Law</strong> Project, New York Jobs with Justice <strong>and</strong> Pratt<br />
Center for Community Development. 2009. One City, One Future: A Blueprint<br />
for Growth That Works for All New Yorkers. New York: National <strong>Employment</strong><br />
<strong>Law</strong> Project, New York Jobs with Justice <strong>and</strong> Pratt Center for Community<br />
Development. Found at: http://www.onecityonefuture.org.<br />
Narro, Victor. 2005. “Impacting Next Wave Organizing: Creative Campaign<br />
Strategies <strong>of</strong> the Los Angeles Worker Centers.” New York School <strong>Law</strong> Review<br />
50(2):465–513.<br />
---. 2009. “¡Sí Se Puede! Immigrant Workers <strong>and</strong> the Transformation <strong>of</strong> the<br />
Los Angeles <strong>Labor</strong> <strong>and</strong> Worker Center Movements.” Los Angeles Public<br />
Interest <strong>Law</strong> Journal 1:65–106.<br />
Nelson, Libby. 2009. “Car Wash Chain to Pay $3.4 Million in Back Wages.”<br />
The New York Times, June 30, 2009, City Room blog. Found at: http://<br />
cityroom.blogs.nytimes.com/2009/06/30/car-wash-chain-will-pay-34-millionin-back-wages/.<br />
Ness, Immanuel. 2005. Immigrants, Unions, <strong>and</strong> the New U.S. <strong>Labor</strong> Market.<br />
Philadelphia: Temple University Press.<br />
New York City Council. 2008. “Responsible Restaurant Act.” N.Y.C.<br />
Intro 569-A. Found at: http://legistar.council.nyc.gov/LegislationDetail.<br />
aspx?ID=451330&GUID=A90C8C12-5590-49C0-8672-FC97812EA690&Opti<br />
ons=ID|Text|&Search=569].<br />
The New York Immigration Coalition. 2008. “Testimony to the New York City<br />
Council on Construction Safety.” March 31, 2008. Found at: http://www.<br />
thenyic.org/templates/documentFinder.asp?did=918.<br />
New York Jobs with Justice <strong>and</strong> Queens College <strong>Labor</strong> Resource Center.<br />
2005. Is Your Gourmet Grocer a Sweatshop? A Report on <strong>Working</strong><br />
Conditions at Upscale Groceries in New York City. New York: New York Jobs<br />
with Justice <strong>and</strong> Queens College <strong>Labor</strong> Resource Center. Found at: http://<br />
www.brennancenter.org/content/resource/is_your_gourmet_grocer_a_<br />
sweatshop_a_report_on_working_conditions_at_upscal/.<br />
New York Nonpr<strong>of</strong>it Press. 2009. “Funding Restorations Urged for ESOL <strong>and</strong><br />
Adult Literacy.” June 9, 2009. Found at: http://www.nynp.biz/index.php/<br />
breaking-news/992-funding-restorations-urged-for-esol-<strong>and</strong>-adult-literacy.<br />
New York State Department <strong>of</strong> <strong>Labor</strong>. 2007. “NYS Department <strong>of</strong> <strong>Labor</strong><br />
Announces New Bureau <strong>of</strong> Immigrant Workers’ Rights.” New York State<br />
Department <strong>of</strong> <strong>Labor</strong>, May 3, 2007. Found at: http://www.labor.state.ny.us/<br />
pressreleases/2007/May03_2007.htm.<br />
---. 2008a. “Department <strong>of</strong> <strong>Labor</strong> Finds Extensive Underpayment <strong>of</strong> Wages<br />
to Workers at Saratoga Race Course.” New York State Department <strong>of</strong> <strong>Labor</strong>,<br />
August 27, 2008. Found at: http://www.labor.state.ny.us/pressreleases/2008/<br />
August27_2008.htm.<br />
---. 2008b. “<strong>Labor</strong> Department Investigation <strong>of</strong> New York’s Car Wash<br />
Industry Uncovers Nearly $6.6 Million In Unpaid Wages.” New York State<br />
Department <strong>of</strong> <strong>Labor</strong>, August 15, 2008. Found at: http://www.labor.state.<br />
ny.us/pressreleases/2008/August15_2008.htm.<br />
---. 2008c. “State Finds Millions in Unreported Wages <strong>and</strong> Underpayments<br />
to Workers Due to Illegal <strong>Labor</strong> Practices.” New York State Department<br />
<strong>of</strong> <strong>Labor</strong>, February 11, 2008. Found at: http://www.state.ny.us/governor/<br />
press/0211083.html.<br />
---. 2009a. “<strong>Labor</strong> Department Initiative Empowers Ordinary People to join<br />
the Fight Against Wage Theft.” New York State Department <strong>of</strong> <strong>Labor</strong>, January<br />
26, 2009. Found at: http://www.labor.state.ny.us/pressreleases/2009/<br />
Jan26_2009.htm.<br />
---. 2009b. “<strong>Labor</strong> Department Announces $1.5 Million Enforcement Action<br />
Against New York Gourmet Grocery Stores.” New York State Department<br />
<strong>of</strong> <strong>Labor</strong>, February 26, 2009. Found at: http://www.labor.state.ny.us/<br />
pressreleases/2009/Feb26_2009.htm.<br />
---. 2009c. “<strong>Labor</strong> Department Announces Findings <strong>of</strong> Targeted Wage <strong>and</strong><br />
Hour Investigation in Upscale Park Slope Neighborhood in Brooklyn.” New<br />
York State Department <strong>of</strong> <strong>Labor</strong>, November 19, 2009. Found at: http://www.<br />
labor.state.ny.us/pressreleases/2009/November19_2009.htm.<br />
62
---. 2009d. “Governor Paterson Announces Record Level <strong>of</strong> Recovered Wages<br />
Returned to New Yorkers in 2009.” December 31, 2009. Found at: http://<br />
www.labor.state.ny.us/pressreleases/2009/December31_2009.htm.<br />
New York Taxi Workers Alliance. 2003. An Analysis <strong>of</strong> Taxi Industry Fare <strong>and</strong><br />
Lease Cap Proposals. New York: New York Taxi Workers Alliance.<br />
Organisation for Economic Co-operation <strong>and</strong> Development. 1994. The OECD<br />
Jobs Study: Evidence <strong>and</strong> Explanations. Paris: Organisation for Economic Cooperation<br />
<strong>and</strong> Development.<br />
---. 1996. OECD <strong>Employment</strong> Outlook: July 1996. Paris: Organisation for<br />
Economic Co-operation <strong>and</strong> Development.<br />
Piore, Michael J. 2007. “<strong>Labor</strong> Inspectors: The Front Line in the Battle for<br />
Decent Work.” Outline <strong>of</strong> Presentation to: Making Decent Work a Global<br />
Goal <strong>and</strong> a National Reality, International ILO Conference, Duseseldorf,<br />
Germany, September 19, 2007.<br />
Restaurant Opportunities Center <strong>of</strong> New York <strong>and</strong> the New York City<br />
Restaurant Industry Coalition. 2005. Behind the Kitchen Door: Pervasive<br />
Inequality in New York City’s Thriving Restaurant Industry. New York:<br />
Restaurant Opportunities Center <strong>of</strong> New York <strong>and</strong> New York City Restaurant<br />
Industry Coalition.<br />
---. 2006. Dining Out, Dining Healthy: The Link Between Public Health <strong>and</strong><br />
<strong>Working</strong> Conditions in New York City’s Restaurant Industry. New York:<br />
Restaurant Opportunities Center <strong>of</strong> New York <strong>and</strong> the New York City<br />
Restaurant Industry Coalition.<br />
---. 2009. The Great Service Divide: Occupational Segregation & Inequality in<br />
the New York City Restaurant Industry. New York: Restaurant Opportunities<br />
Center <strong>of</strong> New York <strong>and</strong> the New York City Restaurant Industry Coalition.<br />
Restaurant Opportunities Center <strong>of</strong> New York <strong>and</strong> the New York City Mayor’s<br />
Office <strong>of</strong> Immigrant Affairs. 2006. Restaurant Owner Manual. New York:<br />
Restaurant Opportunities Center <strong>of</strong> New York <strong>and</strong> the New York City Mayor’s<br />
Office <strong>of</strong> Immigrant Affairs. Found at: http://www.nyc.gov/html/records/pdf/<br />
govpub/2737nycrestaurantguide-81606.pdf.<br />
Ross, Robert J. S. 2004. Slaves to Fashion: Poverty <strong>and</strong> Abuse in New York<br />
Sweatshops. Ann Arbor, MI: University <strong>of</strong> Michigan Press.<br />
Ruckelshaus, Catherine. 2008. “<strong>Labor</strong>’s Wage War.” Fordham Urban <strong>Law</strong><br />
Journal 35(2):373–408.<br />
Ruckelshaus, Catherine <strong>and</strong> Bruce Goldstein. 2002. From Orchards to<br />
the Internet: Confronting Contingent Work Abuse. New York: National<br />
<strong>Employment</strong> <strong>Law</strong> Project <strong>and</strong> Farmworker Justice Fund. Found at: http://<br />
www.farmworkerjustice.org/Immigration_<strong>Labor</strong>/ContingentDOCS/<br />
OrchardstoInternet.pdf.<br />
Salganik, Matthew J. 2006. “Confidence intervals, design effects, <strong>and</strong> sample<br />
size calculation for respondent-driven sampling.” Journal <strong>of</strong> Urban Health<br />
83:98–111.<br />
Schrank, Andrew <strong>and</strong> Michael Piore. 2007. Norms, Regulations, <strong>and</strong> Labour<br />
St<strong>and</strong>ards in Central America. Mexico: United Nations Publication. Found at:<br />
http://www.eclac.cl/publicaciones/xml/3/28113/Serie%2077.pdf.<br />
Sonn, Paul. 2006. Citywide Minimum Wage <strong><strong>Law</strong>s</strong>: A New Policy Tool for Local<br />
Governments. Brennan Center for Justice at New York University School <strong>of</strong><br />
<strong>Law</strong>, Economic Policy Brief, No. 1, May 2006. Found at: http://brennan.3cdn.<br />
net/61d71f6dc9f7116f1d_phm6bx3n9.pdf.<br />
Southern Poverty <strong>Law</strong> Center. 2009. Under Siege: Life for Low-Income<br />
Latinos in the South. Montgomery, Alabama: Southern Poverty <strong>Law</strong> Center.<br />
Stonington, Joel. 2009. “Bronx Bakery Owner is Charged with Cheating<br />
Workers,” The New York Times, March 26, 2009. Found at: http://www.<br />
nytimes.com/2009/03/27/nyregion/27wage.html.<br />
Temporary Commission on Day <strong>Labor</strong>er Job Centers. 2009. Temporary<br />
Commission on Day <strong>Labor</strong>er Job Centers: Final Report. New York: Temporary<br />
Commission on Day <strong>Labor</strong>er Job Centers. Found at: http://www.nyc.gov/<br />
html/imm/downloads/pdf/report_day_laborer_job_centers.pdf.<br />
Theodore, Nik, Abel Valenzuela <strong>and</strong> Edwin Meléndez. 2006. “La Esquina<br />
(The Corner): Day <strong>Labor</strong>ers on the Margins <strong>of</strong> New York’s Formal Economy.”<br />
<strong>Working</strong>USA 9:407–423.<br />
---. 2009. “Workers Centers: Defending <strong>Labor</strong> St<strong>and</strong>ards for Migrant Workers<br />
in the Informal Economy.” International Journal <strong>of</strong> Manpower 30(5):422–436.<br />
Tucker-Welch, Suzette. 2004. The State <strong>of</strong> <strong>Working</strong> Immigrants in Colorado.<br />
Denver, CO: Colorado Fiscal Policy Institute.<br />
United States Department <strong>of</strong> <strong>Labor</strong>. 2001. 1999–2000 Report on Low-Wage<br />
Initiatives. Washington, DC: United States Department <strong>of</strong> <strong>Labor</strong> <strong>Employment</strong><br />
St<strong>and</strong>ards Administration Wage <strong>and</strong> Hour Division.<br />
United States General Accountability Office. 2006. <strong>Employment</strong><br />
Arrangements: Improved Outreach Could Help Ensure Proper Worker<br />
Classification. Report to the Ranking Minority Member, Committee on<br />
Health, Education, <strong>Labor</strong>, <strong>and</strong> Pensions, U.S. Senate. Washington, DC: United<br />
States General Accountability Office.<br />
Valenzuela, Abel, Nik Theodore, Edwin Meléndez <strong>and</strong> Ana Luz González.<br />
2006. On the Corner: Day <strong>Labor</strong> in the United States. Los Angeles: Center for<br />
the Study <strong>of</strong> Urban Poverty. Found at: http://www.sscnet.ucla.edu/issr/csup/<br />
uploaded_files/Natl_Day<strong>Labor</strong>-On_the_Corner1.pdf.<br />
Weil, David. 2005. “Public Enforcement/Private Monitoring: Evaluating a New<br />
Approach to Regulating the Minimum Wage.” Industrial <strong>and</strong> <strong>Labor</strong> Relations<br />
Review 58(2):238–257.<br />
---. 2007. Crafting a Progressive Workplace Regulatory Policy: Why<br />
Enforcement Matters. Boston, MA: Boston University School <strong>of</strong> Management:<br />
Harvard University-John F. Kennedy School <strong>of</strong> Government.<br />
Weil, David <strong>and</strong> Am<strong>and</strong>a Pyles. 2005. “Why Complain? Complaints,<br />
Compliance, <strong>and</strong> the Problem <strong>of</strong> Enforcement in the U.S. Workplace.”<br />
Comparative <strong>Labor</strong> <strong>Law</strong> <strong>and</strong> Policy Journal 27(1):59–92.<br />
---. 2007. “Exploring the Complaints <strong>and</strong> Compliance Gap Under U.S.<br />
Workplace Policies.” Proceedings <strong>of</strong> the 2007 Annual Meetings <strong>of</strong> the <strong>Labor</strong><br />
<strong>and</strong> <strong>Employment</strong> Relations Association. Found at: http://www.press.uillinois.<br />
edu/journals/irra/proceedings2007/.<br />
Wial, Howard. 1999. Minimum-Wage Enforcement <strong>and</strong> the Low-Wage <strong>Labor</strong><br />
Market. Harrisburg, PA: Keystone Research Center. Found at: http://mitsloan.<br />
mit.edu/iwer/pdf/tfwial.pdf.<br />
Workers Defense Project. 2009. Building Austin, Building Injustice:<br />
<strong>Working</strong> Conditions in Austin’s Construction Industry. Austin, TX:<br />
Workers Defense Project<br />
---. 2009. Testimony before the New York City Council Subcommittee on<br />
Zoning <strong>and</strong> Franchises <strong>of</strong> the Committee on L<strong>and</strong> Use on the Food Retail<br />
Expansion to Support Health (FRESH) Program. October 26, 2009. Found at:<br />
http://www.nelp.org/page/-/Justice/NELPTestimonyonNFreshProgram.pdf.<br />
Sonn, Paul <strong>and</strong> Tsedeye Gebreselassie. 2009. The Road to Responsible<br />
Contracting. New York, NY: National <strong>Employment</strong> <strong>Law</strong> Project. Found at:<br />
http://www.nelp.org/page/-/Justice/responsiblecontracting2009.pdf.<br />
63
© Copyright 2010 Annette Bernhardt, Diana Polson <strong>and</strong> James DeFilippis.<br />
All Rights Reserved.<br />
The graphic on the back cover is taken from one <strong>of</strong> the survey’s RDS recruitment<br />
chains. Each square represents a worker <strong>and</strong> the different colors represent the<br />
workers’ industry.<br />
Design by Hazan & Company
National <strong>Employment</strong> <strong>Law</strong> Project<br />
75 Maiden Lane, Suite 601 • New York, NY 10038<br />
www.nelp.org