City of Oxnard - Bicycle and Pedestrian Master Plan Appendices
City of Oxnard - Bicycle and Pedestrian Master Plan Appendices City of Oxnard - Bicycle and Pedestrian Master Plan Appendices
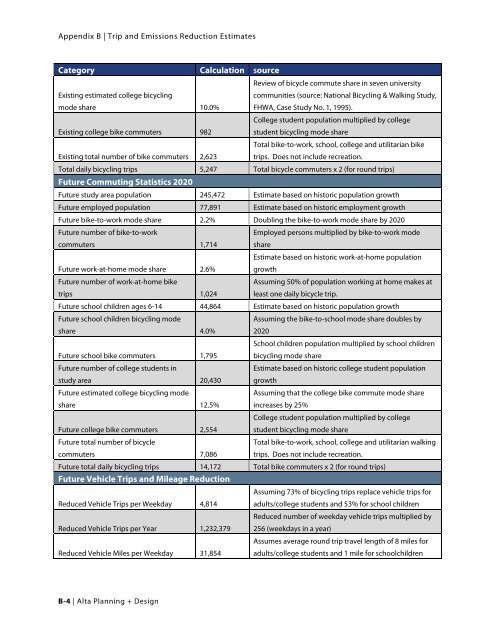
City of Oxnard | Bicycle and Pedestrian Master Plan Appendix B: Trip and Emissions Reduction Estimates This appendix provides detailed breakdowns of estimates that are required to make Oxnard eligible for funding from the State Bicycle Transportation Account. Table B-1 and Table B-2 present data, calculations and sources in four groups. Existing Commuting Statistics provide calculations for assessing total daily bicycling and walking trips. All trips counted in these estimates are utilitarian—related to commutes or errands— nondiscretionary trips that a person has to make. There may be discretionary bicycling and walking trips, for exercise or recreation, but these estimates cannot capture them without more detailed data. One assumption in this group addresses the number of bicycle trips a person working from home might make. These existing statistics are also informed by National Safe Routes to School surveys, which cite a national average of 2% bike-to-school commute share and 11% walk-to-school commute share. The Future Commuting Statistics use projected population growth, factoring in trends based on 1990 and 2000 census data, to predict the number of people who may bike in 2020. Some assumptions are made, relating to the impact from this plan; for example, this group of statistics relies on a future bike-to-work mode share doubling from 1.1% to 2.2% while the walk-to-work mode share increases by 25% of the present value at 1.7%. Other assumptions include the number of students who bike and walk to school, the number of college students biking and walking and the number of biking and walking trips made by a person working at home. The Future Vehicle Trips and Mileage Reduction estimates convert results from future commuting projections into the number of actual trips, along with number of vehicle miles replaced by biking and walking. Those values are further converted, to assess Future Air Quality Benefits— lbs/weekday and tons/year values to assess the complete impact that this plan may induce if successfully implemented. Table B-1: Estimated Existing and Projected Bicycling Activity Category Calculation Source Existing Bicycling Commuter Statistics Existing study area population 170,595 2000 Census, STF3, P1. Existing employed population 70,395 2000 Census, STF3, P30. Existing bike-to-work mode share 1.1% 2000 Census, STF3, P30. Existing number of bike-to-work commuters 753 Employed persons multiplied by bike-to-work mode share Existing work-at-home mode share 1.9% 2000 Census, STF3, P30. Existing number of work-at-home bike commuters 332 Assuming 25% of population working at home makes at least one daily bicycle trip Existing school children, ages 6-14 27,816 2000 Census, STF3, P8. Existing school children bicycling mode share 2.0% National Safe Routes to School surveys, 2003. Existing school children bike commuters 556 School children population multiplied by school children bike mode share Existing number of college students in study area 9,822 Full-time undergraduate and graduate student population in study area Alta Planning + Design | B-3
Appendix B | Trip and Emissions Reduction Estimates Category Calculation Source Existing estimated college bicycling mode share 10.0% Review of bicycle commute share in seven university communities (source: National Bicycling & Walking Study, FHWA, Case Study No. 1, 1995). Existing college bike commuters 982 College student population multiplied by college student bicycling mode share Existing total number of bike commuters 2,623 Total bike-to-work, school, college and utilitarian bike trips. Does not include recreation. Total daily bicycling trips 5,247 Total bicycle commuters x 2 (for round trips) Future Commuting Statistics 2020 Future study area population 245,472 Estimate based on historic population growth Future employed population 77,891 Estimate based on historic employment growth Future bike-to-work mode share 2.2% Doubling the bike-to-work mode share by 2020 Future number of bike-to-work commuters 1,714 Employed persons multiplied by bike-to-work mode share Future work-at-home mode share 2.6% Estimate based on historic work-at-home population growth Future number of work-at-home bike trips 1,024 Assuming 50% of population working at home makes at least one daily bicycle trip. Future school children ages 6-14 44,864 Estimate based on historic population growth Future school children bicycling mode share 4.0% Assuming the bike-to-school mode share doubles by 2020 Future school bike commuters 1,795 School children population multiplied by school children bicycling mode share Future number of college students in study area 20,430 Estimate based on historic college student population growth Future estimated college bicycling mode share 12.5% Assuming that the college bike commute mode share increases by 25% Future college bike commuters 2,554 College student population multiplied by college student bicycling mode share Future total number of bicycle commuters 7,086 Total bike-to-work, school, college and utilitarian walking trips. Does not include recreation. Future total daily bicycling trips 14,172 Total bike commuters x 2 (for round trips) Future Vehicle Trips and Mileage Reduction Reduced Vehicle Trips per Weekday 4,814 Assuming 73% of bicycling trips replace vehicle trips for adults/college students and 53% for school children Reduced Vehicle Trips per Year 1,232,379 Reduced number of weekday vehicle trips multiplied by 256 (weekdays in a year) Reduced Vehicle Miles per Weekday 31,854 Assumes average round trip travel length of 8 miles for adults/college students and 1 mile for schoolchildren B-4 | Alta Planning + Design
- Page 31 and 32: Appendix A | Design Guidelines A.4.
- Page 33 and 34: Appendix A | Design Guidelines A.4.
- Page 35 and 36: Appendix A | Design Guidelines A.4.
- Page 37 and 38: Appendix A | Design Guidelines Addi
- Page 39 and 40: Appendix A | Design Guidelines •
- Page 41 and 42: Appendix A | Design Guidelines A.6.
- Page 43 and 44: Appendix A | Design Guidelines Addi
- Page 45 and 46: Appendix A | Design Guidelines Cove
- Page 47 and 48: Appendix A | Design Guidelines A.6.
- Page 49 and 50: Appendix A | Design Guidelines A.7.
- Page 51 and 52: Appendix A | Design Guidelines Addi
- Page 53 and 54: Appendix A | Design Guidelines Addi
- Page 55 and 56: Appendix A | Design Guidelines A.7.
- Page 57 and 58: Appendix A | Design Guidelines Addi
- Page 59 and 60: Appendix A | Design Guidelines A.8.
- Page 61 and 62: Appendix A | Design Guidelines A.8.
- Page 63 and 64: Appendix A | Design Guidelines A.8.
- Page 65 and 66: Appendix A | Design Guidelines A.8.
- Page 67 and 68: Appendix A | Design Guidelines A.8.
- Page 69 and 70: Appendix A | Design Guidelines A.8.
- Page 71 and 72: Appendix A | Design Guidelines A.8.
- Page 73 and 74: Appendix A | Design Guidelines A.8.
- Page 75 and 76: Appendix A | Design Guidelines A.9.
- Page 77 and 78: Appendix A | Design Guidelines A.9.
- Page 79 and 80: Appendix A | Design Guidelines This
- Page 81: Appendix B | Trip and Emissions Red
- Page 85 and 86: Appendix B | Trip and Emissions Red
- Page 87 and 88: Appendix B | Trip and Emissions Red
- Page 89 and 90: Appendix C | Safety Review Table of
- Page 91 and 92: Appendix C | Safety Review Route Be
- Page 93 and 94: Appendix C | Safety Review Existing
- Page 95 and 96: Appendix C | Safety Review Existing
- Page 97 and 98: Appendix C | Safety Review Existing
- Page 99 and 100: Appendix C | Safety Review Route Be
- Page 101 and 102: Appendix C | Safety Review Route Be
- Page 103 and 104: Appendix C | Safety Review Route Be
- Page 105 and 106: Appendix C | Safety Review Route Be
- Page 107 and 108: Appendix C | Safety Review Route Be
- Page 109 and 110: Appendix C | Safety Review Route Be
- Page 111 and 112: Appendix C | Safety Review Existing
- Page 113 and 114: Appendix C | Safety Review Route Be
- Page 115 and 116: Appendix C | Safety Review Route Be
- Page 117 and 118: Appendix C | Safety Review Route Be
- Page 119 and 120: Appendix C | Safety Review Route Be
- Page 121 and 122: Appendix C | Safety Review Existing
- Page 123 and 124: Appendix C | Safety Review Existing
- Page 125 and 126: Appendix C | Safety Review Route Be
- Page 127 and 128: Appendix C | Safety Review Route Be
- Page 129 and 130: Appendix C | Safety Review This pag
- Page 131: Appendix D | Bicycle Transportation
Appendix B | Trip <strong>and</strong> Emissions Reduction Estimates<br />
Category Calculation Source<br />
Existing estimated college bicycling<br />
mode share 10.0%<br />
Review <strong>of</strong> bicycle commute share in seven university<br />
communities (source: National Bicycling & Walking Study,<br />
FHWA, Case Study No. 1, 1995).<br />
Existing college bike commuters 982<br />
College student population multiplied by college<br />
student bicycling mode share<br />
Existing total number <strong>of</strong> bike commuters 2,623<br />
Total bike-to-work, school, college <strong>and</strong> utilitarian bike<br />
trips. Does not include recreation.<br />
Total daily bicycling trips 5,247 Total bicycle commuters x 2 (for round trips)<br />
Future Commuting Statistics 2020<br />
Future study area population 245,472 Estimate based on historic population growth<br />
Future employed population 77,891 Estimate based on historic employment growth<br />
Future bike-to-work mode share 2.2% Doubling the bike-to-work mode share by 2020<br />
Future number <strong>of</strong> bike-to-work<br />
commuters 1,714<br />
Employed persons multiplied by bike-to-work mode<br />
share<br />
Future work-at-home mode share 2.6%<br />
Estimate based on historic work-at-home population<br />
growth<br />
Future number <strong>of</strong> work-at-home bike<br />
trips 1,024<br />
Assuming 50% <strong>of</strong> population working at home makes at<br />
least one daily bicycle trip.<br />
Future school children ages 6-14 44,864 Estimate based on historic population growth<br />
Future school children bicycling mode<br />
share 4.0%<br />
Assuming the bike-to-school mode share doubles by<br />
2020<br />
Future school bike commuters 1,795<br />
School children population multiplied by school children<br />
bicycling mode share<br />
Future number <strong>of</strong> college students in<br />
study area 20,430<br />
Estimate based on historic college student population<br />
growth<br />
Future estimated college bicycling mode<br />
share 12.5%<br />
Assuming that the college bike commute mode share<br />
increases by 25%<br />
Future college bike commuters 2,554<br />
College student population multiplied by college<br />
student bicycling mode share<br />
Future total number <strong>of</strong> bicycle<br />
commuters 7,086<br />
Total bike-to-work, school, college <strong>and</strong> utilitarian walking<br />
trips. Does not include recreation.<br />
Future total daily bicycling trips 14,172 Total bike commuters x 2 (for round trips)<br />
Future Vehicle Trips <strong>and</strong> Mileage Reduction<br />
Reduced Vehicle Trips per Weekday 4,814<br />
Assuming 73% <strong>of</strong> bicycling trips replace vehicle trips for<br />
adults/college students <strong>and</strong> 53% for school children<br />
Reduced Vehicle Trips per Year 1,232,379<br />
Reduced number <strong>of</strong> weekday vehicle trips multiplied by<br />
256 (weekdays in a year)<br />
Reduced Vehicle Miles per Weekday 31,854<br />
Assumes average round trip travel length <strong>of</strong> 8 miles for<br />
adults/college students <strong>and</strong> 1 mile for schoolchildren<br />
B-4 | Alta <strong>Plan</strong>ning + Design


