i'mpact Singapore Tourism Board Annual Report 2010/2011
i'mpact Singapore Tourism Board Annual Report 2010/2011
i'mpact Singapore Tourism Board Annual Report 2010/2011

Create successful ePaper yourself
Turn your PDF publications into a flip-book with our unique Google optimized e-Paper software.
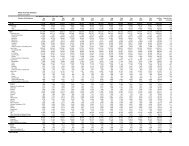
NOTES TO THE FINANCIAL STATEMENTS<br />
31 March <strong>2011</strong><br />
7 PROPERTY, PLANT AND EQUIPMENT<br />
Leasehold<br />
land Buildings<br />
Building<br />
improvements<br />
Furniture<br />
fittings and<br />
equipment<br />
Motor<br />
vehicles<br />
Electrical<br />
Installation<br />
and airconditioners<br />
Capital<br />
work-inprogress<br />
<strong>Tourism</strong><br />
assets* Total<br />
$’000 $’000 $’000 $’000 $’000 $’000 $’000 $’000 $’000<br />
Cost:<br />
At 31 March 2009 3,430 66,125 10,491 24,924 1,514 1,329 5,152 27,964 140,929<br />
Additions - - - 358 - - 65,132 4,197 69,687<br />
Reclassification - - 225 638 - - (863) - -<br />
Disposal/write-off - - (589) (329) (127) (21) - - (1,066)<br />
At 31 March <strong>2010</strong> 3,430 66,125 10,127 25,591 1,387 1,308 69,421 32,161 209,550<br />
Additions - - 74 510 - 10 206,399 6,871 213,864<br />
Reclassification - - 35 1,348 - - (3,883) 2,500 -<br />
Disposal/write-off - - (768) (1,789) (141) (18) - - (2,716)<br />
At 31 March <strong>2011</strong> 3,430 66,125 9,468 25,660 1,246 1,300 271,937 41,532 420,698<br />
Accumulated depreciation:<br />
At 31 March 2009 547 36,973 8,745 22,449 1,160 978 - 2,799 73,651<br />
Depreciation 39 2,645 722 2,560 163 133 3,549 9,811<br />
Disposal/write-off - - (487) (315) (127) (13) - - (942)<br />
At 31 March <strong>2010</strong> 586 39,618 8,980 24,694 1,196 1,098 - 6,348 82,520<br />
Depreciation 39 2,556 468 1,143 117 94 - 4,263 8,680<br />
Disposal/write-off - - (739) (1,763) (128) (18) - - (2,648)<br />
At 31 March <strong>2011</strong> 625 42,174 8,709 24,074 1,185 1,174 - 10,611 88,552<br />
Carrying amount:<br />
At 31 March <strong>2011</strong> 2,805 23,951 759 1,586 61 126 271,937 30,921 332,146<br />
At 31 March <strong>2010</strong> 2,844 26,507 1,147 897 191 210 69,421 25,813 127,030<br />
* <strong>Tourism</strong> assets includes assets such as lightings, barriers, bridges, storage building, food stall kiosks, street-lamps, roadworks and others.<br />
80