i'mpact Singapore Tourism Board Annual Report 2010/2011
i'mpact Singapore Tourism Board Annual Report 2010/2011
i'mpact Singapore Tourism Board Annual Report 2010/2011

You also want an ePaper? Increase the reach of your titles
YUMPU automatically turns print PDFs into web optimized ePapers that Google loves.
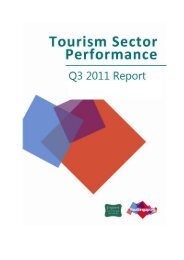
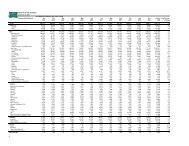
<strong>Tourism</strong> Sector Performance<br />
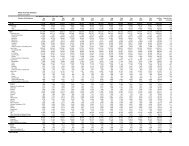
<strong>Singapore</strong>’s top five visitor generating markets for <strong>2010</strong> accounted for 36.6 per cent of total tourism receipts during this period,<br />
specifically Indonesia (S$2,604 million), P R China (S$1,644 million), Australia (S$1,002 million), India (S$911 million) and Malaysia<br />
(S$767 million).<br />
<strong>Tourism</strong> Receipts by Major Components,<br />
Top 10 Markets, Jan - Dec <strong>2010</strong><br />
<strong>Tourism</strong> Receipts: S$18.9 billion (49.6% vs 2009)<br />
% Change<br />
vs 2009<br />
Overall<br />
Shopping<br />
Accommodation<br />
Food & Beverage<br />
Other TR Components<br />
20% 27% 24% 13% 36%<br />
<strong>2010</strong> TR<br />
(S$ mil)<br />
14,918<br />
24%<br />
Indonesia<br />
30% 15% 9% 47%<br />
2,604<br />
22%<br />
P R China<br />
48% 19% 9% 24%<br />
1,644<br />
11%<br />
Australia<br />
19% 24% 13% 44%<br />
1,002<br />
19%<br />
India<br />
28% 24% 14% 34%<br />
911<br />
15%<br />
Malaysia<br />
29% 23% 12% 36%<br />
767<br />
23%<br />
USA<br />
11% 40% 20% 29%<br />
647<br />
13%<br />
Philippines<br />
24% 32% 17% 27%<br />
628<br />
17%<br />
Japan<br />
17% 30% 11% 42%<br />
609<br />
20%<br />
Thailand<br />
22% 36% 17% 26%<br />
549<br />
5%<br />
UK<br />
12% 30% 15% 42%<br />
542<br />
Expenditure is estimated from Overseas Visitor Survey.<br />
Other TR components comprise of airfare, local transport, medical business, education and other expenditure.<br />
Sightseeing & entertainment has been excluded in the country analysis due to commercial sensitivity of information.<br />
36