- Page 1 and 2:
MATLAB® The Language of Technical
- Page 3:
Revision History June 2004 First pr
- Page 6 and 7:
2 Polynomials and Interpolation Pol
- Page 8 and 9:
Introduction to Initial Value ODE P
- Page 10 and 11:
vi Contents
- Page 12 and 13:
1 Matrices and Linear Algebra Funct
- Page 14 and 15:
1 Matrices and Linear Algebra Matri
- Page 16 and 17:
1 Matrices and Linear Algebra Addin
- Page 18 and 19:
1 Matrices and Linear Algebra If x
- Page 20 and 21:
1 Matrices and Linear Algebra y = v
- Page 22 and 23:
1 Matrices and Linear Algebra Vecto
- Page 24 and 25:
1 Matrices and Linear Algebra backs
- Page 26 and 27:
1 Matrices and Linear Algebra If A
- Page 28 and 29:
1 Matrices and Linear Algebra You c
- Page 30 and 31:
1 Matrices and Linear Algebra 0.9 0
- Page 32 and 33:
1 Matrices and Linear Algebra Inver
- Page 34 and 35:
1 Matrices and Linear Algebra X = p
- Page 36 and 37:
1 Matrices and Linear Algebra There
- Page 38 and 39: 1 Matrices and Linear Algebra The e
- Page 40 and 41: 1 Matrices and Linear Algebra The L
- Page 42 and 43: 1 Matrices and Linear Algebra In co
- Page 44 and 45: 1 Matrices and Linear Algebra Matri
- Page 46 and 47: 1 Matrices and Linear Algebra compu
- Page 48 and 49: 1 Matrices and Linear Algebra Eigen
- Page 50 and 51: 1 Matrices and Linear Algebra produ
- Page 52 and 53: 1 Matrices and Linear Algebra Singu
- Page 54 and 55: 1 Matrices and Linear Algebra 1-44
- Page 56 and 57: 2 Polynomials and Interpolation Pol
- Page 58 and 59: 2 Polynomials and Interpolation pol
- Page 60 and 61: 2 Polynomials and Interpolation Cal
- Page 62 and 63: 2 Polynomials and Interpolation whe
- Page 64 and 65: 2 Polynomials and Interpolation Int
- Page 66 and 67: 2 Polynomials and Interpolation int
- Page 68 and 69: 2 Polynomials and Interpolation 2 G
- Page 70 and 71: 2 Polynomials and Interpolation Int
- Page 72 and 73: 2 Polynomials and Interpolation for
- Page 74 and 75: 2 Polynomials and Interpolation Con
- Page 76 and 77: 2 Polynomials and Interpolation Lat
- Page 78 and 79: 2 Polynomials and Interpolation −
- Page 80 and 81: 2 Polynomials and Interpolation −
- Page 82 and 83: 2 Polynomials and Interpolation 7 3
- Page 84 and 85: 2 Polynomials and Interpolation T =
- Page 86 and 87: 2 Polynomials and Interpolation Bec
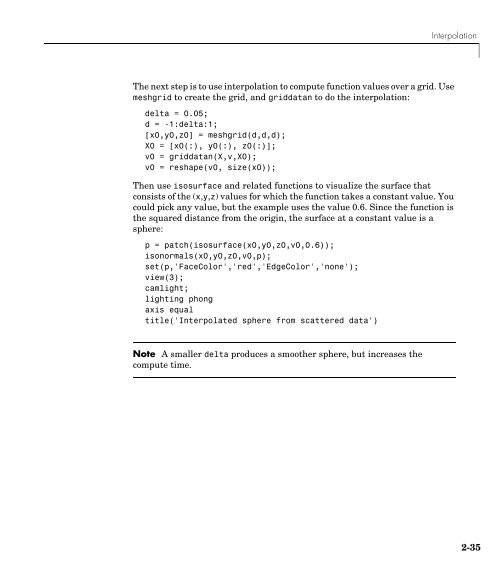
- Page 90 and 91: 2 Polynomials and Interpolation 2-3
- Page 92 and 93: 2 Polynomials and Interpolation 2-3
- Page 94 and 95: 3 Fast Fourier Transform (FFT) Intr
- Page 96 and 97: 3 Fast Fourier Transform (FFT) 200
- Page 98 and 99: 3 Fast Fourier Transform (FFT) 2 x
- Page 100 and 101: 3 Fast Fourier Transform (FFT) 500
- Page 102 and 103: 3 Fast Fourier Transform (FFT) Func
- Page 104 and 105: 4 Function Functions Function Summa
- Page 106 and 107: 4 Function Functions You can also c
- Page 108 and 109: 4 Function Functions 25 20 15 10 5
- Page 110 and 111: 4 Function Functions Minimizing Fun
- Page 112 and 113: 4 Function Functions To try fminsea
- Page 114 and 115: 4 Function Functions Plotting the R
- Page 116 and 117: 4 Function Functions The number of
- Page 118 and 119: 4 Function Functions and displays t
- Page 120 and 121: 4 Function Functions end function s
- Page 122 and 123: 4 Function Functions States of the
- Page 124 and 125: 4 Function Functions 100 80 60 40 2
- Page 126 and 127: 4 Function Functions You can verify
- Page 128 and 129: 4 Function Functions Troubleshootin
- Page 130 and 131: 4 Function Functions A three-dimens
- Page 132 and 133: 4 Function Functions Parameterizing
- Page 134 and 135: 4 Function Functions “Anonymous F
- Page 136 and 137: 5 Differential Equations Initial Va
- Page 138 and 139:
5 Differential Equations odephas3 o
- Page 140 and 141:
5 Differential Equations This secti
- Page 142 and 143:
5 Differential Equations The basic
- Page 144 and 145:
5 Differential Equations 2 Code the
- Page 146 and 147:
5 Differential Equations function.
- Page 148 and 149:
5 Differential Equations One way to
- Page 150 and 151:
5 Differential Equations y0, yp0 Ve
- Page 152 and 153:
5 Differential Equations For exampl
- Page 154 and 155:
5 Differential Equations 1 0.8 0.6
- Page 156 and 157:
5 Differential Equations 2.5 Soluti
- Page 158 and 159:
5 Differential Equations To run thi
- Page 160 and 161:
5 Differential Equations 2 u′ i =
- Page 162 and 163:
5 Differential Equations dydt(i+1,:
- Page 164 and 165:
5 Differential Equations refine = 4
- Page 166 and 167:
5 Differential Equations Example: A
- Page 168 and 169:
5 Differential Equations function [
- Page 170 and 171:
5 Differential Equations Note The R
- Page 172 and 173:
5 Differential Equations 1 Robertso
- Page 174 and 175:
5 Differential Equations The MATLAB
- Page 176 and 177:
5 Differential Equations Summary of
- Page 178 and 179:
5 Differential Equations Problem Si
- Page 180 and 181:
5 Differential Equations Error Tole
- Page 182 and 183:
5 Differential Equations Troublesho
- Page 184 and 185:
5 Differential Equations Function d
- Page 186 and 187:
5 Differential Equations dde23 prod
- Page 188 and 189:
5 Differential Equations The exampl
- Page 190 and 191:
5 Differential Equations solution y
- Page 192 and 193:
5 Differential Equations Example: C
- Page 194 and 195:
5 Differential Equations Changing D
- Page 196 and 197:
5 Differential Equations BVP Functi
- Page 198 and 199:
5 Differential Equations two-point
- Page 200 and 201:
5 Differential Equations The input
- Page 202 and 203:
5 Differential Equations 2 Pass the
- Page 204 and 205:
5 Differential Equations 3 Code the
- Page 206 and 207:
5 Differential Equations Finding Un
- Page 208 and 209:
5 Differential Equations vectorized
- Page 210 and 211:
5 Differential Equations There is a
- Page 212 and 213:
5 Differential Equations 3 Solve on
- Page 214 and 215:
5 Differential Equations hold off T
- Page 216 and 217:
5 Differential Equations Note The d
- Page 218 and 219:
5 Differential Equations legend('An
- Page 220 and 221:
5 Differential Equations Here, v(1-
- Page 222 and 223:
5 Differential Equations solution v
- Page 224 and 225:
5 Differential Equations Note The D
- Page 226 and 227:
5 Differential Equations After disc
- Page 228 and 229:
5 Differential Equations The output
- Page 230 and 231:
5 Differential Equations 2 Code the
- Page 232 and 233:
5 Differential Equations Note See t
- Page 234 and 235:
5 Differential Equations The exampl
- Page 236 and 237:
5 Differential Equations and the ri
- Page 238 and 239:
5 Differential Equations u1(x,t) 1
- Page 240 and 241:
5 Differential Equations Selected B
- Page 242 and 243:
6 Sparse Matrices Function Summary
- Page 244 and 245:
6 Sparse Matrices Function Summary
- Page 246 and 247:
6 Sparse Matrices This matrix requi
- Page 248 and 249:
6 Sparse Matrices S = (3,1) 1 (2,2)
- Page 250 and 251:
6 Sparse Matrices Now F = full(S) d
- Page 252 and 253:
6 Sparse Matrices Importing Sparse
- Page 254 and 255:
6 Sparse Matrices west0479 west0479
- Page 256 and 257:
6 Sparse Matrices The find Function
- Page 258 and 259:
6 Sparse Matrices of the rows and c
- Page 260 and 261:
6 Sparse Matrices The vertices of o
- Page 262 and 263:
6 Sparse Matrices 0 10 20 30 40 50
- Page 264 and 265:
6 Sparse Matrices 0 500 1000 1500 2
- Page 266 and 267:
6 Sparse Matrices simply sparse(m,n
- Page 268 and 269:
6 Sparse Matrices Similarly, S(:,p)
- Page 270 and 271:
6 Sparse Matrices The following MAT
- Page 272 and 273:
6 Sparse Matrices 0 Original 0 Reve
- Page 274 and 275:
6 Sparse Matrices QR Factorization
- Page 276 and 277:
6 Sparse Matrices shows that A has
- Page 278 and 279:
6 Sparse Matrices Functions for Ite
- Page 280 and 281:
6 Sparse Matrices set up the five-p
- Page 282 and 283:
6 Sparse Matrices Manipulating Spar
- Page 284 and 285:
6 Sparse Matrices Selected Bibliogr
- Page 286 and 287:
Index comparing sparse and full mat
- Page 288 and 289:
Index H hb1dae demo 5-35 hb1ode dem
- Page 290 and 291:
Index nonstiff ODE examples rigid b
- Page 292 and 293:
Index LU factorization 6-30 minimum
- Page 294:
Index twobvp demo 5-63 two-dimensio