Water Kit - Hunter Water
Water Kit - Hunter Water Water Kit - Hunter Water
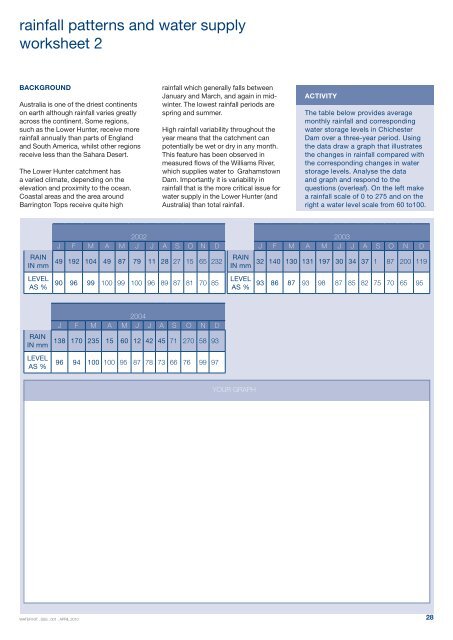
ainfall patterns and water supply worksheet 2 Background Australia is one of the driest continents on earth although rainfall varies greatly across the continent. Some regions, such as the Lower Hunter, receive more rainfall annually than parts of England and South America, whilst other regions receive less than the Sahara Desert. The Lower Hunter catchment has a varied climate, depending on the elevation and proximity to the ocean. Coastal areas and the area around Barrington Tops receive quite high rainfall which generally falls between January and March, and again in midwinter. The lowest rainfall periods are spring and summer. High rainfall variability throughout the year means that the catchment can potentially be wet or dry in any month. This feature has been observed in measured flows of the Williams River, which supplies water to Grahamstown Dam. Importantly it is variability in rainfall that is the more critical issue for water supply in the Lower Hunter (and Australia) than total rainfall. Activity The table below provides average monthly rainfall and corresponding water storage levels in Chichester Dam over a three-year period. Using the data draw a graph that illustrates the changes in rainfall compared with the corresponding changes in water storage levels. Analyse the data and graph and respond to the questions (overleaf). On the left make a rainfall scale of 0 to 275 and on the right a water level scale from 60 to100. 2002 2003 J F M A M J J A S O N D J F M A M J J RAIN RAIN 49 192 104 49 87 79 11 28 27 15 65 232 32 140 130 131 197 30 34 IN mm IN mm LEVEL AS % 90 96 99 100 99 100 96 89 87 81 70 85 LEVEL 93 86 87 93 98 87 85 AS % A S 37 1 82 75 O 87 70 N 200 65 D 119 95 RAIN IN mm LEVEL AS % 2004 J F M A M J J A S O N D 138 170 235 15 60 12 42 45 71 270 58 93 96 94 100 100 95 87 78 73 66 76 99 97 your graph Water kit . ssS . 001 . april 2010 28
ainfall patterns and water supply worksheet 2 Questions 1 What trends can you see in annual rainfall patterns, both within each year and between the three years? 2 Water restrictions are generally enforced if total water storage levels fall below 60%. Would water restrictions have been applied at any stage over the three years? 3 If so, when and for how long might the restrictions have lasted? 4 What was the relationship between rainfall and water storage levels? 5 List the other factors that affect water storage and outline how they may affect water storage? Water kit . ssS . 001 . april 2010 29
- Page 1 and 2: Water kit . ssS . 001 . april 2010
- Page 3 and 4: introduction to water supply WATER
- Page 5 and 6: introduction WHY STUDY WATER? Water
- Page 7 and 8: 1.1 the water cycle INTRODUCTION Mo
- Page 9 and 10: BREAKING THE WATER CYCLE To supply
- Page 11 and 12: Hunter Water’s area of operations
- Page 13 and 14: Protecting and managing the catchme
- Page 15 and 16: Water From The Mountains Chichester
- Page 17 and 18: Rewarding Water Conservation A new
- Page 19 and 20: Main infrastructure of Hunter Water
- Page 21 and 22: 1.6 the managing groundwater supply
- Page 23 and 24: Water Sharing Plan for the Tomago,
- Page 25 and 26: Monitoring the Hunter catchment The
- Page 27 and 28: Environmental Hunter Water: • Dev
- Page 29 and 30: The Expanded Polystyrene (EPS) was
- Page 31 and 32: labour is invested on the site annu
- Page 33: influences on water supply in the h
- Page 37 and 38: managing water supply sustainably w
- Page 39 and 40: 1.8 Sustainability & Water Supply S
- Page 41 and 42: Links with THE Syllabus Used collec
- Page 43 and 44: Integrated Water Resource Plan The
- Page 45 and 46: 2.2 being waterwise at home Our wat
- Page 47 and 48: 2.3 being waterwise at school Water
- Page 49 and 50: 2.4 school water audit Why DO A wat
- Page 51 and 52: 2.6 think twice water saving campai
- Page 53 and 54: design a water saving campaign work
- Page 55 and 56: assessing water conservation scheme
- Page 57 and 58: 8 Use wetlands to store stormwater
- Page 59 and 60: water audits - a case study workshe
- Page 61 and 62: desktop water audit worksheet 4 Ask
- Page 63 and 64: asic water audit worksheet 5 Leakin
- Page 65 and 66: environmental audit protocol worksh
- Page 67 and 68: water conservation resource list 2.
- Page 69 and 70: Links with THE Syllabus Used collec
- Page 71 and 72: These controls specify the quality
- Page 73 and 74: wwtw population communities daily v
- Page 75 and 76: Grit Tank Inorganic grit material i
- Page 77 and 78: 3.5 stormwater management What is s
- Page 79 and 80: 3.6 managing stormwater with sqids
- Page 81 and 82: ) Suggest strategies that might be
- Page 83 and 84: Does it transport rubbish down into
ainfall patterns and water supply<br />
worksheet 2<br />
Background<br />
Australia is one of the driest continents<br />
on earth although rainfall varies greatly<br />
across the continent. Some regions,<br />
such as the Lower <strong>Hunter</strong>, receive more<br />
rainfall annually than parts of England<br />
and South America, whilst other regions<br />
receive less than the Sahara Desert.<br />
The Lower <strong>Hunter</strong> catchment has<br />
a varied climate, depending on the<br />
elevation and proximity to the ocean.<br />
Coastal areas and the area around<br />
Barrington Tops receive quite high<br />
rainfall which generally falls between<br />
January and March, and again in midwinter.<br />
The lowest rainfall periods are<br />
spring and summer.<br />
High rainfall variability throughout the<br />
year means that the catchment can<br />
potentially be wet or dry in any month.<br />
This feature has been observed in<br />
measured flows of the Williams River,<br />
which supplies water to Grahamstown<br />
Dam. Importantly it is variability in<br />
rainfall that is the more critical issue for<br />
water supply in the Lower <strong>Hunter</strong> (and<br />
Australia) than total rainfall.<br />
Activity<br />
The table below provides average<br />
monthly rainfall and corresponding<br />
water storage levels in Chichester<br />
Dam over a three-year period. Using<br />
the data draw a graph that illustrates<br />
the changes in rainfall compared with<br />
the corresponding changes in water<br />
storage levels. Analyse the data<br />
and graph and respond to the<br />
questions (overleaf). On the left make<br />
a rainfall scale of 0 to 275 and on the<br />
right a water level scale from 60 to100.<br />
2002<br />
2003<br />
J F M A M J J A S O N D<br />
J F M A M J J<br />
RAIN<br />
RAIN<br />
49 192 104 49 87 79 11 28 27 15 65 232 32 140 130 131 197 30 34<br />
IN mm IN mm<br />
LEVEL<br />
AS % 90 96 99 100 99 100 96 89 87 81 70 85 LEVEL<br />
93 86 87 93 98 87 85<br />
AS %<br />
A S<br />
37 1<br />
82 75<br />
O<br />
87<br />
70<br />
N<br />
200<br />
65<br />
D<br />
119<br />
95<br />
RAIN<br />
IN mm<br />
LEVEL<br />
AS %<br />
2004<br />
J F M A M J J A S O N D<br />
138 170 235 15 60 12 42 45 71 270 58 93<br />
96 94 100 100 95 87 78 73 66 76 99 97<br />
your graph<br />
<strong>Water</strong> kit . ssS . 001 . april 2010<br />
28


