Protein Conformational Relaxation and Ligand Migration in Myoglobin
Protein Conformational Relaxation and Ligand Migration in Myoglobin
Protein Conformational Relaxation and Ligand Migration in Myoglobin

You also want an ePaper? Increase the reach of your titles
YUMPU automatically turns print PDFs into web optimized ePapers that Google loves.
13802 Biochemistry 2001, 40, 13802-13815<br />
<strong>Prote<strong>in</strong></strong> <strong>Conformational</strong> <strong>Relaxation</strong> <strong>and</strong> Lig<strong>and</strong> <strong>Migration</strong> <strong>in</strong> Myoglob<strong>in</strong>: A<br />
Nanosecond to Millisecond Molecular Movie from Time-Resolved Laue X-ray<br />
Diffraction †<br />
Vukica Šrajer,* ,‡,§ Zhong Ren, ‡,§,4 Tsu-Yi Teng, ‡,§ Marius Schmidt, ‡ Thomas Ursby, |,⊥ Dom<strong>in</strong>ique Bourgeois, |,@<br />
Claude Praderv<strong>and</strong>, §,# Wilfried Schildkamp, § Michael Wulff, | <strong>and</strong> Keith Moffat* ,‡,§<br />
Department of Biochemistry <strong>and</strong> Molecular Biology, The UniVersity of Chicago, 920 East 58th Street, Chicago, Ill<strong>in</strong>ois 60637,<br />
Consortium for AdVanced Radiation Sources, The UniVersity of Chicago, 5640 South Ellis AVenue, Chicago, Ill<strong>in</strong>ois 60637, <strong>and</strong><br />
European Synchrotron Radiation Facility, BP 220, 38043 Grenoble Cedex, France<br />
ReceiVed April 6, 2001; ReVised Manuscript ReceiVed August 20, 2001<br />
W This paper conta<strong>in</strong>s enhanced objects available on the Internet at http://pubs.acs.org/biochemistry.<br />
ABSTRACT: A time-resolved Laue X-ray diffraction technique has been used to explore prote<strong>in</strong> relaxation<br />
<strong>and</strong> lig<strong>and</strong> migration at room temperature follow<strong>in</strong>g photolysis of a s<strong>in</strong>gle crystal of carbon monoxymyoglob<strong>in</strong>.<br />
The CO lig<strong>and</strong> is photodissociated by a 7.5 ns laser pulse, <strong>and</strong> the subsequent structural<br />
changes are probed by 150 ps or 1 µs X-ray pulses at 14 laser/X-ray delay times, rang<strong>in</strong>g from 1 ns to<br />
1.9 ms. Very fast heme <strong>and</strong> prote<strong>in</strong> relaxation <strong>in</strong>volv<strong>in</strong>g the E <strong>and</strong> F helices is evident from the data at<br />
a 1 ns time delay. The photodissociated CO molecules are detected at two locations: at a distal pocket<br />
dock<strong>in</strong>g site <strong>and</strong> at the Xe 1 b<strong>in</strong>d<strong>in</strong>g site <strong>in</strong> the proximal pocket. The population by CO of the primary,<br />
distal site peaks at a1nstime delay <strong>and</strong> decays to half the peak value <strong>in</strong> 70 ns. The secondary, proximal<br />
dock<strong>in</strong>g site reaches its highest occupancy of 20% at ∼100 ns <strong>and</strong> has a half-life of ∼10 µs. At ∼100 ns,<br />
all CO molecules are accounted for with<strong>in</strong> the prote<strong>in</strong>: <strong>in</strong> one of these two dock<strong>in</strong>g sites or bound to the<br />
heme. Thereafter, the CO molecules migrate to the solvent from which they reb<strong>in</strong>d to deoxymyoglob<strong>in</strong><br />
<strong>in</strong> a bimolecular process with a second-order rate coefficient of 4.5 × 10 5 M -1 s -1 . Our results also<br />
demonstrate that structural changes as small as 0.2 Å <strong>and</strong> populations of CO dock<strong>in</strong>g sites of 10% can be<br />
detected by time-resolved X-ray diffraction.<br />
The structure, function, <strong>and</strong> dynamics of the small globular<br />
oxygen storage prote<strong>in</strong> myoglob<strong>in</strong> (Mb) 1 have been extensively<br />
<strong>in</strong>vestigated over many years by a large number of<br />
experimental <strong>and</strong> computational methods. The goal is to<br />
underst<strong>and</strong> <strong>in</strong> general terms the processes of lig<strong>and</strong> dissociation,<br />
reb<strong>in</strong>d<strong>in</strong>g, recognition, <strong>and</strong> discrim<strong>in</strong>ation, <strong>and</strong> to explore<br />
lig<strong>and</strong> entrance <strong>and</strong> exit pathways <strong>in</strong> the framework<br />
of prote<strong>in</strong> structure <strong>and</strong> dynamics, us<strong>in</strong>g myoglob<strong>in</strong> as a<br />
†<br />
This work was supported by NIH Grants RR07707 <strong>and</strong> GM 36452<br />
to K.M. <strong>and</strong> by EU BIOTECH Grant CT98-0415 to M.W.<br />
* To whom correspondence should be addressed. Telephone: (773)<br />
702-3603 (773) 702-2116. Fax: (773) 702-0439. E-mail: vusr@midway.<br />
uchicago.edu or moffat@cars.uchicago.edu.<br />
‡<br />
Department of Biochemistry <strong>and</strong> Molecular Biology, The University<br />
of Chicago.<br />
§<br />
Consortium for Advanced Radiation Sources, The University of<br />
Chicago.<br />
4<br />
Present address: Renz Research Inc., 1570 Wicke Ave., Des<br />
Pla<strong>in</strong>es, IL 60018.<br />
|<br />
European Synchrotron Radiation Facility.<br />
⊥<br />
Present address: MAX-lab, Lund University, P.O. Box 118,<br />
S-22100 Lund, Sweden.<br />
@<br />
Present address: European Synchrotron Radiation Facility <strong>and</strong><br />
LCCP IBS, UMR 9015, 41 Avenue Jules Horowitz, 38027 Grenoble<br />
Cedex 1, France.<br />
#<br />
Present address: Swiss Light Source, Paul Scherrer Institut, 5232<br />
Villigen PSI, Switzerl<strong>and</strong>.<br />
1<br />
Abbreviations: Mb, myoglob<strong>in</strong>; MbCO, carbon monoxide complex<br />
of myoglob<strong>in</strong>; ESRF, European Synchrotron Radiation Facility; Mb*,<br />
MbCO photoproduct; INS, isomorphous noise suppression; PDB,<br />
<strong>Prote<strong>in</strong></strong> Data Bank.<br />
specific example. Comprehensive studies have been carried<br />
out over the time scale from femtoseconds to seconds, under<br />
a broad range of experimental conditions such as temperature,<br />
pressure, solvent viscosity, <strong>and</strong> pH, for several species of<br />
wild-type myoglob<strong>in</strong>s <strong>and</strong> for variants of important am<strong>in</strong>o<br />
acid residues (1-24).<br />
Many of these studies exploit the fact that the carbon<br />
monoxide complex of myoglob<strong>in</strong> (MbCO) is light-sensitive.<br />
Absorption of a photon ruptures the iron-carbon monoxide<br />
bond, <strong>in</strong>itiat<strong>in</strong>g a series of spectroscopic <strong>and</strong> structural<br />
changes, ultimately followed by carbon monoxide reb<strong>in</strong>d<strong>in</strong>g<br />
<strong>and</strong> regeneration of MbCO. Ultrafast spectroscopic measurements<br />
explore directly lig<strong>and</strong> photolysis <strong>and</strong> subsequent<br />
reb<strong>in</strong>d<strong>in</strong>g. They also provide <strong>in</strong>formation about rates for<br />
those structural relaxation processes that are coupled to<br />
spectral properties of the molecule. S<strong>in</strong>ce spectroscopic<br />
properties are quite sensitive to coupled structural changes,<br />
the time courses of those changes can be accurately determ<strong>in</strong>ed<br />
(14, 16, 17). However, <strong>in</strong> most cases, the actual nature<br />
of the structural change is not directly revealed <strong>and</strong> can only<br />
be <strong>in</strong>ferred from the spectral changes. X-ray crystallography<br />
provides direct, detailed, <strong>and</strong> global structural <strong>in</strong>formation.<br />
Static crystal structures of several ligation states of myoglob<strong>in</strong><br />
are known to near-atomic resolution (25, 26). The development<br />
of ultrafast time-resolved X-ray crystallography<br />
(27-31) has provided a new tool for obta<strong>in</strong><strong>in</strong>g direct, timeresolved<br />
global structural <strong>in</strong>formation at physiological tem-<br />
10.1021/bi010715u CCC: $20.00 © 2001 American Chemical Society<br />
Published on Web 10/24/2001
Time-Resolved Crystallographic Study of Myoglob<strong>in</strong> Biochemistry, Vol. 40, No. 46, 2001 13803<br />
peratures. Us<strong>in</strong>g this tool, it is not necessary to trap<br />
<strong>in</strong>termediate prote<strong>in</strong> conformations, either by freez<strong>in</strong>g or by<br />
chemical modification, to study them by X-ray diffraction<br />
methods. Artifacts aris<strong>in</strong>g from the trapp<strong>in</strong>g process, which<br />
may be particularly evident for very short-lived <strong>in</strong>termediates<br />
(32), can then be avoided.<br />
Myoglob<strong>in</strong> serves as a particularly challeng<strong>in</strong>g test with<br />
which to explore the capabilities <strong>and</strong> limitations of timeresolved<br />
X-ray diffraction. The near-atomic resolution<br />
structures of myoglob<strong>in</strong> with <strong>and</strong> without lig<strong>and</strong> (25, 26)<br />
<strong>in</strong>dicate that only relatively small structural relaxation of the<br />
heme <strong>and</strong> the glob<strong>in</strong>, limited <strong>in</strong> both spatial extent <strong>and</strong><br />
magnitude, is expected to accompany lig<strong>and</strong> photolysis.<br />
Further, the entire photolysis, relaxation, <strong>and</strong> reb<strong>in</strong>d<strong>in</strong>g<br />
processes <strong>in</strong> the crystal are complete <strong>in</strong> less than 5 ms at<br />
room temperature, which requires that all measurements be<br />
made rapidly <strong>and</strong> with excellent time resolution. In the first<br />
nanosecond time-resolved X-ray diffraction study (28), we<br />
demonstrated that complete, redundant, <strong>and</strong> good-quality<br />
Laue crystallographic data can be collected us<strong>in</strong>g s<strong>in</strong>gle, 150<br />
ps, X-ray pulses from a third-generation synchrotron X-ray<br />
source, such as the ESRF (Grenoble, France). In these<br />
pump-probe experiments, the CO was photodissociated from<br />
a s<strong>in</strong>gle crystal of MbCO by a 7.5 ns laser pulse <strong>and</strong> the<br />
structure of the photoproduct (Mb*) probed by a delayed<br />
X-ray pulse. At a 4 ns delay, the Mb* m<strong>in</strong>us MbCO<br />
difference Fourier map revealed a large negative signal<br />
associated with the loss of lig<strong>and</strong> due to photolysis (28). This<br />
signal dim<strong>in</strong>ished <strong>in</strong> magnitude <strong>in</strong> a time series of five<br />
difference maps obta<strong>in</strong>ed at longer time delays, between 1<br />
µs <strong>and</strong> 1.9 ms. Heme relaxation, manifested by motion of<br />
the iron atom out of the heme plane toward the proximal<br />
histid<strong>in</strong>e, was observed <strong>and</strong> a potential dock<strong>in</strong>g site of the<br />
photodissociated CO molecule <strong>in</strong> the heme pocket identified.<br />
Although the maps provided h<strong>in</strong>ts of small structural changes<br />
associated with glob<strong>in</strong> relaxation, they could not be unambiguously<br />
detected <strong>and</strong> their time evolution was uncerta<strong>in</strong>.<br />
We report here results from further nanosecond timeresolved<br />
studies of MbCO photolysis. The goal of these new<br />
measurements was 3-fold: to obta<strong>in</strong> difference maps with a<br />
higher signal-to-noise (S/N) ratio that can reveal more clearly<br />
small structural changes; to exam<strong>in</strong>e structural changes <strong>in</strong><br />
the time <strong>in</strong>terval between 4 ns <strong>and</strong> 1 µs, not covered by our<br />
previous data; <strong>and</strong> to exam<strong>in</strong>e sufficient time delays to enable<br />
the time evolution of significant structural features to be<br />
identified <strong>and</strong> modeled. An improved data collection strategy<br />
resulted <strong>in</strong> better raw data, <strong>and</strong> data process<strong>in</strong>g was<br />
significantly improved. Careful global scal<strong>in</strong>g of the data<br />
from different crystals <strong>and</strong> different experiments, application<br />
of an improved weight<strong>in</strong>g method for the difference structure<br />
factor amplitudes, <strong>and</strong> <strong>in</strong>troduction of a novel difference<br />
electron density modification technique (Z. Ren et al.,<br />
unpublished results) result <strong>in</strong> a substantially enhanced signalto-noise<br />
ratio <strong>in</strong> the f<strong>in</strong>al difference Fourier maps. Data at<br />
additional time delays allow us to exam<strong>in</strong>e the cont<strong>in</strong>uity of<br />
the difference electron density features <strong>in</strong> time. Identification<br />
of noise levels enables us to assess the significance of small<br />
structural changes. The improved quality of the maps <strong>and</strong><br />
better coverage <strong>in</strong> time reveal small <strong>and</strong> subtle prote<strong>in</strong><br />
conformational changes that were undetectable <strong>in</strong> our previous<br />
studies <strong>and</strong> enable us to model the overall course of the<br />
reaction.<br />
MATERIALS AND METHODS<br />
Preparation of Crystals, Photolysis, <strong>and</strong> X-ray Data<br />
Collection. Sperm whale metMb crystals were grown <strong>in</strong> the<br />
P2 1 monocl<strong>in</strong>ic form at pH 6 (33). Crystals were converted<br />
to MbCO as described by Teng et al. (34). Crystals were<br />
sealed <strong>in</strong> capillaries <strong>in</strong> air. Reoxidation to metMb was<br />
prevented by mount<strong>in</strong>g the crystals quickly (<strong>in</strong> 10-20 s) <strong>and</strong><br />
by plac<strong>in</strong>g a saturated solution of sodium dithionite <strong>in</strong> the<br />
capillary prior to seal<strong>in</strong>g it. Once mounted, crystals were<br />
stable <strong>in</strong> the MbCO form for months as confirmed by<br />
measur<strong>in</strong>g their optical spectra by a microspectrophotometer<br />
(35). Crystals were mounted 1 or 2 weeks <strong>in</strong> advance <strong>and</strong><br />
their spectra rout<strong>in</strong>ely checked a few days before the X-ray<br />
data collection. Only crystals with a metMb content of e5%<br />
were used for data collection. Typical crystal dimensions<br />
were 450 µm × 350 µm × 100 µm.<br />
Crystals were photolyzed by 7.5 ns laser pulses at 630<br />
nm. Pulses were produced by a Nd:YAG pumped dye laser<br />
(Cont<strong>in</strong>uum NY61-10/ND60) with the DCM dye. Nonpolarized<br />
laser light was delivered to the sample by an optical<br />
fiber. The light was focused to a 1.5 mm diameter spot at<br />
the crystal. S<strong>in</strong>ce this focal spot was substantially larger than<br />
the crystal, transverse gradients of light <strong>in</strong>tensity <strong>and</strong><br />
photochemistry were m<strong>in</strong>imized. A total laser pulse energy<br />
of ∼5 mJ was used for photolysis, but less than 0.1 mJ (or<br />
2%) of the laser pulse energy was actually absorbed by a<br />
typical crystal due to its small size <strong>and</strong> low optical density<br />
at 630 nm. The wavelength was chosen to ensure that the<br />
optical density of the crystals was
13804 Biochemistry, Vol. 40, No. 46, 2001 Šrajer et al.<br />
Table 1: Crystallographic Data Collection Parameters<br />
crystal<br />
state<br />
laser/X-ray<br />
time delay<br />
laser energy<br />
(mJ)<br />
<strong>in</strong>sertion device<br />
<strong>and</strong> mode a<br />
no. of images<br />
per data set<br />
angular <strong>in</strong>crement<br />
(deg)<br />
no. of X-ray exposures<br />
per image<br />
1 Mb* 1 ns 5.5 W70+U46/sb § 42 4.5 15 2<br />
2 Mb* 4 ns
Time-Resolved Crystallographic Study of Myoglob<strong>in</strong> Biochemistry, Vol. 40, No. 46, 2001 13805<br />
Table 2: Data Reduction Statistics<br />
crystal<br />
delay<br />
<strong>in</strong>tegration<br />
limit (Å)<br />
R(F 2 )<br />
(%)<br />
R(|F|)<br />
(%)<br />
s<strong>in</strong>gle reflections<br />
no. of<br />
observations<br />
no. of unique<br />
reflections<br />
redundancy<br />
no. of unique<br />
reflections<br />
s<strong>in</strong>gle <strong>and</strong> harmonic reflections<br />
overall<br />
completeness a<br />
(%)<br />
last shell<br />
completeness<br />
(%)<br />
1 1 ns 1.7 10.8 7.8 90519 11730 7.7 12782 87.0 59.9 (1.78-1.7 Å)<br />
2 4 ns 1.8 10.3 6.8 34801 7289 4.8 8143 66.7 34.7 (1.99-1.9 Å)<br />
3 7 ns 1.6 11.2 7.9 86452 12655 6.8 13913 79.5 39.9 (1.67-1.6 Å)<br />
4 b 7 ns 1.7 12.4 9.2 78331 - - 13079 89.1 66.9 (1.78-1.7 Å)<br />
4 18 ns 1.7 12.8 9.5 73352 - - 12987 88.4 64.9 (1.78-1.7 Å)<br />
4 45 ns 1.7 14.2 9.8 69715 - - 12033 82.1 44.4 (1.78-1.7 Å)<br />
5 90 ns 1.8 10.9 7.9 22887 7902 2.9 9234 74.7 36.4 (1.88-1.8 Å)<br />
5 362 ns 1.8 10.7 7.8 63078 10261 6.1 11020 88.8 58.9 (1.88-1.8 Å)<br />
6 1 µs 1.8 9.8 6.8 34728 7461 4.7 8330 67.5 32.6 (1.99-1.9 Å)<br />
7 1 µs 1.8 8.6 5.8 34241 7292 4.7 8108 66.3 33.9 (1.99-1.9 Å)<br />
8 1.9 µs 2.0 11.1 7.4 36426 6905 5.3 7677 84.9 62.5 (2.09-2.0 Å)<br />
9 7.5 µs 1.8 11.4 7.5 34010 7118 4.8 7932 64.7 29.1 (1.99-1.9 Å)<br />
10 25 µs 1.9 18.0 11.9 55856 7456 7.4 8383 79.8 34.0 (1.99-1.9 Å)<br />
6 50.5 µs 1.8 10.1 6.8 35232 7461 4.7 8280 68.1 32.4 (1.99-1.9 Å)<br />
7 350 µs 1.8 9.2 6.0 34772 7236 4.8 8057 65.9 34.9 (1.99-1.9 Å)<br />
9 1.9 ms 1.8 11.8 7.7 32958 7070 4.7 7871 64.2 26.7 (1.99-1.9 Å)<br />
2 dark 1.8 10.2 6.9 33063 7160 4.6 8032 65.7 35.3 (1.99-1.9 Å)<br />
6 dark 1.8 10.1 6.6 36824 7556 4.9 8351 67.8 33.9 (1.99-1.9 Å)<br />
7 dark 1.8 9.1 5.9 34564 7237 4.8 8053 65.9 32.8 (1.99-1.9 Å)<br />
9 dark 1.8 10.7 7.0 35497 7189 4.9 8058 65.7 29.1 (1.99-1.9 Å)<br />
11 dark 1.7 7.7 5.5 90916 11889 7.6 12387 84.7 37.9 (1.78-1.7 Å)<br />
a<br />
Overall completeness to the <strong>in</strong>tegration limit. b The crystal 4 data sets had to be divided <strong>in</strong>to two parts that were scaled separately <strong>and</strong> merged<br />
after the harmonic deconvolution. The <strong>in</strong>formation about unique s<strong>in</strong>gle reflections <strong>and</strong> their redundancy is therefore not available.<br />
where the estimate of the st<strong>and</strong>ard deviation σ |∆F(t)| may be<br />
erroneous. In data sets of somewhat poorer quality <strong>and</strong> for<br />
those with a weaker signal, the effect of weight<strong>in</strong>g is to<br />
greatly <strong>in</strong>crease the signal-to-noise ratio. In such cases,<br />
weight<strong>in</strong>g makes a critical difference between not observ<strong>in</strong>g<br />
<strong>and</strong> confidently observ<strong>in</strong>g the signal, as illustrated <strong>in</strong> Figure<br />
1. The figure shows a st<strong>and</strong>ard, nonweighted difference omit<br />
map (Figure 1a) <strong>and</strong> a weighted map (Figure 1b) of the heme<br />
region, at a time delay of 50.5 µs. Each map is contoured at<br />
the value of (3σ appropriate to that map, where σ is the<br />
rms value of the difference electron density ∆F across the<br />
entire asymmetric unit. This contour<strong>in</strong>g procedure ensures<br />
that the signal is displayed <strong>in</strong> a consistent manner relative<br />
to the noise for all maps. As discussed below, the σ value<br />
for each map is primarily determ<strong>in</strong>ed by the noise. The<br />
negative feature above the heme <strong>in</strong> both maps corresponds<br />
to the loss of the bound CO molecule upon photolysis. In<br />
the st<strong>and</strong>ard map, this feature is barely significant at -3.3σ,<br />
while <strong>in</strong> the weighted map, the same feature is quite<br />
prom<strong>in</strong>ent <strong>and</strong> clearly significant at -5.7σ.<br />
In a further attempt to improve the signal-to-noise ratio<br />
<strong>in</strong> difference maps, we applied a density modification method<br />
to the difference electron density maps (Z. Ren et al.,<br />
unpublished results; 38). We refer to this method as the<br />
isomorphous noise suppression (INS) method. The method<br />
modifies both the amplitudes <strong>and</strong> phases of the difference<br />
structure factors. St<strong>and</strong>ard difference maps are calculated<br />
us<strong>in</strong>g phases derived from the known MbCO structure, s<strong>in</strong>ce<br />
the true phases for the difference structure factors are not<br />
known. The known <strong>and</strong> true phases are <strong>in</strong> general completely<br />
uncorrelated (39). The INS method derives a new set of<br />
amplitudes <strong>and</strong> phases for the difference structure factors<br />
by modify<strong>in</strong>g the <strong>in</strong>itially calculated difference electron<br />
density accord<strong>in</strong>g to the follow<strong>in</strong>g protocol. Difference<br />
density was not modified if it was with<strong>in</strong> 3Åofanyatom<br />
of residues 42-46 (CD loop), 58-70 (part of the E helix),<br />
<strong>and</strong> 80-107 (part of the EF loop, the F helix, the FG loop,<br />
<strong>and</strong> part of the G helix) or with<strong>in</strong> 5Åofanyheme, CO, or<br />
solvent SO 4 atoms. For all rema<strong>in</strong><strong>in</strong>g regions of the prote<strong>in</strong>,<br />
the difference density was reduced to 62% of its <strong>in</strong>itial value.<br />
In the solvent region, the difference density was set to zero.<br />
The solvent region is def<strong>in</strong>ed as locations more than 4 Å<br />
from any prote<strong>in</strong>, heme, CO, SO 4 ,orH 2 O atoms, <strong>and</strong> from<br />
the four Xe b<strong>in</strong>d<strong>in</strong>g sites (4). The difference density<br />
modification with<strong>in</strong> the boundaries of the prote<strong>in</strong> has the<br />
effect of enhanc<strong>in</strong>g the signal <strong>and</strong> reduc<strong>in</strong>g the noise <strong>in</strong> those<br />
regions where the most significant structural differences are<br />
expected <strong>and</strong> where difference density was not altered. A<br />
Fourier transform of the modified difference electron density<br />
map provides new amplitude <strong>and</strong> phase <strong>in</strong>formation for the<br />
difference structure factors. Difference structure factors were<br />
then further modified <strong>in</strong> several iterations accord<strong>in</strong>g to the<br />
estimated st<strong>and</strong>ard deviations of the measured difference<br />
amplitudes (Z. Ren et al., unpublished results). When<br />
convergence was achieved, the f<strong>in</strong>al difference structure<br />
factors were Fourier transformed to yield improved difference<br />
electron density maps. We refer to this type of map as an<br />
INS difference map. Improvement <strong>in</strong> the S/N ratio as a result<br />
of the INS procedure complements the improvement result<strong>in</strong>g<br />
from the weight<strong>in</strong>g procedure, <strong>and</strong> both contribute to the<br />
S/N enhancement. In the case of the 50.5 µs difference map<br />
shown <strong>in</strong> Figure 1, a major S/N improvement is accomplished<br />
by the weight<strong>in</strong>g procedure (-3.3σ to -5.7σ)<br />
but only a m<strong>in</strong>or further improvement by the subsequent INS<br />
procedure (-5.7σ to -6σ; figure not shown). In the case of<br />
some other maps, however, the INS produces a more marked<br />
improvement.<br />
The difference Fourier maps we present are identified as<br />
either weighted omit difference maps or weighted omit INS<br />
difference maps. When exam<strong>in</strong><strong>in</strong>g the heme <strong>and</strong> adjacent<br />
regions where a signal is likely to be observed, we used<br />
weighted omit INS difference maps to enhance the signal
13806 Biochemistry, Vol. 40, No. 46, 2001 Šrajer et al.<br />
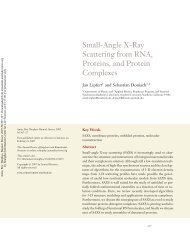
FIGURE 1: Mb* m<strong>in</strong>us MbCO difference map of the heme region<br />
at 50.5 µs calculated us<strong>in</strong>g st<strong>and</strong>ard structure factor difference<br />
amplitudes (a) <strong>and</strong> weighted (eq 1) difference amplitudes (b). Maps<br />
are calculated to 1.8 Å resolution <strong>and</strong> contoured at (3σ. Negative<br />
density (loss of electrons) is shown <strong>in</strong> red <strong>and</strong> positive density (ga<strong>in</strong><br />
of electrons) <strong>in</strong> blue, <strong>in</strong> this <strong>and</strong> all subsequent difference maps.<br />
All maps were generated us<strong>in</strong>g XtalView <strong>and</strong> Raster 3D (51, 52).<br />
<strong>and</strong> determ<strong>in</strong>e its time course. When check<strong>in</strong>g more remote<br />
prote<strong>in</strong> regions for potential signal, we used weighted omit<br />
difference maps for which the orig<strong>in</strong>al electron density has<br />
not been modified anywhere with<strong>in</strong> the prote<strong>in</strong>. We cannot<br />
use INS maps <strong>in</strong> this case s<strong>in</strong>ce the weak signal, if present,<br />
would have been reduced <strong>in</strong> magnitude <strong>in</strong> the regions where<br />
electron density was modified <strong>in</strong> the INS maps.<br />
Time Course of Structural Changes. The time course of<br />
structural changes can be described by empirical, structural<br />
rate constants. In the general case, the observed structure at<br />
any time delay represents a mixture of structurally dist<strong>in</strong>ct,<br />
time-<strong>in</strong>dependent <strong>in</strong>termediates whose concentrations vary<br />
with time (30, 40). The ultimate goal of the analysis of timeresolved<br />
data is to determ<strong>in</strong>e structures of the time<strong>in</strong>dependent<br />
<strong>in</strong>termediates, based on these empirical rates<br />
<strong>and</strong> a proposed reaction scheme. This approach applies only<br />
if a chemical k<strong>in</strong>etic model holds (32) <strong>and</strong> is practically<br />
feasible only when there is a limited number of structural<br />
<strong>in</strong>termediates whose peak populations are relatively wellseparated<br />
<strong>in</strong> time. If, however, a more complex model holds<br />
<strong>in</strong> which structural changes are localized <strong>and</strong> many parts of<br />
the molecule change with their own, not very different rates,<br />
the hypothesis of dist<strong>in</strong>ct, time-<strong>in</strong>dependent structural <strong>in</strong>termediates<br />
breaks down. A simple chemical k<strong>in</strong>etic model<br />
implies that experimental observables will vary <strong>in</strong> time as a<br />
sum of exponentials, but a more complex model will yield<br />
a stretched-exponential variation.<br />
The time course of structural changes can <strong>in</strong> pr<strong>in</strong>ciple be<br />
exam<strong>in</strong>ed both <strong>in</strong> real <strong>and</strong> <strong>in</strong> reciprocal space. By the Fourier<br />
transform relationship, the contributions of each structural<br />
change are always distributed throughout reciprocal space<br />
even when they are tightly localized <strong>in</strong> real space. The overall<br />
changes <strong>in</strong> time <strong>in</strong> the structure factor amplitudes are,<br />
therefore, expected to be small <strong>and</strong> prone to be masked by<br />
noise even when the real space structural changes are<br />
relatively large but localized. On the other h<strong>and</strong>, even very<br />
small structural changes can be clearly detected <strong>in</strong> real space<br />
when they are localized, despite noise <strong>in</strong> the measured<br />
structure factor amplitudes. It is evidently preferable to follow<br />
the time evolution <strong>in</strong> real space rather than reciprocal space.<br />
We therefore extracted the empirical rates of structural<br />
changes by exam<strong>in</strong><strong>in</strong>g difference electron density maps rather<br />
than structure factor amplitudes.<br />
Visual <strong>in</strong>spection of the time sequence of maps immediately<br />
<strong>in</strong>dicates the regions of the molecule that exhibit<br />
major structural changes. We identify significant features <strong>in</strong><br />
these regions, <strong>in</strong>tegrate their electron density, <strong>and</strong> fit the time<br />
course of their electron content with an appropriate mathematical<br />
function, typically a sum of exponentials or<br />
stretched exponentials (see the Results <strong>and</strong> Discussion). S<strong>in</strong>ce<br />
the fit function <strong>in</strong>terpolates between data po<strong>in</strong>ts <strong>in</strong> time, a<br />
molecular movie can be constructed. The movie is constructed<br />
by apply<strong>in</strong>g the rates identified from the real space<br />
fit of highly significant features to fit all structure factor<br />
amplitudes <strong>in</strong> reciprocal space, as a (cont<strong>in</strong>uous) function<br />
of time. Each frame of the movie is then obta<strong>in</strong>ed by Fourier<br />
transformation of the fitted structure factors at the desired<br />
time po<strong>in</strong>t.<br />
Noise LeVels <strong>and</strong> Significance of Features <strong>in</strong> the Difference<br />
Maps. The difference maps clearly conta<strong>in</strong> substantial noise<br />
<strong>in</strong> addition to a structural signal. Quantitation of the<br />
magnitude of the noise, <strong>and</strong> an underst<strong>and</strong><strong>in</strong>g of how it varies<br />
across the asymmetric unit <strong>and</strong> <strong>in</strong> time, is essential to proper<br />
<strong>in</strong>terpretation of the maps. What features <strong>in</strong> the difference<br />
maps are significant <strong>and</strong> arise from signal rather than noise?<br />
To address this key question quantitatively, we exam<strong>in</strong>ed<br />
the distribution of ∆F <strong>in</strong> the crystallographic asymmetric unit<br />
for our weighted difference maps <strong>and</strong> determ<strong>in</strong>ed that the<br />
distribution is well described by a Gaussian whose st<strong>and</strong>ard<br />
deviation σ does not correlate with the magnitude of the<br />
signal (data not shown). This leads to two conclusions: the<br />
rms value of the difference electron density for the asymmetric<br />
unit is ma<strong>in</strong>ly determ<strong>in</strong>ed by the noise, <strong>and</strong> the noise<br />
is r<strong>and</strong>om. We therefore expect noise above 3σ with a<br />
probability of 0.0027. This, however, still results <strong>in</strong> an<br />
appreciable number of noise features above 3σ <strong>in</strong> a difference<br />
map. For a complete 1.8 Å myoglob<strong>in</strong> data set, for example,<br />
the observed ∼12000 unique reflections result <strong>in</strong> the same<br />
number of <strong>in</strong>dependent difference map grid po<strong>in</strong>ts per<br />
asymmetric unit. It can be then expected that the value of<br />
∆F at 32 grid po<strong>in</strong>ts will exceed 3σ due to r<strong>and</strong>om noise<br />
alone. In the more f<strong>in</strong>ely sampled regular grid we are us<strong>in</strong>g,
Time-Resolved Crystallographic Study of Myoglob<strong>in</strong> Biochemistry, Vol. 40, No. 46, 2001 13807<br />
this could translate <strong>in</strong>to 32 features above 3σ. However, there<br />
will be only about one grid po<strong>in</strong>t above the 4σ level due to<br />
r<strong>and</strong>om noise (probability of 0.000063). Although the ∆F<br />
distribution is well described by a Gaussian, deviations from<br />
the Gaussian distribution due to the signal clearly are present<br />
<strong>in</strong> the data <strong>and</strong> can be detected at the w<strong>in</strong>gs of the distribution<br />
above 3σ. As expected, these deviations dim<strong>in</strong>ish with time<br />
as the signal decays.<br />
A second, important criterion for evaluat<strong>in</strong>g the significance<br />
of a difference electron density feature is based on<br />
whether it occurs at a chemically plausible location. For<br />
example, a negative density directly located on an atom <strong>in</strong><br />
the MbCO structure is more likely to be signal, while positive<br />
density there is not. Positive <strong>and</strong> negative densities flank<strong>in</strong>g<br />
a group of atoms are likely to be signal but, if located far<br />
from any atoms, are likely to be noise.<br />
F<strong>in</strong>ally, a further discrim<strong>in</strong>ation between real features <strong>and</strong><br />
noise can be accomplished by exam<strong>in</strong><strong>in</strong>g the connectivity<br />
of features <strong>in</strong> time. Real features tend to persist <strong>in</strong> time over<br />
several, temporally adjacent maps. In contrast, noise features<br />
tend to be highly variable <strong>and</strong> uncorrelated from map to map.<br />
In addition to provid<strong>in</strong>g <strong>in</strong>formation about the rates of<br />
structural changes <strong>in</strong> the molecule, fitt<strong>in</strong>g of the time course<br />
of real-space features by a mathematical function provides<br />
smooth<strong>in</strong>g <strong>in</strong> the time doma<strong>in</strong>. However, systematic features<br />
that do not represent signal could also be present <strong>in</strong><br />
temporally adjacent maps <strong>and</strong> cannot be elim<strong>in</strong>ated this way.<br />
In the case of the <strong>in</strong>tegrated electron content of a feature<br />
<strong>in</strong> a difference density map, additional sources of error need<br />
to be considered. A problem arises <strong>in</strong> def<strong>in</strong><strong>in</strong>g the exact<br />
boundaries of a feature s<strong>in</strong>ce they may vary with time due<br />
to the noise. In most cases, we identified the boundary <strong>and</strong><br />
position of the <strong>in</strong>tegration region of a feature by exam<strong>in</strong><strong>in</strong>g<br />
the map where the feature is most prom<strong>in</strong>ent, <strong>and</strong> then kept<br />
the boundary <strong>and</strong> position constant over all maps. In more<br />
complicated cases, the location of a feature may shift with<br />
time, <strong>in</strong>dicat<strong>in</strong>g a further structural change, or another feature<br />
may extend <strong>in</strong>to the region formerly occupied by the feature<br />
of <strong>in</strong>terest.<br />
To estimate the errors associated with the <strong>in</strong>tegrated<br />
electron content of features we consider to be signal, we<br />
<strong>in</strong>tegrated regions of the same size at r<strong>and</strong>om locations <strong>in</strong><br />
the unit cell <strong>and</strong> exam<strong>in</strong>ed the distributions of the values<br />
that we obta<strong>in</strong>ed. We f<strong>in</strong>d these distributions also to be well<br />
described by a Gaussian form (data not shown). Hence, we<br />
def<strong>in</strong>e the error of the <strong>in</strong>tegrated electron content of the signal<br />
features as the st<strong>and</strong>ard deviation of such a distribution. This<br />
st<strong>and</strong>ard deviations are presented as error bars <strong>in</strong> Figures<br />
5-7 <strong>and</strong> 8a.<br />
RESULTS<br />
One Nanosecond Difference Map: The Earliest Photo<strong>in</strong>duced<br />
Structural Changes. The weighted omit INS difference<br />
Fourier map of the heme region <strong>and</strong> two adjacent E (distal)<br />
<strong>and</strong> F (proximal) helices at 1 ns is shown <strong>in</strong> Figure 2a. The<br />
reference map (∆F ) |F deoxyMb | - |F MbCO |) is shown for<br />
comparison <strong>in</strong> Figure 2b. This map was calculated to the<br />
same, 1.8 Å resolution us<strong>in</strong>g the high-resolution 1BZP<br />
deoxyMb <strong>and</strong> 1BZR MbCO PDB models (25) <strong>and</strong> reflections<br />
that match the observed reflections of the MbCO data set<br />
(crystal 11).<br />
FIGURE 2: (a) Difference Fourier map of the heme region at a1ns<br />
laser/X-ray pulse time delay. The weighted omit INS map is<br />
calculated to 1.8 Å resolution <strong>and</strong> contoured at (3.4σ. Near-atomic<br />
resolution models (1.15 Å) from PDB entries 1BZR (MbCO) <strong>and</strong><br />
1BZP (deoxyMb) (25), are shown <strong>in</strong> red <strong>and</strong> blue, respectively.<br />
The strongest features represent the loss of the CO-bound lig<strong>and</strong><br />
(CO), the Fe displacement from the heme plane (Fe), the proximal<br />
histid<strong>in</strong>e displacement toward the F helix (P), the sw<strong>in</strong>g of the distal<br />
histid<strong>in</strong>e toward the bound CO location (D), <strong>and</strong> the location of<br />
the photodissociated lig<strong>and</strong> (CO*). Other smaller features <strong>in</strong>dicate<br />
changes at the heme <strong>and</strong> displacement of E <strong>and</strong> F helices. These<br />
features are labeled H1-H3, EH1-EH6, <strong>and</strong> FH1-FH6, respectively.<br />
(b) Reference difference Fourier map calculated from 1BZP<br />
<strong>and</strong> 1BZR. The map is calculated to 1.8 Å resolution <strong>and</strong> contoured<br />
at (3.2σ.<br />
As <strong>in</strong> the 4 ns difference map (28), the most significant<br />
features <strong>in</strong> the 1 ns map are a large negative density at the<br />
CO-bound location, labeled CO, <strong>and</strong> a large positive density<br />
below the heme, labeled Fe. The highly significant negative<br />
density, at -14.2σ <strong>in</strong> this INS difference map, represents<br />
loss of the bound CO molecule upon photolysis. The extent<br />
of photolysis was estimated by compar<strong>in</strong>g the <strong>in</strong>tegrated<br />
electron content of this feature with that of the correspond<strong>in</strong>g
13808 Biochemistry, Vol. 40, No. 46, 2001 Šrajer et al.<br />
FIGURE 3: INS difference map of the heme region at 1 ns, contoured<br />
at (3.4σ. The MbCO <strong>and</strong> deoxyMb models (26) are shown <strong>in</strong> red<br />
<strong>and</strong> blue, respectively. Heme pyrrole r<strong>in</strong>gs are labeled PA, PB, PC,<br />
<strong>and</strong> PD. (a) The map is viewed along the Fe-His93 bond. The<br />
shape of the positive, Fe-associated electron density below the heme<br />
<strong>in</strong>dicates the direction of the heme translation from pyrrole C to<br />
pyrrole A, <strong>and</strong> toward pyrrole B. (b) Map viewed along the NB-<br />
ND axis. Differences between high-resolution MbCO <strong>and</strong> deoxyMb<br />
models (26) <strong>in</strong>volve tilt<strong>in</strong>g of the heme, downward motion of the<br />
proximal His93, <strong>and</strong> sw<strong>in</strong>g<strong>in</strong>g of the distal His64.<br />
feature <strong>in</strong> the reference map (Figure 2b). Consistent with<br />
the 4 ns results (28), we f<strong>in</strong>d that 40 ( 10% of the MbCO<br />
molecules <strong>in</strong> the crystal are photolyzed at 1 ns.<br />
The large positive feature labeled Fe, at +9.7σ, results<br />
from the accompany<strong>in</strong>g motion of the Fe atom out of the<br />
heme plane upon photolysis. Its magnitude is also consistent<br />
with ∼40% photolysis. Part of the negative CO-labeled feature<br />
closest to the heme also arises from the Fe motion; these<br />
positive <strong>and</strong> negative features are coupled. Notably, the positive<br />
Fe feature is not located on the heme normal that passes<br />
through the iron position <strong>in</strong> MbCO but is displaced from it,<br />
<strong>in</strong>dicat<strong>in</strong>g the direction of the overall Fe <strong>and</strong> heme motion.<br />
Two views of the heme <strong>in</strong> MbCO are shown <strong>in</strong> panels a <strong>and</strong><br />
b of Figure 3: look<strong>in</strong>g along the Fe-His93 NE2 bond<br />
(Figure 3a) <strong>and</strong> look<strong>in</strong>g along the pyrrole NB-ND axis<br />
(Figure 3b). The features <strong>in</strong> the difference map are consistent<br />
<strong>in</strong> magnitude <strong>and</strong> location with those aris<strong>in</strong>g from heme tilt<br />
<strong>and</strong> translation <strong>in</strong> go<strong>in</strong>g from the MbCO structure (shown<br />
<strong>in</strong> red) to deoxyMb (blue) (25). The motion is described as<br />
a4° tilt of the nitrogen plane around the NB-ND axis <strong>and</strong><br />
a 0.19 Å translation <strong>in</strong> the direction from pyrrole r<strong>in</strong>g C to<br />
A. The location of the Fe density <strong>in</strong> our difference map<br />
(Figure 3a) <strong>in</strong>dicates that heme motion upon loss of lig<strong>and</strong><br />
occurs ma<strong>in</strong>ly <strong>in</strong> the direction from NC to NA. The Fe<br />
density is, however, also displaced toward the pyrrole B,<br />
with the highest density located <strong>in</strong> the A/B quadrant of the<br />
heme. Several other features also <strong>in</strong>dicate heme motion: two<br />
positive features, H1 <strong>and</strong> H2 (Figures 2a <strong>and</strong> 3), above the<br />
heme plane <strong>and</strong> weaker, negative densities at the rim of the<br />
heme. They are consistent with the tilt of the heme plane<br />
around the NB-ND axis, <strong>in</strong> which the C-pyrrole r<strong>in</strong>g (beh<strong>in</strong>d<br />
the CO feature <strong>in</strong> Figure 2a) moves toward the distal side,<br />
as also more clearly shown <strong>in</strong> Figure 3b. The H1 <strong>and</strong> H2<br />
features co<strong>in</strong>cide with the extended positive density above<br />
the heme plane <strong>and</strong> beh<strong>in</strong>d the CO feature <strong>in</strong> the reference<br />
map (Figure 2b). In summary, heme features observed <strong>in</strong><br />
the 1 ns map <strong>in</strong>dicate that heme translation <strong>and</strong> rotation<br />
occurred by 1 ns <strong>and</strong> that these heme motions are consistent<br />
with the static structures of MbCO <strong>and</strong> deoxyMb.<br />
Motion of the distal histid<strong>in</strong>e, His64, toward the location<br />
formerly occupied by the CO lig<strong>and</strong> is represented by a<br />
positive feature labeled D (5.1σ) <strong>in</strong> Figures 2a <strong>and</strong> 3b. The<br />
<strong>in</strong>tegrated electron content of this positive feature as<br />
compared to the correspond<strong>in</strong>g feature <strong>in</strong> the reference map<br />
(Figure 2b) also suggests ∼40% photolysis.<br />
A positive feature at 4.6σ, labeled CO*, is present <strong>in</strong> the<br />
distal, lig<strong>and</strong> pocket at the location identical to that of the<br />
feature noted earlier (28) <strong>and</strong> proposed to represent a dock<strong>in</strong>g<br />
site of the outgo<strong>in</strong>g, photodissociated CO molecule. The<br />
feature (Figure 4) is located 2.18 Å from the O atom of the<br />
bound CO molecule <strong>in</strong> the 1BZR MbCO structure (25), <strong>and</strong><br />
∼1 Å away from the site of the water molecule <strong>in</strong> the<br />
deoxyMb distal pocket (red ball, labeled O <strong>in</strong> Figure 4) <strong>and</strong><br />
from the center of the photodissociated CO molecule at 40<br />
K (green bar <strong>in</strong> Figure 4; 35). Side cha<strong>in</strong>s flank<strong>in</strong>g this distal<br />
pocket dock<strong>in</strong>g site <strong>in</strong>clude Val68, Leu29, Ile107, <strong>and</strong> Phe43<br />
(Figure 4). By compar<strong>in</strong>g the magnitudes of the CO <strong>and</strong> CO*<br />
features of the 1 ns map, we conclude that at 1 ns the CO*<br />
dock<strong>in</strong>g site conta<strong>in</strong>s ∼45% of the photodissociated CO<br />
molecules, that is, ∼22% of the total number of CO<br />
molecules. This estimate is an upper limit which assumes<br />
that only the more distal part of the peanut-shaped COlabeled<br />
feature arises from loss of the CO molecule, while<br />
the lower part arises from the Fe displacement.<br />
The weighted omit INS difference electron density maps<br />
allow us to unambiguously detect more subtle but essential<br />
structural changes <strong>in</strong> the glob<strong>in</strong> that were not clearly observed<br />
<strong>in</strong> the earlier maps (28). Several features, labeled FH1-FH6,<br />
with the largest feature (FH4) at -5.6σ, <strong>in</strong>dicate that by 1<br />
ns the entire F helix is already displaced, at least partially,<br />
as a result of the Fe displacement from the heme plane. The<br />
correspond<strong>in</strong>g downward motion of the proximal histid<strong>in</strong>e<br />
His93 is itself <strong>in</strong>dicated by the negative feature, labeled P.<br />
The features <strong>in</strong>dicat<strong>in</strong>g the F helix motion are adjacent to<br />
the ma<strong>in</strong> cha<strong>in</strong> carbonyl oxygens of Lys87 (labeled FH1),<br />
Pro88 (FH2), Ala90 (FH3), Ala94 (FH4), <strong>and</strong> His93 (FH5).
Time-Resolved Crystallographic Study of Myoglob<strong>in</strong> Biochemistry, Vol. 40, No. 46, 2001 13809<br />
FIGURE 5: Time course of the <strong>in</strong>tegrated electron content of the<br />
CO <strong>and</strong> Fe-associated features from the weighted omit INS<br />
difference maps. A fit of both features by an exponential [C 1 exp-<br />
(-k 1 t)] is shown as dotted <strong>and</strong> dashed l<strong>in</strong>e, with a k 1 of 5.1 × 10 3<br />
s -1 . A stretched-exponential fit [C 2 exp(-k 2 t) β ] with a k 2 of 4.6 ×<br />
10 3 s -1 <strong>and</strong> a β of 0.53 is shown as dotted l<strong>in</strong>e. A fit by a function<br />
C 3 /(1 + k 3 t) that represents bimolecular reb<strong>in</strong>d<strong>in</strong>g under conditions<br />
of comparable lig<strong>and</strong> <strong>and</strong> prote<strong>in</strong> concentrations is shown as a<br />
dashed l<strong>in</strong>e, with a k 3 of 9.0 × 10 3 s -1 . The fit that best describes<br />
the data is the sum of stretched-exponential (k 2 ) 2.9 × 10 7 s -1<br />
<strong>and</strong> β ) 0.32; 22%) <strong>and</strong> bimolecular (k 3 ) 6.7 × 10 3 s -1 ; 78%)<br />
functions <strong>and</strong> is shown as a solid l<strong>in</strong>e. The error bars <strong>in</strong> this figure<br />
<strong>and</strong> Figures 6, 7, <strong>and</strong> 8a were obta<strong>in</strong>ed as described <strong>in</strong> Materials<br />
<strong>and</strong> Methods.<br />
FIGURE 4: Dock<strong>in</strong>g site of the photodissociated CO molecule <strong>in</strong><br />
the distal pocket. Distances (<strong>in</strong> angstroms) from the closest residues<br />
<strong>and</strong> from the O of the bound CO molecule are shown for 1BZR.<br />
The heme pocket water molecule of the deoxy structure is shown<br />
as a red ball, labeled O. The location of the photodissociated CO<br />
molecule at 40 K (35) is shown as a green bar. Two views of the<br />
site are shown <strong>in</strong> panels a <strong>and</strong> b.<br />
Both positive <strong>and</strong> negative features exceed<strong>in</strong>g 3σ are<br />
observed for Pro88 (FH2) <strong>and</strong> Ala90 (FH3), clearly <strong>in</strong>dicat<strong>in</strong>g<br />
a downward motion of the F helix backbone, consistent<br />
with the static MbCO <strong>and</strong> deoxyMb structures (25). Several<br />
features on the distal side <strong>in</strong>dicate that by 1 ns the distal E<br />
helix has also moved down, toward the heme plane. The<br />
features labeled EH1-EH6 are aga<strong>in</strong> adjacent to carbonyl<br />
oxygens or amide nitrogens: His64 N (labeled EH1), Lys63<br />
N (EH2), His64 O (EH3), Val66 N (EH4), Val68 N (EH5),<br />
<strong>and</strong> Thr70 O (EH6).<br />
Another relatively strong positive feature labeled V (Figure<br />
2a) <strong>in</strong> the distal pocket suggests motion of the side cha<strong>in</strong> of<br />
Val68 toward the heme plane, as might be expected upon<br />
loss of lig<strong>and</strong>. Such a strong feature is, however, absent <strong>in</strong><br />
the reference map (Figure 2b). An alternative explanation is<br />
that feature V represents a second dock<strong>in</strong>g site for CO <strong>in</strong><br />
the distal pocket. It is, however, located close to the Val68<br />
side cha<strong>in</strong>. To accommodate a photodissociated CO molecule<br />
at this location, the side cha<strong>in</strong> of Val68 would have to be<br />
displaced, but the maps do not reveal a strong signal<br />
<strong>in</strong>dicat<strong>in</strong>g this displacement.<br />
EVolution of Structural Changes from 1 ns to 1 ms. Unlike<br />
our previously reported data (28), the data presented here<br />
consist of a relatively complete series of difference electron<br />
density maps spann<strong>in</strong>g time delays from 1 ns to 1.9 ms. We<br />
can therefore exam<strong>in</strong>e the time evolution of structural<br />
changes <strong>in</strong> more detail. When explor<strong>in</strong>g lig<strong>and</strong> reb<strong>in</strong>d<strong>in</strong>g or<br />
the lifetime of the distal pocket CO* dock<strong>in</strong>g site, we extracted<br />
the time courses from weighted omit INS maps. For<br />
other structural changes that are more remote from the heme,<br />
we use weighted omit maps (see Materials <strong>and</strong> Methods).<br />
Lig<strong>and</strong> Reb<strong>in</strong>d<strong>in</strong>g. Lig<strong>and</strong> reb<strong>in</strong>d<strong>in</strong>g reduces the magnitude<br />
of all features <strong>in</strong> the Mb*(t) m<strong>in</strong>us MbCO difference electron<br />
density maps <strong>and</strong> has to be taken <strong>in</strong>to account when the time<br />
evolution of any feature is exam<strong>in</strong>ed. Lig<strong>and</strong> reb<strong>in</strong>d<strong>in</strong>g<br />
k<strong>in</strong>etics can be directly monitored through the decay of the<br />
negative feature labeled CO, associated with the loss of the<br />
bound CO molecule. As already discussed above, this feature<br />
partly arises from the Fe motion, which also generates the<br />
positive feature labeled Fe. S<strong>in</strong>ce it is difficult to separate<br />
the CO-labeled feature <strong>in</strong>to CO <strong>and</strong> Fe contributions, we<br />
exam<strong>in</strong>e the time course of the <strong>in</strong>tegrated electron content<br />
of the entire feature <strong>and</strong> compare it with the time course of<br />
the Fe-labeled feature <strong>in</strong> Figure 5. With<strong>in</strong> the noise of the<br />
data, both features follow the same time course. To assess<br />
the time course of CO reb<strong>in</strong>d<strong>in</strong>g, we fit the two features<br />
jo<strong>in</strong>tly by three separate functions that could represent lig<strong>and</strong><br />
reb<strong>in</strong>d<strong>in</strong>g k<strong>in</strong>etics <strong>in</strong> the crystal: a s<strong>in</strong>gle exponential [C 1<br />
exp(-k 1 t)], a stretched exponential [C 2 exp(-k 2 t) β ], <strong>and</strong> a<br />
function of the type C 3 /(1 + k 3 t), where k 1 -k 3 are rate<br />
coefficients <strong>and</strong> C 1 -C 3 <strong>and</strong> β are constants. A s<strong>in</strong>gleexponential<br />
or a stretched-exponential function would be<br />
expected to describe gem<strong>in</strong>ate reb<strong>in</strong>d<strong>in</strong>g, <strong>in</strong> which the CO
13810 Biochemistry, Vol. 40, No. 46, 2001 Šrajer et al.<br />
molecule does not exit <strong>in</strong>to the solvent but reb<strong>in</strong>ds to the<br />
same heme it left. A stretched-exponential nature of this<br />
process could result from prote<strong>in</strong> fluctuations or prote<strong>in</strong><br />
relaxations that occur on the same time scale as lig<strong>and</strong><br />
reb<strong>in</strong>d<strong>in</strong>g, or from multiple lig<strong>and</strong> dock<strong>in</strong>g sites or multiple<br />
conformations of the glob<strong>in</strong> (see the Discussion). The third<br />
function represents bimolecular lig<strong>and</strong> reb<strong>in</strong>d<strong>in</strong>g from the<br />
solvent under conditions of comparable lig<strong>and</strong> <strong>and</strong> prote<strong>in</strong><br />
concentrations, as is the case <strong>in</strong> the crystals. The fit<br />
parameters obta<strong>in</strong>ed for these three cases are listed <strong>in</strong> the<br />
legend of Figure 5. The slight slope <strong>in</strong> the data at early times<br />
(
Time-Resolved Crystallographic Study of Myoglob<strong>in</strong> Biochemistry, Vol. 40, No. 46, 2001 13811<br />
<strong>in</strong>itial photolysis at the 1 ns time delay. The comparison then<br />
<strong>in</strong>dicates that the amplitude of the F helix features <strong>in</strong> the 1<br />
ns map is 65 ( 20% of the amplitude of the same features<br />
<strong>in</strong> the reference map. The possibility that some helix<br />
relaxation cont<strong>in</strong>ues dur<strong>in</strong>g lig<strong>and</strong> reb<strong>in</strong>d<strong>in</strong>g therefore cannot<br />
be ruled out.<br />
To explore whether the CO molecule occupies any of Xe<br />
b<strong>in</strong>d<strong>in</strong>g sites after photodissociation, we exam<strong>in</strong>ed the<br />
weighted omit difference maps. Figure 8a shows the time<br />
dependence of the <strong>in</strong>tegrated difference electron content<br />
with<strong>in</strong> a sphere with a 1.5 Å radius at each of the four Xe<br />
sites (4). The Xe 2, Xe 3, <strong>and</strong> Xe 4 sites do not show any<br />
positive density above the noise at any time po<strong>in</strong>t. However,<br />
the Xe 1 site clearly shows a positive signal whose magnitude<br />
peaks at ∼100 ns <strong>and</strong> decays to half of its peak value <strong>in</strong><br />
several microseconds. This site is located below the heme<br />
<strong>in</strong> the proximal pocket, flanked by residues Leu89, Ala90,<br />
His93, Leu104, Phe138, <strong>and</strong> Ile142.<br />
The side cha<strong>in</strong> of one of the neighbor<strong>in</strong>g residues of the<br />
Xe 1 site, Leu89, exhibits a structural rearrangement<br />
simultaneous with the appearance of the positive Xe 1<br />
difference density. This rearrangement is <strong>in</strong>dicated by both<br />
positive <strong>and</strong> negative features <strong>in</strong> the difference map as shown<br />
<strong>in</strong> Figure 8b for the 362 ns time delay. The time dependence<br />
of the magnitude of the Leu89 features exactly follows that<br />
of the positive Xe 1 feature as shown <strong>in</strong> Figure 8a. The<br />
features are consistent with the static, deoxyMb <strong>and</strong> MbCO<br />
structures (25). In MbCO, there is only one Leu89 location,<br />
but <strong>in</strong> deoxyMb, there are two, one MbCO-like (70%) <strong>and</strong><br />
another ∼1.9 Å away (30%). Rearrangement of the side cha<strong>in</strong><br />
of Leu89 is evidently necessary to accommodate either CO<br />
or Xe <strong>in</strong> the Xe 1 site; the site is only ∼3 Å from the Leu89<br />
CG atom <strong>in</strong> the MbCO location. The features represent a<br />
perfectly correlated pair of structural changes; occupancy of<br />
the Xe 1 site by CO only occurs upon displacement of Leu89.<br />
Molecular MoVie. To illustrate the time course of global<br />
structural changes, we constructed a molecular movie by<br />
us<strong>in</strong>g the rates we identified from the time course of the<br />
electron density features to fit the time course of the structure<br />
factor difference amplitudes <strong>in</strong> reciprocal space (see Figure<br />
6). As described <strong>in</strong> Materials <strong>and</strong> Methods, the movie<br />
constructed this way ma<strong>in</strong>ta<strong>in</strong>s the important signal features<br />
while allow<strong>in</strong>g data smooth<strong>in</strong>g <strong>in</strong> the time doma<strong>in</strong>. The<br />
reciprocal space fit function is a sum of a stretchedexponential<br />
phase with a rate coefficient of 2.9 × 10 7 s -1<br />
<strong>and</strong> a β factor of 0.32 that account simultaneously for the<br />
fast phase of CO reb<strong>in</strong>d<strong>in</strong>g, decay of the CO* feature (Figure<br />
6), <strong>and</strong> appearance of the Xe 1 feature (Figure 8a); an<br />
exponential phase with a rate coefficient of 2 × 10 6 s -1 that<br />
represents the fast decay of the Xe 1 feature (Figure 8a);<br />
<strong>and</strong> a bimolecular lig<strong>and</strong> reb<strong>in</strong>d<strong>in</strong>g phase with a rate<br />
coefficient k 3 of 6.7 × 10 3 s -1 .<br />
W A molecular movie <strong>in</strong> GIF format is available.<br />
DISCUSSION<br />
Heme <strong>Relaxation</strong>. Results from a variety of spectroscopic<br />
experiments <strong>in</strong> solution that directly probe the Fe <strong>and</strong> heme<br />
environment suggest that although a large, <strong>in</strong>itial Fe displacement<br />
<strong>and</strong> heme relaxation <strong>in</strong> Mb occur with<strong>in</strong> 300 fs<br />
(3), these processes appear to be stretched <strong>in</strong> time <strong>and</strong><br />
cont<strong>in</strong>ue <strong>in</strong>to the nanosecond <strong>and</strong> even the microsecond time<br />
FIGURE 8: (a) Time course of the <strong>in</strong>tegrated electron content of<br />
the positive difference density at the Xe 1 b<strong>in</strong>d<strong>in</strong>g site from<br />
weighted omit maps. The time courses of the other three Xe b<strong>in</strong>d<strong>in</strong>g<br />
sites (Xe 2, Xe 3, <strong>and</strong> Xe 4) are shown for comparison. The solid<br />
l<strong>in</strong>e represents a fit of the time course of the Xe 1 density by two<br />
exponential phases (with rate coefficients of 2.6 × 10 7 <strong>and</strong> 2.0 ×<br />
10 6 s -1 ) <strong>and</strong> a bimolecular phase, fixed to that of lig<strong>and</strong> reb<strong>in</strong>d<strong>in</strong>g.<br />
The time course of the <strong>in</strong>tegrated electron content of the negative<br />
Leu89 feature is also shown. (b) Weighted difference electron<br />
density map of the Xe 1 region at 362 ns. The map is contoured at<br />
(3σ. Positive density at the Xe 1 site is labeled X, while positive<br />
<strong>and</strong> negative densities <strong>in</strong>dicat<strong>in</strong>g rearrangement of the Leu89 side<br />
cha<strong>in</strong> are labeled L1 <strong>and</strong> L2, respectively. MbCO <strong>and</strong> deoxy Mb<br />
models from 1BZR <strong>and</strong> 1BZP entries are also shown.<br />
doma<strong>in</strong> (16, 17). The largest heme-associated feature that<br />
we can reliably follow <strong>in</strong> time is the positive Fe-associated<br />
density, which has already reached its largest magnitude with<br />
the 1 ns time delay, <strong>and</strong> its subsequent decay simply follows<br />
the lig<strong>and</strong> reb<strong>in</strong>d<strong>in</strong>g k<strong>in</strong>etics. This means that, <strong>in</strong> agreement
13812 Biochemistry, Vol. 40, No. 46, 2001 Šrajer et al.<br />
with the spectroscopic results, the major component of the<br />
heme relaxation does occur with<strong>in</strong> 1 ns. We are not able to<br />
judge if a further Fe <strong>and</strong>/or heme displacement (albeit of<br />
small magnitude) cont<strong>in</strong>ues <strong>and</strong> persists <strong>in</strong>to the nanosecond<br />
to microsecond time doma<strong>in</strong>.<br />
Global <strong>Relaxation</strong>. Perhaps more surpris<strong>in</strong>g is the f<strong>in</strong>d<strong>in</strong>g<br />
that most of the global motion of the F helix is also evident<br />
<strong>in</strong> our 1 ns map. Several spectroscopic experiments that probe<br />
more global structural changes do however suggest that at<br />
least part of the global structural changes could be very fast.<br />
A transient grat<strong>in</strong>g experiment (11, 41) revealed a fast (
Time-Resolved Crystallographic Study of Myoglob<strong>in</strong> Biochemistry, Vol. 40, No. 46, 2001 13813<br />
FIGURE 10: Summary of lig<strong>and</strong> <strong>and</strong> prote<strong>in</strong> states follow<strong>in</strong>g MbCO<br />
photolysis. Lig<strong>and</strong> states are labeled <strong>in</strong> bold <strong>and</strong> prote<strong>in</strong> states <strong>in</strong><br />
italic.<br />
of two phases: a gem<strong>in</strong>ate phase best described by a<br />
stretched-exponential process <strong>and</strong> a bimolecular phase. The<br />
stretched nature of the <strong>in</strong>itial lig<strong>and</strong> reb<strong>in</strong>d<strong>in</strong>g phase could<br />
be expla<strong>in</strong>ed by fluctuations (14), prote<strong>in</strong> relaxation (17),<br />
or reb<strong>in</strong>d<strong>in</strong>g from multiple, dist<strong>in</strong>ct lig<strong>and</strong> dock<strong>in</strong>g sites, of<br />
which the site labeled CO* is the most prom<strong>in</strong>ent. Our data<br />
<strong>in</strong>dicate that the major part of the glob<strong>in</strong> relaxation is already<br />
completed by 1 ns. However, a smaller, slower prote<strong>in</strong><br />
relaxation could still be present that cannot be directly<br />
visualized with the data presented here. This cont<strong>in</strong>ued<br />
relaxation would affect lig<strong>and</strong> reb<strong>in</strong>d<strong>in</strong>g k<strong>in</strong>etics. The<br />
“unsynchronized” prote<strong>in</strong> fluctuations on the time scale of<br />
lig<strong>and</strong> reb<strong>in</strong>d<strong>in</strong>g cannot be directly observed by time-resolved<br />
experiments, s<strong>in</strong>ce these experiments record the structure<br />
averaged over all molecules <strong>in</strong> the crystal, at a particular<br />
laser/X-ray time delay over the duration of the X-ray pulse.<br />
The fluctuations would, if present, manifest themselves by<br />
the nonexponential nature of gem<strong>in</strong>ate lig<strong>and</strong> reb<strong>in</strong>d<strong>in</strong>g.<br />
On the time scale of the first, stretched-exponential phase<br />
of lig<strong>and</strong> reb<strong>in</strong>d<strong>in</strong>g, the CO molecule beg<strong>in</strong>s to escape from<br />
the distal pocket dock<strong>in</strong>g site labeled CO* <strong>and</strong> to populate<br />
the Xe 1 proximal dock<strong>in</strong>g site (Figure 8a). Does the CO<br />
molecule simply pass from one site to the other, or there are<br />
other sites with occupancies too small for us to detect? Figure<br />
9 shows the fractional occupancy of CO molecules that are<br />
located at the distal site, located at the proximal Xe 1 site,<br />
or bound to the heme, as a function of time. The sum of<br />
these three fractional occupancies is also shown. The<br />
deviation of the sum from 1.0 represents the undetected<br />
fraction of CO molecules. The conversion from the <strong>in</strong>tegrated<br />
electron content (Figures 5, 6, <strong>and</strong> 8a) to fractional occupancy<br />
(Figure 10) is based on two fractional occupancies determ<strong>in</strong>ed<br />
from the 1 ns map (see the Results); at 1 ns, 40% of<br />
all MbCO molecules are photolyzed <strong>and</strong> 45% of photodissociated<br />
CO molecules are <strong>in</strong> the CO* distal pocket site.<br />
All other occupancies are established relative to these values.<br />
The fact that the sum of three fractional occupancies lies<br />
close to 1.0 <strong>in</strong> the time range around 100 ns is not a<br />
consequence of the conversion, but the result of the<br />
<strong>in</strong>dependently determ<strong>in</strong>ed time evolution of three difference<br />
electron density features.<br />
We can thus account quantitatively for the location of all<br />
CO molecules <strong>in</strong> the time range around 100 ns: 11% occupy<br />
the CO* distal dock<strong>in</strong>g site, 26% occupy the proximal Xe 1<br />
site, 63% have rebound gem<strong>in</strong>ately (or were never photodissociated),<br />
<strong>and</strong> 0% have escaped to the solvent.<br />
At the 1 ns time delay, we f<strong>in</strong>d electron density at the<br />
CO* distal dock<strong>in</strong>g site that can account for only ∼45% of<br />
the photodissociated CO molecules. The miss<strong>in</strong>g 55% of the<br />
distal site electron density (correspond<strong>in</strong>g to ∼20% of all<br />
CO molecules) could reflect positional disorder of the CO<br />
molecule. At low temperatures (20-40 K), a trajectory of<br />
the photodissociated CO molecule has been observed (45).<br />
The CO* site at room temperature is located at the moredistant<br />
end of the low-temperature trajectory (45). It is<br />
possible that ∼20% of the CO molecules are spatially<br />
distributed along the trajectory <strong>and</strong> are simply undetectable<br />
<strong>in</strong> a crystallographic experiment. An angular <strong>and</strong> positional<br />
probability distribution of the photodissociated CO molecule<br />
has been proposed from molecular dynamics simulations<br />
(22). Despite uncerta<strong>in</strong>ty about their exact spatial location,<br />
it is very likely that the miss<strong>in</strong>g 20% of CO molecules are<br />
still located with<strong>in</strong> the distal pocket at 1 ns.<br />
In studies of the effect of Xe on oxygen k<strong>in</strong>etics, Scott<br />
<strong>and</strong> Gibson (21) identified the Xe 1 site as a possible,<br />
proximal site situated on the oxygen exit pathway. The Xe<br />
1 site is the highest-aff<strong>in</strong>ity Xe b<strong>in</strong>d<strong>in</strong>g site that is nearly<br />
fully occupied when metMb crystals are equilibrated with 7<br />
atm of Xe gas [94% occupancy (4)]. The other sites are only<br />
∼50% occupied under those conditions. The photodissociated<br />
CO molecule was directly observed at this site <strong>in</strong> crystallographic<br />
studies of the L29W mutant of sperm whale<br />
myoglob<strong>in</strong>, <strong>and</strong> of native horse heart myoglob<strong>in</strong> after<br />
extended illum<strong>in</strong>ation by light at temperatures of g160-<br />
180K(46, 47). This temperature range marks the dynamic<br />
transition region where prote<strong>in</strong> fluctuations are believed to<br />
open exit channels for lig<strong>and</strong> escape from the prote<strong>in</strong> <strong>in</strong>to<br />
the solvent (1, 46).<br />
Scott <strong>and</strong> Gibson (21) considered two possibilities for the<br />
oxygen exit pathway: a sequential model, <strong>in</strong> which oxygen<br />
escapes from the distal to the proximal site <strong>and</strong> from the<br />
proximal site to the solvent; <strong>and</strong> a side-path model, <strong>in</strong> which<br />
oxygen escapes from the distal site either directly to the<br />
solvent or to the dead-end proximal site. They preferred the<br />
second, side-path model. Our structural results suggest that<br />
the decay of the CO* site has predom<strong>in</strong>antly one fast phase<br />
(Figure 6) <strong>and</strong> that when the occupancy of the Xe 1 site is<br />
at a maximum, all of the CO molecules are accounted for<br />
with<strong>in</strong> the prote<strong>in</strong> <strong>and</strong> therefore none have escaped <strong>in</strong>to the<br />
solvent. In the side-path model, fast escape from the CO*<br />
site would be directed partially toward the solvent, contrary<br />
to our observations. The sequential model, with a m<strong>in</strong>or<br />
pathway for decay from the CO* site directly <strong>in</strong>to the solvent,<br />
is therefore more consistent with our data. The peak<br />
occupancy of ∼20% of the Xe 1 dock<strong>in</strong>g site is <strong>in</strong> an<br />
excellent agreement with the result of Scott <strong>and</strong> Gibson (21)<br />
for the maximum occupancy of the secondary species of<br />
20%. The Xe 1 site density decays to half of its peak value<br />
<strong>in</strong> ∼10 µs, consistent with the time constant of 3 µs for CO<br />
escape <strong>in</strong>to the solvent obta<strong>in</strong>ed from time-resolved <strong>in</strong>frared<br />
spectroscopy (31).<br />
What is the trajectory of the CO molecule between the<br />
distal <strong>and</strong> proximal dock<strong>in</strong>g sites? In molecular dynamic<br />
simulations (21, 48, 49), the outgo<strong>in</strong>g lig<strong>and</strong> hops between<br />
the Xe-b<strong>in</strong>d<strong>in</strong>g cavities before escap<strong>in</strong>g to the solvent.<br />
<strong>Prote<strong>in</strong></strong> flexibility is certa<strong>in</strong>ly necessary for a lig<strong>and</strong> to reach<br />
the Xe 1 site s<strong>in</strong>ce a photodissociated lig<strong>and</strong> is observed at<br />
this site only above the dynamic transition temperature of<br />
180K(46). Structural changes between ligated <strong>and</strong> unligated<br />
structures <strong>in</strong>volve a concerted motion of the heme <strong>and</strong> the F
13814 Biochemistry, Vol. 40, No. 46, 2001 Šrajer et al.<br />
<strong>and</strong> E helices, <strong>and</strong> reorientation of the hydrophobic residues<br />
of the heme pocket, especially the residues that form a clamp<br />
around the pyrrole C r<strong>in</strong>g (25). These motions are probably<br />
responsible for open<strong>in</strong>g a pathway to the proximal dock<strong>in</strong>g<br />
site.<br />
The f<strong>in</strong>al phase of CO reb<strong>in</strong>d<strong>in</strong>g <strong>in</strong>volves bimolecular<br />
reb<strong>in</strong>d<strong>in</strong>g from the solvent. This phase of reb<strong>in</strong>d<strong>in</strong>g will<br />
appear <strong>in</strong> crystals as somewhat extended compared to a s<strong>in</strong>gle<br />
exponential. It is described by a function C 3 /(1 + k 3 t) under<br />
the conditions <strong>in</strong> the crystal where the free lig<strong>and</strong> concentration<br />
is equal to the unligated prote<strong>in</strong> concentration. The rate<br />
k 3 represents a product k′[CO] bm , where k′ is a second-order<br />
rate coefficient <strong>and</strong> [CO] bm is the concentration of CO<br />
molecules, <strong>in</strong>itially bound to heme, that escaped <strong>in</strong>to the<br />
solvent after photolysis. Comb<strong>in</strong><strong>in</strong>g the value for k 3 of 6.7<br />
× 10 3 s -1 from the fit <strong>and</strong> [CO] bm of 15 mM [for 35% of all<br />
CO molecules that reb<strong>in</strong>d from the solvent (Figure 9), <strong>and</strong><br />
assum<strong>in</strong>g the total CO concentration of 45 mM] yields a k′<br />
of 4.5 × 10 5 M -1 s -1 , consistent with the viscosity<strong>in</strong>dependent<br />
bimolecular rate of 1.7 × 10 6 M -1 s -1 measured<br />
<strong>in</strong> solution (17).<br />
CONCLUSIONS<br />
We explored the prote<strong>in</strong> response to lig<strong>and</strong> photodissociation<br />
<strong>in</strong> myoglob<strong>in</strong> with a time-resolved diffraction technique.<br />
Our results <strong>and</strong> those on photoactive yellow prote<strong>in</strong><br />
(53) illustrate the present, quantitative capability of the timeresolved<br />
technique as we were able to detect quite subtle<br />
but essential structural changes that characterize the relaxation<br />
of this molecule. The error levels are sufficiently low<br />
to permit detection of structural displacements as small as<br />
0.2 Å such as those of the F helix, <strong>and</strong> to resolve 10%<br />
occupancy of a CO dock<strong>in</strong>g site, over the time range from<br />
1 ns to a few milliseconds.<br />
In addition to rapid structural changes around the heme,<br />
considered to be the epicenter of the “prote<strong>in</strong> quake” (50),<br />
we detect early, nanosecond global structural changes<br />
<strong>in</strong>volv<strong>in</strong>g motion of the F helix. We observe two dock<strong>in</strong>g<br />
sites of the photodissociated CO molecule. The primary site<br />
is <strong>in</strong> the distal pocket, close to the location of the water<br />
molecule <strong>in</strong> deoxyMb <strong>and</strong> to the site where CO is found<br />
upon photolysis at low temperatures (34, 45). The occupancy<br />
of this site is already at its maximum of ∼20% <strong>in</strong> 1 ns, <strong>and</strong><br />
the half-life for its decay is 70 ns. The secondary site is on<br />
the proximal side of the heme at the Xe 1 b<strong>in</strong>d<strong>in</strong>g site, which<br />
atta<strong>in</strong>s a peak occupancy of 20% at ∼100 ns before decay<strong>in</strong>g<br />
with a half-life of several microseconds. The actual exit<br />
pathway of the CO molecule is not known, but it certa<strong>in</strong>ly<br />
<strong>in</strong>volves at least one of these two dock<strong>in</strong>g sites s<strong>in</strong>ce at 100<br />
ns, all CO molecules are either bound to the heme or <strong>in</strong> one<br />
of these two sites with<strong>in</strong> the prote<strong>in</strong>. The miss<strong>in</strong>g fraction<br />
of photodissociated CO molecules at early times (
Time-Resolved Crystallographic Study of Myoglob<strong>in</strong> Biochemistry, Vol. 40, No. 46, 2001 13815<br />
34. Teng, T.-Y., Šrajer, V., <strong>and</strong> Moffat, K. (1994) Nat. Struct.<br />
Biol. 1, 701-705.<br />
35. Chen, Y., Šrajer, V., Ng, K., LeGr<strong>and</strong>, A., <strong>and</strong> Moffat, K.<br />
(1994) ReV. Sci. Instrum. 65, 1506-1511.<br />
36. Ren, Z., <strong>and</strong> Moffat, K. (1995) J. Appl. Crystallogr. 28, 461-<br />
481.<br />
37. Ursby, T., <strong>and</strong> Bourgeois, D. (1997) Acta Crystallogr. A53,<br />
564-575.<br />
38. Tul<strong>in</strong>sky, A. (1985) Methods Enzymol. 115, 77-89.<br />
39. Henderson, R., <strong>and</strong> Moffat, K. (1971) Acta Crystallogr. B27,<br />
1414-1420.<br />
40. Moffat, K. (1989) Annu. ReV. Biophys. Biophys. Chem. 18,<br />
309-332.<br />
41. Miller, R. J. D., Deak, J., Palese, S., Pereira, M., Richard, L.,<br />
<strong>and</strong> Shill<strong>in</strong>g, L. (1993) <strong>in</strong> Ultrafast Phenomena VIII (Mart<strong>in</strong>,<br />
J.-L., M<strong>in</strong>gus, A., Mourou, G. A., <strong>and</strong> Zewail, A. H.) pp 525-<br />
528, Spr<strong>in</strong>ger, Berl<strong>in</strong>.<br />
42. Xie, X., <strong>and</strong> Simon, J. D. (1991) Biochemistry 30, 3682-<br />
3692.<br />
43. Zhu, L., Sage, T. J., <strong>and</strong> Champion, P. M. (1993) Biochemistry<br />
32, 11181-11185.<br />
44. Morikis, D., Sage, J. T., Rizos, A. K., <strong>and</strong> Champion, P. M.<br />
(1988) J. Am. Chem. Soc. 110, 6341-6342.<br />
45. Teng, T.-Y., Šrajer, V., <strong>and</strong> Moffat, K. (1997) Biochemistry<br />
36, 12087-12100.<br />
46. Ostermann, A., Waschipky, R., Parak, F. G., <strong>and</strong> Nienhaus,<br />
G. U. (2000) Nature 404, 205-208.<br />
47. Chu, K., Vojtechovský, J., McMahon, B. H., Sweet, R. M.,<br />
Berendzen, J., <strong>and</strong> Schlicht<strong>in</strong>g, I. (2000) Nature 403, 921-<br />
923.<br />
48. Tilton, R. F., Jr., S<strong>in</strong>gh, U. C., Kuntz, I. D., Jr., <strong>and</strong> Kollman,<br />
P. A. (1988) J. Mol. Biol. 199, 195-211.<br />
49. Elber, R., <strong>and</strong> Karplus, M. (1987) Science 235, 318-321.<br />
50. Ansari, A., Berendzen, J., Bowne, S. F., Frauenfelder, H., Iben,<br />
I. E. T., Sauke, T. B., Shyamsunder, E., <strong>and</strong> Young, R. D.<br />
(1985) Proc. Natl. Acad. Sci. U.S.A. 82, 5000-5004.<br />
51. McRee, D. E. (1993) <strong>in</strong> Practical <strong>Prote<strong>in</strong></strong> Crystallography,<br />
Academic Press, San Diego.<br />
52. Merritt, E. A., <strong>and</strong> Bacon, D. J. (1997) Methods Enzymol. 277,<br />
505-525.<br />
53. Ren, Z., Perman, B., Šrajer, V., Teng, T.-Y., Praderv<strong>and</strong>, C.,<br />
Bourgeois, D., Schotte, F., Ursby, T., Kort, R., Wulff, M.,<br />
<strong>and</strong> Moffat, K. (2001) Biochemistry 40, 13788-13801.<br />
BI010715U