

PDF, 1536K - Measure DHS
PDF, 1536K - Measure DHS
PDF, 1536K - Measure DHS

You also want an ePaper? Increase the reach of your titles
YUMPU automatically turns print PDFs into web optimized ePapers that Google loves.
percent of women and 55 percent of men believe that a healthy-looking person can have the AIDS virus.<br />
Fifty-eight percent of women and 72 percent of men also recognize that the infection can be transmitted<br />
from a mother to her child. One in four women and one in three men are aware that HIV/AIDS<br />
transmission can occur during pregnancy, about one in ten women and men are aware that this<br />
transmission can occur during delivery, and two in five women and one in two men are aware of<br />
transmission through breastfeeding.<br />
Awareness of HIV/AIDS and knowledge of ways to avoid AIDS may be enhanced by a<br />
respondent’s exposure to individuals who have the AIDS virus or who have died from AIDS. When asked<br />
whether respondents knew someone personally who has HIV/AIDS, about one in four women and one<br />
in three men acknowledge that they know someone who has HIV/AIDS or someone who has died from<br />
AIDS.<br />
12.4 SOCIAL ASPECTS OF HIV/AIDS PREVENTION AND MITIGATION<br />
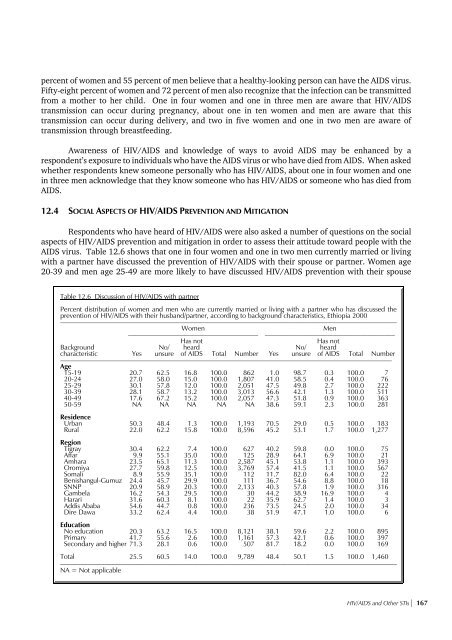
Respondents who have heard of HIV/AIDS were also asked a number of questions on the social<br />
aspects of HIV/AIDS prevention and mitigation in order to assess their attitude toward people with the<br />
AIDS virus. Table 12.6 shows that one in four women and one in two men currently married or living<br />
with a partner have discussed the prevention of HIV/AIDS with their spouse or partner. Women age<br />
20-39 and men age 25-49 are more likely to have discussed HIV/AIDS prevention with their spouse<br />
Table 12.6 Discussion of HIV/AIDS with partner<br />
Percent distribution of women and men who are currently married or living with a partner who has discussed the<br />
prevention of HIV/AIDS with their husband/partner, according to background characteristics, Ethiopia 2000<br />
____________________________________________________________________________________________________<br />
Women<br />
Men<br />
______________________________________ ______________________________________<br />
Has not<br />
Has not<br />
Background No/ heard No/ heard<br />
characteristic Yes unsure of AIDS Total Number Yes unsure of AIDS Total Number<br />
_________________________________________________________________________________________________<br />
Age<br />
15-19<br />
20.7 62.5 16.8 100.0 862 1.0 98.7 0.3 100.0 7<br />
20-24<br />
27.0 58.0 15.0 100.0 1,807 41.0 58.5 0.4 100.0 76<br />
25-29<br />
30.1 57.8 12.0 100.0 2,051 47.5 49.8 2.7 100.0 222<br />
30-39<br />
28.1 58.7 13.2 100.0 3,013 56.6 42.1 1.3 100.0 511<br />
40-49<br />
17.6 67.2 15.2 100.0 2,057 47.3 51.8 0.9 100.0 363<br />
50-59<br />
NA NA NA NA NA 38.6 59.1 2.3 100.0 281<br />
Residence<br />
Urban<br />
Rural<br />
Region<br />
Tigray<br />
Affar<br />
Amhara<br />
Oromiya<br />
Somali<br />
Benishangul-Gumuz<br />
SNNP<br />
Gambela<br />
Harari<br />
Addis Ababa<br />
Dire Dawa<br />
50.3 48.4 1.3 100.0 1,193 70.5 29.0 0.5 100.0 183<br />
22.0 62.2 15.8 100.0 8,596 45.2 53.1 1.7 100.0 1,277<br />
30.4 62.2 7.4 100.0 627 40.2 59.8 0.0 100.0 75<br />
9.9 55.1 35.0 100.0 125 28.9 64.1 6.9 100.0 21<br />
23.5 65.1 11.3 100.0 2,587 45.1 53.8 1.1 100.0 393<br />
27.7 59.8 12.5 100.0 3,769 57.4 41.5 1.1 100.0 567<br />
8.9 55.9 35.1 100.0 112 11.7 82.0 6.4 100.0 22<br />
24.4 45.7 29.9 100.0 111 36.7 54.6 8.8 100.0 18<br />
20.9 58.9 20.3 100.0 2,133 40.3 57.8 1.9 100.0 316<br />
16.2 54.3 29.5 100.0 30 44.2 38.9 16.9 100.0 4<br />
31.6 60.3 8.1 100.0 22 35.9 62.7 1.4 100.0 3<br />
54.6 44.7 0.8 100.0 236 73.5 24.5 2.0 100.0 34<br />
33.2 62.4 4.4 100.0 38 51.9 47.1 1.0 100.0 6<br />
Education<br />
No education 20.3 63.2 16.5 100.0 8,121 38.1 59.6 2.2 100.0 895<br />
Primary<br />
41.7 55.6 2.6 100.0 1,161 57.3 42.1 0.6 100.0 397<br />
Secondary and higher 71.3 28.1 0.6 100.0 507 81.7 18.2 0.0 100.0 169<br />
Total<br />
25.5 60.5 14.0 100.0 9,789 48.4 50.1 1.5 100.0 1,460<br />
___________________________________________________________________________________________________<br />
NA = Not applicable<br />
HIV/AIDS and Other STIs* 167


![Obtaining Informed Consent for HIV Testing [QRS4] - Measure DHS](https://img.yumpu.com/49850117/1/190x245/obtaining-informed-consent-for-hiv-testing-qrs4-measure-dhs.jpg?quality=85)


