

PDF, 1536K - Measure DHS
PDF, 1536K - Measure DHS
PDF, 1536K - Measure DHS

Create successful ePaper yourself
Turn your PDF publications into a flip-book with our unique Google optimized e-Paper software.
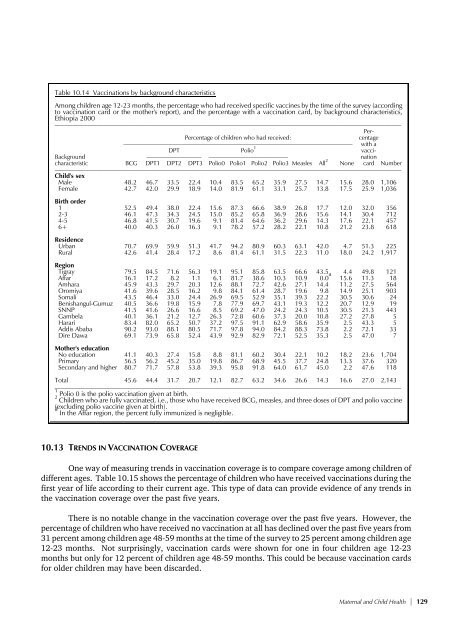
Table 10.14 Vaccinations by background characteristics<br />
Among children age 12-23 months, the percentage who had received specific vaccines by the time of the survey (according<br />
to vaccination card or the mother's report), and the percentage with a vaccination card, by background characteristics,<br />
Ethiopia 2000<br />
___________________________________________________________________________________________________________<br />
Per-<br />
Percentage of children who had received:<br />
centage<br />
___________________________________________________________________________<br />
with a<br />
DPT Polio 1 vacci-<br />
Background<br />
__________________ __________________________<br />
nation<br />
characteristic BCG DPT1 DPT2 DPT3 Polio0 Polio1 Polio2 Polio3 Measles All 2 None card Number<br />
___________________________________________________________________________________________________________<br />
Child's sex<br />
Male<br />
Female<br />
48.2 46.7 33.5 22.4 10.4 83.5 65.2 35.9 27.5 14.7 15.6 28.0 1,106<br />
42.7 42.0 29.9 18.9 14.0 81.9 61.1 33.1 25.7 13.8 17.5 25.9 1,036<br />
Birth order<br />
1<br />
2-3<br />
4-5<br />
6+<br />
Residence<br />
Urban<br />
Rural<br />
Region<br />
Tigray<br />
Affar<br />
Amhara<br />
Oromiya<br />
Somali<br />
Benishangul-Gumuz<br />
SNNP<br />
Gambela<br />
Harari<br />
Addis Ababa<br />
Dire Dawa<br />
Mother's education<br />
No education<br />
Primary<br />
Secondary and higher<br />
52.5 49.4 38.0 22.4 15.6 87.3 66.6 38.9 26.8 17.7 12.0 32.0 356<br />
46.1 47.3 34.3 24.5 15.0 85.2 65.8 36.9 28.6 15.6 14.1 30.4 712<br />
46.8 41.5 30.7 19.6 9.1 81.4 64.6 36.2 29.6 14.3 17.6 22.1 457<br />
40.0 40.3 26.0 16.3 9.1 78.2 57.2 28.2 22.1 10.8 21.2 23.8 618<br />
70.7 69.9 59.9 51.3 41.7 94.2 80.9 60.3 63.1 42.0 4.7 51.3 225<br />
42.6 41.4 28.4 17.2 8.6 81.4 61.1 31.5 22.3 11.0 18.0 24.2 1,917<br />
79.5 84.5 71.6 56.3 19.1 95.1 85.8 63.5 66.6 43.5 4.4 49.8 121<br />
16.1 17.2 8.2 1.1 6.1 81.7 38.6 10.3 10.9 0.0 a 15.6 11.3 18<br />
45.9 43.3 29.7 20.3 12.6 88.1 72.7 42.6 27.1 14.4 11.2 27.5 564<br />
41.6 39.6 28.5 16.2 9.8 84.1 61.4 28.7 19.6 9.8 14.9 25.1 903<br />
43.5 46.4 33.0 24.4 26.9 69.5 52.9 35.1 39.3 22.2 30.5 30.6 24<br />
40.5 36.6 19.8 15.9 7.8 77.9 69.7 43.1 19.3 12.2 20.7 12.9 19<br />
41.5 41.6 26.6 16.6 8.5 69.2 47.0 24.2 24.3 10.5 30.5 21.3 443<br />
40.1 36.1 21.2 12.7 26.3 72.8 60.6 37.3 20.0 10.8 27.2 27.8 5<br />
83.4 82.0 65.2 50.7 37.2 97.5 91.1 62.9 58.6 35.9 2.5 43.3 5<br />
90.2 93.0 88.1 80.5 71.7 97.8 94.0 84.2 88.3 73.8 2.2 72.1 33<br />
69.1 73.9 65.8 52.4 43.9 92.9 82.9 72.1 52.5 35.3 2.5 47.0 7<br />
41.1 40.3 27.4 15.8 8.8 81.1 60.2 30.4 22.1 10.2 18.2 23.6 1,704<br />
56.5 56.2 45.2 35.0 19.8 86.7 68.9 45.5 37.7 24.8 13.3 37.6 320<br />
80.7 71.7 57.8 53.8 39.3 95.8 91.8 64.0 61.7 45.0 2.2 47.6 118<br />
Total<br />
45.6 44.4 31.7 20.7 12.1 82.7 63.2 34.6 26.6 14.3 16.6 27.0 2,143<br />
___________________________________________________________________________________________________________<br />
1<br />
2 Polio 0 is the polio vaccination given at birth.<br />
Children who are fully vaccinated, i.e., those who have received BCG, measles, and three doses of DPT and polio vaccine<br />
a(excluding polio vaccine given at birth).<br />
In the Affar region, the percent fully immunized is negligible.<br />
10.13 TRENDS IN VACCINATION COVERAGE<br />
One way of measuring trends in vaccination coverage is to compare coverage among children of<br />
different ages. Table 10.15 shows the percentage of children who have received vaccinations during the<br />
first year of life according to their current age. This type of data can provide evidence of any trends in<br />
the vaccination coverage over the past five years.<br />
There is no notable change in the vaccination coverage over the past five years. However, the<br />
percentage of children who have received no vaccination at all has declined over the past five years from<br />
31 percent among children age 48-59 months at the time of the survey to 25 percent among children age<br />
12-23 months. Not surprisingly, vaccination cards were shown for one in four children age 12-23<br />
months but only for 12 percent of children age 48-59 months. This could be because vaccination cards<br />
for older children may have been discarded.<br />
Maternal and Child Health * 129


![Obtaining Informed Consent for HIV Testing [QRS4] - Measure DHS](https://img.yumpu.com/49850117/1/190x245/obtaining-informed-consent-for-hiv-testing-qrs4-measure-dhs.jpg?quality=85)


