

PDF, 1536K - Measure DHS
PDF, 1536K - Measure DHS
PDF, 1536K - Measure DHS

You also want an ePaper? Increase the reach of your titles
YUMPU automatically turns print PDFs into web optimized ePapers that Google loves.
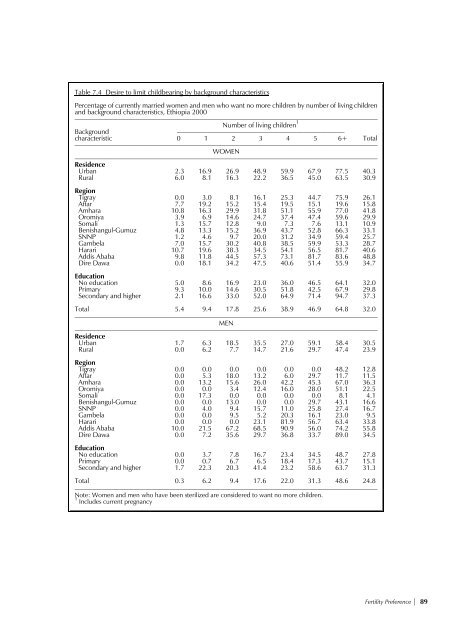
Table 7.4 Desire to limit childbearing by background characteristics<br />
Percentage of currently married women and men who want no more children by number of living children<br />
and background characteristics, Ethiopia 2000<br />
__________________________________________________________________________________________<br />
Number of living children 1<br />
Background<br />
_________________________________________________<br />
characteristic 0 1 2 3 4 5 6+ Total<br />
__________________________________________________________________________________________<br />
WOMEN<br />
__________________________________________________________________________________________<br />
Residence<br />
Urban<br />
Rural<br />
Region<br />
Tigray<br />
Affar<br />
Amhara<br />
Oromiya<br />
Somali<br />
Benishangul-Gumuz<br />
SNNP<br />
Gambela<br />
Harari<br />
Addis Ababa<br />
Dire Dawa<br />
Education<br />
No education<br />
Primary<br />
Secondary and higher<br />
2.3 16.9 26.9 48.9 59.9 67.9 77.5 40.3<br />
6.0 8.1 16.3 22.2 36.5 45.0 63.5 30.9<br />
0.0 3.0 8.1 16.1 25.3 44.7 75.9 26.1<br />
7.7 19.2 15.2 15.4 19.5 15.1 19.6 15.8<br />
10.8 16.3 29.9 31.8 51.1 55.9 77.0 41.8<br />
3.9 6.9 14.6 24.7 37.4 47.4 59.6 29.9<br />
1.3 15.7 12.8 9.0 7.3 7.6 13.1 10.9<br />
4.8 13.3 15.2 36.9 43.7 52.8 66.3 33.1<br />
1.2 4.6 9.7 20.0 31.2 34.9 59.4 25.7<br />
7.0 15.7 30.2 40.8 38.5 59.9 53.3 28.7<br />
10.7 19.6 38.3 34.5 54.1 56.5 81.7 40.6<br />
9.8 11.8 44.5 57.3 73.1 81.7 83.6 48.8<br />
0.0 18.1 34.2 47.5 40.6 51.4 55.9 34.7<br />
5.0 8.6 16.9 23.0 36.0 46.5 64.1 32.0<br />
9.3 10.0 14.6 30.5 51.8 42.5 67.9 29.8<br />
2.1 16.6 33.0 52.0 64.9 71.4 94.7 37.3<br />
Total<br />
5.4 9.4 17.8 25.6 38.9 46.9 64.8 32.0<br />
__________________________________________________________________________________________<br />
MEN<br />
__________________________________________________________________________________________<br />
Residence<br />
Urban<br />
1.7 6.3 18.5 35.5 27.0 59.1 58.4 30.5<br />
Rural<br />
0.0 6.2 7.7 14.7 21.6 29.7 47.4 23.9<br />
Region<br />
Tigray<br />
Affar<br />
Amhara<br />
Oromiya<br />
Somali<br />
Benishangul-Gumuz<br />
SNNP<br />
Gambela<br />
Harari<br />
Addis Ababa<br />
Dire Dawa<br />
Education<br />
No education<br />
Primary<br />
Secondary and higher<br />
0.0 0.0 0.0 0.0 0.0 0.0 48.2 12.8<br />
0.0 5.3 18.0 13.2 6.0 29.7 11.7 11.5<br />
0.0 13.2 15.6 26.0 42.2 45.3 67.0 36.3<br />
0.0 0.0 3.4 12.4 16.0 28.0 51.1 22.5<br />
0.0 17.3 0.0 0.0 0.0 0.0 8.1 4.1<br />
0.0 0.0 13.0 0.0 0.0 29.7 43.1 16.6<br />
0.0 4.0 9.4 15.7 11.0 25.8 27.4 16.7<br />
0.0 0.0 9.5 5.2 20.3 16.1 23.0 9.5<br />
0.0 0.0 0.0 23.1 81.9 56.7 63.4 33.8<br />
10.0 21.5 67.2 68.5 90.9 56.0 74.2 55.8<br />
0.0 7.2 35.6 29.7 36.8 33.7 89.0 34.5<br />
0.0 3.7 7.8 16.7 23.4 34.5 48.7 27.8<br />
0.0 0.7 6.7 6.5 18.4 17.3 43.7 15.1<br />
1.7 22.3 20.3 41.4 23.2 58.6 63.7 31.3<br />
Total<br />
0.3 6.2 9.4 17.6 22.0 31.3 48.6 24.8<br />
__________________________________________________________________________________________<br />
Note: Women and men who have been sterilized are considered to want no more children.<br />
1 Includes current pregnancy<br />
Fertility Preference * 89


![Obtaining Informed Consent for HIV Testing [QRS4] - Measure DHS](https://img.yumpu.com/49850117/1/190x245/obtaining-informed-consent-for-hiv-testing-qrs4-measure-dhs.jpg?quality=85)


