

PDF, 1536K - Measure DHS
PDF, 1536K - Measure DHS
PDF, 1536K - Measure DHS

Create successful ePaper yourself
Turn your PDF publications into a flip-book with our unique Google optimized e-Paper software.
FERTILITY PREFERENCE 7<br />
Due to various economic, social, and cultural reasons, prolific childbearing is generally<br />
encouraged in traditional Ethiopian society. However, couples have recently expressed a desire for a<br />
lower family size, and this may be due to economic considerations. The 2000 Ethiopia <strong>DHS</strong> collected<br />
information on fertility preferences to measure the overall attitudes of the society toward childbearing<br />
and the general course of future fertility. Data on fertility preferences are also useful for assessing the<br />
unmet need for family planning and the number of unwanted or mistimed births in the population.<br />
These, together with data on contraceptive prevalence, provide an estimation of the demand for family<br />
planning.<br />
7.1 DESIRE FOR MORE CHILDREN<br />
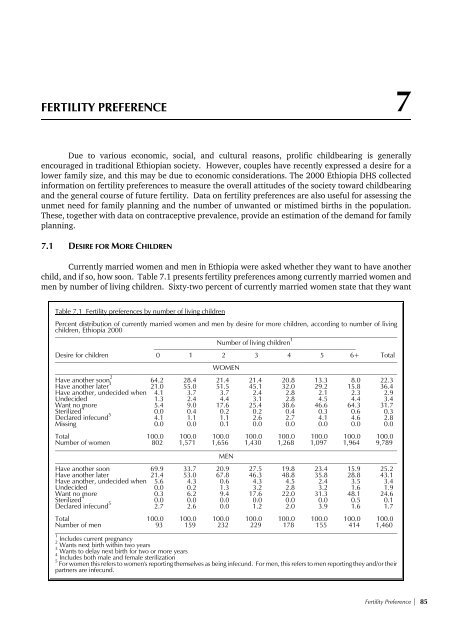
Currently married women and men in Ethiopia were asked whether they want to have another<br />
child, and if so, how soon. Table 7.1 presents fertility preferences among currently married women and<br />
men by number of living children. Sixty-two percent of currently married women state that they want<br />
Table 7.1 Fertility preferences by number of living children<br />
Percent distribution of currently married women and men by desire for more children, according to number of living<br />
children, Ethiopia 2000<br />
______________________________________________________________________________________________________<br />
Number of living children 1<br />
___________________________________________________________<br />
Desire for children 0 1 2 3 4 5 6+ Total<br />
______________________________________________________________________________________________________<br />
WOMEN<br />
______________________________________________________________________________________________________<br />
Have another soon 2<br />
Have another later 3<br />
Have another, undecided when<br />
Undecided<br />
Want no more<br />
Sterilized 4<br />
Declared infecund 5<br />
Missing<br />
64.2 28.4 21.4 21.4 20.8 13.3 8.0 22.3<br />
21.0 55.0 51.5 45.1 32.0 29.2 15.8 36.4<br />
4.1 3.7 3.7 2.4 2.8 2.1 2.3 2.9<br />
1.3 2.4 4.4 3.1 2.8 4.5 4.4 3.4<br />
5.4 9.0 17.6 25.4 38.6 46.6 64.3 31.7<br />
0.0 0.4 0.2 0.2 0.4 0.3 0.6 0.3<br />
4.1 1.1 1.1 2.6 2.7 4.1 4.6 2.8<br />
0.0 0.0 0.1 0.0 0.0 0.0 0.0 0.0<br />
Total<br />
100.0 100.0 100.0 100.0 100.0 100.0 100.0 100.0<br />
Number of women<br />
802 1,571 1,656 1,430 1,268 1,097 1,964 9,789<br />
______________________________________________________________________________________________________<br />
MEN<br />
______________________________________________________________________________________________________<br />
Have another soon<br />
Have another later<br />
Have another, undecided when<br />
Undecided<br />
Want no more<br />
Sterilized 4<br />
Declared infecund 5<br />
69.9 33.7 20.9 27.5 19.8 23.4 15.9 25.2<br />
21.4 53.0 67.8 46.3 48.8 35.8 28.8 43.1<br />
5.6 4.3 0.6 4.3 4.5 2.4 3.5 3.4<br />
0.0 0.2 1.3 3.2 2.8 3.2 1.6 1.9<br />
0.3 6.2 9.4 17.6 22.0 31.3 48.1 24.6<br />
0.0 0.0 0.0 0.0 0.0 0.0 0.5 0.1<br />
2.7 2.6 0.0 1.2 2.0 3.9 1.6 1.7<br />
Total<br />
100.0 100.0 100.0 100.0 100.0 100.0 100.0 100.0<br />
Number of men<br />
93 159 232 229 178 155 414 1,460<br />
______________________________________________________________________________________________________<br />
1 Includes current pregnancy<br />
2 Wants next birth within two years<br />
3 Wants to delay next birth for two or more years<br />
4 Includes both male and female sterilization<br />
5 For women this refers to women's reporting themselves as being infecund. For men, this refers to men reporting they and/or their<br />
partners are infecund.<br />
Fertility Preference * 85


![Obtaining Informed Consent for HIV Testing [QRS4] - Measure DHS](https://img.yumpu.com/49850117/1/190x245/obtaining-informed-consent-for-hiv-testing-qrs4-measure-dhs.jpg?quality=85)


