Adopted FY 2014 Capital Asset Management & Investment ... - TriMet
Adopted FY 2014 Capital Asset Management & Investment ... - TriMet
Adopted FY 2014 Capital Asset Management & Investment ... - TriMet

Create successful ePaper yourself
Turn your PDF publications into a flip-book with our unique Google optimized e-Paper software.
This page left intentionally blank.
CAPITAL ASSET MANAGEMENT & INVESTMENT PROGRAM<br />
TABLE OF CONTENTS<br />
1. Introduction<br />
A. Introduction .......................................................................................................................................................................................... 9<br />
B. <strong>Capital</strong> Budgeting Policies and Approaches ....................................................................................................................................... 10<br />
C. Reader’s Guide ................................................................................................................................................................................... 11<br />
D. Summary of <strong>Capital</strong> <strong>Asset</strong> <strong>Management</strong> & <strong>Investment</strong> Program by <strong>Asset</strong> Category ........................................................................ 13<br />
2. Moving Ahead for Progress in the 21 st Century (MAP‐21)<br />
A. Overview............................................................................................................................................................................................. 17<br />
B. State of Good Repair .......................................................................................................................................................................... 17<br />
C. State of Good Repair Projects ............................................................................................................................................................ 18<br />
3. Vehicles<br />
A. Fixed Route Buses .............................................................................................................................................................................. 25<br />
i. Merlo CNG Fleet Conversion ................................................................................................................................................ 29<br />
ii. Drop Down Chains ................................................................................................................................................................. 30<br />
iii. Hybrid Buses for Expansion ................................................................................................................................................... 31<br />
B. Light Rail Vehicles ............................................................................................................................................................................... 32<br />
i. Rail Maintenance Equipment ................................................................................................................................................ 44<br />
C. ATP/LIFT Vehicles ............................................................................................................................................................................... 45<br />
D. Non‐Revenue Vehicles ....................................................................................................................................................................... 49<br />
E. Other Vehicle Projects<br />
i. Automatic Train Stop (ATS) ................................................................................................................................................... 52<br />
ii. Positive Train Control ............................................................................................................................................................ 53<br />
iii. Type 1/2/3 LRVs Destination Sign Replacements ................................................................................................................. 54<br />
4. Maintenance of Way<br />
A. Track and Structures ........................................................................................................................................................................... 57<br />
B. Overhead Catenary System ................................................................................................................................................................ 61<br />
C. Signals ................................................................................................................................................................................................ 64<br />
D. Substations ......................................................................................................................................................................................... 68<br />
E. FEM Communications ........................................................................................................................................................................ 71<br />
F. Maintenance of Way Projects<br />
i. Conversion of MAX Track Switches to Powered Operation for Service Quality ................................................................... 73<br />
ii. Ruby Junction MOW Training Module .................................................................................................................................. 74<br />
Page ‐ 3
CAPITAL ASSET MANAGEMENT & INVESTMENT PROGRAM<br />
iii. Steel Bridge Improvements ................................................................................................................................................... 75<br />
iv. Kubota L Series 9FT Backhoe ................................................................................................................................................. 76<br />
5. Facilities – Customer and Operations<br />
A. Customer Facilities<br />
i. Bus Stop Development Program ........................................................................................................................................... 79<br />
ii. Customer Information Services ............................................................................................................................................. 85<br />
iii. Bus Stop Development – New Shelters ................................................................................................................................. 86<br />
iv. Bike to Transit ........................................................................................................................................................................ 87<br />
v. Bus On‐Street Maintenance .................................................................................................................................................. 88<br />
vi. Respond to ADA Audit ........................................................................................................................................................... 89<br />
vii. Lloyd District Transit Tracker Enhancements ........................................................................................................................ 90<br />
viii. Park & Ride Signage Share .................................................................................................................................................... 91<br />
ix. Renew the Blue ..................................................................................................................................................................... 92<br />
B. Operating Facilities<br />
i. Facilities <strong>Management</strong> .......................................................................................................................................................... 93<br />
a. Facilities <strong>Management</strong> Summary ............................................................................................................................. 96<br />
b. Facilities <strong>Management</strong> Projects ............................................................................................................................... 97<br />
ii. Environmental<br />
a. Storm Water UIC Program ..................................................................................................................................... 119<br />
b. All Facilities Maintenance Environmental .............................................................................................................. 121<br />
c. Merlo UST Replacement ......................................................................................................................................... 122<br />
iii. Center Street Building – End of Life Maintenance .............................................................................................................. 123<br />
iv. Center Street Building – First Floor Remodel ...................................................................................................................... 124<br />
v. Line 8 & 17 Bus Turnaround & Layover Facility .................................................................................................................. 125<br />
vi. Union Station Area Bus Layover .......................................................................................................................................... 126<br />
6. Technology Systems<br />
A. Operations Control & Communications Equipment<br />
i. Bus Dispatch System ........................................................................................................................................................... 131<br />
ii. LIFT Dispatch System ........................................................................................................................................................... 131<br />
iii. Rail Control & SCADA Systems ............................................................................................................................................ 132<br />
iv. Radio & Microwave Communication Systems .................................................................................................................... 133<br />
B. Fare Systems<br />
Page ‐ 4
CAPITAL ASSET MANAGEMENT & INVESTMENT PROGRAM<br />
i. Electronic Fare Collection (eFare) System ........................................................................................................................... 134<br />
ii. Farebox System ................................................................................................................................................................... 134<br />
iii. Ticket Vending Machine (TVM) System .............................................................................................................................. 134<br />
iv. Bus Transfer Printer ............................................................................................................................................................. 135<br />
v. Fare Revenue Equipment .................................................................................................................................................... 135<br />
vi. Fare Sales Systems .............................................................................................................................................................. 135<br />
vii. Fare Systems Summary ....................................................................................................................................................... 136<br />
viii. Fare Equipment .................................................................................................................................................................. 137<br />
C. Security Equipment Systems<br />
i. Networked CCTV Systems ................................................................................................................................................... 140<br />
ii. Vehicle‐Borne CCTV Systems ............................................................................................................................................... 140<br />
iii. MAX Intrusion Detection System ........................................................................................................................................ 142<br />
iv. <strong>TriMet</strong> Facilities Access Control System (TRACS) ................................................................................................................ 142<br />
D. Technology Equipment Systems<br />
i. Desktop Systems ................................................................................................................................................................. 143<br />
ii. Server Systems .................................................................................................................................................................... 146<br />
iii. Cable Plant ........................................................................................................................................................................... 147<br />
iv. Data Communications ......................................................................................................................................................... 147<br />
v. Voice Systems ...................................................................................................................................................................... 148<br />
vi. IT Security ............................................................................................................................................................................ 149<br />
vii. Communications Environment Systems .............................................................................................................................. 150<br />
viii. Finance and Administration Systems .................................................................................................................................. 151<br />
ix. HR Systems .......................................................................................................................................................................... 152<br />
x. CIS Systems .......................................................................................................................................................................... 152<br />
E. Other Technology System Projects<br />
i. Operator Training Equipment ............................................................................................................................................. 153<br />
ii. Digital Sign CPU Retrofit ...................................................................................................................................................... 154<br />
iii. Call‐A‐Bus Replacement ...................................................................................................................................................... 155<br />
iv. Disaster Recovery Network Upgrades ................................................................................................................................. 156<br />
v. Ruby Server Room Improvements ...................................................................................................................................... 157<br />
vi. Single Sign On ..................................................................................................................................................................... 158<br />
vii. TimeClock Replacement ...................................................................................................................................................... 159<br />
Page ‐ 5
CAPITAL ASSET MANAGEMENT & INVESTMENT PROGRAM<br />
viii. E‐Citation ............................................................................................................................................................................. 160<br />
7. New/Improved Service<br />
A. BRT First Corridor ............................................................................................................................................................................. 165<br />
B. Tigard Park & Ride Expansion ........................................................................................................................................................... 166<br />
C. Willamette Shore Trolley Program ................................................................................................................................................... 167<br />
D. STIP ‐ Barbur‐99W Corridor Safety & Access to Transit <strong>TriMet</strong> ....................................................................................................... 168<br />
E. STIP ‐ Cornell‐Evergreen‐229th Corridor Safety & Access to Transit <strong>TriMet</strong> ................................................................................... 169<br />
F. STIP ‐ Highway 8 Corridor Safety & Access to Transit <strong>TriMet</strong> .......................................................................................................... 170<br />
G. STIP ‐ Main Street ‐ 10th ‐ 15th Oregon City (co‐sponsor) ............................................................................................................... 171<br />
H. STIP ‐ Molalla Avenue‐Beavercreek‐Hwy213 Oregon City (co‐sponsor) .......................................................................................... 172<br />
I. STIP ‐ Powell‐Division Corridor Safety & Access to Transit <strong>TriMet</strong> .................................................................................................. 173<br />
J. STIP ‐ Transit Corridor Pedestrian Improvements Milwaukie (co‐sponsor) ..................................................................................... 174<br />
8. Appendices<br />
A. Summary Tables<br />
i. Vehicles ............................................................................................................................................................................... 177<br />
ii. Maintenance of Way ........................................................................................................................................................... 178<br />
iii. Facilities – Customer & Operations ..................................................................................................................................... 179<br />
iv. Technology Systems ............................................................................................................................................................ 180<br />
v. New/Improved Service ........................................................................................................................................................ 181<br />
vi. Combined Summary ............................................................................................................................................................ 182<br />
B. Fixed Route Buses (tables 1A, 1B, 1C, 12A, 12B) .............................................................................................................................. 183<br />
C. Light Rail Vehicle Components (table 2B) ........................................................................................................................................ 207<br />
D. Non‐Revenue Vehicles (tables 12C, 16A, 16B) ................................................................................................................................. 210<br />
E. Facilities <strong>Management</strong> ..................................................................................................................................................................... 223<br />
F. Technology Equipment Systems ...................................................................................................................................................... 230<br />
9. Matrices<br />
A. <strong>FY</strong><strong>2014</strong> <strong>Capital</strong> Program ‐ Projects ................................................................................................................................................... 247<br />
B. <strong>FY</strong><strong>2014</strong> <strong>Capital</strong> Program ‐ Carryovers via <strong>FY</strong>13 ................................................................................................................................ 249<br />
Page ‐ 6
SECTION 1 – INTRODUCTION
This page left intentionally blank.
<strong>Capital</strong> <strong>Asset</strong> <strong>Management</strong> & <strong>Investment</strong> Program Introduction <strong>FY</strong>14‐<strong>FY</strong>18<br />
<strong>TriMet</strong> <strong>FY</strong><strong>2014</strong> ‐ <strong>FY</strong>2018<br />
<strong>Capital</strong> <strong>Asset</strong> <strong>Management</strong> and <strong>Investment</strong> Program<br />
Introduction<br />
<strong>TriMet</strong>’s <strong>Capital</strong> <strong>Asset</strong> <strong>Management</strong> and <strong>Investment</strong> Program includes a comprehensive capital plan that identifies capital asset condition, and<br />
establishes future repair and replacement schedules and investment priorities. There are number of Level of Service <strong>Investment</strong>s in the capital plant<br />
that further <strong>TriMet</strong>’s priorities. Examples of Level of Service investments include the electronic fare system, Steel Bridge improvements that would<br />
increase the maximum speed of light rail from 5 MPH to 15 MPH, electronic destination signs on the Type 1 Light Rail Vehicles (LRVs).<br />
<strong>TriMet</strong> is a capital intensive agency with $2 billion of capital assets, primarily buses, light rail vehicles and light rail right of way. <strong>TriMet</strong> financial<br />
forecasts include an additional $1.0 billion of investments (<strong>FY</strong>13$) in the replacement of capital assets and level of service improvements over the next<br />
15 years. Of that, $653 million (<strong>FY</strong>13$) will be invested in bus, light rail and paratransit vehicle replacement and additional vehicles as the region grows.<br />
Continuously investing in capital is critical to operating safe, reliable, efficient and financially sustainable service. Funds are always limited, so <strong>TriMet</strong><br />
emphasizes cost‐effectively extending the useful life of equipment, vehicles, and facilities.<br />
While the <strong>Capital</strong> <strong>Asset</strong> <strong>Management</strong> and <strong>Investment</strong> Program covers just the next five years, most of <strong>TriMet</strong>’s assets have very long lives requiring<br />
continual on‐going or preventive maintenance to maintain in “as new condition” throughout life. Some assets, like light rail vehicles are replaced every<br />
35‐40 years, buses are replaced every 15 years. Stations and other facilities are refurbished but not replaced. To maintain our capital assets in a state of<br />
good repair, <strong>TriMet</strong> will invest $52 million a year on average in capital replacement (the capital budget) and will additionally invest about $80 million a<br />
year, or approximately 20% of the operating budget, in the maintenance of capital assets (<strong>FY</strong>13$). <strong>TriMet</strong>’s capital asset management and improvement<br />
program is forecast for each asset class for the next 20 to 30 years, depending on the asset, and included in the agency’s financial forecast.<br />
This year, the plan ties together the on‐going maintenance of capital assets (operating budget) and the replacement and repair of the same assets<br />
(capital budget) by including narratives that explain <strong>TriMet</strong>’s asset management program for each asset class. These narratives address asset<br />
maintenance and replacement, including backlogs, where they exist. It presents plans to bring assets up to a State of Good Repair. It explains how each<br />
asset class is maintained throughout its life and how an asset’s condition is continually evaluated and maintained throughout its life.<br />
It is important to note that funding has not been identified for all capital projects, and some projects may be considered discretionary (indicated by a<br />
lower priority level). All costs shown in the <strong>Capital</strong> <strong>Asset</strong> <strong>Management</strong> and <strong>Investment</strong> Program are 2013 dollars.<br />
Page ‐ 9
<strong>Capital</strong> <strong>Asset</strong> <strong>Management</strong> & <strong>Investment</strong> Program Introduction <strong>FY</strong>14‐<strong>FY</strong>18<br />
<strong>Capital</strong> Budgeting Policy<br />
<strong>TriMet</strong> views its capital projects as either additions to the capital plant or as rehabilitation and replacement of the existing capital.<br />
All projects are prioritized using the following scale whether they are part of the capital plant or replacement of existing capital:<br />
1 – Safety<br />
2 – Service Reliability<br />
3 – Economic Life of <strong>Asset</strong><br />
4 – Level of Service <strong>Investment</strong><br />
Generally, projects prioritized as Safety will be funded first and foremost over other projects. However, each project is strategically evaluated to ensure<br />
the best and most efficient use of public funds.<br />
While replacement projects may occasionally be deferred for one or two years, they are not elective. Adequate maintenance and replacement is<br />
necessary to maintain safe, reliable and attractive service for our customers and minimize future maintenance and replacement costs. It attracts new<br />
customers and helps keep current customers.<br />
<strong>TriMet</strong> plans and budgets replacement projects as follows:<br />
• Each department maintains an inventory and condition assessment of capital items. The purpose of the inventory is to estimate the life<br />
expectancy, condition and replacement costs of <strong>TriMet</strong>’s existing capital assets, whether or not they will be programmed for replacement<br />
during the next five years. With this information, <strong>TriMet</strong> plans for future expenditures, sets replacement schedules and establishes<br />
infrastructure standards.<br />
• This inventory is updated and refined each year prior to the budget process, with another year added for planning purposes.<br />
• During the annual budget process, replacement projects must be justified based on the actual condition or repair history of the facility or<br />
equipment. While an item may be programmed or scheduled for replacement within the next five years, the actual replacement date may<br />
be adjusted each year depending on the condition of the item when annual budget decisions are made. A significant amount of reallocation<br />
occurs each year during the capital budgeting process when these adjustments are made. By realizing the full life of equipment and facilities,<br />
replacement costs are spread over a longer period. This approach is the best use of limited funds and sometimes permits additional new<br />
projects to be funded. All requested replacement must be true replacement, where the item being replaced is being taken out of service.<br />
• <strong>TriMet</strong> will need to evaluate funding sources in future years for light rail fleet additions, long‐term maintenance facilities growth and<br />
ultimately the replacement of the Type I LRVs (beginning <strong>FY</strong>2027).<br />
Page ‐ 10
<strong>Capital</strong> <strong>Asset</strong> <strong>Management</strong> & <strong>Investment</strong> Program Introduction <strong>FY</strong>14‐<strong>FY</strong>18<br />
<strong>Capital</strong> Budgeting Policy (continued)<br />
Because of their importance in maintaining safe, reliable and attractive service, and in saving costs, replacement projects that meet the criteria above<br />
receive first priority for budgeting.<br />
The inter‐divisional <strong>Capital</strong> Committee reviews capital project requests in the Draft CAMP and sets priorities for capital spending. The Information<br />
Technology Committee (ITC) plans and sets priorities for IT capital spending. This input is provided to the <strong>Capital</strong> Committee at Budget time.<br />
Additions to the capital plan begin with a service plan and are implemented in the budget each year based on <strong>TriMet</strong>’s financial situation, executive<br />
direction and budget committee recommendations.<br />
Reader’s Guide<br />
This document is broken into five asset categories with multiple sub categories. Throughout each of the sections you will find common terms and<br />
subheadings. Here are some of those headings and a brief description of each:<br />
<strong>Asset</strong> Category – identifies an asset category.<br />
Priority – the priority of a particular asset category using the following scale:<br />
1 – Safety (S)<br />
2 – Service Reliability, Risk of Degradation (SR, RoD)<br />
3 – Economic Life of <strong>Asset</strong> (ELA)<br />
4 – Level of Service <strong>Investment</strong> (LSI)<br />
<strong>Asset</strong> <strong>Management</strong> Goal – the goal for a particular asset class, representing a state of good repair.<br />
Key <strong>Asset</strong> <strong>Management</strong> Performance Indicators/Goals – performance indicators that measure the State of Good Repair. States a target and/or<br />
objective.<br />
How <strong>Asset</strong>s are Maintained and Condition Evaluated – explains how the asset is maintained and how the condition assessment is done.<br />
Condition Scale – defines the condition of the asset on a scale of 1‐5 with 1 not needing replacement and 5 meaning it’s out of service or a 1‐5<br />
scale further defined in the asset category.<br />
Mid‐Life Overhaul Program – describes the mid‐life overhaul program of that particular asset.<br />
Page ‐ 11
<strong>Capital</strong> <strong>Asset</strong> <strong>Management</strong> & <strong>Investment</strong> Program Introduction <strong>FY</strong>14‐<strong>FY</strong>18<br />
Reader’s Guide (continued)<br />
<strong>Asset</strong> Replacement Criteria – states when the asset will be replaced.<br />
Additional Analysis – all additional information needed to meet asset management goal.<br />
Not all sections follow the previously listed format; however, each replacement program is generally explained in the sections of this document.<br />
Another common theme found is this document, are projects that represent level of service investments, new to the CAMP or have been chosen to be<br />
featured for various reasons. Following is brief outline of those common terms and a brief description of each:<br />
‐ Top section – includes project name, project class, project ID (if known), projected start & end dates, budgeted department, priority,<br />
replacement and project manager (if known).<br />
‐ Project Description – contains a detailed description of the project.<br />
‐ Project Justification – the necessity of the project and reason why the project is a priority over others.<br />
‐ Status – this section briefly explains if a project is being carried over and/or provides an updated status of a multi‐year project.<br />
‐ Fiscal Projection – funding and cost of the project in the 5‐year window.<br />
Page ‐ 12
<strong>Capital</strong> <strong>Asset</strong> <strong>Management</strong> & <strong>Investment</strong> Program Introduction <strong>FY</strong>14‐<strong>FY</strong>18<br />
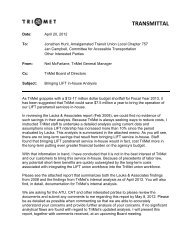
Summary of <strong>Capital</strong> <strong>Asset</strong> <strong>Management</strong> & <strong>Investment</strong> Program by <strong>Asset</strong> Category<br />
Category Type <strong>FY</strong><strong>2014</strong> <strong>FY</strong>2015 <strong>FY</strong>2016 <strong>FY</strong>2017 <strong>FY</strong>2018 5‐Yr Total<br />
Vehicles $ 35,897,177 $ 47,651,600 $ 54,394,756 $ 23,959,561 $ 20,024,983 $ 181,928,077<br />
Maintenance of Way 4,780,600 2,538,250 5,942,000 8,305,300 9,256,500 30,822,650<br />
Facilities ‐ Customer & Operations 13,280,646 9,969,695 9,503,179 5,378,989 3,837,152 41,969,661<br />
Technology Systems 8,428,557 8,352,800 8,008,350 8,141,100 4,199,190 37,129,997<br />
New‐Improved Service 425,000 6,050,000 24,927,536 17,272,520 50,000 48,725,056<br />
Total $ 62,811,980 $ 74,562,345 $ 102,775,821 $ 63,057,470 $ 37,367,825 $ 340,575,441<br />
$13,280,646<br />
<strong>Adopted</strong> <strong>FY</strong> <strong>2014</strong><br />
<strong>Capital</strong> <strong>Asset</strong> <strong>Management</strong> & <strong>Investment</strong><br />
Program<br />
$8,428,557 $425,000<br />
Vehicles<br />
Maintenance of Way<br />
Facilities ‐ Customer &<br />
Operations<br />
Technology Systems<br />
$4,780,600<br />
$35,897,177<br />
New‐Improved Service<br />
Page ‐ 13
This page left intentionally blank.
SECTION 2 – MAP‐21
This page left intentionally blank.
<strong>Capital</strong> <strong>Asset</strong> <strong>Management</strong> & <strong>Investment</strong> Program Moving Ahead for Progress in the 21 st Century <strong>FY</strong>14‐<strong>FY</strong>18<br />
Overview<br />
Signed into law on July 6 th , 2012 was the Moving Ahead for Progress in the 21 st Century Act (MAP‐21) which established new Federal Transit<br />
Administration (FTA) programs and made changes to existing FTA programs, all in an effort to improve efficiency and provide significant funding<br />
increases specifically for improving the state of good repair of the nation’s transit systems.<br />
MAP‐21 took effect on October 1, 2012 and is a new two‐year surface transportation authority that provides FTA an authorization level of $10.6 billion in<br />
<strong>FY</strong> 2013 and $10.7 billion in <strong>FY</strong> <strong>2014</strong>. MAP‐21 consolidates certain transit programs and the law grants FTA authority to strengthen the safety of the<br />
public transportation systems throughout the United States. It also streamlines the New Start process to expedite project delivery and provides for core<br />
capacity project eligibility.<br />
MAP‐21 furthers several important goals of the Department of Transportation, including safety, state of good repair, performance, and program<br />
efficiency. The Act also puts new emphasis on restoring and replacing the Nation’s aging public transportation infrastructure by establishing a new State<br />
of Good Repair formula program and new asset management requirements. In addition, it aligns Federal funding with key goals and tracks progress<br />
towards these goals. Finally, MAP‐21 improves the efficiency of administering grant programs by consolidating several programs and streamlining the<br />
fixed guideway capital investment grant program.<br />
The new law focuses on the following areas:<br />
‐ Safety Authority<br />
‐ State of Good Repair and <strong>Asset</strong> <strong>Management</strong><br />
‐ Streamlining and Program Efficiency<br />
‐ Formula Funding and MAP‐21 Discretionary Programs<br />
‐ Impacts of the 2010 Census for FTA’s Fiscal Year 2013 Apportionments<br />
Each of the focus areas offers structure to enhance, improve and prioritize elements of the nation’s transit infrastructure. In particular, the new<br />
structure and guidelines brought on by MAP‐21 will allow <strong>TriMet</strong> to better its infrastructure and give customers service and safety they’ve become<br />
accustomed to.<br />
State of Good Repair<br />
Throughout MAP‐21, State of Good Repair is referred to as both a concept and a formula for funding. Conceptually, the FTA wants transit agencies to<br />
improve its infrastructure for both safety and reliability and ensure assets are in a state of good repair. More specifically, MAP‐21 has set aside<br />
apportionments based on a State of Good Repair Program Formula.<br />
The State of Good Repair Program (formerly known as the fixed guideway modernization program) includes the following transit modes: Rapid rail<br />
(heavy rail), commuter rail, light rail, hybrid rail, automated guideway, trolleybus (using overhead catenary), aerial tramway, cable car, inclined plan<br />
(funicular), passenger ferries and bus rapid transit. Additionally, fixed route bus services operating on high‐occupancy‐vehicle (HOV) facilities are also<br />
funded through a separate tier of this formula.<br />
Page ‐ 17
<strong>Capital</strong> <strong>Asset</strong> <strong>Management</strong> & <strong>Investment</strong> Program Moving Ahead for Progress in the 21 st Century <strong>FY</strong>14‐<strong>FY</strong>18<br />
State of Good Repair (continued)<br />
Specific capital projects that may use this funding include projects necessary to maintain fixed guideway systems in a state of good repair, including<br />
projects to replace and rehabilitate: rolling stock, track, line equipment and structures, signals and communications, power equipment and substations,<br />
passenger stations and terminals, security equipment and systems, maintenance facilities and equipment, operational support equipment (computer<br />
hardware and software), development and implementation of a transit asset management plan, and other replacement and rehabilitation projects FTA<br />
determines appropriate.<br />
<strong>TriMet</strong> is expecting this new formula to net an additional $5‐6 million per year (in addition to the apportionment received under fixed guideway<br />
modernization program of $10.6 million). With the additional funding, <strong>TriMet</strong> has put a plan in place for using the funds.<br />
Current State of Good Repair<br />
For the most part <strong>TriMet</strong> has been maintaining a State of Good Repair with its assets. Transit assets are evaluated on a regular basis and<br />
replaced/reconditioned as necessary. Despite the proactive approach taken, there are still areas in need of improvement or in need of funding. The State<br />
of Good Repair formula funding will help ensure <strong>TriMet</strong>’s infrastructure is safe and reliable, but additional funds will also be needed.<br />
Transit <strong>Asset</strong> <strong>Management</strong> Plan<br />
Another element of MAP‐21 and a requirement of the State of Good Repair Program is developing a Transit <strong>Asset</strong> <strong>Management</strong> (TAM) plan. Although<br />
the FTA is developing the specifics of what will need to be included in the plan elements required at this time will include a capital asset inventory,<br />
condition assessment, decision support tools, and prioritization of capital investments. Once the FTA establishes a rulemaking all recipients of State of<br />
Good Repair Formula Program will need a TAM plan in place.<br />
State of Good Repair Projects<br />
<strong>TriMet</strong> has eight projects at the current time focused on improving assets to a state of good repair. Not all of these projects will be funded by the State<br />
of Good Repair Formula Program (which primarily focuses on rail modes of transportation), but all are necessary of improvements.<br />
Maintaining and/or rehabilitating assets to a state of good repair will not happen overnight and not all projects have been identified at this time,<br />
however, the table on the following page gives an outlook of the number of dollars involved over the next several years. Of the projects listed in the<br />
table all but one (Additional Bus Replacements) would be eligible or at least partially eligible for the State of Good Repair Program formula funds.<br />
Obviously, the projected increase in funding for the State of Good Repair Formula Program will not cover the cost of all projects and <strong>TriMet</strong> will need to<br />
prioritize and/or find room in the General Fund budget.<br />
Page ‐ 18
<strong>Capital</strong> <strong>Asset</strong> <strong>Management</strong> & <strong>Investment</strong> Program Moving Ahead for Progress in the 21 st Century <strong>FY</strong>14‐<strong>FY</strong>18<br />
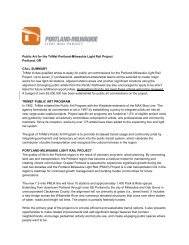
State of Good Repair Projects (continued)<br />
Project <strong>FY</strong><strong>2014</strong> <strong>FY</strong>2015 <strong>FY</strong>2016 <strong>FY</strong>2017 <strong>FY</strong>2018<br />
Additional Bus Replacements* $ 9,274,193 $ 9,552,418 $ 9,838,991 $ ‐ $ ‐<br />
LRV Overhaul Components* 3,508,330 3,113,505 ‐ ‐ ‐<br />
Rail Track and Structures 3,105,000 1,325,000 1,280,000 1,195,000 1,900,000<br />
Rail Electrification & Signalling 347,500 610,750 1,115,000 1,095,500 1,249,000<br />
Renew the Blue to Level III* 2,463,000 2,463,000 2,463,000 2,463,000 2,463,000<br />
Steel Bridge MAX * 500,000 500,000 ‐ ‐ ‐<br />
Total $ 19,198,023 $ 17,564,673 $ 14,696,991 $ 4,753,500 $ 5,612,000<br />
Funding<br />
State of Good Repair Additional Revenues $ 5,000,000 $ 5,000,000 $ ‐ $ ‐ $ ‐<br />
General Fund Support $ 14,198,023 $ 12,564,673 $ 14,696,991 $ 4,753,500 $ 5,612,000<br />
Projects with an asterisk (*) represent costs associated with reducing a repair or replacement backlog.<br />
$347,500<br />
$2,463,000<br />
State of Good Repair<br />
<strong>FY</strong><strong>2014</strong><br />
$500,000<br />
$9,274,193<br />
Additional Bus Replacements*<br />
LRV Overhaul Components*<br />
Rail Track and Structures<br />
Rail Electrification & Signalling<br />
Renew the Blue to Level III*<br />
$3,105,000<br />
Steel Bridge MAX *<br />
$3,508,330<br />
Page ‐ 19
<strong>Capital</strong> <strong>Asset</strong> <strong>Management</strong> & <strong>Investment</strong> Program Moving Ahead for Progress in the 21 st Century <strong>FY</strong>14‐<strong>FY</strong>18<br />
State of Good Repair Projects (continued)<br />
Following are a few highlights/project descriptions of a couple of State of Good Repair Projects<br />
Renew the Blue (funded by the SGR Formula Program)<br />
Through this Renew the Blue program <strong>TriMet</strong> will revitalize the appearance and safety features of the Eastside Light Rail Stations and Structures as they<br />
were the first in operation. The primary focus is on safety and security, followed by improved appearance. Estimated costs of the program can be found<br />
in the table on the following page with additional information found in the Facilities section of this document.<br />
Renew the Blue<br />
(Hollywood to Cleveland – does not include Gateway Transit Center,<br />
Rockwood, Civic Drive, Gresham Central)<br />
Safety & Security<br />
State of Good Repair<br />
‐ Pedestrian Crossing Safety<br />
‐ Lighting (New Fixtures)<br />
‐ Additional Lighting<br />
‐ Shelter Renewal<br />
‐ Relocate TVM’s/Access Control<br />
‐ Platform Edge Tile Renewal<br />
‐ Landscape Demo/Replace<br />
‐ Remove Old Lift Building<br />
‐ Paving Clean/Spot Repair<br />
Total Estimated Program Cost $12.3million<br />
Station before revitalization/safety updates…<br />
Total Estimated Program Cost $2.5 million<br />
Station after revitalization/safety updates…<br />
Page ‐ 20
<strong>Capital</strong> <strong>Asset</strong> <strong>Management</strong> & <strong>Investment</strong> Program Moving Ahead for Progress in the 21 st Century <strong>FY</strong>14‐<strong>FY</strong>18<br />
State of Good Repair Projects (continued)<br />
Additional Bus Replacements<br />
<strong>TriMet</strong> has a bus fleet of approximately 600 buses with a weighted average age of 12 years. With budgetary constraints due to the economy bus<br />
replacements were one of the first to be deferred. Beginning in <strong>FY</strong>12, <strong>TriMet</strong> was able to begin it’s purchasing of an aging bus fleet. This project further<br />
enhances the recovery of the aging fleet to lower the average age of fleet.<br />
The estimated cost for approximately 20 buses:<br />
Project <strong>FY</strong><strong>2014</strong> <strong>FY</strong>2015 <strong>FY</strong>2016 <strong>FY</strong>2017 <strong>FY</strong>2018<br />
Additional Bus Replacement $ 9,274,193 $ 9,552,418 $ 9,838,991 $ ‐ $ ‐<br />
Features of the New Replacement Buses<br />
the OLD<br />
Air conditioning.<br />
Easy low floors for<br />
Boarding.<br />
Easy‐to‐clean vinyl seats<br />
and interior surfaces.<br />
Brighter LED lighting.<br />
Larger windows.<br />
Handrails and a gently<br />
sloping floor at the rear<br />
exit.<br />
A next generation GPS<br />
dispatch/tracking<br />
system.<br />
A lighter interior color<br />
scheme<br />
the NEW<br />
Page ‐ 21
<strong>Capital</strong> <strong>Asset</strong> <strong>Management</strong> & <strong>Investment</strong> Program Moving Ahead for Progress in the 21 st Century <strong>FY</strong>14‐<strong>FY</strong>18<br />
State of Good Repair Projects (continued)<br />
Bus to be Replaced<br />
Improved windshield<br />
visibility for operators.<br />
Security cameras<br />
A modern sloping front<br />
end.<br />
Bright, easy‐to‐read LED<br />
overhead signs.<br />
Electronic ignition.<br />
A longer, more gradual<br />
boarding ramp.<br />
Automatic drop‐down<br />
snow chains.<br />
Brighter, energy‐efficient<br />
LED headlights.<br />
Turning lights on the<br />
mirrors for safety.<br />
Taking its Place<br />
Page ‐ 22
SECTION 3 – VEHICLES
This page left intentionally blank.
<strong>Capital</strong> <strong>Asset</strong> <strong>Management</strong> & <strong>Investment</strong> Program Vehicles Fixed Route Buses<br />
<strong>Asset</strong> Category – Vehicles – Fixed Route Buses<br />
Priority<br />
To be determined by CIP Committee<br />
<strong>Asset</strong> <strong>Management</strong> Goal<br />
The goal for Bus Maintenance <strong>Asset</strong> <strong>Management</strong> is to provide clean, reliable transportation to our customers in the Portland Metropolitan Area<br />
which incorporate Multnomah, Washington and Clackamas counties. Maintaining a consistent fleet age, preventive maintenance program and<br />
planned obsolescence are cornerstones to having a maintainable fleet that meets our objective.<br />
Key <strong>Asset</strong> <strong>Management</strong> Performance Indicators/Goals<br />
Key performance indicators for maintaining our assets can be found in our Bus Fleet <strong>Management</strong> Plan. Additional indicators for tracking asset<br />
condition are age of the chassis not to exceed 16 years, engine mileage not to exceed 375,000 miles and transmission mileage not to exceed 250,000<br />
miles. It is at the component’s defined age or mileage that reliability begins to fall steeply and repair costs climb rapidly. In the case of engines and<br />
transmissions, components are replaced to ensure reliability of the coach. When a vehicle is at or over 16 years of age, the vehicle is then a<br />
candidate for replacement.<br />
How <strong>Asset</strong>s are Maintained & Condition Evaluated<br />
Routine maintenance and component replacement can be found in <strong>TriMet</strong>’s Bus Fleet <strong>Management</strong> Plan. Many components on a bus are designed<br />
to be replaced at certain intervals defined by the original equipment manufacturer (OEM) and are not taken into account in vehicle assessment.<br />
Other items that do not have a pre‐determined OEM replacement time table are initially replaced upon failure, later through agency experience and<br />
analysis of the component, a preventive maintenance program is developed to replace the component before actual failure.<br />
The criteria for asset condition is based upon multiple key performance indicators of equipment reliability, life cycle, equipment obsolescence and<br />
cost. Assessment and monitoring of all assets are conducted through the Maintenance <strong>Management</strong> Information System (MMIS). Extensive analysis<br />
and trending are done to the critical components identified in this document to support business decisions to re‐investment in or retire of a vehicle.<br />
Primary components that are monitored for condition are as follows:<br />
Engine<br />
The engine provides the power for vehicle locomotion. Engines are critical to a vehicle’s reliability and also a significant cost driver in<br />
maintaining a bus. A bus will typically go through one engine re‐power in its lifetime. Given <strong>TriMet</strong>’s unique circumstances, we will have<br />
several fleets go through a 2 nd engine re‐power in order to maintain vehicle reliability and meet agency needs vehicle replacement<br />
cycles. Current analysis shows that an average diesel engine will last between 350,000 and 400,000 miles regardless of model.<br />
Assessments will be weighed against our experience with engine life.<br />
Page ‐ 25
<strong>Capital</strong> <strong>Asset</strong> <strong>Management</strong> & <strong>Investment</strong> Program Vehicles Fixed Route Buses<br />
How <strong>Asset</strong>s are Maintained & Condition Evaluated (continued)<br />
Transmission<br />
The transmission transfers power from the engine to the wheels, physically applying the engine’s torque to the ground allowing a vehicle<br />
to move. Transmissions represent another significant cost. Current analysis shows a transmission lasting 200,000 to 250,000 miles on<br />
average. An average bus will go through 3‐4 transmissions in its service life. With newer buses, <strong>TriMet</strong> has been able to secure a<br />
warranty lasting 300,000 miles on new bus transmissions. Assessments will be weighed against <strong>TriMet</strong>’s experience with transmission<br />
life at 250,000 miles.<br />
Chassis / Body<br />
The chassis is the body of the bus. This provides the foundation for all the components to mount to and work off of. The chassis itself is<br />
traditionally never replaced during a bus’ service life. FTA specifies that a bus should last 12 years in transit service. <strong>TriMet</strong> specifies that<br />
a chassis lasts for a minimum of 15 years. Due to the recent economic distress of the nation, <strong>TriMet</strong> has had to delay purchasing of new<br />
fleets for several years. This has put <strong>TriMet</strong> in the position of having chassis that are far more than 15 years of age. <strong>TriMet</strong>’s current goal<br />
is to have a bus last 16 years before retirement. With the elevated average fleet age, new points of failure are being identified on the<br />
older fleets. Evaluations will be weighed against the 16 year goal of vehicle replacement.<br />
Condition Scale<br />
All assessments are done through a survey using data from MMIS. The ratings are done as an aggregate of a given fleet. When vehicles are actually<br />
retired, they are “Cherry‐Picked” from a fleet in order to retire the buses that are truly in the worst shape and avoid re‐investing capital while the<br />
buses in fairer shape are allowed to continue in service.<br />
Current Grading Scale is as follows:<br />
1 – New (less than a year old)<br />
2 – Good<br />
3 – Fair nearing end of life (about two‐thirds the way to end of life)<br />
4 – <strong>Asset</strong> is at projected end of life<br />
5 – <strong>Asset</strong> is obsolete and difficult to maintain / <strong>Asset</strong> is more than one year or 40,000 miles beyond projected end of life<br />
Page ‐ 26
<strong>Capital</strong> <strong>Asset</strong> <strong>Management</strong> & <strong>Investment</strong> Program Vehicles Fixed Route Buses<br />
Condition Scale (continued)<br />
The table that follows is a current evaluation of components of the active bus fleet:<br />
Fleet Engine Transmission Chassis<br />
1400 3 4 5<br />
1601‐1630 3 3 5<br />
1631‐1643 3 5 5<br />
1700‐1817 3 2 5<br />
1817‐1843 4 3 5<br />
1900 3 5 5<br />
2000 4 3 3<br />
2101‐2160 3 3 3<br />
2161‐2165 3 4 3<br />
2201‐2258 3 3 3<br />
2259‐2318 3 3 3<br />
2500 2 3 3<br />
2600 2 3 2<br />
2700 2 2 2<br />
2800 4 2 2<br />
2900 2 2 2<br />
3001‐3051 1 1 1<br />
3052‐3055 1 1 1<br />
Hybrid Buses<br />
<strong>TriMet</strong> has limited experience with hybrids and the different architectures of a hybrid powertrain. Powertrain is the component(s) of a vehicle that<br />
provides locomotion/thrust. In the future, the hybrid powertrain will be graded as part of a bus’ engine. With many future technologies on the table<br />
in regards to powering transportation (everything from using Biofuels or synthetic gases to power traditional combustion engines to electric and<br />
even hydrogen power), <strong>TriMet</strong> is embarking on testing a fully electrified architecture on several buses. These buses referred to as “Hyper Hybrids”<br />
are series‐hybrid vehicles in which the electrical architecture is tapped to power all of the accessories on the bus. This allows the bus to function<br />
without the engine running in certain situations, essentially allowing the bus to operate like a battery electric vehicle (BEV). In essence, the vehicles<br />
are BEV’s but instead of having a large battery pack, a diesel powered generator is used as the power source combined with regenerative braking<br />
and a smaller battery pack. This gives <strong>TriMet</strong> the opportunity to test and gain experience working with an electrical powertrain architecture and<br />
verify whether full‐electric vehicles should be incorporated in <strong>TriMet</strong>’s future fleet plans.<br />
Page ‐ 27
<strong>Capital</strong> <strong>Asset</strong> <strong>Management</strong> & <strong>Investment</strong> Program Vehicles Fixed Route Buses<br />
Bus Replacements<br />
Due to <strong>TriMet</strong>’s financial situation for the past few years, bus replacements have been deferred. However, the deferment of bus replacement has<br />
increased maintenance costs and reduced equipment reliability. Keeping obsolete equipment in a running state has also proven challenging. To<br />
counter‐act the increasing maintenance costs and obsolescence of <strong>TriMet</strong>’s old fleet, bus purchasing has resumed at a sustainable pace that will<br />
bring <strong>TriMet</strong>’s average fleet age down to approximately 8 years within five years. Replacement is being done at an even pace of 40 buses per year<br />
(although 60 buses for each of the next three years) to minimize <strong>TriMet</strong>’s exposure to obsolete equipment and logistical hurdles, such as fleet‐wide<br />
recalls and buses needing replacement of major components at the same time.<br />
Fixed Route Bus Summary<br />
Fix route bus fiscal needs are broken into four general categories:<br />
‐ Fixed Bus Route Replacements – includes all bus replacements<br />
‐ Fixed Bus Route Components – includes all components of current bus fleet<br />
‐ Bus Maintenance Shop Equipment > $5,000 – includes equipment such as cranes, lifts/hoists, parts cleaner/washers, presses, forklifts, etc.<br />
‐ Bus Maintenance Shop Equipment ≤ $5,000 – includes equipment such as battery chargers, air guns, pressure washers, welders, etc.<br />
VEHICLES <strong>FY</strong>14 <strong>FY</strong>15 <strong>FY</strong>16 <strong>FY</strong>17 <strong>FY</strong>18<br />
Total<br />
<strong>FY</strong>14-<strong>FY</strong>18<br />
Fixed Route Buses<br />
Fixed Route Bus Replacements $ 26,295,001 $ 29,536,000 $ 26,670,000 $ 17,830,000 $ 17,830,000 $ 118,161,001<br />
Fixed Route Bus Components $910,195 1,936,795 2,753,998 1,811,210 1,637,068 9,049,266<br />
Bus Maintenance Shop Equipment > $5,000 882,800 389,000 187,000 125,000 16,000 1,599,800<br />
Bus Maintenance Shop Equipment ≤ $5,000 259,850 207,400 115,000 90,895 58,550 731,695<br />
Project ‐ Merlo CNG Fleet Conversion ‐ 2,780,000 11,120,000 ‐ ‐ 13,900,000<br />
Project ‐ Drop‐Down Chains (183 buses) 311,500 329,000 ‐ ‐ ‐ 640,500<br />
Project ‐ Hybrid Buses for Expansion ‐ 573,200 2,292,800 ‐ ‐ 2,866,000<br />
Fixed Route Buses Subtotal $ 28,659,346 $ 35,751,395 $ 43,138,798 $ 19,857,105 $ 19,541,618 $ 146,948,262<br />
A detailed breakdown of the categories may be found in the Appendix section of this document under Fixed Route Buses. Projects are included on<br />
subsequent pages.<br />
Page ‐ 28
<strong>Capital</strong> <strong>Asset</strong> <strong>Management</strong> & <strong>Investment</strong> Program Vehicles Fixed Route Buses<br />
Fixed Route Buses – Merlo CNG Fleet Conversion<br />
Project Name: Merlo CNG Fleet Conversion Project ID: TBD<br />
Project Class: Vehicles and Facility Priority: TBD<br />
Start Date: <strong>FY</strong>2015 Completion Date: <strong>FY</strong>2016 Project Type: <strong>Capital</strong><br />
Budgeted Dept: TBD Project Manager: TBD<br />
PROJECT DESCRIPTION<br />
Should <strong>TriMet</strong> decide to move forward in the implementation of a natural gas fleet, this project shall convert Merlo’s Diesel bus fleet over to CNG. In order to<br />
facilitate the move to CNG, Merlo’s fuel house will need to be modified with CNG pumps and associated ancillary equipment. Merlo’s shop facilities will also have to<br />
be fitted with methane detection at all service bays, along with automatic door opening and emergency ventilation fans. There is a price increase when specifying a<br />
bus for CNG fuel.<br />
PROJECT JUSTIFICATION<br />
Currently, <strong>TriMet</strong> is performing analysis to the practicality and return on investment in regards to converting Merlo’s fleet to run on natural gas versus diesel. Should<br />
<strong>TriMet</strong> find the analysis in favor of natural gas and choose to move forward with implementation, it will be due to a savings in overall operating costs. Current project<br />
cost estimates are as follows:<br />
Maintenance Facility: $1,300,000<br />
Fueling Infrastructure: $2,500,000 ‐ $3,500,000<br />
Total Incremental Cost for 130 buses: $70,000 x 130 buses = $9,100,000<br />
Total Project Cost: $12,900,000 ‐ $13,900,000<br />
STATUS<br />
Currently, this project is still in the analysis and vetting stage. It will take multiple years to complete this project due to logistical limitations on bus acceptance and<br />
actual studies and construction of new fueling infrastructure.<br />
Expenditure Plan <strong>FY</strong><strong>2014</strong> <strong>FY</strong>2015 <strong>FY</strong>2016 <strong>FY</strong>2017 <strong>FY</strong>2018 Total 5‐Year Cost<br />
Current Year $ ‐ $ 2,780,000 $ 11,120,000 $ ‐ $ ‐ $ 13,900,000<br />
$ ‐ $ 2,780,000 $ 11,120,000 $ ‐ $ ‐ $ 13,900,000<br />
Revenue Plan <strong>FY</strong><strong>2014</strong> <strong>FY</strong>2015 <strong>FY</strong>2016 <strong>FY</strong>2017 <strong>FY</strong>2018 Total 5‐Year Cost<br />
Federal Share $ ‐ $ ‐ $ ‐ $ ‐ $ ‐ $<br />
‐<br />
<strong>TriMet</strong> Share $ ‐ $ 2,780,000 $ 11,120,000 $ ‐ $ ‐ $ 13,900,000<br />
Other Source $ ‐ $ ‐ $ ‐ $ ‐ $ ‐ $<br />
‐<br />
TBD $ ‐ $ ‐ $ ‐ $ ‐ $ ‐ $<br />
‐<br />
$ ‐ $ 2,780,000 $ 11,120,000 $ ‐ $ ‐ $ 13,900,000<br />
Page ‐ 29
<strong>Capital</strong> <strong>Asset</strong> <strong>Management</strong> & <strong>Investment</strong> Program Vehicles Fixed Route Buses<br />
Fixed Route Buses – Drop Down Chains<br />
Project Name: Drop Down Chains for 183 Low‐Floor Buses Project ID: 4068<br />
Project Class: Vehicles Priority: SR, RoD<br />
Start Date: 7/1/2013 Completion Date: 6/30/15 Project Type: Operating<br />
Budgeted Dept: Bus Maintenance Project Manager: Nielsen<br />
PROJECT DESCRIPTION<br />
Purchase and installation of one set of drop‐down chains for each low‐floor bus ($3,500 per set) as follows:<br />
Fleet 57 (New Flyer 2901‐2940) = 5 buses <strong>FY</strong>14 Fleet 56 (New Flyer 2801‐2839) = 39 buses <strong>FY</strong>15<br />
Fleet 55 (New Flyer 2701‐2725) = 25 buses <strong>FY</strong>14 Fleet 54 (New Flyer 2601‐2655) = 55 buses <strong>FY</strong>15<br />
Fleet 52 (New Flyer 2501‐2560) = 59 buses <strong>FY</strong>14<br />
PROJECT JUSTIFICATION<br />
If buses were chained via traditional methods, it would cost $141,700 ($650 per set) for a one‐year, one event total of $159,535. If additional snow/ice events occur<br />
the total goes up by $17,835 for each additional event, and that's only if chains don't have to be replaced.<br />
Drop down chains are easy to install on the bus, maintenance is minimal and activating and deactivating the chain system is done by the Operator through a switch<br />
on the dashboard. These systems are currently used on school buses during moderate snow/ice events and are now available for use on transit buses. Retrofitting<br />
our existing 2900, 2800, 2700, 2600 and 2500 series bus fleets (183 buses, since 35 2900s will be outfitted in <strong>FY</strong>13) with this drop down chaining system will save<br />
labor, possibly save Workers’ Compensation claims, chain and chain repair costs, and will produce a rate‐of‐return on investment during the fourth year of operation<br />
(if during the first four years, a winter similar to that of 2008 is experienced, the rate‐of‐return would be realized during the second or third year of operation).<br />
STATUS<br />
N/A<br />
Expenditure Plan <strong>FY</strong><strong>2014</strong> <strong>FY</strong>2015 <strong>FY</strong>2016 <strong>FY</strong>2017 <strong>FY</strong>2018 Total 5‐Year Cost<br />
Current Year $ 311,500 $ 329,000 $ ‐ $ ‐ $ ‐ $ 640,500<br />
$ 311,500 $ 329,000 $ ‐ $ ‐ $ ‐ $ 640,500<br />
Revenue Plan <strong>FY</strong><strong>2014</strong> <strong>FY</strong>2015 <strong>FY</strong>2016 <strong>FY</strong>2017 <strong>FY</strong>2018 Total 5‐Year Cost<br />
Federal Share $ ‐ $ ‐ $ ‐ $ ‐ $ ‐ $<br />
‐<br />
<strong>TriMet</strong> Share $ 311,500 $ 329,000 $ ‐ $ ‐ $ ‐ $ 640,500<br />
Other Source $ ‐ $ ‐ $ ‐ $ ‐ $ ‐ $<br />
‐<br />
TBD $ ‐ $ ‐ $ ‐ $ ‐ $ ‐ $<br />
‐<br />
$ 311,500 $ 329,000 $ ‐ $ ‐ $ ‐ $ 640,500<br />
Page ‐ 30
<strong>Capital</strong> <strong>Asset</strong> <strong>Management</strong> & <strong>Investment</strong> Program Vehicles Fixed Route Buses<br />
Fixed Route Buses – Hybrid Buses for Expansion<br />
Project Name: Four (4) 40’ Hyper‐Hybrid Buses for Expansion Project ID: 4071<br />
Project Class: Vehicles Priority: LSI<br />
Start Date: 2/1/2013 Completion Date: 6/30/2017 Project Type: <strong>Capital</strong><br />
Budgeted Dept: Bus Maintenance Project Manager: Haley<br />
PROJECT DESCRIPTION<br />
Purchase of four (4) 40’ Hybrid Low‐Floor buses. These buses will be an enhanced generation of hybrid buses (“hyper‐hybrid”). Estimated cost per bus is $716,500.<br />
PROJECT JUSTIFICATION<br />
These additional 4 “hyper‐hybrids” will be funded by $2,500,000 in FTA <strong>FY</strong>11 Clean Fuels funds, with expected delivery in early <strong>FY</strong>17.<br />
STATUS<br />
N/A<br />
Expenditure Plan <strong>FY</strong><strong>2014</strong> <strong>FY</strong>2015 <strong>FY</strong>2016 <strong>FY</strong>2017 <strong>FY</strong>2018 Total 5‐Year Cost<br />
Current Year $ ‐ $ 573,200 $ 2,292,800 $ ‐ $ ‐ $ 2,866,000<br />
$ ‐ $ 573,200 $ 2,292,800 $ ‐ $ ‐ $ 2,866,000<br />
Revenue Plan <strong>FY</strong><strong>2014</strong> <strong>FY</strong>2015 <strong>FY</strong>2016 <strong>FY</strong>2017 <strong>FY</strong>2018 Total 5‐Year Cost<br />
Federal Share $ ‐ $ 458,560 $ 1,834,240 $ ‐ $ ‐ $ 2,292,800<br />
<strong>TriMet</strong> Share $ ‐ $ 114,640 $ 458,560 $ ‐ $ ‐ $ 573,200<br />
Other Source $ ‐ $ ‐ $ ‐ $ ‐ $ ‐ $<br />
‐<br />
TBD $ ‐ $ ‐ $ ‐ $ ‐ $ ‐ $<br />
‐<br />
$ ‐ $ 573,200 $ 2,292,800 $ ‐ $ ‐ $ 2,866,000<br />
Page ‐ 31
<strong>Capital</strong> <strong>Asset</strong> <strong>Management</strong> & <strong>Investment</strong> Program Vehicles Light Rail Vehicles<br />
<strong>Asset</strong> Category – Vehicles ‐ Light Rail Vehicles (LRVs)<br />
Priority<br />
To be determined by CIP Committee<br />
Background<br />
Tri‐Met has a fleet of 127 vehicles for its MAX (Metropolitan Area Express) light rail system. The fleet consists of 101 low floor cars and 26 high floor<br />
cars. A vehicle chronology follows:<br />
Type‐1 Fleet‐26<br />
The Type‐1, 26‐vehicle fleet began serving passengers on a 15‐mile line between Portland and Gresham in September 1986. These are Bombardier<br />
vehicles, designed by BN of Belgium. Bombardier, the principal shareholder of BN, assembled Tri‐Met’s vehicles in Barre, Vermont. The cars are<br />
electrically propelled (DC switched resistance drive) to a maximum design speed of 55 miles per hour, are constructed of Corten steel, and have bidirectional<br />
operating capability. They are designed with operator cabs at both ends to allow bi‐directional operation. The cars are 100% high floor with<br />
door step wells.<br />
Type‐2 Fleet‐52<br />
The Type‐2, 46‐vehicle fleet entered service between August 1997 and September 1998. This fleet entered service in conjunction with an 18‐mile<br />
system expansion to the West. These were North America’s first low floor light rail vehicles. Siemens Duewag of Germany designed the cars, with final<br />
assembly in Sacramento, California. They are designed with operator cabs at both ends to allow bi‐directional operation. The 92‐foot long cars are airconditioned<br />
and Siemens Duewag’s model SD 660 vehicle.<br />
The cars are constructed of low alloy high tensile (LAHT) steel, and designed for a top speed of 55 miles per hour with electric propulsion (AC drive) with<br />
regenerative braking. The cars are double articulated and can be operated in train sets of up to four, but are limited to two due to the length of MAX<br />
stations. These cars can be used in any combination of Type 1, Type 2 or Type 3 vehicles. Along with passenger/operator‐activated bridgeplates on the<br />
center four doors, the low floor design allows full wheelchair access. The low floor section encompasses 70% of the vehicle, which is supported by a<br />
non‐powered truck in the center articulation section.<br />
Prior to 1998 there were too few vehicles to keep pace with growing ridership. In response to these ridership trends and in consideration of the rare<br />
opportunity to purchase a small number of cars, <strong>TriMet</strong>’s Board exercised an option (in the Westside vehicle contract) to purchase 6 additional vehicles<br />
put in service in 2000 and 2001. These were also Type‐2 Siemens SD 660 vehicles.<br />
Page ‐ 32
<strong>Capital</strong> <strong>Asset</strong> <strong>Management</strong> & <strong>Investment</strong> Program Vehicles Light Rail Vehicles<br />
Background (continued)<br />
Type‐3 Fleet‐27<br />
The Type‐3 fleet was ordered in 2000 in the way of 17 vehicles and was for the Interstate MAX, Yellow Line, opening. In 2002, 10 option vehicles were<br />
ordered for system ridership growth, 7 of those for Interstate MAX through 2020 as stated in the North Corridor FEIS. These 27 vehicles are the same as<br />
Type 2’s except they are equipped with automatic passenger counters and Thermoking instead of Sutrak HVAC equipment.<br />
In October 2010 <strong>TriMet</strong> was awarded a $4.2M TIGGER II Grant to develop and install energy storage systems on its Type‐3 fleet to improve efficiency of<br />
regenerative braking. The .7 KW capacitor based systems are going into service on all 27 vehicles over the years of 2012 and 2013.<br />
Type‐4 Fleet‐22<br />
The Type‐4 fleet was ordered in 2006. The order was for 21 vehicles and they were for the I‐205/Portland Mall, Green Line extension. An option for 1<br />
more vehicle was exercised in 2008 for a total of 22. These are Siemens S70 vehicles that have a design speed of 65mph but are limited to 55mph for the<br />
<strong>TriMet</strong> MAX system. The car body is constructed of LAHT steel with an outer cladding of fiber reinforced plastic (FRP). The cab ends are enclosed by a<br />
fiberglass mask.<br />
Type 4 vehicles are not backward compatible with the previous fleet in terms of the ability to train‐line electrically with Type 1, 2 and 3 vehicles.<br />
Therefore, they are not able to run coupled together as trains with the existing Type 1, 2 or 3 vehicles in revenue service. Type 4 vehicles are singleended<br />
(have a control cab only at one end) which means they will be run as two‐car trains, since the ends of the existing and planned lines do not have<br />
loops. Single‐ended cars were selected because they have 5% greater passenger capacity.<br />
Type‐5 Fleet‐0<br />
The Type‐5 fleet was ordered in April 2012. The order is for 18 Siemens S70 vehicles. These vehicles are similar to the Type‐4 vehicles, but with less<br />
tapered windshields and cab ends, a few inches longer in the low floor section and a SD660 center section and truck. These vehicles are for the Portland<br />
Milwaukie, Orange Line which will start service in September 2015.<br />
<strong>Asset</strong> <strong>Management</strong> Goal (State of Good Repair)<br />
Maintain a fleet of light rail vehicles that are safe, clean, and reliable, to meet service requirements. This is accomplished through an annual<br />
replacement schedule using criteria of the original equipment manufacturer (OEM) recommendations, as well as, age and experience of equipment.<br />
Reliability<br />
Train failures can disrupt service and cause delays in the scheduled service. The term Service Related failure is used to define which failures are used to<br />
calculate the mean distance between failures (MDBF). <strong>TriMet</strong> defines this as any LRV system failure that may result in a service delay, even if it didn’t.<br />
This service related failures measure is based on the number of times particular symptom code are used to log in a repair on the pending work list.<br />
Page ‐ 33
<strong>Capital</strong> <strong>Asset</strong> <strong>Management</strong> & <strong>Investment</strong> Program Vehicles Light Rail Vehicles<br />
How <strong>Asset</strong>s are Maintained & Condition Evaluated<br />
The light rail operating and maintenance program reflects industry best practices. Maintenance is conducted at two modern facilities, one, Ruby<br />
Junction, 13 miles east of Portland and the other, Elmonica, 10 miles to the west of Portland. Rather than conduct major vehicle overhauls at mid‐life or<br />
periodically, Tri‐Met follows the practice of progressive overhauls by subsystem as indicated by failure rate analysis for each subsystem.<br />
Tri‐Met's overall LRV maintenance program consists of seven distinct, but mutually supportive maintenance work programs: preventive maintenance,<br />
running repairs, component rebuild, progressive overhaul, scheduled maintenance, modifications (product improvements), and equipment engineering<br />
analysis and training.<br />
Preventive Maintenance (PM) inspections, including correction of defects found, are performed on a consistent schedule based on mileage. PM<br />
inspections vary in frequency and are scheduled at intervals between of 4,500 miles, and 81,000 miles. Any periodic, scheduled inspection and<br />
maintenance tasks with intervals greater than 81,000 miles are performed under the Progressive Overhaul program. <strong>TriMet</strong>’s goal is to complete at<br />
least 80% of PM inspections on time. The actual monthly rate is usually above 90%.<br />
Running Repairs diagnose and correct defects on vehicles identified during revenue service and reported to LRV Maintenance by Transportation<br />
personnel. Vandalism and accident repairs are also classified under the Running Repairs program.<br />
The component (or unit) rebuild program refers to repairable equipment removed and replaced on the vehicle. Such equipment components or<br />
subsystems are rotated through the component rebuild section of LRV Maintenance in appropriate cycles so as to maintain availability of rebuilt or<br />
repaired components to meet running repair requirements for removal and replacement of such components. This allows much faster return of<br />
defective vehicles to service.<br />
Other scheduled maintenance tasks that are outside of preventive maintenance or progressive overhaul and are scheduled from time of completion,<br />
from measured wear limit or by seasonal requirements are captured under scheduled maintenance. Maintenance tasks such as wheel truing, car floor<br />
height adjustment and brake disc truing are examples of scheduled maintenance.<br />
Modifications are product improvements made to (1) increase vehicle reliability by decreasing failure and wear rates, (2) increase maintainability by<br />
easing or decreasing maintenance tasks, and (3) increase customer service by improving vehicle amenities or comfort. Vehicle reliability and<br />
maintainability modifications are an ever‐present element of the LRV maintenance program, and arise out of continuous analysis by equipment<br />
engineering staff, maintenance supervisors and technicians. Introduction of a new‐type vehicle fleet to operate in train consists with existing vehicle<br />
types can also require considerable modifications to existing vehicle types.<br />
Equipment engineering analysis and training functions are provided through a 4‐member staff unit working in a team effort with maintenance<br />
supervisors and technicians, continuously analyzing failure data among component subsystems, refining maintenance techniques (e.g., procedures and<br />
training, including PM program effectiveness), and developing product improvement modifications. The equipment engineering staff is dual‐function, by<br />
also serving as LRV maintenance trainers. Training program elements include (1) initial training of apprentices from <strong>TriMet</strong>'s maintenance helper<br />
Page ‐ 34
<strong>Capital</strong> <strong>Asset</strong> <strong>Management</strong> & <strong>Investment</strong> Program Vehicles Light Rail Vehicles<br />
How <strong>Asset</strong>s are Maintained & Condition Evaluated (continued)<br />
classification to become LRV maintenance technicians (30‐month program of classroom and on‐the‐job training), (2) technician recurrent training, and<br />
(3) training of technicians and apprentices on modifications, new or revised maintenance procedures, and new types of LRVs or maintenance<br />
equipment.<br />
The condition criteria are based on the operational goals of the equipment, including reliability, life cycle, appearance and cost. Both the on‐board<br />
vehicle equipment and the maintenance support equipment are included, but in separate assessments. The assessment and monitoring of the condition<br />
initially follows the original equipment manufacture (OEM) recommendations, and then varies with experience and age of the equipment. An evaluation<br />
is performed on most vehicle equipment at the first OEM predetermined overhaul interval. The data gained from the evaluation is weighed against the<br />
OEM recommendation and then developed into a program. The vehicle equipment is evaluated as follows:<br />
Car Body<br />
The car body evaluation interval is established by a combination of appearance, OEM recommendation, and PM defect evaluation. The<br />
extent of the overhaul is determined by the car body evaluation. It includes the exterior car shell, roof, under car frame, and step wells. This<br />
is usually performed one time at mid‐life of the vehicle. The evaluation is weighed against the OEM recommendations and the overhaul plan<br />
is developed and performed on the fleet.<br />
Truck to Car Body Connection<br />
The Type‐1, 2, 3 slewing ring connection to the car body is lubed and rotated on a scheduled interval for both the inner and outer races. An<br />
evaluation is performed after the inner and outer race clocking has gone through one complete rotation. The evaluation is weighed against<br />
the OEM recommendations. In the case of the Type ‐ 1, 2, 3 slewing rings, replacement is necessary at this interval.<br />
The Type‐4 uses a king pin bushing arrangement instead of a slewing ring. At the OEM recommended interval, the bushing is evaluated. The<br />
evaluation is weighed against the OEM recommendations and the overhaul plan is developed and performed on the fleet.<br />
Trucks<br />
In the Portland Oregon climate and MAX system operating environment, the truck frame and bolster will outlast the car without the need of<br />
overhaul. Paint touch up is performed as needed. The rest of the components mounted to the truck have their own individual overhaul<br />
schedules. Because of the extensive truck removal/install/disassembly labor, truck component overhauls are bundled with tire replacement<br />
when practical.<br />
Gear Box<br />
Gear lube samples are monitored for rising particulate counts in bearing and gear metals within the Preventive Maintenance (PM) program.<br />
Page ‐ 35
<strong>Capital</strong> <strong>Asset</strong> <strong>Management</strong> & <strong>Investment</strong> Program Vehicles Light Rail Vehicles<br />
How <strong>Asset</strong>s are Maintained & Condition Evaluated (continued)<br />
At first OEM overhaul interval or at a high gear lube particulate count, two gear boxes are sent to the OEM for evaluation. If the evaluation<br />
result doesn’t recommend overhaul, none is done. This process is repeated until the OEM recommends an overhaul. Materials are<br />
acquired and an overhaul program is developed and performed on the fleet. The next evaluation interval is set by adding the OEM<br />
recommended interval to the overhaul completion mileage for the first component overhauled.<br />
Traction Motors<br />
In most cases the armature (DC motor) or rotor (AC motor) bearings set the overhaul interval for traction motors, although the motors are<br />
also monitored through the reliability and preventive maintenance program.. At each OEM scheduled bearing replacement interval, two<br />
traction motors are sent to a certified motor repair shop for evaluation and recommendations. The evaluation is weighed against the OEM<br />
recommendations and an overhaul plan is developed and performed on the fleet. The next evaluation interval is set by adding the OEM<br />
recommended interval to the overhaul completion mileage for the first component overhauled.<br />
Hydraulic Friction Brake Actuators<br />
The friction brake actuators are monitored through the reliability program, and hydraulic fluid samples for rising particulate counts in seal<br />
material and pump gear metals within the Preventive Maintenance (PM) program. At the first OEM overhaul interval, or at high particulate<br />
count, or at an indication in the reliability monitoring, two units are either evaluated in house or are sent to the OEM for evaluation. The<br />
evaluation is weighed against the OEM recommendations and an overhaul plan is developed and performed on the fleet. The next<br />
evaluation interval is set by adding experienced interval to the overhaul completion mileage for the first component overhauled.<br />
Rubber Vulcanized Truck Components<br />
The rubber vulcanized truck components consist of the primary suspension, T‐1 secondary suspension, and axle coupling elements. Each of<br />
these has a different duty cycle and therefore different overhaul schedule. The condition is monitored through measurements and<br />
inspection inside and outside of the preventive maintenance program. At the point where the condition is approaching the condemn<br />
criteria, the overhaul interval is established and an overhaul plan is developed and performed on the fleet. The next evaluation interval is<br />
set by adding experienced interval to the overhaul completion mileage for the first component overhauled.<br />
Axle Bearings<br />
The axle bearings on all of the fleets are overhauled at the OEM recommended interval. An evaluation is done by the bearing manufacture<br />
on one of the bearings only to ensure that normal wear has occurred. The next evaluation interval is set by adding the OEM recommended<br />
interval to the overhaul completion mileage for the first component overhauled.<br />
Page ‐ 36
<strong>Capital</strong> <strong>Asset</strong> <strong>Management</strong> & <strong>Investment</strong> Program Vehicles Light Rail Vehicles<br />
How <strong>Asset</strong>s are Maintained & Condition Evaluated (continued)<br />
Tires and Friction Brake Disc<br />
The tires are trued within our scheduled maintenance program at pre‐established intervals. The brake discs are trued based on dish wear.<br />
Both are overhauled based on condemn measurements. The overhaul which is the replacement of these components is performed as<br />
needed; however, the wear rate is relatively the same across each fleet and each fleet start accumulating mileage at about the same time, so<br />
the overhaul comes due within a narrow window of time on the same fleet.<br />
Couplers<br />
The couplers are monitored through wear measurements within the preventive maintenance program. They are also monitored through the<br />
reliability program. Very little weight is placed on the OEM recommended interval, because the other two monitoring systems work well to<br />
identify the overhaul need.<br />
Doors<br />
Doors are monitored through the PM program and the reliability reporting program. An evaluation can be triggered by either of these or by<br />
the OEM recommended overhaul interval, whichever comes first. Two doors are evaluated to determine the extent of the overhaul. The<br />
evaluation is weighed against the OEM recommendations and an overhaul plan is developed and performed on the fleet. The next<br />
evaluation interval is set by adding the OEM recommended interval to the overhaul completion mileage for the first component overhauled.<br />
Hydraulic Friction Brake Pump Units<br />
The friction brake pump units are monitored through the reliability program, and hydraulic fluid samples for rising particulate counts in seal<br />
material and pump gear metals within the Preventive Maintenance (PM) program. At the first OEM overhaul interval, or at high particulate<br />
count, or at an indication in the reliability monitoring, two units are either evaluated in house or are sent to the OEM for evaluation. The<br />
evaluation is weighed against the OEM recommendations and an overhaul plan is developed and performed on the fleet. The next<br />
evaluation interval is set by adding the experienced interval to the overhaul completion mileage for the first component overhauled.<br />
Bridgeplates<br />
Bridgeplates are monitored through the PM program and the reliability reporting program. An evaluation can be triggered by either of these<br />
or by the OEM recommended overhaul interval, whichever comes first. One car set (four bridgeplates) is evaluated to determine the extent<br />
of the overhaul. The evaluation is weighed against the OEM recommendations and an overhaul plan is developed and performed on the<br />
fleet. The next evaluation interval is set by adding the OEM recommended interval to the overhaul completion mileage for the first<br />
component overhauled.<br />
Page ‐ 37
<strong>Capital</strong> <strong>Asset</strong> <strong>Management</strong> & <strong>Investment</strong> Program Vehicles Light Rail Vehicles<br />
How <strong>Asset</strong>s are Maintained & Condition Evaluated (continued)<br />
Pantograph<br />
Type 1 pantographs are on a ten year overhaul program schedule. The Type 2 and Type 3 pantographs are on an eight year overhaul<br />
program schedule. Type 4 Pantographs are monitored through the PM program and the reliability reporting program. An evaluation can be<br />
triggered by either of these or by the OEM recommended overhaul interval (eight years), whichever comes first. The evaluation will be<br />
weighed against the OEM recommendations and an overhaul plan is developed and performed on the fleet. The next evaluation interval is<br />
set by adding the OEM recommended interval to the overhaul completion mileage for the first component overhauled.<br />
HVAC<br />
The Type 1 HVAC units were installed as part of a fleet retrofit prior to the arrival of the Type 2 vehicle. Both the Type 1 and Type 2 fleets are<br />
equipped with a Sutrak HVAC unit, and these units initially experienced a very high rate of compressor failures. To correct these failures<br />
several modifications were made to the Sutrak unit and the compressors were upgraded to a more reliable model. All HVAC units are<br />
monitored through the PM program and the reliability reporting program, and fleet overhaul intervals are based on data collected from<br />
these programs.<br />
Overhaul<br />
<strong>TriMet</strong>'s LRV maintenance program seeks to keep current with the entire scope of vehicle maintenance requirements, and therefore seeks to avoid<br />
requirements for mid‐life remanufacturing for its LRVs. Accordingly, long‐cycle tasks (beyond the 81,000 PM program cycle) are also scheduled based on<br />
continuing fleet condition assessment and design of overhaul campaigns.<br />
Each overhaul campaign bundles multiple overhaul tasks which are due, for simultaneous performance on each vehicle cycled through the campaign, for<br />
efficient overhaul program production. This progressive overhaul approach was recognized by USDOT in a 1995 report as best‐practice in the rail transit<br />
industry, preferable to mid‐life vehicle remanufacturing in terms of keeping the fleet continuously in service at a higher spare ratio and in minimizing<br />
fleet life‐cycle total cost.<br />
Page ‐ 38
<strong>Capital</strong> <strong>Asset</strong> <strong>Management</strong> & <strong>Investment</strong> Program Vehicles Light Rail Vehicles<br />
Condition Scale<br />
The fleet condition is rated against <strong>TriMet</strong> goals for serviceability, reliability, appearance, wear, and predetermined life cycle. The condition assessment<br />
is rated on a scale of 1‐5 as follows:<br />
1 – Like new condition with routine cleaning and preventive type maintenance required, may still be under warranty.<br />
2 ‐ Good Condition with routine cleaning and preventive type maintenance required<br />
3 – Fair and serviceable condition, within range of mid‐life, with routine cleaning and some extensive maintenance or overhaul required.<br />
4 – Poor condition, still serviceable, but near end of service life, with major maintenance, overhaul or replacement required.<br />
5 – Replacement or overhaul needed immediately. Equipment is not serviceable.<br />
The following is the condition rating of the LRV Equipment:<br />
CAR BODY<br />
TRUCK to CAR<br />
BODY<br />
LRV<br />
Type<br />
Condition<br />
Rating<br />
LRV<br />
Type<br />
Condition<br />
Rating<br />
I 2 I 3<br />
II, III 3 II, III 4<br />
IV 2 IV 2<br />
TRUCKS<br />
Gear Box Traction Motors<br />
Hydraulic Friction Rubber Vulcanized<br />
Tires and Friction<br />
Axle Bearings<br />
Brake Actuators Truck Components<br />
Brake Disc<br />
LRV<br />
Type<br />
Condition<br />
Rating<br />
LRV<br />
Type<br />
Condition<br />
Rating<br />
LRV<br />
Type<br />
Condition<br />
Rating<br />
LRV<br />
Type<br />
Condition<br />
Rating<br />
LRV<br />
Type<br />
Condition<br />
Rating<br />
LRV<br />
Type<br />
Condition<br />
Rating<br />
I 3 I 3 I 3 I 3 I 2 I 3<br />
II, III 4 II, III 3 II, III 3 II, III 3 II, III 3 II, III 3<br />
IV 2 IV 2 IV 2 IV 2 IV 1 IV 3<br />
CAR SYSTEM<br />
Couplers<br />
Doors<br />
Hydraulic Friction<br />
Brake Pump Units<br />
Bridgeplates Pantograph HVAC<br />
LRV<br />
Type<br />
Condition<br />
Rating<br />
LRV<br />
Type<br />
Condition<br />
Rating<br />
LRV<br />
Type<br />
Condition<br />
Rating<br />
LRV<br />
Type<br />
Condition<br />
Rating<br />
LRV<br />
Type<br />
Condition<br />
Rating<br />
LRV<br />
Type<br />
Condition<br />
Rating<br />
I 2 I 4 I 3 I NA I 3 I 3<br />
II, III 4 II, III 4 II, III 3 II, III 3 II, III 3 II, III 3<br />
IV 2 IV 2 IV 2 IV 2 IV 3 IV 2<br />
Page ‐ 39
<strong>Capital</strong> <strong>Asset</strong> <strong>Management</strong> & <strong>Investment</strong> Program Vehicles Light Rail Vehicles<br />
Light Rail Vehicle Replacements<br />
LRVs have significantly longer life cycle than that of buses, with an expected useful life cycle of 36 and 41 years depending on type of LRV.<br />
TABLE 2A. VEHICLES SYSTEMS - LIGHT RAIL VEHICLES<br />
ITEM REQUIRED<br />
PROJECT TOTAL<br />
MANAGER FLEET<br />
YEAR OF<br />
PURCHASE<br />
ACTION<br />
NEEDED<br />
<strong>FY</strong><br />
NEEDED<br />
CURRENT<br />
AGE <strong>FY</strong>14<br />
OPTIMUM/<br />
MINIMUM<br />
REPLACEMENT<br />
CYCLE 1 COND. <strong>2014</strong> 2015 2016 2017 2018<br />
<strong>FY</strong>14-<strong>FY</strong>18<br />
TOTAL<br />
LIGHT RAIL VEHICLES Griffiths<br />
Type 1 LRVs (Banfield LRT) 26 1986 Replace 2027 28 41 1 $0 $0 $0 $0 $0 $0<br />
Type 2 LRVs (Westside LRT) 46 1998 Replace 2034 16 36 1 $0 $0 $0 $0 $0 $0<br />
Type 2 LRVs (Airport MAX) 6 2000 Replace 2036 14 36 1 $0 $0 $0 $0 $0 $0<br />
Type 3 LRVs (Interstate MAX) 27 2004 Replace 2040 10 36 1 $0 $0 $0 $0 $0 $0<br />
Type 4 LRVs (I-205/Mall) 22 2009 Replace 2045 5 36 1 $0 $0 $0 $0 $0 $0<br />
127 GRAND TOTAL VEHICLE SYSTEMS. . . . $0 $0 $0 $0 $0 $0<br />
Light Rail Vehicle Component Replacements<br />
Table 2B<br />
Estimated Replacements<br />
Estimated Replacement Costs<br />
Fleet <strong>FY</strong>14 <strong>FY</strong>15 <strong>FY</strong>16 <strong>FY</strong>17 <strong>FY</strong>18 <strong>FY</strong>14 <strong>FY</strong>15 <strong>FY</strong>16 <strong>FY</strong>17 <strong>FY</strong>18 <strong>FY</strong>14‐<strong>FY</strong>18 Total<br />
Total Component Replacements Type 1 179 172 240 188 214 $ 610,000 $ 680,500 $ 806,500 $ 615,500 $ 667,500 $ 3,380,000<br />
Type 2/3 1,150 1,037 590 603 539 $ 4,183,000 $ 3,554,210 $ 1,588,310 $ 1,472,310 $ 1,378,820 $ 12,176,650<br />
Type 4 175 242 176 115 94 $ 416,500 $ 631,000 $ 540,000 $ 282,500 $ 221,727 $ 2,091,727<br />
Total 1,504 1,451 1,006 906 847 $ 5,209,500 $ 4,865,710 $ 2,934,810 $ 2,370,310 $ 2,268,047 $ 17,648,377<br />
Assumed Maintenance Budget Baseline (3% inflation) $ 1,701,170 $ 1,752,205 $ 1,804,771 $ 1,858,914 $ 1,914,682 $ 9,031,743<br />
Net Additional LRV Component Overhaul Total $ 3,508,330 $ 3,113,505 $ 1,130,039 $ 511,396 $ 353,365 $ 8,616,635<br />
Car Count<br />
Average<br />
Per Car Averages Type 1 26 6.88 6.62 9.23 7.23 8.23 $ 23,462 $ 26,173 $ 31,019 $ 23,673 $ 25,673 $ 26,000<br />
Type 2/3 79 14.56 13.13 7.47 7.63 6.82 $ 52,949 $ 44,990 $ 20,105 $ 18,637 $ 17,453 $ 30,827<br />
Type 4 22 7.95 11.00 8.00 5.23 4.27 $ 18,932 $ 28,682 $ 24,545 $ 12,841 $ 10,079 $ 19,016<br />
Average 11.84 11.43 7.92 7.13 6.67 $ 41,020 $ 38,313 $ 23,109 $ 18,664 $ 17,859 $ 27,793<br />
Page ‐ 40
<strong>Capital</strong> <strong>Asset</strong> <strong>Management</strong> & <strong>Investment</strong> Program Vehicles Light Rail Vehicles<br />
Light Rail Vehicle Equipment >$5,000<br />
TABLE 13A. OPERATIONS - CAPITAL LIGHT RAIL SHOP EQUIPMENT (>$5,000)<br />
PROJECT<br />
MANAGER<br />
ACTION<br />
NEEDED<br />
<strong>FY</strong><br />
NEEDED<br />
YEAR OF CURRENT<br />
PURCHASE AGE <strong>FY</strong>14<br />
OPTIMUM<br />
REPLACEMENT<br />
CYCLE COND <strong>2014</strong> 2015 2016 2017 2018<br />
<strong>FY</strong>14-<strong>FY</strong>18<br />
TOTAL<br />
ITEM REQUIRED<br />
RUBY JUNCTION CAPITAL<br />
LRV Truck Overhaul Area<br />
Grove<br />
Dake Axle Press Recondition 2013 1984 30 10/20 Fair-3 $10,000 $10,000<br />
Penn Tire Press Recondition 2015 1984 30 10/20 Good-2 $4,000 $4,000<br />
Forklift Hyster Replace <strong>2014</strong> 1984 30 10/20 Poor-4 $35,000 $35,000<br />
Total LRV Truck Overhaul Area. . . . $45,000 $4,000 $0 $0 $0 $49,000<br />
LRV Component Rebuild<br />
Grove<br />
Monitor Simulator #3, also used on shop floor Recondition 2016 1987 27 5/10 Poor-4 $5,000 $5,000<br />
OmegaSonics Ultrasonic cleaner Replace 2015 2005 9 Poor-4 $15,000 $15,000<br />
Total LRV Component Rebuild. . . . $0 $15,000 $5,000 $0 $0 $20,000<br />
Training/Engineering<br />
Grove<br />
Thermal Array Recorder 9000 # 7058258 Replace 2018 1997 17 5/10 Fair-3 $30,000 $30,000<br />
Total Training/Engineering. . . . $0 $0 $0 $0 $30,000 $30,000<br />
Page ‐ 41
<strong>Capital</strong> <strong>Asset</strong> <strong>Management</strong> & <strong>Investment</strong> Program Vehicles Light Rail Vehicles<br />
Light Rail Vehicle Equipment >$5,000 (continued)<br />
PROJECT<br />
MANAGER<br />
Grove<br />
ACTION<br />
NEEDED<br />
<strong>FY</strong><br />
NEEDED<br />
YEAR OF CURRENT<br />
PURCHASE AGE <strong>FY</strong>14<br />
OPTIMUM<br />
REPLACEMENT<br />
CYCLE COND <strong>2014</strong> 2015 2016 2017 2018<br />
<strong>FY</strong>14-<strong>FY</strong>18<br />
TOTAL<br />
ITEM REQUIRED<br />
Shop Floor/Facility<br />
Pad force tester 2017 2004 10 10/20 Fair-3 $3,000 $3,000<br />
Portable Jacks - Washtronics Recondition <strong>2014</strong> 1987 27 10/20 Good-2 $3,000 $3,000<br />
Portable Jacks - Washtronics Recondition <strong>2014</strong> 1987 27 10/20 Good-2 $3,000 $3,000<br />
Portable Jacks - Washtronics Recondition <strong>2014</strong> 1987 27 10/20 Good-2 $3,000 $3,000<br />
Portable Jacks - Washtronics Recondition <strong>2014</strong> 1987 27 10/20 Good-2 $3,000 $3,000<br />
Portable Jacks - Washtronics Recondition <strong>2014</strong> 1987 27 10/20 Good-2 $3,000 $3,000<br />
Portable Jacks - Washtronics Recondition <strong>2014</strong> 1987 27 10/20 Good-2 $3,000 $3,000<br />
Portable Jacks - Washtronics Recondition <strong>2014</strong> 1987 27 10/20 Good-2 $3,000 $3,000<br />
Portable Jacks - Washtronics Recondition <strong>2014</strong> 1987 27 10/20 Good-2 $3,000 $3,000<br />
Floor/upholstry cleaner-Everest 408HP Recondition 2015 2009 5 10/20 Good-2 $3,000 $3,000<br />
Floor/upholstry cleaner-Prochem Performenr 405 Replace 2015 1998 16 10/20 Poor-4 $27,000 $27,000<br />
Total Shop Floor/Facility. . . . $24,000 $30,000 $0 $3,000 $0 $57,000<br />
Ground Floor Tool/Storeroom<br />
Grove<br />
Monitor Simulator #1 Recondition <strong>2014</strong> 1986 28 10/20 Poor-4 $5,000 $5,000<br />
Total Ground Floor Tool/Storeroom. . . . $5,000 $0 $0 $0 $0 $5,000<br />
Ruby South/Body Shop<br />
Grove<br />
Body Shop Air Man Lifts Recondition <strong>2014</strong> 2009 5 10/20 Good-2 $3,000 $3,000 $6,000<br />
Body Shop Air Man Lifts Recondition <strong>2014</strong> 2009 5 10/20 Good-2 $3,000 $3,000 $6,000<br />
Metal Break Manual Replace <strong>2014</strong> 1986 28 20/30 Poor-4 $10,000 $10,000<br />
Metal Muncher Iron Worker 49T #32071188 Recondition <strong>2014</strong> 1989 25 20/30 Good-2 $3,000 $3,000<br />
Total Ruby South/Body Shop. . . . $19,000 $0 $0 $6,000 $0 $25,000<br />
TOTAL RUBY CAPITAL. . . . $93,000 $49,000 $5,000 $9,000 $30,000 $186,000<br />
ELMONICA CAPITAL<br />
Blair<br />
TOTAL ELMONICA CAPITAL. . . . $0 $0 $0 $0 $0 $0<br />
GRAND TOTAL LIGHT RAIL SHOP EQUIPMENT (>$5,000). . . .<br />
$93,000 $49,000 $5,000 $9,000 $30,000 $186,000<br />
Page ‐ 42
<strong>Capital</strong> <strong>Asset</strong> <strong>Management</strong> & <strong>Investment</strong> Program Vehicles Light Rail Vehicles<br />
Light Rail Vehicle Equipment ≤$5,000<br />
TABLE 13B. OPERATIONS - OPERATIONS LIGHT RAIL SHOP EQUIPMENT (
<strong>Capital</strong> <strong>Asset</strong> <strong>Management</strong> & <strong>Investment</strong> Program Vehicles Light Rail Vehicles<br />
Light Rail Vehicle Projects – Rail Equipment Maintenance<br />
Project Name: Rail Maintenance Equipment Project ID: 7504<br />
Project Class: Vehicles Priority: S<br />
Start Date: Continuous Completion Date: Continuous Project Type: <strong>Capital</strong>/Operating<br />
Budgeted Dept: Rail Equipment Maintenance Project Manager: Grove<br />
PROJECT DESCRIPTION<br />
1) Upgrade Blowdown Turntable (Ruby) ‐ $73,000 (<strong>FY</strong>2016)<br />
2) Cleaner Cart Shed (Ruby) ‐ $20,000 (<strong>FY</strong> 2015)<br />
3) Aqueous Parts Cleaner (Elmo) ‐ $15,000 (<strong>FY</strong> 2015)<br />
4) Upgrade girders & install 7 ½ ton crane on M5 Ruby ‐ $100,000 (<strong>FY</strong> 2017)<br />
5) Crane for Rebuild Area (Ruby) ‐ $25,000 (<strong>FY</strong><br />
6) Additional contingency amount ‐ $13,000 <strong>FY</strong> <strong>2014</strong>, $3,000 <strong>FY</strong> 2015, $40,000 <strong>FY</strong> 2018<br />
PROJECT JUSTIFICATION<br />
1) Ruby Blowdown Turntable is now used on a daily basis for Truck work. All cleaning is being done in the blowdown due to the amount of dirt/grease on<br />
Trucks and their components. Currently it takes a couple of Technicians or the Power Pusher with a long bar to rotate it. We average about 1 request a year<br />
to get the Turntable working, and the repair work has gotten less and less effective in reducing resistance.<br />
2) The cleaner cart shed is needed to keep carts out of the weather at Ruby Junction. If this provided as part of the Ruby Expansion for Orange Line, it won’t<br />
be needed in this budget.<br />
3) Needed to clean parts for Elmo overhaul program.<br />
4) Ruby Truck work has grown to require more area. To accommodate expanding truck shop into M5n at Ruby, a 2 nd 7 ½ tone crane is needed.<br />
5) Needed to lift and carry heavy parts from one point to another in Rebuild Area.<br />
STATUS<br />
N/A<br />
Expenditure Plan <strong>FY</strong><strong>2014</strong> <strong>FY</strong>2015 <strong>FY</strong>2016 <strong>FY</strong>2017 <strong>FY</strong>2018 Total 5‐Year Cost<br />
Current Year $ 38,000 $ 38,000 $ 73,000 $ 100,000 $ 40,000 $ 289,000<br />
$ 38,000 $ 38,000 $ 73,000 $ 100,000 $ 40,000 $ 289,000<br />
Revenue Plan <strong>FY</strong><strong>2014</strong> <strong>FY</strong>2015 <strong>FY</strong>2016 <strong>FY</strong>2017 <strong>FY</strong>2018 Total 5‐Year Cost<br />
Federal Share $ ‐ $ ‐ $ ‐ $ ‐ $ ‐ $<br />
‐<br />
<strong>TriMet</strong> Share $ 38,000 $ 38,000 $ 73,000 $ 100,000 $ 40,000 $ 289,000<br />
Other Source $ ‐ $ ‐ $ ‐ $ ‐ $ ‐ $<br />
‐<br />
TBD $ ‐ $ ‐ $ ‐ $ ‐ $ ‐ $<br />
‐<br />
$ 38,000 $ 38,000 $ 73,000 $ 100,000 $ 40,000 $ 289,000<br />
Page ‐ 44
<strong>Capital</strong> <strong>Asset</strong> <strong>Management</strong> & <strong>Investment</strong> Program Vehicles ATP‐LIFT Vehicles<br />
<strong>Asset</strong> Category – Vehicles – ATP‐LIFT Vehicles<br />
ATP‐LIFT Replacements<br />
TABLE 3A. ATP/LIFT VEHICLE REPLACEMENT & EXPANSION<br />
ATP BUSES - ACTIVE FLEET<br />
FLEET <strong>FY</strong> BUS FLEET BUS MAKE & AGE END <strong>FY</strong> REPLACE<br />
NBR BUILT LENGTH SIZE DESCRIPTION <strong>2014</strong> END <strong>FY</strong> CURRENT <strong>2014</strong> 2015 2016 2017 2018<br />
23 1998 24 22 Ford Eldorado 16 2008 0 0 0 0 0 0<br />
24 1999 24 49 Ford Eldorado 15 2009 0 0 0 0 0 0<br />
25 2000 24 27 Ford Eldorado 14 2011 0 0 0 0 0 0<br />
26 2001 24 33 Ford Eldorado 13 2011 0 0 0 0 0 0<br />
27 2002 24 45 Ford Eldorado 12 2012 0 0 0 0 0 0<br />
28 2003 24 8 Ford Eldorado 11 2013 0 0 0 0 0 0<br />
29 2005 12 15 4 Door Sedan 9 2010 0 0 0 0 0 0<br />
30 2006 24 39 Ford Eldorado 8 2013 0 0 0 0 0 0<br />
31 2007 24 49 Ford Eldorado 7 2015 49 49 0 0 0 0<br />
32 2008 24 1 Ford Eldorado 6 2016 1 1 1 0 0 0<br />
33 2008 24 50 Ford Eldorado 6 2016 50 50 50 0 0 0<br />
34 2011 15 Dodge Vans 3 2016 15 15 15 0 0 0<br />
35 2011 24 15 Chevy ElDorado 3 2019 15 15 15 15 15 15<br />
36 2011 23 1 Supreme Hybrid 3 2019 1 1 1 1 1 1<br />
37 2011 23 26 Chevy ElDorado 3 2019 26 26 26 26 26 26<br />
38 2012 23 84 Chevy ElDorado 2 2020 84 84 84 84 84 84<br />
39 2013 23 27 Cut Away 1 2021 27 27 27 27 27 27<br />
40 2015 24 49 Cut Away 0 2023 49 49 49 49<br />
41 2016 24 51 Cut Away 0 2024 51 51 51<br />
42 2016 15 Vans 0 2021 15 15 15<br />
Fleet Size 268 268 268 268 268 268<br />
Weighted Fleet Age 3.79 3.32 2.52 3.52 4.52<br />
NOTE: "Fleet Size" reflects original size of the fleet and "Current" reflects fleet status as of the end of <strong>FY</strong>13.<br />
Page ‐ 45
<strong>Capital</strong> <strong>Asset</strong> <strong>Management</strong> & <strong>Investment</strong> Program Vehicles ATP‐LIFT Vehicles<br />
ATP‐LIFT Replacements Continued<br />
Minimum Service Expansion Buses (0% )<br />
Expansion in Peak Pullout<br />
Expansion in Fleet Requirements<br />
Total Peak (221 as of 11/12)<br />
Spares (20%)<br />
Total Fleet Requirement<br />
WD Ridership % Increase 0.1% 0.1% 0.1% 0.1% 0.1%<br />
Peak Pullouts 224 225 225 226 226<br />
Spare Ratio** 19.64% 19.11% 19.11% 18.58% 18.58%<br />
Total Fleet Requirement 268 268 268 268 268<br />
Replacement Bus 0 49 51 0 0<br />
Replace Vans 0 0 15 0 0<br />
Expansion Bus 0 0 0 0 0<br />
Expansion Van 0 0 0 0 0<br />
Total Vehicle Purchase 0 49 66 0 0<br />
Note:<br />
** Does not reflect separate spares for bus and van fleets.<br />
Page ‐ 46
<strong>Capital</strong> <strong>Asset</strong> <strong>Management</strong> & <strong>Investment</strong> Program Vehicles ATP‐LIFT Vehicles<br />
ATP‐LIFT Replacements (continued)<br />
TABLE 3B. ATP/LIFT CAPITAL REQUIREMENTS - VEHICLES<br />
ATP/LIFT VEHICLES - CAPITAL REQUIREMENTS<br />
BUS MAKE & # OF YEAR REPLACEMENT <strong>FY</strong>14-<strong>FY</strong>18<br />
DESCRIPTION VEHICLES NEEDED CYCLE <strong>FY</strong>14 <strong>FY</strong>15 <strong>FY</strong>16 <strong>FY</strong>17 <strong>FY</strong>18 TOTAL<br />
BDS Components/Installation<br />
Replacement Buses<br />
24 FT Paratransit Vehicles 0 <strong>2014</strong> 8 Years $0 $0<br />
24 FT Paratransit Vehicles 49 2015 8 Years $4,385,500 $4,385,500<br />
24 FT Paratransit Vehicles 51 2016 8 Years $4,564,500 $4,564,500<br />
24 FT Paratransit Vehicles 0 2017 8 Years $0 $0<br />
24 FT Paratransit Vehicles 0 2018 8 Years $0 $0<br />
Replacement for Sedans<br />
Passenger Van 15 2016 5 Years $727,500 $727,500<br />
Passenger Van 0 2017 5 Years $0 $0<br />
Passenger Van 0 2018 5 Years $0 $0<br />
Total Replacement $0 $4,385,500 $5,292,000 $0 $0 $9,677,500<br />
Expected Expansion Buses<br />
24 FT Paratransit Vehicles 0 <strong>2014</strong> 8 Years $0 $0<br />
24 FT Paratransit Vehicles 0 2015 8 Years $0 $0<br />
24 FT Paratransit Vehicles 0 2016 8 Years $0 $0<br />
24 FT Paratransit Vehicles 0 2017 8 Years $0 $0<br />
24 FT Paratransit Vehicles 0 2018 8 Years $0 $0<br />
Expected Expansion Vans<br />
Passenger Van 0 <strong>2014</strong> 5 Years $0 $0<br />
Passenger Van 0 2015 5 Years $0 $0<br />
Passenger Van 0 2016 5 Years $0 $0<br />
Passenger Van 0 2017 5 Years $0 $0<br />
Passenger Van 0 2018 5 Years $0 $0<br />
Total Expected Expansion $0 $0 $0 $0 $0 $0<br />
Total ATP/LIFT Requirements $0 $4,385,500 $5,292,000 $0 $0 $9,677,500<br />
Page ‐ 47
<strong>Capital</strong> <strong>Asset</strong> <strong>Management</strong> & <strong>Investment</strong> Program Vehicles ATP‐LIFT Vehicles<br />
ATP‐LIFT Vehicle Equipment >$5,000<br />
TABLE 17A. LIFT SHOP EQUIPMENT (>$5,000)<br />
ITEM REQUIRED<br />
PROJECT ACTION<br />
MANAGER NEEDED<br />
<strong>FY</strong><br />
NEEDED<br />
YEAR OF CURRENT<br />
PURCHASE AGE <strong>FY</strong>14<br />
OPTIMUM<br />
REPLACEMENT<br />
CYCLE COND. <strong>2014</strong> 2015 2016 2017 2018<br />
<strong>FY</strong>14-<strong>FY</strong>18<br />
TOTAL<br />
ATP/LIFT MAINT SHOP EQUIPMENT<br />
Elmore<br />
Forklift, Caterpillar T80-D Replace 2016 1985 29 20 2 $30,000 $30,000<br />
Brake Lathe, (Ammco) Replace 2017 1999 15 10/15 1 $6,000 $6,000<br />
Engine Analyzer Replace 2018 2007 7 10/15 1 $10,000 $10,000<br />
Front End Alignment Machine Replace 2018 2001 13 10/15 2 $30,000 $30,000<br />
Lift (4) Ea. Mohawk 25K Cap-W/2 Elect Hyd Jacks Replace 2017 1991 23 10/15 2 $40,000 $40,000<br />
Lift, Gray TNT-550-Air-End Replace 2017 1993 21 10/15 2 $9,000 $9,000<br />
Lift, One (1) Mohawk Replace 2017 2001 13 6/10 1 $10,000 $10,000<br />
TOTAL ATP. . . .<br />
$0 $0 $30,000 $65,000 $40,000 $135,000<br />
ATP‐LIFT Vehicle Equipment ≤ $5,000<br />
TABLE 17B. LIFT SHOP EQUIPMENT (
<strong>Capital</strong> <strong>Asset</strong> <strong>Management</strong> & <strong>Investment</strong> Program Vehicles Non‐Revenue Vehicles<br />
<strong>Asset</strong> Category – <strong>TriMet</strong> Non‐Revenue Vehicles (NRV)<br />
Priority<br />
To be determined by CIP Committee<br />
<strong>Asset</strong> <strong>Management</strong> Goal<br />
It is the mission of NRV maintenance to provide safe, clean, and reliable vehicles, in the most cost effective manner for our customers. This is<br />
accomplished through a comprehensive preventative maintenance program that requires practical planning and coordination of available resources.<br />
Key <strong>Asset</strong> <strong>Management</strong> Performance Indicators/Goals<br />
Our goal is to provide a framework to continually explore improving NRV maintenance and implementation of best practices through:<br />
Maximizing the use of existing resources to increase service and extend vehicle life.<br />
Create effective employee forums that draw out the best thinking from staff.<br />
Work in full partnership with the Original Equipment Manufacturers (OEM) to implement system efficiencies.<br />
Sustain a work environment that continually finds ways to improve maintenance repair and processes.<br />
Leverage and capitalize on new technologies.<br />
How <strong>Asset</strong> is Maintained & Condition Evaluated<br />
Utilizing <strong>TriMet</strong>’s Maintenance <strong>Management</strong> Information System (MMIS), preventative maintenance intervals are determined and scheduled based<br />
the OEM recommended PM periods and the vehicle operating conditions. To ensure that reduced number reactive repairs are performed, the PM<br />
schedule listed below is used. Our objective is to have all NRV maintenance and repairs scheduled rather than unscheduled.<br />
Preventative Maintenance Schedule<br />
Inspection Type<br />
Miles<br />
A level PM 5,000<br />
B level PM 50,000<br />
Low Mileage Use Vehicles<br />
Inspection Type<br />
A level PM<br />
B level PM<br />
PM Generated Based on Date<br />
Every 365 days<br />
Every 5 years<br />
Department of Environmental Quality (DEQ) tests are performed on each gasoline powered non‐revenue vehicle on a semi‐annual basis. The MMIS<br />
is set up so that each vehicle comes due for a DEQ inspection on the first of the month that corresponds with the last number of the vehicle’s license<br />
plate number.<br />
Page ‐ 49
<strong>Capital</strong> <strong>Asset</strong> <strong>Management</strong> & <strong>Investment</strong> Program Vehicles Non‐Revenue Vehicles<br />
Condition Scale<br />
The condition rating scale is as follows:<br />
1 – <strong>Asset</strong> is newly put into service and warranty is in effect.<br />
2 – Warranty has expired and no defects/wear has been identified during PM cycle<br />
3 – Slight wear evident, PM cycle shows no defects<br />
4 – Excess wear, defects require attention beyond PM cycle<br />
5 – <strong>Asset</strong> is out of service and can no longer function safely<br />
Level of Criticality<br />
The level of criticality for this discipline is applied to the following items:<br />
Safety<br />
Service Reliability, Risk of Degradation<br />
Economic Life of the <strong>Asset</strong><br />
Level of Service <strong>Investment</strong><br />
High<br />
High<br />
Medium<br />
High<br />
<strong>Asset</strong> Replacement Criteria<br />
The NRV Maintenance Equipment Replacement and Repair <strong>Capital</strong> Program Tables that list all NRV assets are reviewed quarterly to determine<br />
condition and cost to procure. Factors and criteria used to establish asset replacement:<br />
Current condition, i.e. replacement of <strong>TriMet</strong> non‐revenue vehicles (NRVs) is based on condition, not age or mileage.<br />
Equipment is unsafe to operate.<br />
Maintenance costs substantially exceed replacement cost.<br />
OEM replacement cycle.<br />
Acquisition of additional NRVs is based on compelling justification of need, such as associated with major expansion of <strong>TriMet</strong><br />
service/operation.<br />
Requests for replacement or acquisition of <strong>TriMet</strong> NRVs are jointly decided by the Executive Director ‐ Operations and the Executive<br />
Director ‐ Finance and Administration.<br />
Budgeting for replacement or acquisition of <strong>TriMet</strong> NRVs is through <strong>TriMet</strong>'s annual budget development process, including capital<br />
improvement plan (C.I.P.) annual update.<br />
Procedure: NRV Replacement or Acquisition Request<br />
1. A Non‐Revenue Vehicle Action request is prepared and submitted to the Executive Director ‐ Operations. For poolcar NRVs, the NRV<br />
Action request is prepared solely by the Bus Maintenance department. For department‐assigned NRVs, the NRV Action request is<br />
Page ‐ 50
<strong>Capital</strong> <strong>Asset</strong> <strong>Management</strong> & <strong>Investment</strong> Program Vehicles Non‐Revenue Vehicles<br />
<strong>Asset</strong> Replacement Criteria (continued)<br />
prepared collaboratively by the Bus Maintenance department and the respective user department. The NRV Action request<br />
includes:<br />
• Part A ‐ subject NRV data<br />
• Part B ‐ subject NRV condition assessment<br />
• Part C ‐ subject NRV photographs<br />
• Part D ‐ replacement/acquisition vehicle information<br />
• Part E ‐ replacement/acquisition vehicle cost and funding (budget) information<br />
• Part F ‐ evaluation of alternatives to vehicle replacement/acquisition<br />
2. Executive Director ‐ Operations approves or disapproves NRV Action request. If approved, the NRV Action request is forwarded to<br />
the Executive Director‐ Finance and Administration. If approved by the Executive Director‐ Finance and Administration, the<br />
requested NRV replacement or acquisition (including disposal of the existing NRV, if applicable), is performed by Bus Maintenance.<br />
3. Approval of a NRV Action request will likely be delayed if funding for the NRV replacement or acquisition has not yet been<br />
budgeted. Part E of such non‐budgeted NRV Action requests should include a proposed <strong>TriMet</strong> budget transfer, in order for the<br />
request to be approvable.<br />
Non‐Revenue Vehicle Replacements Summary<br />
Non‐revenue vehicle fiscal needs are broken into three general categories:<br />
‐ Non‐Revenue Vehicles > $5,000 – includes the replacement of non‐revenue vehicles<br />
‐ Non‐Revenue Vehicles ≤ $5,000 – mostly includes components for major repairs<br />
‐ Non‐Revenue Shop Equipment – includes equipment such as lifts/hoists, tire balancer, drill press, tire mounting machine, etc.<br />
VEHICLES <strong>FY</strong>14 <strong>FY</strong>15 <strong>FY</strong>16 <strong>FY</strong>17 <strong>FY</strong>18<br />
Total<br />
<strong>FY</strong>14-<strong>FY</strong>18<br />
Non‐Revenue Vehicles<br />
Non‐Revenue Vehicles > $5,000 $ 1,980,000 $ 1,640,000 $ 1,632,000 $ 1,328,000 $ ‐ $ 6,580,000<br />
Non‐Revenue Vehicles ≤ $5,000 ‐ 135,200 73,920 60,060 ‐ 269,180<br />
Non‐Revenue Shop Equipment 2,500 8,000 ‐ 3,000 ‐ 13,500<br />
Non‐Revenue Vehicles Subtotal $ 1,982,500 $ 1,783,200 $ 1,705,920 $ 1,391,060 $ ‐ $ 6,862,680<br />
A detailed breakdown of the categories may be found in the Appendix section of this document under Non‐Revenue Vehicles.<br />
Page ‐ 51
<strong>Capital</strong> <strong>Asset</strong> <strong>Management</strong> & <strong>Investment</strong> Program Vehicles Automatic Train Stop<br />
Vehicle Projects – Automatic Train Stop<br />
Project Name: Automatic Train Stop (ATS) Project ID: TBD<br />
Project Class: Vehicles Priority: S<br />
Start Date: 7/1/2013 Completion Date: 6/30/<strong>2014</strong> Project Type: <strong>Capital</strong><br />
Budgeted Dept: <strong>Capital</strong> Projects – Development & Operations Support Project Manager: Heilig<br />
PROJECT DESCRIPTION<br />
This project will provide automatic train stop mechanism on Portland streetcars. The Portland Streetcar and MAX will share the new Portland‐Milwaukie bridge for<br />
revenue service.<br />
PROJECT JUSTIFICATION<br />
<strong>TriMet</strong>’s design criteria require an automatic train stop system, which activates a vehicle’s brakes when the vehicle violates a signal. The streetcars presently<br />
operate without ATS. Installation of ATS on streetcars will help ensure safe operation of both streetcar and MAX. <strong>TriMet</strong> and the City of Portland are sharing the<br />
cost, which is part of an intergovernmental agreement governing the City’s Close the Loop project.<br />
STATUS<br />
N/A<br />
Expenditure Plan <strong>FY</strong><strong>2014</strong> <strong>FY</strong>2015 <strong>FY</strong>2016 <strong>FY</strong>2017 <strong>FY</strong>2018 Total 5‐Year Cost<br />
Current Year $ 500,000 $ ‐ $ ‐ $ ‐ $ ‐ $ 500,000<br />
$ 500,000 $ ‐ $ ‐ $ ‐ $ ‐ $ 500,000<br />
Revenue Plan <strong>FY</strong><strong>2014</strong> <strong>FY</strong>2015 <strong>FY</strong>2016 <strong>FY</strong>2017 <strong>FY</strong>2018 Total 5‐Year Cost<br />
Federal Share $ ‐ $ ‐ $ ‐ $ ‐ $ ‐ $<br />
‐<br />
<strong>TriMet</strong> Share $ 500,000 $ ‐ $ ‐ $ ‐ $ ‐ $ 500,000<br />
Other Source $ ‐ $ ‐ $ ‐ $ ‐ $<br />
‐<br />
TBD $ ‐ $ ‐ $ ‐ $ ‐ $ ‐ $<br />
‐<br />
$ 500,000 $ ‐ $ ‐ $ ‐ $ ‐ $ 500,000<br />
Page ‐ 52
<strong>Capital</strong> <strong>Asset</strong> <strong>Management</strong> & <strong>Investment</strong> Program Vehicles Positive Train Control<br />
Vehicle Projects – Positive Train Control<br />
Project Name: Positive Train Control Project ID: 7563<br />
Project Class: Vehicles Priority: S<br />
Start Date: 7/1/<strong>2014</strong> Completion Date: 6/30/2017 Project Type: <strong>Capital</strong><br />
Budgeted Dept: <strong>Capital</strong> Projects Project Manager: Heilig<br />
PROJECT DESCRIPTION<br />
The Rail Safety Act of 2008 mandates the US Department of Transportation through the Federal Railroad Administration (FRA) to implement Positive Train Control<br />
(PTC) on all railroads which operate passenger or commuter rail service by 2015. <strong>TriMet</strong>’s final Positive Train Control Development Plan (PTCDP) was reviewed with<br />
FRA in late February 2012 and submitted in April. FRA responded in September. <strong>TriMet</strong> prepared a revised draft and responded to requests for clarification and resubmitted<br />
the PTCDP in October. After approval of the PTCDP, <strong>TriMet</strong> will begin development of protocol specifications.<br />
PROJECT JUSTIFICATION<br />
Development of protocol specifications for and installation of the PTC system is a federal safety mandate.<br />
Engineering resources provided by existing <strong>Capital</strong> Projects’ systems engineering staff.<br />
STATUS<br />
Project has been drawn out due to delays in FRA approvals.<br />
Expenditure Plan <strong>FY</strong><strong>2014</strong> <strong>FY</strong>2015 <strong>FY</strong>2016 <strong>FY</strong>2017 <strong>FY</strong>2018 Total 5‐Year Cost<br />
Current Year $ 700,000 $ 2,500,000 $ 3,000,000 $ 2,000,000 $ ‐ $ 8,200,000<br />
$ 700,000 $ 2,500,000 $ 3,000,000 $ 2,000,000 $ ‐ $ 8,200,000<br />
Revenue Plan <strong>FY</strong><strong>2014</strong> <strong>FY</strong>2015 <strong>FY</strong>2016 <strong>FY</strong>2017 <strong>FY</strong>2018 Total 5‐Year Cost<br />
Federal Share $ ‐ $ ‐ $ ‐ $ ‐ $ ‐ $<br />
‐<br />
<strong>TriMet</strong> Share $ 700,000 $ 2,500,000 $ 3,000,000 $ 2,000,000 $ ‐ $ 8,200,000<br />
Other Source $ ‐ $ ‐ $ ‐ $ ‐ $ ‐ $<br />
‐<br />
TBD $ ‐ $ ‐ $ ‐ $ ‐ $ ‐ $<br />
‐<br />
$ 700,000 $ 2,500,000 $ 3,000,000 $ 2,000,000 $ ‐ $ 8,200,000<br />
Page ‐ 53
<strong>Capital</strong> <strong>Asset</strong> <strong>Management</strong> & <strong>Investment</strong> Program Vehicles Type 1/2/3 LRVs Destination Signs Replacement<br />
Vehicle Projects – Type 1/2/3 LRVs Destination Signs Replacement<br />
Project Name: Type 1/2/3 LRVs Destination Signs Replacement Project ID: TBD<br />
Project Class: Vehicles Priority: SR<br />
Start Date: 7/1/2013 Completion Date: 6/30/<strong>2014</strong> Project Type: Operating<br />
Budgeted Dept: Rail Equipment Maintenance Project Manager: Barnhart<br />
PROJECT DESCRIPTION<br />
Replace mylar roll‐type destination signs on T1/T2/T3 LRVs, to allow LRV trains of any type to operate on any MAX line as of the Fall 2015 start‐up of the Portland‐<br />
Milwaukie light rail project ("Orange Line"), as well as expected Fall <strong>2014</strong> or 2015 revision of the Red Line from Airport ‐ Beaverton TC to Airport ‐ Hillsboro,<br />
simulanteous with revision of the Blue Line from Gresham ‐ Hillsboro to Gresham ‐ Beaverton TC.<br />
PROJECT JUSTIFICATION<br />
Although retrofit of electronic LED destination signs on T1/T2/T3 LRVs is being undertaken using PMLR funds (including replacement of the existing T2/T3 LRV<br />
communications control unit which drives automated station announcements/interior display units system on T1/T2/T3 LRVs), that program is not expected to begin<br />
installations until early to mid‐<strong>2014</strong>, and is expected to take 4 years to complete at an average rate of 2 weeks per LRV for the 105 LRVs that must be retrofitted.<br />
Without replacement of current mylar roll‐type destination signs, only T4/T5 LRVs, and any few T1/T2/T3 LRVs for which electronic signs retrofit has been completed,<br />
will be able to operate in Yellow‐Orange MAX line service as of Fall 2015. This constraint would apply as well to the expected Fall <strong>2014</strong> or 2015 revision of the Red<br />
Line; as there is no "Red Line to Hillsboro" destination available on the current mylar rollsigns. Without replacement of current mylar signs, it will be impractical and<br />
very complex to manage the yards at the Ruby Junction and Elmonica facilities to layup and prepare for pullouts of specific types of LRV trains assigned to the various<br />
MAX lines. Schedule interlining of train assignments will also be constrained, as only certain LRV types will be operable on certain lines. (This will be in addition to<br />
the constraint that as the electronic retrofit project proceeds, such retrofitted LRVs will only be able to be coupled/consisted with other such retrofitted LRVs.) To<br />
provide for practical and sustainably reliable MAX system operation for the next several years as the electronic signs retrofit project proceeds, replacement of<br />
current mylar roll‐type destination signs on the T1/T2/T3 LRVs is required.<br />
Expenditure Plan <strong>FY</strong><strong>2014</strong> <strong>FY</strong>2015 <strong>FY</strong>2016 <strong>FY</strong>2017 <strong>FY</strong>2018 Total 5‐Year Cost<br />
Current Year $ 350,000 $ ‐ $ ‐ $ ‐ $ ‐ $ 350,000<br />
$ 350,000 $ ‐ $ ‐ $ ‐ $ ‐ $ 350,000<br />
Revenue Plan <strong>FY</strong><strong>2014</strong> <strong>FY</strong>2015 <strong>FY</strong>2016 <strong>FY</strong>2017 <strong>FY</strong>2018 Total 5‐Year Cost<br />
Federal Share $ ‐ $ ‐ $ ‐ $ ‐ $ ‐ $<br />
‐<br />
<strong>TriMet</strong> Share $ 350,000 $ ‐ $ ‐ $ ‐ $ ‐ $ 350,000<br />
Other Source $ ‐ $ ‐ $ ‐ $ ‐ $ ‐ $<br />
‐<br />
PMLR $ ‐ $ ‐ $ ‐ $ ‐ $ ‐ $<br />
‐<br />
$ 350,000 $ ‐ $ ‐ $ ‐ $ ‐ $ 350,000<br />
Page ‐ 54
SECTION 4 – MAINTENANCE OF WAY
This page left intentionally blank.
<strong>Capital</strong> <strong>Asset</strong> <strong>Management</strong> & <strong>Investment</strong> Program Maintenance of Way Track & Structures<br />
<strong>Asset</strong> Category – MOW Track & Structures<br />
Priority<br />
To be determined by CIP Committee<br />
<strong>Asset</strong> <strong>Management</strong> Goal<br />
Maintain light rail track that is safe, clean, and reliable, to meet service requirements. Maintaining a positive draining infrastructure is key to the<br />
condition of the track.<br />
Key <strong>Asset</strong> <strong>Management</strong> Performance Indicators/Goals<br />
Measurement of PM compliance that is above 80% for completion percentage indicates that the system is operational without any immediate<br />
defects that require trains to be re‐routed. When measurement is below 80% on a consistent month to month basis, the State of Good Repair<br />
becomes questionable and replacement/improvements need to be addressed.<br />
How <strong>Asset</strong> is Maintained & Condition Evaluated<br />
<strong>Asset</strong>s in this discipline are mechanical and not electrical in nature. The PM routine is visual inspection and adjustment of the mechanical attributes<br />
of the switches. In order to assess condition and determine replacement/rehabilitation times accurately, measurement of all aspects of the rail has<br />
been performed by a geometry car. This measurement will be performed every two years to determine the rate of wear of the rail and to analyze<br />
various conditions of the rail structure such as line and grade, rail wear and movement and structural condition of the ballast infrastructure.<br />
Additionally, preventive maintenance is done on the following schedule:<br />
Maintenance Activity Equipment Unit<br />
Weekly Girder Rail Inspections 11.6 Miles<br />
Weekly Yard/T‐Rail Inspections 90.4 Miles<br />
Weekly Riding Inspection N/A<br />
Weekly Switch Cleaning 45 locations<br />
Monthly Track Switch Inspection 137 locations<br />
Monthly Riding Inspection N/A<br />
Monthly Lube Machine 33 locations<br />
Quarterly T‐Rail Expansion Jt Inspection 8 locations<br />
Quarterly Yard Switch Inspection 40 locations<br />
Quarterly Track Switch Inspection 177 locations<br />
Semi‐Annual Exp Joint Inspection Girder Rail 6 locations<br />
Annual Road Crossing Inspections 154 locations<br />
3‐year Electronic Rail Inspection N/A<br />
Page ‐ 57
<strong>Capital</strong> <strong>Asset</strong> <strong>Management</strong> & <strong>Investment</strong> Program Maintenance of Way Track & Structures<br />
Condition Scale<br />
The condition rating scale is as follows:<br />
1 – <strong>Asset</strong> is newly put into service and warranty is in effect.<br />
2 – Warranty has expired and no defects/wear has been identified during PM cycle<br />
3 – Slight wear evident, PM cycle shows no defects<br />
4 – Excess wear, defects require attention beyond PM cycle<br />
5 – <strong>Asset</strong> is out of service and can no longer function safely<br />
The majority of the track and switch inventory is between a Condition 3 and 4. The paved track is at a Condition 2 because it is secured<br />
and protected by the roadway structure.<br />
Level of Criticality<br />
The level of criticality for this discipline is applied to the following items:<br />
Safety<br />
Service Reliability, Risk of Degradation<br />
Economic Life of the <strong>Asset</strong><br />
Level of Service <strong>Investment</strong><br />
High<br />
High<br />
Medium<br />
Low<br />
Mid‐Life Overhaul Program<br />
Switch mechanisms in paved track locations are overhauled when condition warrants.<br />
<strong>Asset</strong> Replacement Criteria<br />
The condition of track and track structure dictates the replacement/improvement schedule.<br />
Additional Analysis<br />
• Approximately 5%‐10% of all track and track related equipment is in poor condition.<br />
Page ‐ 58
<strong>Capital</strong> <strong>Asset</strong> <strong>Management</strong> & <strong>Investment</strong> Program Maintenance of Way Track & Structures<br />
Track & Structures Project<br />
TABLE 10. OPERATIONS - LIGHT RAIL TRACK AND STRUCTURES<br />
ITEM REQUIRED<br />
PROJECT<br />
MANAGER<br />
ACTION<br />
NEEDED<br />
<strong>FY</strong><br />
NEEDED<br />
CURRENT<br />
AGE <strong>FY</strong>14 COND. <strong>2014</strong> 2015 2016 2017 2018<br />
<strong>FY</strong>14-<strong>FY</strong>18<br />
TOTAL<br />
TRACK AND STRUCTURES<br />
Kindig<br />
6 Pedestrian Crossings (z xings) Replace Varies Varies 1 $100,000 $100,000<br />
28.6 Embedded Track (miles) Projects Varies Varies<br />
11th Avenue Terminus Replace <strong>2014</strong>+ 20 $925,000 $925,000<br />
No. 7 (Under Morrision Bridge) Replace 2015+ 26 $675,000 $675,000<br />
No. 9 (1st Avenue & Davis) Replace 2016+ 26 $675,000 $675,000<br />
No. 13 (Rose Quarter) Replace 2015+ 20 $300,000 $400,000 $700,000<br />
No. 17 (Lloyd Center) Replace <strong>2014</strong> 14 $825,000 $825,000<br />
Skidmore EB Curves Replace 2018 26 $300,000 $300,000<br />
Rail Grinding 1 Maintain Annual Varies $250,000 $250,000 $275,000 $300,000 $375,000 $1,450,000<br />
80.2 Ballasted Track (miles) Varies Varies<br />
Surfacing and lining Maintain Bi-annual 26 2 $350,000 $500,000 $850,000<br />
97th Avenue Curves Replace 2015 18 $275,000 $275,000<br />
Banfield Curves Replace 2017 26 $325,000 $325,000<br />
97th Avenue Crossing Panels Replace <strong>2014</strong> 18 $75,000 $75,000<br />
Gateway Bus Crossing Panels Replace <strong>2014</strong> 20 $125,000 $125,000<br />
Eastman Parkway Crossing Panels Repair 2016 14 $175,000 $175,000<br />
Roberts Crossing Panels Repair 2018 14 $100,000 $100,000<br />
Main Crossing Panels Repair 2018 14 $100,000 $100,000<br />
Cleveland Crossing Panels Repair 2018 14 $100,000 $100,000<br />
113th Burnside Crossing Panels Repair 2015 26 $145,000 $145,000<br />
Optical Rail Measurement Crossing Panels Insp/Repair <strong>2014</strong>+ N/A $80,000 $80,000 $75,000 $235,000<br />
Optical Rail Measurement 2 Maintain 2012 Varies $80,000 $80,000 $80,000 $240,000<br />
32 Bridge Structures 3 Insp/Repair Annual Varies 1 $45,000 $45,000 $55,000 $70,000 $95,000 $310,000<br />
38 Rail Lubricators 4 Replace 2010 Varies $50,000 $50,000 $100,000<br />
TOTAL TRACK AND STRUCTURES. . . . $3,105,000 $1,325,000 $1,280,000 $1,195,000 $1,900,000 $8,805,000<br />
Notes:<br />
1. Grinding of approximately 1/3 of track-mileage annually to remove corrugation and reduce noise and vibration.<br />
2. Measure and map condition of rail infrastructure, for comparision with such measurement <strong>FY</strong>12, to inform wear analysis and replacement planning.<br />
3. Cyclical bridge, tunnel, and wall inspections, to assure safety, including repairs as necessary. <strong>FY</strong>18 - PMLR structures added to the Required Structures to Inspect list.<br />
4. Purchase 2 lube machines/year for 3 years to replace worn equipment at strategic locations.<br />
Page ‐ 59
<strong>Capital</strong> <strong>Asset</strong> <strong>Management</strong> & <strong>Investment</strong> Program Maintenance of Way Track & Structures<br />
Track and Structures Equipment<br />
TABLE 14A. MOW EQUIPMENT INVENTORY AND REPLACEMENT PLAN Plan for <strong>FY</strong> = <strong>2014</strong><br />
ITEM REQUIRED<br />
PROJECT<br />
MANAGER<br />
ACTION<br />
NEEDED<br />
<strong>FY</strong><br />
NEEDED<br />
CURRENT<br />
AGE <strong>FY</strong>14<br />
EST.<br />
DESIGN<br />
LIFESPAN COND. <strong>2014</strong> 2015 2016 2017 2018<br />
<strong>FY</strong>14-18<br />
TOTAL<br />
TRACK EQUIPMENT<br />
Kindig<br />
TRAILER AIR COMPRESSOR/TRACK REPLACE 2001 28 15 FAIR $3,500 $3,500<br />
ABRASIVE RAIL SAW/TRACK REPLACE 1997 27 10 FAIR $2,500 $2,500<br />
PROFILE RAIL GRINDER/TRACK NONE <strong>2014</strong> 10 10 GOOD $4,000 $4,000<br />
RAIL DRILL/TRACK NONE 1997 27 10 FAIR $4,500 $4,500<br />
NOISE MONITOR/ENG NONE 2008 21 15 FAIR $2,000 $2,000<br />
LINK GAUGE/TRACK NONE 2009 20 15 FAIR $1,000 $1,000<br />
SLOT GAUGE/TRACK NONE 2009 20 15 FAIR $900 $900<br />
BORE GAUGE/TRACK NONE 2009 20 15 FAIR $1,200 $1,200<br />
BORE GAUGE/TRACK NONE 2010 19 15 FAIR $1,200 $1,200<br />
TIE TAMPER/TRACK NONE 2008 16 10 FAIR $3,500 $3,500<br />
TIE TAMPER/TRACK NONE 2008 16 10 FAIR $3,500 $3,500<br />
GENERATOR/TRACK NONE 2008 16 10 FAIR $3,000 $3,000<br />
GENERATOR/TRACK NONE 2008 16 10 FAIR $3,500 $3,500<br />
HYDRAULIC RAIL DRILL/TRACK NONE 2008 16 10 FAIR $3,500 $3,500<br />
HYDRAULIC RAIL SAW/TRACK NONE 2008 16 10 FAIR $3,500 $3,500<br />
HYDRAULIC RAIL PROFILER/TRACK NONE 2008 16 10 FAIR $5,000 $5,000<br />
GRAFFITI SODA BLASTER/TRACK NONE 2008 16 10 GOOD $4,000 $4,000<br />
TOTALS FOR TRACK EQUIPMENT . . .<br />
$9,500 $7,500 $11,000 $14,800 $7,500 $50,300<br />
Page ‐ 60
<strong>Capital</strong> <strong>Asset</strong> <strong>Management</strong> & <strong>Investment</strong> Program Maintenance of Way Overhead Catenary System<br />
<strong>Asset</strong> Category – Overhead Cantenary System (OCS)<br />
Priority<br />
To be determined by CIP Committee<br />
<strong>Asset</strong> <strong>Management</strong> Goal<br />
Maintain light rail an OCS system that is safe, and reliable to meet service requirements. Diligent visual inspections, measurements and adjustments keep the<br />
system operational at all times during revenue service.<br />
Key <strong>Asset</strong> <strong>Management</strong> Performance Indicators/Goals<br />
Measurement of PM compliance that is above 80% for completion percentage indicates that the system is operational without any immediate defects that require<br />
trains to be re‐routed. When measurement is below 80% on a consistent month to month basis, the State of Good Repair becomes questionable and<br />
replacement/improvements need to be addressed.<br />
How <strong>Asset</strong> is Maintained & Condition Evaluated<br />
The equipment in this discipline is mechanical and reacts to the environment similar to track materials. Visual inspections are constant in this discipline and<br />
adjustments and torque checks of the hardware keep the asset in operating condition.<br />
An analysis has been performed on the entire system that incorporated wear rates and percentages of wear in the contact wire. When wire has worn more than<br />
30% of its profile it needs to be replaced. This provides a baseline condition for the system. We will perform this analysis again in two years and develop wear<br />
patterns and strategize as to where and when wire will need to be replaced. The outcome of this analysis will be reflected in Table 11 as a 5 year program for<br />
replacement<br />
Structural condition of the poles that support the system is good; however there are some H‐poles on the original Banfield alignment that have considerable<br />
amount of rust built up on them. We are removing rust and applying rust prohibitive material to slow down the migration of rust. This activity is being completed<br />
between normal PM activities.<br />
Additionally, preventive maintenance is done on the following schedule:<br />
Maintenance Activity Equipment Unit<br />
Triennials 1/3 System Inspection N/A<br />
Annual Tunnel Inspection 1<br />
Annual Steel Bridge Inspection 1<br />
Annual Rolling Inspection Entire System 120 Miles<br />
Monthly Walking Inspections 120 Miles<br />
Biennial Yard Inspections Elmonica and Ruby Junction<br />
Trimester PCS Inspections 15 miles<br />
Triennials PCS Inspections 15 miles<br />
Monthly Steel Bridge Inspection 1<br />
Page ‐ 61
<strong>Capital</strong> <strong>Asset</strong> <strong>Management</strong> & <strong>Investment</strong> Program Maintenance of Way Overhead Catenary System<br />
Condition Scale<br />
The condition rating scale is as follows:<br />
1 – <strong>Asset</strong> is newly put into service and warranty is in effect.<br />
2 – Warranty has expired and no defects/wear has been identified during PM cycle<br />
3 – Slight wear evident, PM cycle shows no defects<br />
4 – Excess wear, defects require attention beyond PM cycle<br />
5 – <strong>Asset</strong> is out of service and can no longer function safely<br />
The OCS system condition overall is at a Condition 3.<br />
Level of Criticality<br />
The level of criticality for this discipline is applied to the following items:<br />
Safety<br />
Service Reliability, Risk of Degradation<br />
Economic Life of the <strong>Asset</strong><br />
Level of Service <strong>Investment</strong><br />
High<br />
High<br />
Medium<br />
Medium<br />
<strong>Asset</strong> Replacement Criteria<br />
The condition the OCS system dictates the replacement/improvement schedule.<br />
Additional Analysis<br />
• None of the entire OCS system is considered to be in “poor” condition.<br />
Page ‐ 62
<strong>Capital</strong> <strong>Asset</strong> <strong>Management</strong> & <strong>Investment</strong> Program Maintenance of Way Overhead Catenary System<br />
OCS Program<br />
TABLE 11A. OPERATIONS - LIGHT RAIL OVERHEAD CATENARY SYSTEM<br />
ITEM REQUIRED<br />
OVERHEAD CATENARY<br />
SYSTEM<br />
PROJECT<br />
MANAGER<br />
Kindig<br />
ACTION<br />
NEEDED<br />
YEAR<br />
NEEDED<br />
CURRENT<br />
AGE<br />
<strong>FY</strong><strong>2014</strong><br />
OPTIMUM<br />
MINIMUM<br />
REPLACEMENT<br />
CYCLE COND. <strong>2014</strong> 2015 2016 2017 2018<br />
<strong>FY</strong>14-<strong>FY</strong>18<br />
TOTAL<br />
97 Overhead Catenary System As Needed Varies 5/6 Good $0<br />
(track-miles, including yards)<br />
OCS Wire Measurement Service 1 As Needed Varies See Note 1 $80,000 $80,000 $160,000<br />
Overhead Contact Wire 2 Replacement See Note 2 $150,000 $500,000 $500,000 $500,000 $1,650,000<br />
Replace 60 rod insulators 3 Replacement Varies See Note 3 $40,000 $40,000 $80,000<br />
Replace Loop Insulators 4 Replacement See Note 4 $20,000 $20,000 $20,000 $20,000 $20,000 $100,000<br />
TOTAL OVERHEAD CATENARY SYSTEM. . . .<br />
$20,000 $250,000 $560,000 $560,000 $600,000 $1,990,000<br />
NOTES:<br />
1. Retain services to measure and map condition of OCS Wire infrastructure. Will assist in wear analysis and replacement planning.<br />
2. Replace worn contact wire Cleveland To Lloyd Center. Anticipate 20-30 year lifespan before 30% wear. <strong>FY</strong>15 - Design Plans developed for wire replacements. <strong>FY</strong>16 - Begin replacements on Eastside system.<br />
3. The existing Rod Insulators are failing. Project completion in <strong>FY</strong>14.<br />
4. Replace existing equipment with new, easy to install loop insulators.<br />
OCS Equipment Replacement<br />
TABLE 14A. MOW EQUIPMENT ‐ OCS Plan for <strong>FY</strong>= <strong>2014</strong><br />
ITEM REQUIRED<br />
PROJECT<br />
MANAGER<br />
ACTION<br />
NEEDED<br />
CURRENT<br />
AGE <strong>FY</strong>14<br />
EST.<br />
DESIGN<br />
LIFESPAN COND. <strong>2014</strong> 2015 2016 2017 2018<br />
<strong>FY</strong>14‐18<br />
TOTAL<br />
OCS EQUIPMENT<br />
Kindig<br />
6‐TON RATCHET HOIST/OCS NONE 28 15 GOOD $1,500 $1,500<br />
3‐TON RATCHET HOIST/OCS NONE 27 15 GOOD $1,000 $1,000<br />
CABLE STRAIGHTENER/OCS NONE 21 25 GOOD $4,000 $4,000<br />
UTILITY LINE TRACER/OCS NONE 16 15 FAIR $3,000 $3,000<br />
ELECTRIC POWER BURNDY PRESS NONE 8 4 GOOD $3,000 $3,000<br />
OCS DC HI‐VOLTAGE TESTING UNITS REPLACE 7‐12 8 POOR $3,500 $3,500<br />
TOTALS FOR OCS EQUIPMENT . . . .<br />
$3,000 $2,500 $3,000 $3,500 $4,000 $16,000<br />
Page ‐ 63
<strong>Capital</strong> <strong>Asset</strong> <strong>Management</strong> & <strong>Investment</strong> Program Maintenance of Way Signals<br />
<strong>Asset</strong> Category – MOW Signals<br />
Priority<br />
To be determined by CIP Committee<br />
<strong>Asset</strong> <strong>Management</strong> Goal<br />
Maintain a signal system that is safe and reliable, to meet service requirements.<br />
With each expansion of our system comes new and improved technology. As part of keeping the system in a “State of Good Repair” upgrades are<br />
needed to keep the entire railroad functioning as an integrated system. For example, the signal system has transitioned from chart recorders with<br />
readouts on chart paper installed in the signal rooms to Programmable Logic Controllers (PLC’s) that record data electronically that can be retrieved<br />
at a remote location on a personal computer. All of the disciplines in MOW have experienced the same type of transitions in technology as<br />
additional Line Sections are built and incorporated into our revenue system.<br />
Key <strong>Asset</strong> <strong>Management</strong> Performance Indicators/Goals<br />
Measurement of PM compliance that is above 80% for completion percentage indicates that the system is operational without any immediate<br />
defects that require trains to be re‐routed. When measurement is below 80% on a consistent month to month basis, the State of Good Repair<br />
becomes questionable and replacement/improvements need to be addressed.<br />
How <strong>Asset</strong> is Maintained & Condition Evaluated<br />
<strong>Asset</strong>s in this discipline are heavily electronic in nature and have technology that requires high expertise in programmable logic troubleshooting. The<br />
Signal system has seen the largest leap in technology since the opening of the Banfield Light Rail in 1986. <strong>Management</strong> of the asset requires<br />
knowledge by the maintainer and the support of engineering to work through the defects as they happen.<br />
The gate mechanisms are being replaced at a rate of 4‐5 per year until we have all east side mechanisms replaced. We are about 3‐5 years away<br />
from replacing Westside mechanisms and longer for newer portions of the system.<br />
Power switch machines are currently on a schedule to be rebuilt by the manufacturer at the rate of 6 per year. The re‐build process is equivalent to<br />
purchasing new and is more economical. None of the function of the machine is compromised following the rebuild.<br />
Relays are tested and repaired all year long. They are in a 4 year cycle that tests all 4625 relays. We have found through use and number of cycles<br />
that some of the critical applications need to be tested more frequently. Every two years instead of every four years. We are currently adjusting our<br />
MMIS program to address the recommended changes from Engineering.<br />
Additionally, preventive maintenance is done on the following schedule:<br />
Page ‐ 64
<strong>Capital</strong> <strong>Asset</strong> <strong>Management</strong> & <strong>Investment</strong> Program Maintenance of Way Signals<br />
Condition Scale<br />
Maintenance Activity Equipment Unit<br />
Weekly Crossing Inspection 38 Gated<br />
Monthly Power Switch Inspection 177 Units<br />
Monthly Ground Inspections 156 Locations<br />
Quarterly Signal Room/Switch Maintenance 200 Houses<br />
Semi‐Annual Steel Bridge Maintenance 1 Bridge<br />
Annual Relay Testing 4625 Units<br />
Annual Route Locking/Interlock Test N/A<br />
Annual Switch Heaters 61 Units<br />
Annual ATS Trip Testing N/A<br />
Annual Signal Lens Cleaning N/A<br />
Annual Case Cleaning N/A<br />
Ten‐Year Cable Meggering 3 Yr Rotation<br />
Condition Scale<br />
The condition rating scale is as follows:<br />
1 – <strong>Asset</strong> is newly put into service and warranty is in effect.<br />
2 – Warranty has expired and no defects/wear has been identified during PM cycle<br />
3 – Slight wear evident, PM cycle shows no defects<br />
4 – Excess wear, defects require attention beyond PM cycle<br />
5 – <strong>Asset</strong> is out of service and can no longer function safely<br />
The signal system condition overall is between a Condition 3 and 4. Rapidly changing technology and aging equipment, accounts for the general<br />
condition of the system.<br />
Level of Criticality<br />
The level of criticality for this discipline is applied to the following items:<br />
Safety<br />
High<br />
Service Reliability, Risk of Degradation<br />
High<br />
Economic Life of the <strong>Asset</strong><br />
Medium<br />
Level of Service <strong>Investment</strong> High<br />
Mid‐Life Overhaul Program<br />
Currently the only mid‐life overhaul program is focused on powered switch machines, both in ground switches and open track switches.<br />
Page ‐ 65
<strong>Capital</strong> <strong>Asset</strong> <strong>Management</strong> & <strong>Investment</strong> Program Maintenance of Way Signals<br />
<strong>Asset</strong> Replacement Criteria<br />
The condition of signals equipment dictates the replacement/improvement schedule.<br />
Additional Analysis<br />
• Approximately 20% of the assets in the Signal system are considered to be in poor condition. These components are being replaced as<br />
quickly as possible and are being prioritized based on the numbers of trips and location of the equipment.<br />
Signal Projects<br />
TABLE 11B. OPERATIONS - LIGHT RAIL SIGNALS<br />
ITEM REQUIRED<br />
PROJECT<br />
MANAGER<br />
ACTION<br />
NEEDED<br />
YEAR<br />
NEEDED<br />
CURRENT<br />
AGE<br />
<strong>FY</strong><strong>2014</strong><br />
OPTIMUM<br />
MINIMUM<br />
REPLACEMENT<br />
CYCLE COND. <strong>2014</strong> 2015 2016 2017 2018<br />
<strong>FY</strong>14-<strong>FY</strong>18<br />
TOTAL<br />
SIGNALS<br />
Kindig<br />
Wayside Signaling System As Needed Varies $0<br />
Power Switch Machines (Open Track) 1 Rebuild Varies See Note 1 $30,000 $30,000 $60,000 $60,000 $60,000 $240,000<br />
Power Switch Machines (Paved Track) 1 Varies See Note 1 $30,000 $30,000 $60,000 $60,000 $60,000 $240,000<br />
Gate Mechanism 2 As Needed 6/7 See Note 2 $30,000 $30,000 $60,000 $120,000<br />
Battery Replacement 3 Replacement Varies See Note 3 $50,000 $50,000 $100,000<br />
Relay to PLC 4 Replacement Varies See Note 4 $75,000 $125,000 $200,000 $400,000<br />
Recurrent Training 5 Replacement See Note 5 $30,000 $30,000 $30,000 $90,000<br />
Interogators 6 Replacement See Note 6 $50,000 $50,000 $100,000<br />
TOTAL SIGNALS. . . .<br />
$220,000 $170,000 $195,000 $295,000 $410,000 $1,290,000<br />
NOTES:<br />
1. Rebuild 20 in ground H&K Switch machines. 4 per year/5 year program.<br />
2. Replace existing Model 75 equipment with new, Model 95 Gate Mechanisms. 3 per year/4 year program.<br />
3. Replacement cycle for battery backup in Signal Rooms and bungalows.<br />
4. Replace old style relays with new PLC technology. <strong>FY</strong>17 - Begin transition. <strong>FY</strong>16 - Design and develop systemwide plan.<br />
5. Retain services for recurrent Relay Testing Training and Signal School for Journeyworkers who did not attend during Apprenticeship.<br />
6. Develop & acquire replacement interogators to replace existing outdated and failing equipment.<br />
Page ‐ 66
<strong>Capital</strong> <strong>Asset</strong> <strong>Management</strong> & <strong>Investment</strong> Program Maintenance of Way Signals<br />
Signal Equipment<br />
TABLE 14A. MOW EQUIPMENT - SIGNALS Plan for <strong>FY</strong>= <strong>2014</strong><br />
ITEM REQUIRED<br />
PROJECT<br />
MANAGER<br />
ORIGINAL<br />
COST/<br />
UNIT<br />
<strong>FY</strong><br />
NEEDED<br />
YEAR OF<br />
PURCHASE<br />
CURRENT<br />
AGE <strong>FY</strong>14<br />
EST.<br />
DESIGN<br />
LIFESPAN COND. <strong>2014</strong> 2015 2016 2017 2018<br />
<strong>FY</strong>14-18<br />
TOTAL<br />
SIGNAL EQUIPMENT<br />
Kindig<br />
UTILITY LINE TRACER/SIG $ 3,149 1996 1986 28 10 GOOD $4,000 $4,000<br />
SCOPEMETER/SIG $ 2,397 2009 1999 15 10 GOOD $3,000 $3,000<br />
POWER SUPPLY/SIG $ 2,160 2009 1999 15 10 GOOD $3,000 $3,000<br />
ELECTRIC BURNDY PRESS 2012 2007 7 5 FAIR $2,500 $2,500<br />
TOTALS FOR SIGNAL EQUIPMENT . . . .<br />
$0 $0 $4,000 $6,000 $2,500 $12,500<br />
Page ‐ 67
<strong>Capital</strong> <strong>Asset</strong> <strong>Management</strong> & <strong>Investment</strong> Program Maintenance of Way Substations<br />
<strong>Asset</strong> Category – MOW Substations<br />
Priority<br />
To be determined by CIP Committee<br />
<strong>Asset</strong> <strong>Management</strong> Goal<br />
Maintain light rail substations that are safe, clean, and reliable, to meet service requirements.<br />
Key <strong>Asset</strong> <strong>Management</strong> Performance Indicators/Goals<br />
Measurement of PM compliance that is above 80% for completion percentage indicates that the system is operational without any immediate<br />
defects that require trains to be re‐routed. When measurement is below 80% on a consistent month to month basis, the State of Good Repair<br />
becomes questionable and replacement/improvements need to be addressed.<br />
How <strong>Asset</strong> is Maintained & Condition Evaluated<br />
Cleanliness of the equipment is a primary concern for maintenance of the substations. It is imperative that a dust free and clean environment is<br />
maintained. Visual inspections are performed as equipment is disassembled and cleaned.<br />
Maintenance Activity Equipment Unit<br />
Weekly 58 Locations<br />
Monthly 58 Locations<br />
Monthly Unit Substations 5 Locations<br />
Semi Annual 58 Locations<br />
Semi Annual Unit Substations 5 Locations<br />
Annual 58 Locations<br />
Annual Unit Substations<br />
Monthly Wash Park 2000KVa<br />
Annual Wash Park 2000KVa ‐ Meggering<br />
Tri‐Annual Systemwide<br />
Annual Transfer Trip<br />
Page ‐ 68
<strong>Capital</strong> <strong>Asset</strong> <strong>Management</strong> & <strong>Investment</strong> Program Maintenance of Way Substations<br />
Condition Scale<br />
The condition rating scale is as follows:<br />
1 – <strong>Asset</strong> is newly put into service and warranty is in effect.<br />
2 – Warranty has expired and no defects/wear has been identified during PM cycle<br />
3 – Slight wear evident, PM cycle shows no defects<br />
4 – Excess wear, defects require attention beyond PM cycle<br />
5 – <strong>Asset</strong> is out of service and can no longer function safely<br />
The Substation condition overall is between a Condition 2 and Condition 3.<br />
Level of Criticality<br />
The level of criticality for this discipline is applied to the following items:<br />
Safety<br />
Service Reliability, Risk of Degradation<br />
Economic Life of the <strong>Asset</strong><br />
Level of Service <strong>Investment</strong><br />
High<br />
Medium<br />
Medium<br />
Low<br />
Mid‐Life Overhaul Program<br />
After 30,000 operations the circuit breakers are given complete overhauls.<br />
<strong>Asset</strong> Replacement Criteria<br />
The condition of the substations dictates the replacement/improvement schedule.<br />
Additional Analysis<br />
• None of the substations in the system are considered to be in poor condition.<br />
Page ‐ 69
<strong>Capital</strong> <strong>Asset</strong> <strong>Management</strong> & <strong>Investment</strong> Program Maintenance of Way Substations<br />
Substation Projects<br />
TABLE 11C. OPERATIONS - LIGHT RAIL SUBSTATIONS<br />
ITEM REQUIRED<br />
PROJECT<br />
MANAGER<br />
ACTION<br />
NEEDED<br />
YEAR<br />
NEEDED<br />
CURRENT<br />
AGE<br />
<strong>FY</strong><strong>2014</strong><br />
OPTIMUM<br />
MINIMUM<br />
REPLACEMENT<br />
CYCLE COND. <strong>2014</strong> 2015 2016 2017 2018<br />
<strong>FY</strong>14-<strong>FY</strong>18<br />
TOTAL<br />
SUBSTATIONS<br />
Kindig<br />
48 TES Substations As Needed Varies 5/6 Good $0<br />
Type 1 Substation Retrofit 1 Rebuild Varies See Note 1 $100,000 $100,000 $100,000 $125,000 $175,000 $600,000<br />
Transformer Replacement 2 As Needed Varies See Note 2 $250,000 $250,000<br />
Battery Replacement 3 Replacement Varies 7/8 See Note 3 $25,000 $50,000 $75,000<br />
Power Switch Replacement 4 Replacement Varies See Note 4 $50,000 $100,000 $150,000<br />
TOTAL SUBSTATIONS. . . .<br />
$100,000 $175,000 $350,000 $225,000 $225,000 $1,075,000<br />
NOTES:<br />
1. Retrofit 13 Type 1 Eastside substations with PLC Technology to integrate with SCADA like all other equipment.<br />
2. Replace existing transformers as they fail. Failure rate appears to be one every five years based on history of Blue Line Transformers.<br />
3. Replacement cycle for battery backup in Substations.<br />
4. <strong>FY</strong>15 - Replace H&K paved switches at 11th Avenue Terminus in preparation for PMLR Startup, moving Redline turnbacks to 11th Avenue Terminus. <strong>FY</strong>17 - Replace H&K paved switches at Rose Quarter.<br />
Substation Equipment<br />
TABLE 14A. MOW EQUIPMENT - SUBSTATIONS Plan for <strong>FY</strong>= <strong>2014</strong><br />
YEAR CUR. EST, YEARS, PAST<br />
PROJECT OF ACTION AGE DESIGN DESIGN <strong>FY</strong><strong>2014</strong>-2018<br />
ITEM REQUIRED MANAGER PURCHASE NEEDED <strong>2014</strong> LIFESPAN LIFESPAN COND. <strong>2014</strong> 2015 2016 2017 2018 TOTAL<br />
S UBS EQUIPMENT<br />
Kindig<br />
CHART RECORDER/SUBS $ 7,500 <strong>2014</strong> 2004 10 10 GOOD $9,000 $9,000<br />
MEGGER, BM-11D/SUBS $ 4,000 2015 2005 9 10 FAIR $3,000 $3,000<br />
B.I.T.E. 2 TESTER, AVO BIDDLE/SUBS $ 4,000 <strong>2014</strong> 2004 10 10 GOOD $4,250 $4,250<br />
IR THERMOMETER/SUBS $ 1,709 2007 1997 17 10 GOOD $1,500 $1,500<br />
FLUKE 123 DIGITAL MULTIMETER 2010 2006 8 4 FAIR $1,500 $2,000 $3,500<br />
FLUKE 123 DIGITAL MULTIMETER 2010 2006 8 4 FAIR $1,500 $2,000 $3,500<br />
FLUKE 123 DIGITAL MULTIMETER 2010 2006 8 4 FAIR $1,500 $2,000 $3,500<br />
FLUKE 123 DIGITAL MULTIMETER 2010 2006 8 4 FAIR $2,000 $2,000<br />
FLUKE 123 DIGITAL MULTIMETER 2010 2006 8 4 FAIR $2,000 $2,000<br />
FLUKE 123 DIGITAL MULTIMETER 2010 2006 8 4 FAIR $2,000 $2,000<br />
TOTALS FOR SUBS EQUIPMENT . . . .<br />
$4,500 $13,250 $3,000 $6,000 $7,500 $34,250<br />
Page ‐ 70
<strong>Capital</strong> <strong>Asset</strong> <strong>Management</strong> & <strong>Investment</strong> Program Maintenance of Way FEM Communications<br />
<strong>Asset</strong> Category – MOW ‐ FEM Communications<br />
Priority<br />
To be determined by CIP Committee<br />
<strong>Asset</strong> <strong>Management</strong> Goal<br />
Maintain Communications equipment that is reliable and meets service requirements.<br />
The Digital Information Display equipment, maintained by Communications, consists of Solari signs and digital reader boards that transit information<br />
to the customer at various locations throughout the bus and rail system. The system is newer and the replacement need is if vandalism occurs.<br />
The agency has a large inventory of camera equipment in the ROW and at Park and Rides. All of these cameras require preventative maintenance.<br />
The cameras are split into two technologies, digital and analog. The analog units are aged and have met their useful life. A replacement plan is<br />
being developed to replace the analog equipment with digital units. The replacement program will span up to three years and will develop a priority<br />
rating for cameras needing upgrades first.<br />
Key <strong>Asset</strong> <strong>Management</strong> Performance Indicators/Goals<br />
Measurement of PM compliance that is above 80% for completion percentage indicates that the system is operational without any immediate<br />
defects that require trains to be re‐routed. When measurement is below 80% on a consistent month to month basis, the State of Good Repair<br />
becomes questionable and replacement/improvements need to be addressed. The goal is to always be above 92% reliable for a given time period.<br />
How <strong>Asset</strong> is Maintained and Condition Evaluated<br />
<strong>Asset</strong>s in this discipline are related to radio based communications. The PM routine is visual inspection, cleaning of cameras and maintaining server<br />
connections at all communication equipment installations. Technology is rapidly changing in this discipline so keeping equipment up to date and<br />
assuring replacement equipment is readily available in case of failure is constant.<br />
Maintenance Activity Equipment Unit<br />
A Inspection Room/Cases Comm 65 Locations<br />
B Inspection Room/Cases Comm 65 Locations<br />
C Inspection Tunnel Room/Cases 65 Locations<br />
D Inspection<br />
Tunnel Equipment<br />
E Inspection Equipment<br />
G Inspection PLC Inspections 50 Locations<br />
H Inspection TTY Phones on Bridges 52 Locations<br />
J Inspection Equipment<br />
K Inspection Cameras 524 Total<br />
Page ‐ 71
<strong>Capital</strong> <strong>Asset</strong> <strong>Management</strong> & <strong>Investment</strong> Program Maintenance of Way FEM Communications<br />
Condition Scale<br />
The condition rating scale is as follows:<br />
1 – <strong>Asset</strong> is newly put into service and warranty is in effect.<br />
2 – Warranty has expired and no defects/wear has been identified during PM cycle<br />
3 – Slight wear evident, PM cycle shows no defects<br />
4 – Excess wear, defects require attention beyond PM cycle<br />
5 – <strong>Asset</strong> is out of service and can no longer function safely<br />
The Communications system is at a Condition 2.<br />
Level of Criticality<br />
The level of criticality for this discipline is applied to the following items:<br />
Safety<br />
Service Reliability, Risk of Degradation<br />
Economic Life of the <strong>Asset</strong><br />
Level of Service <strong>Investment</strong><br />
High<br />
Medium<br />
Low<br />
Low<br />
Mid‐Life Overhaul Program<br />
Cad/AVL project replacing much of the equipment for radio communication while system converts to a 700 Mhz format. System will be <strong>TriMet</strong><br />
owned and no longer supported by COP and their 800 Mhz system.<br />
<strong>Asset</strong> Replacement Criteria<br />
The condition of Communications equipment dictates the replacement/improvement schedule.<br />
Additional Analysis<br />
• None of the Communications equipment is in poor condition.<br />
Communication Equipment<br />
ITEM REQUIRED MANAGER PURCHASE NEEDED <strong>2014</strong> LIFESPAN LIFESPAN COND. <strong>2014</strong> 2015 2016 2017 2018<br />
<strong>FY</strong>14-<strong>FY</strong>18<br />
TOTAL<br />
COMMUNICATIONS EQUIPMENT<br />
Kindig<br />
ONEAC TELESTAR MC600 <strong>2014</strong> 2003 11 5 POOR $40,000 $40,000<br />
MAJORPOWER THS 90/48 CHASSIS/RECTIFIER 2015 2008 6 5 GOOD $36,000 $36,000<br />
TEKRANGER2 MODEL TFS-3031 OTDR 2015 1997 17 18 OBSO $5,000 $5,000<br />
TOTALS FOR COMM. EQUIPMENT . . . .<br />
$0 $45,000 $36,000 $0 $0 $81,000<br />
Page ‐ 72
<strong>Capital</strong> <strong>Asset</strong> <strong>Management</strong> & <strong>Investment</strong> Program Maintenance of Way Conversion of MAX Track Switches<br />
Maintenance of Way Projects – Conversion of MAX Track Switches<br />
Project Name: Conversion of MAX Track Switches to Powered Operation for Service Quality Project ID: TBD<br />
Project Class: MOW Priority: SR/RoD<br />
Start Date: 7/1/<strong>2014</strong> Completion Date: 6/30/2018 Project Type: <strong>Capital</strong><br />
Budgeted Dept: Rail MOW Project Manager: Griffiths<br />
PROJECT DESCRIPTION<br />
Conversion of MAX track switches to powered operation for service quality at the following locations: SW 11 th Terminal power track 3 (1A) ‐ $550,000, Hollywood<br />
pocket track (21A, 23B, 23C, 25A, 25C, 27B) ‐ $3,500,000, Beaverton pocket track (155A, 155C, 157A) ‐ $2,500,000, Fairplex pocket track (201B, 203A, 203C, 205B) ‐<br />
$3,500,000, Lloyd Center (19A, 19B, 21A, 21B) ‐ $2,800,000, First & Davis ‐ $3,300,000.<br />
PROJECT JUSTIFICATION<br />
SW 11 th Terminal – staging trains for special events, remove breakdown trains from busy mainline operations, essential if Type 4 trains are not allowed to overhang<br />
the sidewalk on track 1.<br />
Hollywood – staging trains for special events, flexibility to turn back service, winter operation turn‐back if Gateway is iced over, remove breakdown trains<br />
from busy mainline operations, stage gap trains.<br />
Beaverton – during a tunnel incident trains would be turned back westbound for service, staging for special events, easier to remove breakdowns trains<br />
from service, facilitates manual block operation for mainline<br />
Fairplex – facilitate extra service for special events, eastbound turn‐backs from service would be facilitated when traffic accidents occur in downtown<br />
Hillsboro, store put‐in trains for terminal service, facilitate single tracking operations for track/OCS maintenance, & allows Red Line extension<br />
to Fairplex since Willow Creek pocket track was not constructed.<br />
Lloyd Center – flexibility for single‐track operations due to accident/Track‐OCS maintenance, improved customer service during accidents or track way<br />
maintenance.<br />
STATUS<br />
N/A<br />
Expenditure Plan <strong>FY</strong><strong>2014</strong> <strong>FY</strong>2015 <strong>FY</strong>2016 <strong>FY</strong>2017 <strong>FY</strong>2018 Total 5‐Year Cost<br />
Current Year $ ‐ $ 550,000 $ 3,500,000 $ 6,000,000 $ 6,100,000 $ 16,150,000<br />
$ ‐ $ 550,000 $ 3,500,000 $ 6,000,000 $ 6,100,000 $ 16,150,000<br />
Revenue Plan <strong>FY</strong><strong>2014</strong> <strong>FY</strong>2015 <strong>FY</strong>2016 <strong>FY</strong>2017 <strong>FY</strong>2018 Total 5‐Year Cost<br />
Federal Share $ ‐ $ ‐ $ ‐ $ ‐ $ ‐ $<br />
‐<br />
<strong>TriMet</strong> Share $ ‐ $ 550,000 $ 3,500,000 $ 6,000,000 $ 6,100,000 $ 16,150,000<br />
Other Source $ ‐ $ ‐ $ ‐ $ ‐ $ ‐ $<br />
‐<br />
TBD $ ‐ $ ‐ $ ‐ $ ‐ $ ‐ $<br />
‐<br />
$ ‐ $ 550,000 $ 3,500,000 $ 6,000,000 $ 6,100,000 $ 16,150,000<br />
Page ‐ 73
<strong>Capital</strong> <strong>Asset</strong> <strong>Management</strong> & <strong>Investment</strong> Program Maintenance of Way Ruby Junction MOW Training Module<br />
Maintenance of Way Projects – Ruby Junction MOW Training Module<br />
Project Name: Ruby Junction MOW Training Module Project ID: TBD<br />
Project Class: MOW Priority: S, LSI<br />
Start Date: 7/1/2013 Completion Date: 6/30/<strong>2014</strong> Project Type: <strong>Capital</strong><br />
Budgeted Dept: Rail MOW Project Manager: Kindig<br />
PROJECT DESCRIPTION<br />
Construct Track, OCS, Signals and comm. Components in area to use for training purposes.<br />
PROJECT JUSTIFICATION<br />
Bus and REM have vehicles that are out of service as training devices for immediate use when training apprentices in certain component repairs. Construction of this<br />
module would give MOW Training staff the ability to have hands on maintenance and repair activities of important components that are in service on the operating<br />
railroad all of the time. MOW does not have the ability to remove, replace, rebuild or adjust equipment that is not in service. On the job training is an important<br />
aspect of apprenticeship training but in MOW there is a risk involved if a switch machine or gate mechanism is repaired and not able to go back into service. It<br />
becomes an operations emergency. This module will provide out of service equipment to train on without the risk of service disruptions. This would enhance the<br />
MOW apprenticeship program and provide the ability to reduce the length of apprenticeship programs and OCS and Signals.<br />
STATUS<br />
N/A<br />
Expenditure Plan <strong>FY</strong><strong>2014</strong> <strong>FY</strong>2015 <strong>FY</strong>2016 <strong>FY</strong>2017 <strong>FY</strong>2018 Total 5‐Year Cost<br />
Current Year $ 752,600 $ ‐ $ ‐ $ ‐ $ ‐ $ 752,600<br />
$ 752,600 $ ‐ $ ‐ $ ‐ $ ‐ $ 752,600<br />
Revenue Plan <strong>FY</strong><strong>2014</strong> <strong>FY</strong>2015 <strong>FY</strong>2016 <strong>FY</strong>2017 <strong>FY</strong>2018 Total 5‐Year Cost<br />
Federal Share $ ‐ $ ‐ $ ‐ $ ‐ $ ‐ $<br />
‐<br />
<strong>TriMet</strong> Share $ 752,600 $ ‐ $ ‐ $ ‐ $ ‐ $ 752,600<br />
Other Source $ ‐ $ ‐ $ ‐ $ ‐ $ ‐ $<br />
‐<br />
TBD $ ‐ $ ‐ $ ‐ $ ‐ $ ‐ $<br />
‐<br />
$ 752,600 $ ‐ $ ‐ $ ‐ $ ‐ $ 752,600<br />
Page ‐ 74
<strong>Capital</strong> <strong>Asset</strong> <strong>Management</strong> & <strong>Investment</strong> Program Maintenance of Way Steel Bridge Improvements<br />
Maintenance of Way Projects – Steel Bridge Improvements<br />
Project Name: Steel Bridge Improvements Project ID: TBD<br />
Project Class: Maintenance of Way Priority: SR, RoD<br />
Start Date: 7/1/2013 Completion Date: 6/30/2015 Project Type: <strong>Capital</strong><br />
Budgeted Dept: Rail MOW Project Manager: Kindig<br />
PROJECT DESCRIPTION<br />
Make improvement to the Steel Bridge to restore speed from 5 mph to 15 mph. Specifics to include:<br />
‐ Span locks<br />
‐ Replace lift joints with flange‐bearing design to reduce impact/vibration<br />
‐ Replace/upgrade overhead contact wire lift bridge mechanism<br />
‐ Bridge structure repairs/improvements<br />
PROJECT JUSTIFICATION<br />
Improving the speed on the Steel Bridge will enhance the efficiency and speed at which riders reach their destination. This upgrade also includes safety upgrades for<br />
the bridge to reduce impact and vibration.<br />
STATUS<br />
N/A<br />
Expenditure Plan <strong>FY</strong><strong>2014</strong> <strong>FY</strong>2015 <strong>FY</strong>2016 <strong>FY</strong>2017 <strong>FY</strong>2018 Total 5‐Year Cost<br />
Current Year $ 500,000 $ ‐ $ ‐ $ ‐ $ ‐ $ 500,000<br />
$ 500,000 $ ‐ $ ‐ $ ‐ $ ‐ $ 500,000<br />
Revenue Plan <strong>FY</strong><strong>2014</strong> <strong>FY</strong>2015 <strong>FY</strong>2016 <strong>FY</strong>2017 <strong>FY</strong>2018 Total 5‐Year Cost<br />
Federal Share $ ‐ $ ‐ $ ‐ $ ‐ $ ‐ $<br />
‐<br />
<strong>TriMet</strong> Share $ 500,000 $ ‐ $ ‐ $ ‐ $ ‐ $ 500,000<br />
Other Source $ ‐ $ ‐ $ ‐ $ ‐ $ ‐ $<br />
‐<br />
TBD $ ‐ $ ‐ $ ‐ $ ‐ $ ‐ $<br />
‐<br />
$ 500,000 $ ‐ $ ‐ $ ‐ $ ‐ $ 500,000<br />
Page ‐ 75
<strong>Capital</strong> <strong>Asset</strong> <strong>Management</strong> & <strong>Investment</strong> Program Maintenance of Way Kubota L Series 9FT Backhoe<br />
Maintenance of Way Projects – Kubota L Series 9 FT Backhoe<br />
Project Name: Kubota L Series 9 FT Backhoe Project ID: TBD<br />
Project Class: MOW Priority: SR<br />
Start Date: 7/1/2013 Completion Date: 9/30/2013 Project Type: <strong>Capital</strong><br />
Budgeted Dept: Rail MOW Project Manager: Kindig<br />
PROJECT DESCRIPTION<br />
Purchase 4WD Kubota L Series Backhoe (or equivalent) with options as follows:<br />
9 Ft Backhoe<br />
Front End Loader<br />
72” Rotary Sweeper<br />
4 cyl Diesel<br />
Cab Enclosure<br />
PROJECT JUSTIFICATION<br />
This midsize piece of equipment will have the versatility to be used in remote areas of track when needed to change ties, replace switch machines, clear drainage<br />
impediments, and clean ditches and culverts, sweep paved track during Winter Ops events, place ballast, and assist in repair of underground drainage and ductbanks.<br />
Tie replacement without equipment to assist with movement of a 200 lb tie is labor intensive and stressful to the worker. We have areas that need 3‐4 ties at a time<br />
changed out and this equipment would increase our productivity. The equipment has a three point hitch that allows versatility to pull mowing equipment for<br />
maintenance of the large areas of rough cut mowing we have specifically along the I205 Corridor to Clackamas Town Center.<br />
STATUS<br />
N/A<br />
Expenditure Plan <strong>FY</strong><strong>2014</strong> <strong>FY</strong>2015 <strong>FY</strong>2016 <strong>FY</strong>2017 <strong>FY</strong>2018 Total 5‐Year Cost<br />
Current Year $ 66,000 $ ‐ $ ‐ $ ‐ $ ‐ $ 66,000<br />
$ 66,000 $ ‐ $ ‐ $ ‐ $ ‐ $ 66,000<br />
Revenue Plan <strong>FY</strong><strong>2014</strong> <strong>FY</strong>2015 <strong>FY</strong>2016 <strong>FY</strong>2017 <strong>FY</strong>2018 Total 5‐Year Cost<br />
Federal Share $ ‐ $ ‐ $ ‐ $ ‐ $ ‐ $<br />
‐<br />
<strong>TriMet</strong> Share $ 66,000 $ ‐ $ ‐ $ ‐ $ ‐ $ 66,000<br />
Other Source $ ‐ $ ‐ $ ‐ $ ‐ $ ‐ $<br />
‐<br />
TBD $ ‐ $ ‐ $ ‐ $ ‐ $ ‐ $<br />
‐<br />
$ 66,000 $ ‐ $ ‐ $ ‐ $ ‐ $ 66,000<br />
Page ‐ 76
SECTION 5 – FACILITIES<br />
CUSTOMER AND OPERATIONS
This page left intentionally blank.
<strong>Capital</strong> <strong>Asset</strong> <strong>Management</strong> & <strong>Investment</strong> Program Facilities – Customer & Operations Bus Stop Development Program<br />
Bus Stop Development Program ‐ Bus Shelters and Amenities<br />
<strong>TriMet</strong> is committed to a program of increased distribution of bus stop shelters based on:<br />
‐ 50 or more daily boardings<br />
‐ Significant use of the stop by persons in wheelchairs<br />
‐ Transfer location<br />
‐ Stops near principal attractions, institutions, schools or senior centers<br />
‐ Stops where there is an opportunity to attract new ridership from nearby or new development<br />
There are nearly 200 bus stop locations with 50 or more daily boardings without shelters. <strong>TriMet</strong> has scaled back a program of 50 new bus shelters<br />
annually to 15‐20 new shelters annually dependant on funding and site prep availability. The cost of one installed shelter is approximately $5,000.<br />
<strong>TriMet</strong> makes every effort to locate bus stops and shelters within the public right of way or to secure dedicated easements with new development.<br />
As <strong>TriMet</strong> places new bus shelters in needed, but logistically difficult locations, right of way easement or acquisition is increasingly required. In some<br />
instances these easements are required for existing shelter locations where property owners otherwise require the removal of shelters. Easement<br />
cost for further improvement of bus stops is estimated at up to $75,000 annually.<br />
Bus Stop Development Program ‐ ADA Access Improvements<br />
In addition to the placement of bus shelters, <strong>TriMet</strong> is improving bus stops by constructing wheelchair access and other sidewalk and pedestrian<br />
improvements that integrate stops with the streetscape. While most of these improvements are in the form of pavement, bus stop lighting may be<br />
added along with customer information, benches and trash containers. These amenities are placed in accordance with <strong>TriMet</strong> bus stop guidelines<br />
and opportunities as they arise. Improvements will be focused on frequent bus stops and service improvement focus areas in accordance with the<br />
Transit <strong>Investment</strong> Plan.<br />
While there is a theoretical point at which this program would conclude, the great need for bus stop access improvements, particularly in suburban<br />
areas, suggests that this program will be on‐going for programming purposes. These improvements will be combined and leveraged where possible<br />
with collateral sidewalk and crosswalk improvements supported by local jurisdictions and private development.<br />
Bus Stop Development Program ‐ Bus Stop Sign and Pole Replacement<br />
To make bus stops more attractive, easier to identify, consistently placed and outfitted with scheduling information, <strong>TriMet</strong> is replacing existing bus<br />
stops signs and poles with a new design. The new design incorporates a two‐sided half‐circular sign with new <strong>TriMet</strong> logo, flag‐mounted on a dark<br />
blue hexagonal shape pole. The sign has clear, easy to understand information for passengers that builds customer confidence in using the system<br />
and should help attract new riders. Information on the new signs and poles will include larger route numbers, zone and destination information. A<br />
reflective coating will improve visibility and identification for both driver and passenger. Separate blades will denote special service “brands.”<br />
Designed to be adaptable to many conditions and locations, the new sign will be easier to update and maintain. Additionally, the signs will include a<br />
printed bus schedule holder, sized for the number of routes serving the stop. The new signs are being deployed on a route‐by‐route basis in step<br />
with the TIP and development of Frequent Service Corridors. All stops will receive new signs.<br />
Page ‐ 79
<strong>Capital</strong> <strong>Asset</strong> <strong>Management</strong> & <strong>Investment</strong> Program Facilities – Customer & Operations Bus Stop Development Program<br />
Bus Stop Development Program ‐ Streamline<br />
This program was initiated in the Fall of 1998 as a partnership with the City of Portland has now been more integrated into the work plan as we look<br />
to the suburban communities for new applications of signal priority system for transit vehicles. Overall, the program seeks to improve the operating<br />
efficiency of high‐ridership, high‐frequency routes using a range of tools including: (1) Signal priority treatment, (2) bus stop re‐spacing to standards,<br />
(3) bus queue‐jump lanes, (4) curb extensions, (5) route simplification, (6) limited bus lanes and (7) right‐turn‐only, except bus treatments. The<br />
program also included strategic passenger amenity improvements (signs and shelters) and improved customer information to match with stops<br />
relocation and/or consolidation.<br />
In <strong>FY</strong>05 the program was overlaid with the Frequent Bus Corridor service development program to include bus stop amenities, bus stop thinning,<br />
sign and pole replacement and in some instances route simplification and crosswalk and sidewalk improvements. Streamline has now become more<br />
“operational hotspot” based, rather than being confined to line‐by‐line implementation. Streamline efforts will also be extended to jurisdictions<br />
outside the City of Portland, requiring some new budget allowance for signal priority/Opticom installations.<br />
While the Streamline program is largely invisible to the riding public, transit riders’ benefit from more reliable service and improved travel times.<br />
The program has high recognition and support among jurisdictional partners.<br />
Bus Stop Development Program ‐ Solar Lighting<br />
Bus riders are very conscious of the security provided by lighting at bus stops. While conventional streetlights can often be found near bus stops,<br />
many stops remain poorly illuminated.<br />
The cost of “hard‐wiring” a bus shelter or bus stop area is significant and impractical in many locations. Hard‐wired installations cannot be relocated<br />
without repeating the cost. <strong>TriMet</strong> has installed the latest generation of solar lighting systems at bus stops at over 350 bus shelters along the<br />
system. Pole mounted LED lighting units will be expanded to other well‐used stops throughout the systems where direct power connections are<br />
impractical.<br />
Page ‐ 80
<strong>Capital</strong> <strong>Asset</strong> <strong>Management</strong> & <strong>Investment</strong> Program Facilities – Customer & Operations Bus Stop Development Program<br />
Bus Stop Development Program Summary<br />
Facilities - Customer & Operations - Bus Stop Development<br />
<strong>FY</strong><br />
<strong>FY</strong>14 <strong>FY</strong>15 <strong>FY</strong>16 <strong>FY</strong>17 <strong>FY</strong>18 <strong>2014</strong>-2018<br />
TOTALS<br />
New Shelters Forecast 15 15 15 15 15 75<br />
Operating Program<br />
Project Planning FTE Positions (8.0) - included in baseline operating budget $ 736,566 $ 758,663 $ 781,423 $ 804,866 $ 829,012 $ 3,910,529<br />
Operating Program Total (included in baseline operating budget) $ 736,566 $ 758,663 $ 781,423 $ 804,866 $ 829,012 $ 3,910,529<br />
<strong>Capital</strong> Program<br />
New Shelters & Amenities $ 158,000 $ 166,000 $ 174,000 $ 194,000 $ - $ 692,000<br />
Pavement, pedestrian and ADA Improvements (carryover) $ 150,000 $ 380,000 $ 338,000 $ - $ - $ 868,000<br />
Bus Stop Signs and Poles/Solar Lighting (carryover) $ 55,000 $ 72,000 $ 75,000 $ - $ - $ 202,000<br />
Transit Safety Enhancements (carryover) $ 100,000 $ 100,000 $ 100,000 $ - $ - $ 300,000<br />
Streamline/TSM Treatments (carryover) $ 57,680 $ 100,000 $ 125,000 $ - $ - $ 282,680<br />
<strong>Capital</strong> Program Total $ 520,680 $ 818,000 $ 812,000 $ 194,000 $ - $ 2,344,680<br />
Bus Stop Development Total $ 1,257,246 $ 1,576,663 $ 1,593,423 $ 998,866 $ 829,012 $ 6,255,209<br />
Funding Sources<br />
Regional MTIP (89.73%) $ 467,206 TBA TBA TBA TBA $ 467,206<br />
<strong>TriMet</strong> General Funds (10.27%) $ 53,474 $ 818,000 $ 812,000 $ 194,000 $ - $ 1,877,474<br />
Funding Sources Total $ 520,680 $ 818,000 $ 812,000 $ 194,000 $ - $ 2,344,680<br />
Page ‐ 81
<strong>Capital</strong> <strong>Asset</strong> <strong>Management</strong> & <strong>Investment</strong> Program Facilities – Customer & Operations Bus Stop Development Program<br />
Neighborhood Shelters<br />
TABLE 4A. CUSTOMER FACILITIES AND AMENITIES - BUS SHELTERS<br />
RETIRE<br />
BUS SHELTERS INSTALLED ON-STREET<br />
Yr Purchased QT SHELTER TYPE END <strong>FY</strong> <strong>2014</strong> 2015 2016 2017 2018<br />
1991 205 Shelters A,B 2011 150 150 150 150 150<br />
1992 130 Shelters A,B,AX,BX 2012 120 120 120 120 120<br />
1993 119 Shelters A,B,AX,BX 2013 115 115 115 115 115<br />
1994 36 Shelters A,B,AX,BX <strong>2014</strong> 30 30 30 30 30<br />
1995 30 Shelters A,B,BB,AX,BX,LL 2015 30 30 30 30 30<br />
1996 35 Shelters A,B,AB,AX,BX,TL 2016 35 35 35 35 35<br />
1998 40 Shelters A,B,AX,BX 2018 40 40 40 40 40<br />
2000 50 Shelters A,B,AX,BX 2020 50 50 50 50 50<br />
2001 70 Shelters A,B,AX,BX 2021 70 70 70 70 70<br />
2002 100 Shelters A,B,AX,BX 2022 100 100 100 100 100<br />
2003 40 Shelters A,B,AX,BX 2023 40 40 40 40 40<br />
2004 50 Shelters A,B,AX,BX 2024 50 50 50 50 50<br />
2005 25 Shelters A,B,AX,BX 2025 25 25 25 25 25<br />
2006 35 Shelters A,B,AX,BX 2026 35 35 35 35 35<br />
2007 35 Shelters A,B,AX,BX 2027 35 35 35 35 35<br />
2008 35 Shelters A,B,AX,BX 2028 35 35 35 35 35<br />
2009 35 Shelters A,B,AX,BX,2BXW 2029 35 35 35 35 35<br />
2010 35 Shelters A,B,AX,BX 2030 35 35 35 35 35<br />
2011 20 Shelters A,B,AX,BX 2031 30 30 30 30 30<br />
2012 15 Shelters A,B,AX,BX,2BX 2032 20 20 20 20 20<br />
2013 15 Shelters A,B,AX,BX,2BX 2033 15 15 15 15 15<br />
<strong>2014</strong> 15 Shelters A,B,AX,BX 2034 15 15 15 15 15<br />
2015 15 Shelters A,B,AX,BX 2035 0 15 15 15 15<br />
2016 15 Shelters A,B,AX,BX 2036 0 0 15 15 15<br />
2017 15 Shelters A,B,AX,BX 2037 0 0 0 15 15<br />
2018 15 Shelters A,B,AX,BX 2038 0 0 0 0 15<br />
TOTAL YEAR END SHELTERS 1,110 1,125 1,140 1,155 1,170<br />
REPLACEMENT FOR DAMAGED 6 6 6 6 6<br />
SERVICE EXPANSION 15 15 15 15 15<br />
TOTAL SHELTER REQUEST 21 21 21 21 21<br />
Page ‐ 82
<strong>Capital</strong> <strong>Asset</strong> <strong>Management</strong> & <strong>Investment</strong> Program Facilities – Customer & Operations Bus Stop Development Program<br />
Neighborhood Shelters<br />
TABLE 4B. CUSTOMER FACILITIES AND AMENITIES - BUS STOPS & SHELTERS<br />
NEIGHBORHOOD BUS SHELTERS<br />
OPTIMUM/<br />
CURRENT MINIMUM<br />
PROJECT ACTION YEAR AGE REPLACEMENT <strong>FY</strong><strong>2014</strong>-2018<br />
ITEM REQUIRED MANAGER NEEDED NEEDED <strong>FY</strong>2013 CYCLE COND. <strong>2014</strong> 2015 2016 2017 2018 TOTAL<br />
Neighborhood Shelters Replacement<br />
Replacement for Damaged Shelters Park, Y. Replace annual n/a 10/year damaged $30,000 $30,000 $30,000 $30,000 $30,000 $150,000<br />
Approx. 10 shelters annually<br />
Total Replacement $30,000 $30,000 $30,000 $30,000 $30,000 $150,000<br />
Neighborhood Shelters Refurbishment<br />
Shelters - approx. 1,100 installed on-street<br />
Refurbish, incl. Painting, roof replacement, Park, Y. Refurbish annual 21 yrs n/a 3 $50,000 $50,000 $50,000 $50,000 $50,000 $250,000<br />
glass/film replacement, bench repair, etc.<br />
Refurbish Shelter Electrified Lighting Papadopoulos, E. Replace annual 3 $3,000 $3,000 $3,000 $3,000 $3,000 $15,000<br />
Refurbish Shelter Trash Receptacles Oxley, P. Replace annual 3 $10,000 $10,000 $10,000 $10,000 $10,000 $50,000<br />
Refurbish Bus Stop Signs, Poles & Assemblies Papadopoulos, E. Replace annual 3 $25,000 $25,000 $25,000 $25,000 $25,000 $125,000<br />
Refurbish Solar Lighting Papadopoulos, E. Replace annual 3 $12,000 $12,000 $12,000 $20,000 $20,000 $76,000<br />
Total Refurbishment $100,000 $100,000 $100,000 $108,000 $108,000 $516,000<br />
GRAND TOTAL $130,000 $130,000 $130,000 $138,000 $138,000 $666,000<br />
Page ‐ 83
<strong>Capital</strong> <strong>Asset</strong> <strong>Management</strong> & <strong>Investment</strong> Program Facilities – Customer & Operations Bus Stop Development Program<br />
Bus Shelters<br />
TABLE 4C. CUS TOMER FACILITIES AND AMENITIES - BUS S HELTERS<br />
ITEMS REQUIRED<br />
PROJECT<br />
MANAGER<br />
ACTION<br />
NEEDED<br />
<strong>FY</strong><br />
NEEDED<br />
CURRENT<br />
AGE <strong>FY</strong>14<br />
OPTIMUM<br />
REPLACEMENT<br />
CYCLE COND. <strong>2014</strong> 2015 2016 2017 2018<br />
<strong>FY</strong>14-<strong>FY</strong>18<br />
TOTAL<br />
MALL SHELTERS - South Mall (Qty 11) 36<br />
Panels<br />
Vandal-film application Ronan Replace <strong>2014</strong> 3 $900 $900 $900 $900 $900 $4,500<br />
Roof & Windscreens<br />
Caulk repair Ronan Repair <strong>2014</strong> 36 15/20 3 $400 $400 $400 $400 $400 $2,000<br />
Electrical System<br />
No scheduled maintenance in 5-year window.<br />
MALL SHELTERS - Central Mall (Qty 25) 36<br />
Panels<br />
Vandal-film application Ronan Replace <strong>2014</strong> 3 $2,000 $2,000 $2,000 $2,000 $2,000 $10,000<br />
Roof & Windscreens<br />
Caulk repair Ronan Repair <strong>2014</strong> 36 15/20 3 $1,000 $1,000 $1,000 $1,000 $1,000 $5,000<br />
Electrical System<br />
LED track lighting Replace 2020 15<br />
No scheduled maintenance in 5-year window.<br />
15/20 $0<br />
MALL SHELTERS - North Mall (Qty 7) 36<br />
Panels<br />
Vandal-film application Ronan Replace <strong>2014</strong> 3 $600 $600 $600 $600 $600 $3,000<br />
Roof & Windscreens<br />
Caulk repair Ronan Repair <strong>2014</strong> 36 15/20 3 $300 $300 $300 $300 $300 $1,500<br />
Electrical System<br />
No scheduled maintenance in 5-year window.<br />
MALL SHELTERS - Cross Mall (Qty 9) 36<br />
Panels<br />
Vandal-film application Ronan Replace <strong>2014</strong> 3 $700 $700 $700 $700 $700 $3,500<br />
Roof & Windscreens<br />
Caulk repair Ronan Repair <strong>2014</strong> 36 15/20 3 $350 $350 $350 $350 $350 $1,750<br />
Electrical System<br />
No scheduled maintenance in 5-year window.<br />
PSU SHELTERS (Qty 4)<br />
No scheduled maintenance in 5-year window.<br />
GRAND TOTAL BUS SHELTERS . . . . $6,250 $6,250 $6,250 $6,250 $6,250 $31,250<br />
Page ‐ 84
<strong>Capital</strong> Improvement Program Facilities – Customer & Operations Customer Information Services<br />
CIS Systems<br />
Customer information on the Blue, Red and Yellow line platforms is displayed in 2‐ or 4‐sided “pylons.” These pylons are faced with heavy enamel<br />
panels and doors, which are subject to vandalism and vehicle collisions. These funds are designed as a resource for repair and replacement of these<br />
structures, as well as other on‐street customer information.<br />
Customer Information Modernization<br />
Many of <strong>TriMet</strong>’s transit centers and visitor destinations are 14‐25 years old and have had no significant maintenance of improvements. Customer<br />
information displays at these locations have likewise lacked refurbishment or modernization. This funding would pay for targeted annual projects at<br />
the following locations:<br />
<strong>FY</strong><strong>2014</strong> Rose Quarter TC: Install super bay signs at bus stops, construct centrally‐located information kiosk, wayfinding signage<br />
<strong>FY</strong>2015 Washington Park: Replace information displays in both lobbies near platforms, replace porcelain enamel w/ more durable, lessexpensive<br />
material<br />
<strong>FY</strong>2016 Oregon City TC & Washington Square TC: upgrade signs at stops, refresh cupola w/modern place‐making, centralize and consolidate<br />
maps & schedules; potentially add LCD display.<br />
<strong>FY</strong>2017 Beaverton TC & Sunset TC: upgrade signs at stops, refresh cupola w/modern place‐making, centralize and consolidate maps &<br />
schedules<br />
<strong>FY</strong>2018 Parkrose TC & downtown St Johns: upgrade signs at stops, refresh cupola w/modern place‐making, centralize and consolidate maps<br />
& schedules.<br />
CUSTOMER FACILITIES & AMENITIES - CUSTOMER INFORMATION & TTO<br />
OPTIMUM/<br />
CURRENT MINIMUM<br />
ACTION YEAR AGE REPLACEMENT <strong>2014</strong>-2018<br />
ITEM REQUIRED NEEDED NEEDED <strong>FY</strong>2013 CYCLE CONDITION <strong>2014</strong> 2015 2016 2017 2018 TOTALS<br />
CUSTOMER SUPPORT FACILITIES & EQUIPMENT<br />
Customer Info Equipment Replacement Replace <strong>2014</strong>-2018 21 10/10 5,000 5,000 5,000 5,000 5,000 $25,000<br />
Document Services<br />
Laminator (Copy Center) Replace 5/7 New<br />
GBC Power Punch + Binder (Copy Center) Replace 5/7 Good<br />
Folder Duplo D-590 (Copy Center) Replace 2017 New 5/7 New<br />
Customer Information Modernization Replace <strong>2014</strong>-2018 1 $25,000 $50,000 $50,000 $50,000 $50,000 $225,000<br />
Postage Machine w/meter Replace 2017 New 5/6 New $25,000 $25,000<br />
TOTAL $30,000 $55,000 $55,000 $55,000 $80,000 $275,000<br />
Page ‐ 85
<strong>Capital</strong> <strong>Asset</strong> <strong>Management</strong> & <strong>Investment</strong> Program Facilities – Customer & Operations Bus Stop Development – New Shelters<br />
Bus Stop Development – New Shelters<br />
Project Name: Bus Stop Development – New Shelters Project ID: 5508<br />
Project Class: Facilities Priority: LSI<br />
Start Date: Ongoing Completion Date: Ongoing Project Type: <strong>Capital</strong><br />
Budgeted Dept: Bus Stop Development Project Manager: Park<br />
PROJECT DESCRIPTION<br />
Installation of new shelters based on:<br />
50 or more daily boardings<br />
Significant use of the stop by persons in wheelchairs<br />
Transfer location<br />
Stops near principal attractions, institutions, schools or senior centers<br />
Stops where there is an opportunity to attract new ridership from nearby or new development<br />
PROJECT JUSTIFICATION<br />
There are nearly 200 bus stops locations with 50 or more daily boardings without shelters. <strong>TriMet</strong> anticipates placing 15‐20 new shelters annually depending on<br />
funding and site availability. The cost of one installed shelter is approximately $5,000. <strong>TriMet</strong> prioritizes placing bus stops and shelters within the public right of way<br />
or to secure dedicated easements with new development. As <strong>TriMet</strong> places new bus shelters in needed, but logistically difficult locations, right of way easement or<br />
acquisition is increasingly required. In some instances these easements are required for existing shelter locations where property owners otherwise require the<br />
removal of shelters. Easement cost for further improvement of bus stops is estimated at $75,000 annually.<br />
STATUS<br />
N/A<br />
Expenditure Plan <strong>FY</strong><strong>2014</strong> <strong>FY</strong>2015 <strong>FY</strong>2016 <strong>FY</strong>2017 <strong>FY</strong>2018 Total 5‐Year Cost<br />
Current Year $ 158,000 $ 166,000 $ 174,000 $ 194,000 $ ‐ $ 692,000<br />
$ 158,000 $ 166,000 $ 174,000 $ 194,000 $ ‐ $ 692,000<br />
Revenue Plan <strong>FY</strong><strong>2014</strong> <strong>FY</strong>2015 <strong>FY</strong>2016 <strong>FY</strong>2017 <strong>FY</strong>2018 Total 5‐Year Cost<br />
Federal Share $ 141,773 $ 148,952 $ 156,130 $ 174,076 $ ‐ $ 620,932<br />
<strong>TriMet</strong> Share $ 16,227 $ 17,048 $ 17,870 $ 19,924 $ ‐ $ 71,068<br />
Other Source $ ‐ $ ‐ $ ‐ $ ‐ $ ‐ $<br />
‐<br />
TBD $ ‐ $ ‐ $ ‐ $ ‐ $ ‐ $<br />
‐<br />
$ 158,000 $ 166,000 $ 174,000 $ 194,000 $ ‐ $ 692,000<br />
Page ‐ 86
<strong>Capital</strong> <strong>Asset</strong> <strong>Management</strong> & <strong>Investment</strong> Program Facilities – Customer & Operations Bike to Transit Facilities<br />
Bike to Transit Facilities<br />
Project Name: Bike to Transit Facilities Project ID: 2902<br />
Project Class: Facilities Priority: LSI<br />
Start Date: Ongoing Completion Date: Ongoing Project Type: Operating<br />
Budgeted Dept: Planning & Policy Project Manager: Owen, J.<br />
PROJECT DESCRIPTION<br />
Purchase and installation of bike racks, lockers and signage at MAX stations and Transit Centers.<br />
PROJECT JUSTIFICATION<br />
Each year, the Bike Program requests bike racks, lockers, and signage which are hard to project and often too small to add to the CIP as individual projects and would<br />
otherwise be funded out of Park & Ride and bus stop projects. Ongoing projects that will require investment in <strong>FY</strong>14 include installation of bike racks and bike lockers<br />
when demand exceeds bike parking capacity at MAX stations and Transit Centers as well as way finding, regulatory and informational signage.<br />
STATUS<br />
N/A<br />
Expenditure Plan <strong>FY</strong><strong>2014</strong> <strong>FY</strong>2015 <strong>FY</strong>2016 <strong>FY</strong>2017 <strong>FY</strong>2018 Total 5‐Year Cost<br />
Current Year $ 25,000 $ 25,000 $ 25,000 $ 25,000 $ 25,000 $ 125,000<br />
$ 25,000 $ 25,000 $ 25,000 $ 25,000 $ 25,000 $ 125,000<br />
Revenue Plan <strong>FY</strong><strong>2014</strong> <strong>FY</strong>2015 <strong>FY</strong>2016 <strong>FY</strong>2017 <strong>FY</strong>2018 Total 5‐Year Cost<br />
Federal Share $ ‐ $ ‐ $ ‐ $ ‐ $ ‐ $<br />
‐<br />
<strong>TriMet</strong> Share $ 25,000 $ 25,000 $ 25,000 $ 25,000 $ 25,000 $ 125,000<br />
Other Source $ ‐ $ ‐ $ ‐ $ ‐ $ ‐ $<br />
‐<br />
TBD $ ‐ $ ‐ $ ‐ $ ‐ $ ‐ $<br />
‐<br />
$ 25,000 $ 25,000 $ 25,000 $ 25,000 $ 25,000 $ 125,000<br />
Page ‐ 87
<strong>Capital</strong> <strong>Asset</strong> <strong>Management</strong> & <strong>Investment</strong> Program Facilities – Customer & Operations Bus On‐Street Related Maintenance<br />
Bus On‐Street Related Maintenance<br />
Project Name: Bus On‐Street Related Maintenance Project ID: 5563<br />
Project Class: Facilities Priority: S<br />
Start Date: Ongoing Completion Date: Ongoing Project Type: Operating<br />
Budgeted Dept: Bus Stop Development Project Manager: Park<br />
PROJECT DESCRIPTION<br />
Repair of bus stops is required to reduce wear on buses and to assure their ability to align with sidewalks for the boarding riders. Deteriorated pavement detracts<br />
from the appearance of bus stop and layover locations and is likely to be an unacceptable condition for the local jurisdiction. Replacement of asphalt with concrete<br />
pad costs in the range of $20,000 ‐ $30,000. This cost may or may not be shared.<br />
PROJECT JUSTIFICATION<br />
<strong>TriMet</strong> receives requests from partner jurisdictions to cover the cost or a portion of the cost for extraordinary street repair at heavily used bus stops or bus layover<br />
locations. While <strong>TriMet</strong> continues to assert that street repair is the responsibility of jurisdictions, there are justifiable instances where the bus‐caused impact is<br />
extraordinary. <strong>TriMet</strong> has established a rule‐of‐thumb where <strong>TriMet</strong> participation may be negotiated where 150 or more buses are using a stop daily.<br />
While this is maintenance related, the maintenance is within the public right‐of‐way and therefore, not carried into replacement tables. Repairs are regarded as onetime‐only,<br />
but some replacement cycle might need to be considered. While this improved pavement may deteriorate over time, any repair or replacement of these<br />
bus stop pads will be managed from this budget.<br />
STATUS<br />
N/A<br />
Expenditure Plan <strong>FY</strong><strong>2014</strong> <strong>FY</strong>2015 <strong>FY</strong>2016 <strong>FY</strong>2017 <strong>FY</strong>2018 Total 5‐Year Cost<br />
Current Year $ 100,000 $ 100,000 $ 100,000 $ 100,000 $ 100,000 $ 500,000<br />
$ 100,000 $ 100,000 $ 100,000 $ 100,000 $ 100,000 $ 500,000<br />
Revenue Plan <strong>FY</strong><strong>2014</strong> <strong>FY</strong>2015 <strong>FY</strong>2016 <strong>FY</strong>2017 <strong>FY</strong>2018 Total 5‐Year Cost<br />
Federal Share $ ‐ $ ‐ $ ‐ $ ‐ $ ‐ $<br />
‐<br />
<strong>TriMet</strong> Share $ 100,000 $ 100,000 $ 100,000 $ 100,000 $ 100,000 $ 500,000<br />
Other Source $ ‐ $ ‐ $ ‐ $ ‐ $ ‐ $<br />
‐<br />
TBD $ ‐ $ ‐ $ ‐ $ ‐ $ ‐ $<br />
‐<br />
$ 100,000 $ 100,000 $ 100,000 $ 100,000 $ 100,000 $ 500,000<br />
Page ‐ 88
<strong>Capital</strong> <strong>Asset</strong> <strong>Management</strong> & <strong>Investment</strong> Program Facilities – Customer & Operations Respond to ADA Audit<br />
Respond to ADA Audit<br />
Project Name: Respond to ADA Audit Project ID: TBD<br />
Project Class: Facilities Priority: Safety<br />
Start Date: 7/1/2013 Completion Date: 6/30/<strong>2014</strong> Project Type: Operating<br />
Budgeted Dept: <strong>Capital</strong> Projects – Development & Operations Support Project Manager: Batty<br />
PROJECT DESCRIPTION<br />
<strong>TriMet</strong> must comply with the requirements of the Americans with Disabilities Act (ADA). The Federal Transit Administration’s Office of Civil Rights regularly audits<br />
<strong>TriMet</strong>’s facilities and vehicles. FTA identified a series of improvements to bring stations into conformance with current application of the federal regulations. Most<br />
are modest improvements to sidewalks, ramps, telephones and striping.<br />
PROJECT JUSTIFICATION<br />
<strong>TriMet</strong> is required to conform with the provisions of the ADA.<br />
STATUS<br />
Annually prioritize projects.<br />
Expenditure Plan <strong>FY</strong><strong>2014</strong> <strong>FY</strong>2015 <strong>FY</strong>2016 <strong>FY</strong>2017 <strong>FY</strong>2018 Total 5‐Year Cost<br />
Current Year $ 310,000 $ 300,000 $ 50,000 $ 50,000 $ 50,000 $ 760,000<br />
$ 310,000 $ 300,000 $ 50,000 $ 50,000 $ 50,000 $ 760,000<br />
Revenue Plan <strong>FY</strong><strong>2014</strong> <strong>FY</strong>2015 <strong>FY</strong>2016 <strong>FY</strong>2017 <strong>FY</strong>2018 Total 5‐Year Cost<br />
Federal Share $ ‐ $ ‐ $ ‐ $ ‐ $ ‐ $<br />
‐<br />
<strong>TriMet</strong> Share $ 310,000 $ 300,000 $ 50,000 $ 50,000 $ 50,000 $ 760,000<br />
Other Source $ ‐ $ ‐ $ ‐ $ ‐ $ ‐ $<br />
‐<br />
TBD $ ‐ $ ‐ $ ‐ $ ‐ $ ‐ $<br />
‐<br />
$ 310,000 $ 300,000 $ 50,000 $ 50,000 $ 50,000 $ 760,000<br />
Page ‐ 89
<strong>Capital</strong> <strong>Asset</strong> <strong>Management</strong> & <strong>Investment</strong> Program Facilities – Customer & Operations Lloyd District Transit Tracker Enhancements<br />
Lloyd District Transit Tracker Enhancements<br />
Project Name: Lloyd District Transit Tracker Enhancements Project ID: 5599<br />
Project Class: Facilities Priority: SR, RoD<br />
Start Date: Ongoing Completion Date: Ongoing Project Type: Operating<br />
Budgeted Dept: Bus Stop Development Project Manager: Park<br />
PROJECT DESCRIPTION<br />
Lloyd District TMA and PDC have committed funding totaling $204,500 to complete upgrade electrical connections to bus shelters and install real time arrival<br />
information for 12 shelters along NE Multnomah and two MAX platforms at NE 7th Avenue.<br />
PROJECT JUSTIFICATION<br />
Lloyd District TMA and PDC have committed funding totaling $204,500 for this project.<br />
In <strong>FY</strong>2011, electrical connection work was completed, along with design, fabrication and installation of all bus and rail real time flat screen reader boards. Once<br />
reader boards are energized, Lloyd TMA will directly pay annual cellular data service fees (estimated at $10,000) for a five year period.<br />
STATUS<br />
N/A<br />
Expenditure Plan <strong>FY</strong><strong>2014</strong> <strong>FY</strong>2015 <strong>FY</strong>2016 <strong>FY</strong>2017 <strong>FY</strong>2018 Total 5‐Year Cost<br />
Current Year $ 10,000 $ 10,000 $ 10,000 $ 10,000 $ ‐ $ 40,000<br />
$ 10,000 $ 10,000 $ 10,000 $ 10,000 $ ‐ $ 40,000<br />
Revenue Plan <strong>FY</strong><strong>2014</strong> <strong>FY</strong>2015 <strong>FY</strong>2016 <strong>FY</strong>2017 <strong>FY</strong>2018 Total 5‐Year Cost<br />
Federal Share $ ‐ $ ‐ $ ‐ $ ‐ $ ‐ $<br />
‐<br />
<strong>TriMet</strong> Share $ ‐ $ ‐ $ ‐ $ ‐ $ ‐ $<br />
‐<br />
Other Source $ 10,000 $ 10,000 $ 10,000 $ 10,000 $ ‐ $ 40,000<br />
TBD $ ‐ $ ‐ $ ‐ $ ‐ $ ‐ $<br />
‐<br />
$ 10,000 $ 10,000 $ 10,000 $ 10,000 $ ‐ $ 40,000<br />
Page ‐ 90
<strong>Capital</strong> <strong>Asset</strong> <strong>Management</strong> & <strong>Investment</strong> Program Facilities – Customer & Operations Park & Ride Signage and Shared Use Support<br />
Park & Ride Signage and Share Use Support<br />
Project Name: Park & Ride Signage and Shared Use Support Project ID: 5588<br />
Project Class: Facilities Priority: LSI<br />
Start Date: Ongoing Completion Date: Ongoing Project Type: Operating<br />
Budgeted Dept: Bus Stop Development Project Manager: Park<br />
PROJECT DESCRIPTION<br />
This project facilitates the continuing development of shared‐use park and ride lots – along with an effort to improve monument and pathfinder signage for all<br />
existing <strong>TriMet</strong> lots. This is consistent with the finding of the recent Park and Ride Policy Committee that shared‐use lots need to be promoted.<br />
PROJECT JUSTIFICATION<br />
These improvements will be low investment and high return by optimizing use of exiting lots and locating new cost‐effective shared lots. Some of the funds will be<br />
used to make modest lot improvements (sealing, striping, etc.) to shared lot properties.<br />
STATUS<br />
N/A<br />
Expenditure Plan <strong>FY</strong><strong>2014</strong> <strong>FY</strong>2015 <strong>FY</strong>2016 <strong>FY</strong>2017 <strong>FY</strong>2018 Total 5‐Year Cost<br />
Current Year $ 25,000 $ 25,000 $ 25,000 $ 25,000 $ 25,000 $ 125,000<br />
$ 25,000 $ 25,000 $ 25,000 $ 25,000 $ 25,000 $ 125,000<br />
Revenue Plan <strong>FY</strong><strong>2014</strong> <strong>FY</strong>2015 <strong>FY</strong>2016 <strong>FY</strong>2017 <strong>FY</strong>2018 Total 5‐Year Cost<br />
Federal Share $ ‐ $ ‐ $ ‐ $ ‐ $ ‐ $<br />
‐<br />
<strong>TriMet</strong> Share $ 25,000 $ 25,000 $ 25,000 $ 25,000 $ 25,000 $ 125,000<br />
Other Source $ ‐ $ ‐ $ ‐ $ ‐ $ ‐ $<br />
‐<br />
TBD $ ‐ $ ‐ $ ‐ $ ‐ $ ‐ $<br />
‐<br />
$ 25,000 $ 25,000 $ 25,000 $ 25,000 $ 25,000 $ 125,000<br />
Page ‐ 91
<strong>Capital</strong> <strong>Asset</strong> <strong>Management</strong> & <strong>Investment</strong> Program Facilities – Customer & Operations Renew the Blue<br />
Renew the Blue<br />
Project Name: Renew the Blue Project ID: TBD<br />
Project Class: Facilities – Customer & Operations Priority: S<br />
Start Date: 7/1/2012 Completion Date: 6/30/2018 Project Type: Operating<br />
Budgeted Dept: <strong>Capital</strong> Projects – Development & Operations Support Project Manager: Batty<br />
PROJECT DESCRIPTION<br />
Additional Security & Safety station improvements from Hollywood to Gresham.<br />
Level I (Safety & Security) Level II (SGR)<br />
Pedestrian Crossing Safety Platform Edge Tile Renewal<br />
Lighting (New Fixtures)<br />
Additional Lighting Landscape, demo, replace<br />
Shelter Renewal Remove Old Lift Building<br />
Relocate TVM’s/Access Control Paving Clean/Spot Repair<br />
The current estimate for the overall Level I Program, including escalation, is $10.1 million. Level II is estimated to be $2.2 million.<br />
PROJECT JUSTIFICATION<br />
The Eastside stations were the first stations to be operational several years back and are showing signs of aging. Safety and Security is the primary focus for <strong>TriMet</strong><br />
riders and this expanded Renew the Blue program will put the focus back on safety and security elements. In addition, modest aesthetic enhancements and general<br />
repairs are included. Improving these facilities in this way has the potential of also increasing rider satisfaction and thereby ridership.<br />
STATUS<br />
N/A<br />
Expenditure Plan <strong>FY</strong><strong>2014</strong> <strong>FY</strong>2015 <strong>FY</strong>2016 <strong>FY</strong>2017 <strong>FY</strong>2018 Total 5‐Year Cost<br />
Current Year $ 2,463,000 $ 2,463,000 $ 2,463,000 $ 2,463,000 $ 2,463,000 $ 12,315,000<br />
$ 2,463,000 $ 2,463,000 $ 2,463,000 $ 2,463,000 $ 2,463,000 $ 12,315,000<br />
Revenue Plan <strong>FY</strong><strong>2014</strong> <strong>FY</strong>2015 <strong>FY</strong>2016 <strong>FY</strong>2017 <strong>FY</strong>2018 Total 5‐Year Cost<br />
Federal Share $ ‐ $ ‐ $ ‐ $ ‐ $ ‐ $<br />
‐<br />
<strong>TriMet</strong> Share $ 2,463,000 $ 2,463,000 $ 2,463,000 $ 2,463,000 $ 2,463,000 $ 12,315,000<br />
Other Source $ ‐ $ ‐ $ ‐ $ ‐ $ ‐ $<br />
‐<br />
TBD $ ‐ $ ‐ $ ‐ $ ‐ $ ‐ $<br />
‐<br />
$ 2,463,000 $ 2,463,000 $ 2,463,000 $ 2,463,000 $ 2,463,000 $ 12,315,000<br />
Page ‐ 92
<strong>Capital</strong> <strong>Asset</strong> <strong>Management</strong> & <strong>Investment</strong> Program Facilities – Customer and Operations Facilities <strong>Management</strong><br />
Facilities <strong>Management</strong> ‐ Introduction<br />
Power, lighting, fuel dispensing, fleet maintenance equipment and other systems (structural and mechanical) must function in order to keep <strong>TriMet</strong><br />
fleets functional. Elevators are vital for customer access and building systems provide suitable and healthy working environments for <strong>TriMet</strong> staff.<br />
Most people notice systems only when something loses function or is unreliable. <strong>TriMet</strong> Facilities Division’s challenge (and opportunity) is in finding<br />
the balance to minimize significant disruptions and maximize lifecycles while prioritizing existing funding and replacement needs.<br />
Compared to eastern transit systems, the bulk of <strong>TriMet</strong>’s fixed assets are young, having been built in the last forty years. Most of our assets have a<br />
lifecycle of 30 or fewer years (often based on wear or driven by changes in various codes). <strong>TriMet</strong> is moving into a period where it expects to see<br />
maintenance requirements and system disruptions increasing as our oldest assets are due for replacement. In many cases deferral is a viable option,<br />
but ill increase overall lifecycle costs and increase the maintenance backlog in future years. Current bus hoist replacement work is an example of an<br />
end‐of‐lifecycle replacement program, whereas, proposed facilities upgrades to the Center Street Operations building is an example of timing<br />
upgrades to make use of efficiencies provided by coincident PMLR work to the building.<br />
Facilities are broken into the following categories and discussed individually throughout the remainder of the section:<br />
Building Area/Component<br />
Electrical Equipment & Systems<br />
HVAC Equipment & Systems<br />
Lifting Equipment & Systems<br />
Plumbing Systems<br />
Safety/Hazmat Systems<br />
Site/Property Improvements<br />
Other Systems & Equipment<br />
Facilities <strong>Management</strong> ‐ Building Area/Component<br />
This asset category covers our main buildings and includes such items as:<br />
Roofs Windows Battery Rooms<br />
Repair Bays Stairwells Carpet<br />
Walls Welding Areas Lobbies<br />
Life cycle length for building components range from a few years (surface paint) to 100+ years (structural frame). Generally, items in this category<br />
having a short life cycle are not critical and items with higher criticality have a longer life cycle.<br />
Inspections and/or privative maintenance are schedule for more critical assets (i.e., roofs, wall sealants, stair treads, garage doors). Items with low<br />
criticality are typically retained beyond their useful life, so long as no hazard is created (i.e., carpeting).<br />
Page ‐ 93
<strong>Capital</strong> <strong>Asset</strong> <strong>Management</strong> & <strong>Investment</strong> Program Facilities – Customer and Operations Facilities <strong>Management</strong><br />
Facilities <strong>Management</strong> ‐ Electrical Equipment & Systems<br />
This asset category includes:<br />
Lighting Standard Electrical System Building Emergency Generators<br />
Solar Cell Systems<br />
Uninterruptable Power Supply (UPS)<br />
Life cycle length varies from 2 – 30 years depending on the asset. Shortest life cycle items (i.e., light bulbs) have scheduled replacement campaigns.<br />
Most critical components are UPS and generators, which are on routine maintenance schedules and include servicing contracts with knowledgeable<br />
firms. <strong>TriMet</strong>’s Information Technology division owns and maintains the UPS.<br />
Replacement is scheduled based on useful life and maintenance history. Of our main sites, only Elmonica is without a generator, <strong>TriMet</strong>’s current<br />
Continuity of Service planning will evaluate emergency power supply needs and may lead to possible resizing of backup power needs in upcoming<br />
years.<br />
Facilities <strong>Management</strong> ‐ HVAC Equipment & Systems<br />
This asset category includes:<br />
Boilers Condensers Exhaust Fans<br />
Roof Top Units (RTU) Radiant Heaters HVAC Control Systems<br />
Fan Building Louvers HVAC Unit Filters Server Room Cooling (Lieberts)<br />
Life cycle length varies from months up to 20 years depending on the asset. Shortest lifecycle items (filters) have scheduled replacements; all HVAC<br />
items have established inspection/maintenance frequencies provided by staff with access to contractors for significant repair issues.<br />
Replacement is based on maintenance history and useful life.<br />
Facilities <strong>Management</strong> ‐ Lifting Equipment & Systems<br />
This asset category includes:<br />
Elevators & Material Lifts Vehicles Hoists Fixed Cranes<br />
Portable Manlifts<br />
Of facility asset categories, this category has the greatest proportion of higher criticality assets. Elevators in particular may be in locations where<br />
they are the only option for ADA access and have no redundancy. In order to meet licensing requirements, elevator inspections, repair and<br />
maintenance monitoring is handled through contracts with experienced elevator firms. Cranes also have State required crane inspections through a<br />
certified inspection firm. All assets in this category undergo periodic inspections and maintenance.<br />
<strong>TriMet</strong> is carrying out useful life assessments on elevators in order to begin programming replacements (elevator life is typically 30 years or less, our<br />
oldest elevators are about 35 years).<br />
Page ‐ 94
<strong>Capital</strong> <strong>Asset</strong> <strong>Management</strong> & <strong>Investment</strong> Program Facilities – Customer and Operations Facilities <strong>Management</strong><br />
Facilities <strong>Management</strong> ‐ Plumbing Systems<br />
This asset category includes:<br />
Water Heaters Drinking Fountains Plumbing Fixtures<br />
Storm Drains Irrigation Systems Icemakers<br />
Fire Hydrants Piping<br />
Lifecycle length varies from 5‐30+ years depending on the asset. Many items in this category have scheduled maintenance; lower risk and low access<br />
systems (underground drain lines) are addressed as needed.<br />
Facilities <strong>Management</strong> ‐ Safety/Hazmat Systems<br />
This asset category includes:<br />
Fire Alarm Systems Fire Suppression Systems Fixed Fall Arrest/Restraint Systems<br />
Gas Sensors/Detectors Exit Lighting Roof Smoke Vents<br />
Safety/Guide Railings<br />
Aerosol Can Disposal Unit<br />
This asset category includes all fixed safety systems. These are typically OSHA or federal/local code requirements. These assets often play a critical<br />
function for safety. Lifecycle length varies from 5 – 30 or more years depending on the asset. Most items in this category have scheduled<br />
inspections/maintenance.<br />
Update/improvement requirements are typically required only when a facility is updated, however, modern safety improvements may warrant<br />
installation regardless of code requirements.<br />
Facilities <strong>Management</strong> ‐ Site/Property Improvements<br />
This asset category includes:<br />
Rail Platforms Pavement & Sidewalks Landscaping<br />
Bus Stops Transit Centers Secondary Buildings<br />
Signs & Shelters Fencing & Gates Pavement Markings<br />
This is the largest facilities asset category, covering a large number of sites throughout our service area. For example, we maintain over 7,000 bus<br />
stops and 100 rail platforms. Asphalt pavement owned by <strong>TriMet</strong> exceeds three million square feet. Lifecycles vary from a few to 30+ years, some<br />
items (such as pavements) are largely dependent on construction quality and consistent periodic maintenance practices in order to reach the<br />
planned lifecycle length.<br />
Page ‐ 95
<strong>Capital</strong> <strong>Asset</strong> <strong>Management</strong> & <strong>Investment</strong> Program Facilities – Customer and Operations Facilities <strong>Management</strong><br />
Facilities <strong>Management</strong> ‐ Other Systems & Equipment<br />
This asset category includes:<br />
Brake Lathes Dynamometers Bus Cleaning Vacuums (Cyclones)<br />
Snow Plow Milling Machines Wastewater Treatment System<br />
Bus Wash Racks Compressed Air Systems Pressure Washing Equipment<br />
For budget purposes this is a combination of smaller asset categories including; compressed air systems; cleaning equipment, metal fabrication and<br />
other fixed equipment needed for fleet maintenance and repair. Many items in this category may be owned by other departments with facilities<br />
providing maintenance directly or through specialty contracts. Lifecycles vary based on the specific asset and for equipment is typically most<br />
impacted by user handling. Compressed air systems power tools in all shops; Energy Trust evaluations are underway to identify systems<br />
modifications that could result in significant energy savings.<br />
Facilities <strong>Management</strong> – Summarized Categories<br />
FACILITIES <strong>FY</strong>14 <strong>FY</strong>15 <strong>FY</strong>16 <strong>FY</strong>17 <strong>FY</strong>18<br />
Total<br />
<strong>FY</strong>14‐<strong>FY</strong>18<br />
Building Area/Components $ 981,496 $ 1,119,105 $ 1,504,061 $ 863,710 $ 259,500 $ 4,727,872<br />
Electrical Equipment & Systems 45,000 30,000 260,000 45,000 ‐ 380,000<br />
HVAC Equipment & Systems 463,076 506,779 249,600 140,798 ‐ 1,360,253<br />
Lifting Equipment & Systems 472,000 247,000 473,640 278,509 27,000 1,498,149<br />
Plumbing System ‐ 45,000 95,000 ‐ ‐ 140,000<br />
Safety‐Hazmat Systems 6,193 ‐ 6,193 ‐ 6,193 18,579<br />
Site Property Systems 1,518,559 1,697,061 2,842,935 261,222 183,709 6,503,486<br />
Other Systems & Equipment 101,500 419,500 408,500 98,500 98,500 1,126,500<br />
Facilities Program <strong>Management</strong> Subtotal $ 3,587,824 $ 4,064,445 $ 5,839,929 $ 1,687,739 $ 574,902 $ 15,754,839<br />
A detailed breakdown of the categories may be found in the Appendix section of this document under Facilities <strong>Management</strong>.<br />
Page ‐ 96
<strong>Capital</strong> <strong>Asset</strong> <strong>Management</strong> & <strong>Investment</strong> Program Facilities – Customer and Operations Facilities <strong>Management</strong><br />
Facilities <strong>Management</strong> – Summarized Projects<br />
Facilities <strong>Management</strong> Projects Location Project mgr Bus/Rail Condition<br />
Useful life<br />
(typ) <strong>FY</strong>14 <strong>FY</strong>15 <strong>FY</strong>16 <strong>FY</strong>17 <strong>FY</strong>18<br />
Total<br />
<strong>FY</strong>14‐<strong>FY</strong>18<br />
IMPROVEMENT ‐ Bay Utility Relocations Bay M4E ELMONICA Papadopoulos R n/a n/a $ ‐ $ ‐ $ 32,706 $ ‐ $ ‐ $ 32,706<br />
IMPROVEMENT ‐ Build Permanent Operator/Others Restrooms VARIOUS locations Papadopoulos R ‐ 110,000 110,000 110,000 110,000 440,000<br />
IMPROVEMENT ‐ Pallet Rack Cover Exterior ELMONICA Papadopoulos R n/a 30 ‐ ‐ ‐ 28,710 ‐ 28,710<br />
IMPROVEMENT ‐ Railing Repainting Interior ‐ New Color ELMONICA Papadopoulos R n/a 10 ‐ 54,863 ‐ ‐ ‐ 54,863<br />
IMPROVEMENT ‐ REM Storage ELMONICA Papadopoulos R n/a 20 261,038 ‐ ‐ ‐ ‐ 261,038<br />
IMPROVEMENT ‐ Supervisor Office Relocation ELMONICA Papadopoulos R n/a 15 ‐ 29,375 101,533 ‐ ‐ 130,908<br />
IMPROVEMENT ‐ TEI & Master Plan ‐ new construction POWELL Papadopoulos B 3 50 60,000 129,851 477,822 ‐ ‐ 667,673<br />
INTERIOR ‐ Refurbish Admin/Operator Report Area MERLO ADMINISTRATION Papadopoulos B 3 15 ‐ 107,000 393,000 ‐ ‐ 500,000<br />
INTERIOR ‐ Refurbish Layover & Crew Rooms VARIOUS locations ‐ Rail layovers Papadopoulos R 3 15 40,000 52,000 52,000 52,000 52,000 248,000<br />
INTERIOR ‐ Refurbish OPS (admin, bullpen, restrooms) POWELL Papadopoulos B 3 15 96,258 350,016 ‐ ‐ ‐ 446,274<br />
HVAC ‐ Battery Room Ventilation ‐ Improve/Eval CENTER MAINT Papadopoulos B 2 n/a 44,625 125,449 ‐ ‐ ‐ 170,074<br />
HVAC ‐ Server Room Remodel ‐ Energy Trust Eligible RUBY NORTH Papadopoulos R n/a n/a 26,100 57,330 ‐ ‐ ‐ 83,430<br />
HVAC ‐ Welding Area Ventilation ELMONICA Papadopoulos R n/a 20 ‐ ‐ 27,600 100,798 ‐ 128,398<br />
HVAC DDC Replacement RUBY NORTH Papadopoulos R 3 25 119,351 ‐ ‐ ‐ ‐ 119,351<br />
HOISTS Unit 9 & 13 POWELL Papadopoulos B 3 30 ‐ ‐ ‐ 230,000 ‐ 230,000<br />
HOISTS Unit <strong>FY</strong>14 ‐ #27 & #28; <strong>FY</strong>17 ‐ #7 CENTER MAINT Papadopoulos B 3 30 421,000 ‐ ‐ ‐ ‐ 421,000<br />
HOISTS Unit <strong>FY</strong>15 ‐ #8; <strong>FY</strong>16 ‐ #9 & #10 MERLO MAINTENANCE Papadopoulos B 3 30 ‐ 220,000 446,640 ‐ ‐ 666,640<br />
IMPROVEMENT ‐ Jib Crane for Rebuild Area ELMONICA Papadopoulos R n/a n/a ‐ ‐ ‐ 21,509 ‐ 21,509<br />
DEMOLITION ‐ Blue Flame Building Powell Papadopoulos B 3 n/a 37,854 ‐ ‐ ‐ ‐ 37,854<br />
IMPROVEMENT ‐ Station Finishes & Landscaping PLATFORMS ‐ WASHINGTON PARK Papadopoulos R 3 30 654,032 ‐ 2,674,353 ‐ ‐ 3,328,385<br />
PLATFORM PAVERS ‐ Sunset T/C Replacement TRANSIT CENTER ‐ SUNSET Papadopoulos R 3 onetime 295,452 1,235,827 ‐ ‐ ‐ 1,531,279<br />
TRANSIT CENTER ‐ Hollywood Paving & Storm Drainage TRANSIT CENTER Hollywood/NE 42nd Papadopoulos B 3 27 ‐ 200,000 ‐ ‐ ‐ 200,000<br />
VAULT COVERS ‐ Downtown Vault Lid Replacements Various: Morrison & Yamhill Kindig/Papadopoulos R 3 n/a 310,200 ‐ ‐ ‐ ‐ 310,200<br />
Projects Subtotal $ 2,365,910 $ 2,671,711 $ 4,315,654 $ 543,017 $ 162,000 $ 10,058,292<br />
The projects included in the above Summarized Projects are also included in the Summarized Categories table on the previous page and are not in<br />
addition to the total cost. A detailed breakdown of each project listed above is included on the subsequent pages.<br />
Page ‐ 97
<strong>Capital</strong> <strong>Asset</strong> <strong>Management</strong> & <strong>Investment</strong> Program Facilities – Customer and Operations Facilities <strong>Management</strong><br />
Facilities <strong>Management</strong> ‐ Building Area/Component – Detailed Projects<br />
Project Name: Elmonica Bus Utilities Relocations Bay M4E Project ID: TBD<br />
Project Class: Facilities Priority: S<br />
Start Date: 7/1/2015 Completion Date: 6/30/2016 Project Type: Operating<br />
Budgeted Dept: Facilities <strong>Management</strong> Project Manager: Papadopoulos<br />
PROJECT DESCRIPTION<br />
Relocation of lighting and piping in Elmonica Maintenance Bay (M4E).<br />
PROJECT JUSTIFICATION<br />
M4E was built as part of an expansion project and was not constructed to the same specifications as the rest of the shop. Specifically, the lighting fixtures, electrical<br />
conduits and piping are mounted 4 ¼ inches lower than <strong>TriMet</strong>’s standard pit. This causes mechanics to have to duck lower to maneuver under the rail support<br />
structure to work in the under car area in between the rails. This is not only inconvenient and uncomfortable, but has caused several injuries to mechanics.<br />
Relocating the lighting and piping would eliminate these concerns.<br />
STATUS<br />
N/A<br />
Expenditure Plan <strong>FY</strong><strong>2014</strong> <strong>FY</strong>2015 <strong>FY</strong>2016 <strong>FY</strong>2017 <strong>FY</strong>2018 Total 5‐Year Cost<br />
Current Year $ ‐ $ ‐ $ 32,706 $ ‐ $ ‐ $ 32,706<br />
$ ‐ $ ‐ $ 32,706 $ ‐ $ ‐ $ 32,706<br />
Revenue Plan <strong>FY</strong><strong>2014</strong> <strong>FY</strong>2015 <strong>FY</strong>2016 <strong>FY</strong>2017 <strong>FY</strong>2018 Total 5‐Year Cost<br />
Federal Share $ ‐ $ ‐ $ ‐ $ ‐ $ ‐ $<br />
‐<br />
<strong>TriMet</strong> Share $ ‐ $ ‐ $ 32,706 $ ‐ $ ‐ $ 32,706<br />
Other Source $ ‐ $ ‐ $ ‐ $ ‐ $ ‐ $<br />
‐<br />
TBD $ ‐ $ ‐ $ ‐ $ ‐ $ ‐ $<br />
‐<br />
$ ‐ $ ‐ $ 32,706 $ ‐ $ ‐ $ 32,706<br />
Page ‐ 98
<strong>Capital</strong> <strong>Asset</strong> <strong>Management</strong> & <strong>Investment</strong> Program Facilities – Customer and Operations Facilities <strong>Management</strong><br />
Facilities <strong>Management</strong> ‐ Building Area/Component – Detailed Projects (continued)<br />
Project Name: Build Permanent Operator/Others Restrooms Project ID: 5614<br />
Project Class: Facilities Priority: LSI<br />
Start Date: Ongoing Completion Date: Ongoing Project Type: <strong>Capital</strong><br />
Budgeted Dept: Facilities <strong>Management</strong> Project Manager: Scott, R.<br />
PROJECT DESCRIPTION<br />
<strong>FY</strong>14 will be used to identify and evaluate all potential locations, determine feasibility (for example, whether land is needed and can be obtained) and prioritize based<br />
on feasibility/cost. <strong>FY</strong>15 and on the plan will be to replace one event‐style Porta‐Potty unit with a walk‐in restroom each year.<br />
PROJECT JUSTIFICATION<br />
Scattered throughout Trimet’s 575 square mile service area and 93 bus lines are 19 operator restrooms that are maintained as permanent <strong>TriMet</strong> assets for exclusive<br />
bus operator use. Most are strategically located at transit centers to serve multiple bus routes and many operators. These important assets are maintained by <strong>TriMet</strong><br />
to provide a safe, clean and secure area for operators and other <strong>TriMet</strong> field staff. At this time, not all locations have needed restrooms or have temporary Porta‐<br />
Potty facilities.<br />
STATUS<br />
N/A<br />
Expenditure Plan <strong>FY</strong><strong>2014</strong> <strong>FY</strong>2015 <strong>FY</strong>2016 <strong>FY</strong>2017 <strong>FY</strong>2018 Total 5‐Year Cost<br />
Current Year $ ‐ $ 110,000 $ 110,000 $ 110,000 $ 110,000 $ 440,000<br />
$ ‐ $ 110,000 $ 110,000 $ 110,000 $ 110,000 $ 440,000<br />
Revenue Plan <strong>FY</strong><strong>2014</strong> <strong>FY</strong>2015 <strong>FY</strong>2016 <strong>FY</strong>2017 <strong>FY</strong>2018 Total 5‐Year Cost<br />
Federal Share $ ‐ $ ‐ $ ‐ $ ‐ $ ‐ $<br />
‐<br />
<strong>TriMet</strong> Share $ ‐ $ 110,000 $ 110,000 $ 110,000 $ 110,000 $ 440,000<br />
Other Source $ ‐ $ ‐ $ ‐ $ ‐ $ ‐ $<br />
‐<br />
TBD $ ‐ $ ‐ $ ‐ $ ‐ $ ‐ $<br />
‐<br />
$ ‐ $ 110,000 $ 110,000 $ 110,000 $ 110,000 $ 440,000<br />
Page ‐ 99
<strong>Capital</strong> <strong>Asset</strong> <strong>Management</strong> & <strong>Investment</strong> Program Facilities – Customer and Operations Facilities <strong>Management</strong><br />
Facilities <strong>Management</strong> ‐ Building Area/Component – Detailed Projects (continued)<br />
Project Name: Elmonica Pallet Rack Cover Exterior Project ID: TBD<br />
Project Class: Facilities Priority: SR<br />
Start Date: 7/1/2016 Completion Date: 6/30/2017 Project Type: <strong>Capital</strong><br />
Budgeted Dept: Facilities <strong>Management</strong> Project Manager: Papadopoulos<br />
PROJECT DESCRIPTION<br />
Project will only be needed if Elmonica Storage Project occurs.<br />
Installation/construction of awnings over pallet racks at Elmonica location.<br />
PROJECT JUSTIFICATION<br />
Due to space restriction at the Elmonica shop it has become necessary to start storing larger LRV components outside of the shop. In order to protect these<br />
components from the elements, awnings need to be constructed over the pallet racks.<br />
STATUS<br />
N/A<br />
Expenditure Plan <strong>FY</strong><strong>2014</strong> <strong>FY</strong>2015 <strong>FY</strong>2016 <strong>FY</strong>2017 <strong>FY</strong>2018 Total 5‐Year Cost<br />
Current Year $ ‐ $ ‐ $ ‐ $ 28,710 $ ‐ $ 28,710<br />
$ ‐ $ ‐ $ ‐ $ 28,710 $ ‐ $ 28,710<br />
Revenue Plan <strong>FY</strong><strong>2014</strong> <strong>FY</strong>2015 <strong>FY</strong>2016 <strong>FY</strong>2017 <strong>FY</strong>2018 Total 5‐Year Cost<br />
Federal Share $ ‐ $ ‐ $ ‐ $ ‐ $ ‐ $<br />
‐<br />
<strong>TriMet</strong> Share $ ‐ $ ‐ $ ‐ $ 28,710 $ ‐ $ 28,710<br />
Other Source $ ‐ $ ‐ $ ‐ $ ‐ $ ‐ $<br />
‐<br />
TBD $ ‐ $ ‐ $ ‐ $ ‐ $ ‐ $<br />
‐<br />
$ ‐ $ ‐ $ ‐ $ 28,710 $ ‐ $ 28,710<br />
Page ‐ 100
<strong>Capital</strong> <strong>Asset</strong> <strong>Management</strong> & <strong>Investment</strong> Program Facilities – Customer and Operations Facilities <strong>Management</strong><br />
Facilities <strong>Management</strong> ‐ Building Area/Component – Detailed Projects (continued)<br />
Project Name: Elmonica Railing Repainting Interior – New Color Project ID: TBD<br />
Project Class: Facilities Priority: S<br />
Start Date: 7/1/<strong>2014</strong> Completion Date: 6/30/2015 Project Type: Operating<br />
Budgeted Dept: Facilities <strong>Management</strong> Project Manager: Papadopoulos<br />
PROJECT DESCRIPTION<br />
Repainting of Elmonica shop safety rails.<br />
PROJECT JUSTIFICATION<br />
Elmonica’s shop safety rails are painted red and this makes it difficult to locate a fire extinguisher, high voltage emergency shut off, alarm pull, and/or shop power<br />
shutoff, because they are all painted red as well. Changing the color of the railing to either blue or green would make it much easier to find this equipment/shut offs<br />
during an emergency.<br />
STATUS<br />
N/A<br />
Expenditure Plan <strong>FY</strong><strong>2014</strong> <strong>FY</strong>2015 <strong>FY</strong>2016 <strong>FY</strong>2017 <strong>FY</strong>2018 Total 5‐Year Cost<br />
Current Year $ ‐ $ 54,863 $ ‐ $ ‐ $ ‐ $ 54,863<br />
$ ‐ $ 54,863 $ ‐ $ ‐ $ ‐ $ 54,863<br />
Revenue Plan <strong>FY</strong><strong>2014</strong> <strong>FY</strong>2015 <strong>FY</strong>2016 <strong>FY</strong>2017 <strong>FY</strong>2018 Total 5‐Year Cost<br />
Federal Share $ ‐ $ ‐ $ ‐ $ ‐ $ ‐ $<br />
‐<br />
<strong>TriMet</strong> Share $ ‐ $ 54,863 $ ‐ $ ‐ $ ‐ $ 54,863<br />
Other Source $ ‐ $ ‐ $ ‐ $ ‐ $ ‐ $<br />
‐<br />
TBD $ ‐ $ ‐ $ ‐ $ ‐ $ ‐ $<br />
‐<br />
$ ‐ $ 54,863 $ ‐ $ ‐ $ ‐ $ 54,863<br />
Page ‐ 101
<strong>Capital</strong> <strong>Asset</strong> <strong>Management</strong> & <strong>Investment</strong> Program Facilities – Customer and Operations Facilities <strong>Management</strong><br />
Facilities <strong>Management</strong> ‐ Building Area/Component – Detailed Projects (continued)<br />
Project Name: Elmonica REM Storage Building Project ID: 4594<br />
Project Class: Facilities Priority: LSI<br />
Start Date: 7/1/2013 Completion Date: 6/30/<strong>2014</strong> Project Type: <strong>Capital</strong><br />
Budgeted Dept: Facilities <strong>Management</strong> Project Manager: Papadopoulos<br />
PROJECT DESCRIPTION<br />
Design and construction of storage building for Elmonica REM.<br />
PROJECT JUSTIFICATION<br />
Elmonica is the designated HVAC and pantograph overhaul shop and currently stores nine spare HVAC units and fifteen spare pantographs. They are currently stored<br />
on the second floor in the shop rebuild area and second floor storeroom. This building would allow the storage of these units outside of the shop and free up<br />
valuable shop floor space that could be used to expand rebuild capabilities as well as provide storage for Type 5 vehicle parts.<br />
STATUS<br />
N/A<br />
Expenditure Plan <strong>FY</strong><strong>2014</strong> <strong>FY</strong>2015 <strong>FY</strong>2016 <strong>FY</strong>2017 <strong>FY</strong>2018 Total 5‐Year Cost<br />
Current Year $ 261,038 $ ‐ $ ‐ $ ‐ $ ‐ $ 261,038<br />
$ 261,038 $ ‐ $ ‐ $ ‐ $ ‐ $ 261,038<br />
Revenue Plan <strong>FY</strong><strong>2014</strong> <strong>FY</strong>2015 <strong>FY</strong>2016 <strong>FY</strong>2017 <strong>FY</strong>2018 Total 5‐Year Cost<br />
Federal Share $ ‐ $ ‐ $ ‐ $ ‐ $ ‐ $<br />
‐<br />
<strong>TriMet</strong> Share $ 261,038 $ ‐ $ ‐ $ ‐ $ ‐ $ 261,038<br />
Other Source $ ‐ $ ‐ $ ‐ $ ‐ $ ‐ $<br />
‐<br />
TBD $ ‐ $ ‐ $ ‐ $ ‐ $ ‐ $<br />
‐<br />
$ 261,038 $ ‐ $ ‐ $ ‐ $ ‐ $ 261,038<br />
Page ‐ 102
<strong>Capital</strong> <strong>Asset</strong> <strong>Management</strong> & <strong>Investment</strong> Program Facilities – Customer and Operations Facilities <strong>Management</strong><br />
Facilities <strong>Management</strong> ‐ Building Area/Component – Detailed Projects (continued)<br />
Project Name: Elmonica Supervisor Office Relocation Project ID: TBD<br />
Project Class: Facilities Priority: LSI<br />
Start Date: 7/1/<strong>2014</strong> Completion Date: 6/30/2016 Project Type: <strong>Capital</strong><br />
Budgeted Dept: Facilities <strong>Management</strong> Project Manager: Papadopoulos<br />
PROJECT DESCRIPTION<br />
Design and construction of new supervisor office at Elmonica location.<br />
PROJECT JUSTIFICATION<br />
The REM supervisor’s office is currently on the second floor. Having the office on the second floor creates a situation where it is more difficult for mechanics to<br />
communicate with their supervisor, and for supervisors to properly oversee the work of their subordinates. Moving the office to either of the proposed areas would<br />
alleviate most, if not all, of these concerns.<br />
STATUS<br />
N/A<br />
Expenditure Plan <strong>FY</strong><strong>2014</strong> <strong>FY</strong>2015 <strong>FY</strong>2016 <strong>FY</strong>2017 <strong>FY</strong>2018 Total 5‐Year Cost<br />
Current Year $ ‐ $ 29,375 $ 101,533 $ ‐ $ ‐ $ 130,908<br />
$ ‐ $ 29,375 $ 101,533 $ ‐ $ ‐ $ 130,908<br />
Revenue Plan <strong>FY</strong><strong>2014</strong> <strong>FY</strong>2015 <strong>FY</strong>2016 <strong>FY</strong>2017 <strong>FY</strong>2018 Total 5‐Year Cost<br />
Federal Share $ ‐ $ ‐ $ ‐ $ ‐ $ ‐ $<br />
‐<br />
<strong>TriMet</strong> Share $ ‐ $ 29,375 $ 101,533 $ ‐ $ ‐ $ 130,908<br />
Other Source $ ‐ $ ‐ $ ‐ $ ‐ $ ‐ $<br />
‐<br />
TBD $ ‐ $ ‐ $ ‐ $ ‐ $ ‐ $<br />
‐<br />
$ ‐ $ 29,375 $ 101,533 $ ‐ $ ‐ $ 130,908<br />
Page ‐ 103
<strong>Capital</strong> <strong>Asset</strong> <strong>Management</strong> & <strong>Investment</strong> Program Facilities – Customer and Operations Facilities <strong>Management</strong><br />
Facilities <strong>Management</strong> ‐ Building Area/Component – Detailed Projects (continued)<br />
Project Name: Powell ‐ TEI & Master Plan Update – New Construction Project ID: TBD<br />
Project Class: Facilities Priority: LSI<br />
Start Date: 7/1/2013 Completion Date: 6/30/2016 Project Type: <strong>Capital</strong><br />
Budgeted Dept: Facilities <strong>Management</strong> Project Manager: Papadopoulos<br />
PROJECT DESCRIPTION<br />
Update master plan, design and construct TEI facility and operator showers.<br />
PROJECT JUSTIFICATION<br />
Powell TEI is housed in a trailer. The trailer has exceeded its useful life and experiencing worsening maintenance issues related to trailer construction. In addition,<br />
showers at Powell require walking through maintenance work areas, therefore, inaccessible for operators. A permanent building housing TEI and showers is<br />
proposed. Finding a site for a new facility need to be addressed as do other needs at Powell. The first year of this project is a master plan update process.<br />
STATUS<br />
N/A<br />
Expenditure Plan <strong>FY</strong><strong>2014</strong> <strong>FY</strong>2015 <strong>FY</strong>2016 <strong>FY</strong>2017 <strong>FY</strong>2018 Total 5‐Year Cost<br />
Current Year $ 60,000 $ 129,851 $ 477,822 $ ‐ $ ‐ $ 667,673<br />
$ 60,000 $ 129,851 $ 477,822 $ ‐ $ ‐ $ 667,673<br />
Revenue Plan <strong>FY</strong><strong>2014</strong> <strong>FY</strong>2015 <strong>FY</strong>2016 <strong>FY</strong>2017 <strong>FY</strong>2018 Total 5‐Year Cost<br />
Federal Share $ ‐ $ ‐ $ ‐ $ ‐ $ ‐ $<br />
‐<br />
<strong>TriMet</strong> Share $ 60,000 $ 129,851 $ 477,822 $ ‐ $ ‐ $ 667,673<br />
Other Source $ ‐ $ ‐ $ ‐ $ ‐ $ ‐ $<br />
‐<br />
TBD $ ‐ $ ‐ $ ‐ $ ‐ $ ‐ $<br />
‐<br />
$ 60,000 $ 129,851 $ 477,822 $ ‐ $ ‐ $ 667,673<br />
Page ‐ 104
<strong>Capital</strong> <strong>Asset</strong> <strong>Management</strong> & <strong>Investment</strong> Program Facilities – Customer and Operations Facilities <strong>Management</strong><br />
Facilities <strong>Management</strong> ‐ Building Area/Component – Detailed Projects (continued)<br />
Project Name: Merlo ‐ Refurbish Admin/Operator Report Area Project ID: TBD<br />
Project Class: Facilities Priority: SR, RoD<br />
Start Date: 7/1/2013 Completion Date: 6/30/<strong>2014</strong> Project Type: Operating<br />
Budgeted Dept: Facilities <strong>Management</strong> Project Manager: Papadopoulos<br />
PROJECT DESCRIPTION<br />
Refurbish interior at Merlo facility.<br />
PROJECT JUSTIFICATION<br />
The Merlo Operations Building was constructed in 1979. The offices, bathrooms and operator report area are in need of upgrades and new finishes. Design and<br />
construction would follow comparable upgrades at Center and Powell where a new concept for the operator report area will be established.<br />
STATUS<br />
N/A<br />
Expenditure Plan <strong>FY</strong><strong>2014</strong> <strong>FY</strong>2015 <strong>FY</strong>2016 <strong>FY</strong>2017 <strong>FY</strong>2018 Total 5‐Year Cost<br />
Current Year $ ‐ $ 107,000 $ 393,000 $ ‐ $ ‐ $ 500,000<br />
$ ‐ $ 107,000 $ 393,000 $ ‐ $ ‐ $ 500,000<br />
Revenue Plan <strong>FY</strong><strong>2014</strong> <strong>FY</strong>2015 <strong>FY</strong>2016 <strong>FY</strong>2017 <strong>FY</strong>2018 Total 5‐Year Cost<br />
Federal Share $ ‐ $ ‐ $ ‐ $ ‐ $ ‐ $<br />
‐<br />
<strong>TriMet</strong> Share $ ‐ $ 107,000 $ 393,000 $ ‐ $ ‐ $ 500,000<br />
Other Source $ ‐ $ ‐ $ ‐ $ ‐ $ ‐ $<br />
‐<br />
TBD $ ‐ $ ‐ $ ‐ $ ‐ $ ‐ $<br />
‐<br />
$ ‐ $ 107,000 $ 393,000 $ ‐ $ ‐ $ 500,000<br />
Page ‐ 105
<strong>Capital</strong> <strong>Asset</strong> <strong>Management</strong> & <strong>Investment</strong> Program Facilities – Customer and Operations Facilities <strong>Management</strong><br />
Facilities <strong>Management</strong> ‐ Building Area/Component – Detailed Projects (continued)<br />
Project Name: Refurbish Layover and Crew Rooms Project ID: TBD<br />
Project Class: Facilities Priority: LSI<br />
Start Date: Ongoing Completion Date: Ongoing Project Type: Operating<br />
Budgeted Dept: Facilities <strong>Management</strong> Project Manager: Papadopoulos<br />
PROJECT DESCRIPTION<br />
Refurbishing of Bus & Rail Operator Layover facilities.<br />
PROJECT JUSTIFICATION<br />
<strong>TriMet</strong> has 24 Bus & Rail Operator Layover facilities, which typically includes a small break room plus bathrooms. These facilities sustain a high level of wear and need<br />
periodic refurbishing every 7‐10 years to restore surfaces and provide minor needed upgrades. Sunset and Gresham Central layovers were completed in 2013; an<br />
ongoing program will require refurbishing of 2‐3 layovers every year. <strong>FY</strong>14 funding is targeted for an evaluation of layovers with recommendations and prioritization.<br />
STATUS<br />
N/A<br />
Expenditure Plan <strong>FY</strong><strong>2014</strong> <strong>FY</strong>2015 <strong>FY</strong>2016 <strong>FY</strong>2017 <strong>FY</strong>2018 Total 5‐Year Cost<br />
Current Year $ 40,000 $ 52,000 $ 52,000 $ 52,000 $ 52,000 $ 248,000<br />
$ 40,000 $ 52,000 $ 52,000 $ 52,000 $ 52,000 $ 248,000<br />
Revenue Plan <strong>FY</strong><strong>2014</strong> <strong>FY</strong>2015 <strong>FY</strong>2016 <strong>FY</strong>2017 <strong>FY</strong>2018 Total 5‐Year Cost<br />
Federal Share $ ‐ $ ‐ $ ‐ $ ‐ $ ‐ $<br />
‐<br />
<strong>TriMet</strong> Share $ 40,000 $ 52,000 $ 52,000 $ 52,000 $ 52,000 $ 248,000<br />
Other Source $ ‐ $ ‐ $ ‐ $ ‐ $ ‐ $<br />
‐<br />
TBD $ ‐ $ ‐ $ ‐ $ ‐ $ ‐ $<br />
‐<br />
$ 40,000 $ 52,000 $ 52,000 $ 52,000 $ 52,000 $ 248,000<br />
Page ‐ 106
<strong>Capital</strong> <strong>Asset</strong> <strong>Management</strong> & <strong>Investment</strong> Program Facilities – Customer and Operations Facilities <strong>Management</strong><br />
Facilities <strong>Management</strong> ‐ Building Area/Component – Detailed Projects (continued)<br />
Project Name: Powell ‐ Refurbish OPS (admin, bullpen, restrooms) Project ID: 4574<br />
Project Class: Facilities Priority: LSI<br />
Start Date: 7/1/2013 Completion Date: 6/30/<strong>2014</strong> Project Type: <strong>Capital</strong><br />
Budgeted Dept: Facilities <strong>Management</strong> Project Manager: Papadopoulos<br />
PROJECT DESCRIPTION<br />
Upgrade/refurbish offices, bathrooms and operator report area in addition to enlarging the meeting room at Powell Street.<br />
PROJECT JUSTIFICATION<br />
Powell is the oldest bus facility. The offices, bathrooms and operator report area are in need of upgrades and new finishes. In addition, the existing single meeting<br />
room is insufficient and needs to be enlarged by relocating the north wall. Design in <strong>FY</strong><strong>2014</strong> would be paired with Center operator report area design work to allow<br />
rollout of new concepts at Powell.<br />
STATUS<br />
N/A<br />
Expenditure Plan <strong>FY</strong><strong>2014</strong> <strong>FY</strong>2015 <strong>FY</strong>2016 <strong>FY</strong>2017 <strong>FY</strong>2018 Total 5‐Year Cost<br />
Current Year $ 96,258 $ 350,016 $ ‐ $ ‐ $ ‐ $ 446,274<br />
$ 96,258 $ 350,016 $ ‐ $ ‐ $ ‐ $ 446,274<br />
Revenue Plan <strong>FY</strong><strong>2014</strong> <strong>FY</strong>2015 <strong>FY</strong>2016 <strong>FY</strong>2017 <strong>FY</strong>2018 Total 5‐Year Cost<br />
Federal Share $ ‐ $ ‐ $ ‐ $ ‐ $ ‐ $<br />
‐<br />
<strong>TriMet</strong> Share $ 96,258 $ 350,016 $ ‐ $ ‐ $ ‐ $ 446,274<br />
Other Source $ ‐ $ ‐ $ ‐ $ ‐ $ ‐ $<br />
‐<br />
TBD $ ‐ $ ‐ $ ‐ $ ‐ $ ‐ $<br />
‐<br />
$ 96,258 $ 350,016 $ ‐ $ ‐ $ ‐ $ 446,274<br />
Page ‐ 107
<strong>Capital</strong> <strong>Asset</strong> <strong>Management</strong> & <strong>Investment</strong> Program Facilities – Customer and Operations Facilities <strong>Management</strong><br />
Facilities <strong>Management</strong> ‐ HVAC Equipment & Systems – Detailed Projects<br />
Project Name: Center Maintenance Battery Room Ventilation – Improve/Eval Project ID: TBD<br />
Project Class: Facilities Priority: S<br />
Start Date: 7/1/2013 Completion Date: 6/30/2015 Project Type: <strong>Capital</strong><br />
Budgeted Dept: Facilities <strong>Management</strong> Project Manager: Papadopoulos<br />
PROJECT DESCRIPTION<br />
Evaluate Center Street Maintenance Building Battery Charging Room and adjacent machine/gear rebuild work area, then design and construct HVAC modifications.<br />
PROJECT JUSTIFICATION<br />
The ventilation system of the Center Street maintenance building battery charging room may not be adequate to vent gases produced by stored batteries and those<br />
being charged. Also, there is no ventilation at the adjacent machine/gear rebuild work area for removing air born cleaning solvents being blown from parts as they<br />
are cleaned.<br />
STATUS<br />
N/A<br />
Expenditure Plan <strong>FY</strong><strong>2014</strong> <strong>FY</strong>2015 <strong>FY</strong>2016 <strong>FY</strong>2017 <strong>FY</strong>2018 Total 5‐Year Cost<br />
Current Year $ 44,625 $ 125,449 $ ‐ $ ‐ $ ‐ $ 170,074<br />
$ 44,625 $ 125,449 $ ‐ $ ‐ $ ‐ $ 170,074<br />
Revenue Plan <strong>FY</strong><strong>2014</strong> <strong>FY</strong>2015 <strong>FY</strong>2016 <strong>FY</strong>2017 <strong>FY</strong>2018 Total 5‐Year Cost<br />
Federal Share $ ‐ $ ‐ $ ‐ $ ‐ $ ‐ $<br />
‐<br />
<strong>TriMet</strong> Share $ 44,625 $ 125,449 $ ‐ $ ‐ $ ‐ $ 170,074<br />
Other Source $ ‐ $ ‐ $ ‐ $ ‐ $ ‐ $<br />
‐<br />
TBD $ ‐ $ ‐ $ ‐ $ ‐ $ ‐ $<br />
‐<br />
$ 44,625 $ 125,449 $ ‐ $ ‐ $ ‐ $ 170,074<br />
Page ‐ 108
<strong>Capital</strong> <strong>Asset</strong> <strong>Management</strong> & <strong>Investment</strong> Program Facilities – Customer and Operations Facilities <strong>Management</strong><br />
Facilities <strong>Management</strong> ‐ HVAC Equipment & Systems – Detailed Projects (continued)<br />
Project Name: Ruby North ‐ Server Room Remodel – Energy Trust Eligible Project ID: 4577<br />
Project Class: Facilities Priority: SR, RoD<br />
Start Date: 7/1/2013 Completion Date: 6/30/2015 Project Type: Operating<br />
Budgeted Dept: Facilities <strong>Management</strong> Project Manager: Papadopoulos<br />
PROJECT DESCRIPTION<br />
Reconfigure and upgrade room system for servers at Ruby North.<br />
PROJECT JUSTIFICATION<br />
The original server room in Ruby North has not been upgraded resulting in locating servers in three separate rooms. Reconfiguring and upgrading the room systems<br />
will create efficiencies through installation of more modern equipment and reduction of duplicate equipment needed to service multiple rooms. HVAC and other<br />
work resulting in energy savings are potentially eligible for Energy Trust rebates. IT is proposing additional work in support of this project.<br />
STATUS<br />
N/A<br />
Expenditure Plan <strong>FY</strong><strong>2014</strong> <strong>FY</strong>2015 <strong>FY</strong>2016 <strong>FY</strong>2017 <strong>FY</strong>2018 Total 5‐Year Cost<br />
Current Year $ 26,100 $ 57,330 $ ‐ $ ‐ $ ‐ $ 83,430<br />
$ 26,100 $ 57,330 $ ‐ $ ‐ $ ‐ $ 83,430<br />
Revenue Plan <strong>FY</strong><strong>2014</strong> <strong>FY</strong>2015 <strong>FY</strong>2016 <strong>FY</strong>2017 <strong>FY</strong>2018 Total 5‐Year Cost<br />
Federal Share $ ‐ $ ‐ $ ‐ $ ‐ $ ‐ $<br />
‐<br />
<strong>TriMet</strong> Share $ 26,100 $ 57,330 $ ‐ $ ‐ $ ‐ $ 83,430<br />
Other Source $ ‐ $ ‐ $ ‐ $ ‐ $ ‐ $<br />
‐<br />
TBD $ ‐ $ ‐ $ ‐ $ ‐ $ ‐ $<br />
‐<br />
$ 26,100 $ 57,330 $ ‐ $ ‐ $ ‐ $ 83,430<br />
Page ‐ 109
<strong>Capital</strong> <strong>Asset</strong> <strong>Management</strong> & <strong>Investment</strong> Program Facilities – Customer and Operations Facilities <strong>Management</strong><br />
Facilities <strong>Management</strong> ‐ HVAC Equipment & Systems – Detailed Projects (continued)<br />
Project Name: Elmonica Welding Area Ventilation Project ID: TBD<br />
Project Class: Facilities Priority: S<br />
Start Date: 7/1/2015 Completion Date: 6/30/2017 Project Type: <strong>Capital</strong><br />
Budgeted Dept: Facilities <strong>Management</strong> Project Manager: Papadopoulos<br />
PROJECT DESCRIPTION<br />
Installation of ventilation hoods at Elmonica welding area.<br />
PROJECT JUSTIFICATION<br />
Elmonica’s rebuild and fabrication area does not have a ventilation system for the removal of the fumes and smoke that are generated during welding and cutting. To<br />
address this, a ventilation hood needs to be installed to exhaust the smoke and fumes to the outside of the shop.<br />
STATUS<br />
N/A<br />
Expenditure Plan <strong>FY</strong><strong>2014</strong> <strong>FY</strong>2015 <strong>FY</strong>2016 <strong>FY</strong>2017 <strong>FY</strong>2018 Total 5‐Year Cost<br />
Current Year $ ‐ $ ‐ $ 27,600 $ 100,798 $ ‐ $ 128,398<br />
$ ‐ $ ‐ $ 27,600 $ 100,798 $ ‐ $ 128,398<br />
Revenue Plan <strong>FY</strong><strong>2014</strong> <strong>FY</strong>2015 <strong>FY</strong>2016 <strong>FY</strong>2017 <strong>FY</strong>2018 Total 5‐Year Cost<br />
Federal Share $ ‐ $ ‐ $ ‐ $ ‐ $ ‐ $<br />
‐<br />
<strong>TriMet</strong> Share $ ‐ $ ‐ $ 27,600 $ 100,798 $ ‐ $ 128,398<br />
Other Source $ ‐ $ ‐ $ ‐ $ ‐ $ ‐ $<br />
‐<br />
TBD $ ‐ $ ‐ $ ‐ $ ‐ $ ‐ $<br />
‐<br />
$ ‐ $ ‐ $ 27,600 $ 100,798 $ ‐ $ 128,398<br />
Page ‐ 110
<strong>Capital</strong> <strong>Asset</strong> <strong>Management</strong> & <strong>Investment</strong> Program Facilities – Customer and Operations Facilities <strong>Management</strong><br />
Facilities <strong>Management</strong> ‐ HVAC Equipment & Systems – Detailed Projects (continued)<br />
Project Name: Ruby North ‐ Direct Digital Control (DDC) Replacement Project ID: 4577<br />
Project Class: Facilities Priority: SR, RoD<br />
Start Date: 7/1/2013 Completion Date: 6/30/<strong>2014</strong> Project Type: <strong>Capital</strong><br />
Budgeted Dept: Facilities <strong>Management</strong> Project Manager: Papadopoulos<br />
PROJECT DESCRIPTION<br />
Replacement of the Ruby North HVAC DDC.<br />
PROJECT JUSTIFICATION<br />
The control system for Ruby north HVAC is run through a series of sensors in rooms and on equipment and managed through a computer interface only. At the time<br />
of construction DDC communication from sensors was through plastic pneumatic tubing built into the walls. The tubing is becoming brittle and developing leaks, and<br />
because much of the system is inaccessible, a leak in the wrong place could render the system inoperable. (For example, the boiler is located in the 3 rd floor, the<br />
controller is in the basement. Failed tubing in‐between would render the boiler which provides heat, inoperable until a new line could be constructed.) Current<br />
technology would typically replace the tubing with an electrical wire system.<br />
STATUS<br />
N/A<br />
Expenditure Plan <strong>FY</strong><strong>2014</strong> <strong>FY</strong>2015 <strong>FY</strong>2016 <strong>FY</strong>2017 <strong>FY</strong>2018 Total 5‐Year Cost<br />
Current Year $ 119,351 $ ‐ $ ‐ $ ‐ $ ‐ $ 119,351<br />
$ 119,351 $ ‐ $ ‐ $ ‐ $ ‐ $ 119,351<br />
Revenue Plan <strong>FY</strong><strong>2014</strong> <strong>FY</strong>2015 <strong>FY</strong>2016 <strong>FY</strong>2017 <strong>FY</strong>2018 Total 5‐Year Cost<br />
Federal Share $ ‐ $ ‐ $ ‐ $ ‐ $ ‐ $<br />
‐<br />
<strong>TriMet</strong> Share $ 119,351 $ ‐ $ ‐ $ ‐ $ ‐ $ 119,351<br />
Other Source $ ‐ $ ‐ $ ‐ $ ‐ $ ‐ $<br />
‐<br />
TBD $ ‐ $ ‐ $ ‐ $ ‐ $ ‐ $<br />
‐<br />
$ 119,351 $ ‐ $ ‐ $ ‐ $ ‐ $ 119,351<br />
Page ‐ 111
<strong>Capital</strong> <strong>Asset</strong> <strong>Management</strong> & <strong>Investment</strong> Program Facilities – Customer and Operations Facilities <strong>Management</strong><br />
Facilities <strong>Management</strong> ‐ Lifting Equipment & Systems – Detailed Projects<br />
Project Name: Bus Hoist Replacements Project ID: TBD<br />
Project Class: Facilities Priority: S<br />
Start Date: 7/1/2012 Completion Date: 6/30/2017 Project Type: <strong>Capital</strong><br />
Budgeted Dept: Facilities <strong>Management</strong> Project Manager: Papadopoulos<br />
PROJECT DESCRIPTION<br />
This project continues replacement of bus hoists at Center, Merlo and Powell garages. To date, three hoists have been replaced at Center and two lifts are in progress<br />
at Powel. Six additional hoists replacements are included in this program:<br />
<strong>FY</strong>14 – Center Bays 27 & 28<br />
<strong>FY</strong> 15 – Merlo Bay 8<br />
<strong>FY</strong> 16 – Merlo Bays 9& 10<br />
<strong>FY</strong> 17 – Center Bay 7<br />
PROJECT JUSTIFICATION<br />
Hoists being replaced are equipment from original building construction and are past their useful life (30 years). Technological improvements include:<br />
Remote control ability allowing mechanic to more effectively position lift height.<br />
Hydraulic fluid reduced from 50 gallons to 7 gallons.<br />
No opportunity for hydraulic fluid leaks underground (a common issue with old‐style lifts).<br />
Scissor type design.<br />
STATUS<br />
N/A<br />
Expenditure Plan <strong>FY</strong><strong>2014</strong> <strong>FY</strong>2015 <strong>FY</strong>2016 <strong>FY</strong>2017 <strong>FY</strong>2018 Total 5‐Year Cost<br />
Current Year $ 421,000 $ 220,000 $ 446,640 $ 230,000 $ ‐ $ 1,317,640<br />
$ 421,000 $ 220,000 $ 446,640 $ 230,000 $ ‐ $ 1,317,640<br />
Revenue Plan <strong>FY</strong><strong>2014</strong> <strong>FY</strong>2015 <strong>FY</strong>2016 <strong>FY</strong>2017 <strong>FY</strong>2018 Total 5‐Year Cost<br />
Federal Share $ ‐ $ ‐ $ ‐ $ ‐ $ ‐ $<br />
‐<br />
<strong>TriMet</strong> Share $ 421,000 $ 220,000 $ 446,640 $ 230,000 $ ‐ $ 1,317,640<br />
Other Source $ ‐ $ ‐ $ ‐ $ ‐ $ ‐ $<br />
‐<br />
TBD $ ‐ $ ‐ $ ‐ $ ‐ $ ‐ $<br />
‐<br />
$ 421,000 $ 220,000 $ 446,640 $ 230,000 $ ‐ $ 1,317,640<br />
Page ‐ 112
<strong>Capital</strong> <strong>Asset</strong> <strong>Management</strong> & <strong>Investment</strong> Program Facilities – Customer and Operations Facilities <strong>Management</strong><br />
Facilities <strong>Management</strong> ‐ Lifting Equipment & Systems – Detailed Projects (continued)<br />
Project Name: Facilities – Elmonica REM Rebuild Area Jib Crane Project ID: TBD<br />
Project Class: Facilities Priority: SR, RoD<br />
Start Date: 7/1/2013 Completion Date: 6/30/<strong>2014</strong> Project Type: <strong>Capital</strong><br />
Budgeted Dept: Facilities <strong>Management</strong> Project Manager: Papadopoulos<br />
PROJECT DESCRIPTION<br />
Project will only be needed if Elmonica Storage Project occurs.<br />
Purchase of jib crane.<br />
PROJECT JUSTIFICATION<br />
A jib crane is needed to facilitate moving of bridgeplates and pantographs within the rebuild area.<br />
STATUS<br />
N/A<br />
Expenditure Plan <strong>FY</strong><strong>2014</strong> <strong>FY</strong>2015 <strong>FY</strong>2016 <strong>FY</strong>2017 <strong>FY</strong>2018 Total 5‐Year Cost<br />
Current Year $ ‐ $ ‐ $ ‐ $ 21,509 $ ‐ $ 21,509<br />
$ ‐ $ ‐ $ ‐ $ 21,509 $ ‐ $ 21,509<br />
Revenue Plan <strong>FY</strong><strong>2014</strong> <strong>FY</strong>2015 <strong>FY</strong>2016 <strong>FY</strong>2017 <strong>FY</strong>2018 Total 5‐Year Cost<br />
Federal Share $ ‐ $ ‐ $ ‐ $ ‐ $ ‐ $<br />
‐<br />
<strong>TriMet</strong> Share $ ‐ $ ‐ $ ‐ $ 21,509 $ ‐ $ 21,509<br />
Other Source $ ‐ $ ‐ $ ‐ $ ‐ $ ‐ $<br />
‐<br />
TBD $ ‐ $ ‐ $ ‐ $ ‐ $ ‐ $<br />
‐<br />
$ ‐ $ ‐ $ ‐ $ 21,509 $ ‐ $ 21,509<br />
Page ‐ 113
<strong>Capital</strong> <strong>Asset</strong> <strong>Management</strong> & <strong>Investment</strong> Program Facilities – Customer and Operations Facilities <strong>Management</strong><br />
Facilities <strong>Management</strong> ‐ Site/Property Improvements – Detailed Projects<br />
Project Name: Powell ‐ Blue Flame Bldg Demolition Project ID: TBD<br />
Project Class: Facilities Priority: LSI<br />
Start Date: Ongoing Completion Date: Ongoing Project Type: Operating<br />
Budgeted Dept: Facilities <strong>Management</strong> Project Manager: Papadopoulos<br />
PROJECT DESCRIPTION<br />
Demolition of Powell Blue Flame Building.<br />
PROJECT JUSTIFICATION<br />
On the northwest corner of the Powell yard is a separate piece of property with a building (Blue Flame) constructed by a prior owner. The building is in poor<br />
condition and has only limited value for storage. Past studies have determined the building is not worth saving. Powell has a current shortage of parking; removal of<br />
the building would allow more room for parking and will be a necessary step for Master Plan implementation.<br />
STATUS<br />
N/A<br />
Expenditure Plan <strong>FY</strong><strong>2014</strong> <strong>FY</strong>2015 <strong>FY</strong>2016 <strong>FY</strong>2017 <strong>FY</strong>2018 Total 5‐Year Cost<br />
Current Year $ 37,854 $ ‐ $ ‐ $ ‐ $ ‐ $ 37,854<br />
$ 37,854 $ ‐ $ ‐ $ ‐ $ ‐ $ 37,854<br />
Revenue Plan <strong>FY</strong><strong>2014</strong> <strong>FY</strong>2015 <strong>FY</strong>2016 <strong>FY</strong>2017 <strong>FY</strong>2018 Total 5‐Year Cost<br />
Federal Share $ ‐ $ ‐ $ ‐ $ ‐ $ ‐ $<br />
‐<br />
<strong>TriMet</strong> Share $ 37,854 $ ‐ $ ‐ $ ‐ $ ‐ $ 37,854<br />
Other Source $ ‐ $ ‐ $ ‐ $ ‐ $ ‐ $<br />
‐<br />
TBD $ ‐ $ ‐ $ ‐ $ ‐ $ ‐ $<br />
‐<br />
$ 37,854 $ ‐ $ ‐ $ ‐ $ ‐ $ 37,854<br />
Page ‐ 114
<strong>Capital</strong> <strong>Asset</strong> <strong>Management</strong> & <strong>Investment</strong> Program Facilities – Customer and Operations Facilities <strong>Management</strong><br />
Facilities <strong>Management</strong> ‐ Site/Property Improvements – Detailed Projects (continued)<br />
Project Name: Washington Park – Station Finishes & Landscaping Project ID: TBD<br />
Project Class: Facilities Priority: LSI<br />
Start Date: 7/1/2013 Completion Date: 6/30/2016 Project Type: <strong>Capital</strong><br />
Budgeted Dept: Facilities <strong>Management</strong> Project Manager: Batty<br />
PROJECT DESCRIPTION<br />
Replace and upgrade elevators/platforms at Washington Park.<br />
PROJECT JUSTIFICATION<br />
The elevators and platform areas at Washington park were constructed in 1997. Finishes have been durable but not designed for regular effective cleaning. In order<br />
to restore Washington Park as a flagship station, finishes need to be replaced and upgraded. This work will include a significant design process to work with internal<br />
and community stakeholders. Design and permitting is proposed for <strong>FY</strong>14 with construction delayed until after the PMLR opening.<br />
STATUS<br />
N/A<br />
Expenditure Plan <strong>FY</strong><strong>2014</strong> <strong>FY</strong>2015 <strong>FY</strong>2016 <strong>FY</strong>2017 <strong>FY</strong>2018 Total 5‐Year Cost<br />
Current Year $ 654,032 $ ‐ $ 2,674,353 $ ‐ $ ‐ $ 3,328,385<br />
$ 654,032 $ ‐ $ 2,674,353 $ ‐ $ ‐ $ 3,328,385<br />
Revenue Plan <strong>FY</strong><strong>2014</strong> <strong>FY</strong>2015 <strong>FY</strong>2016 <strong>FY</strong>2017 <strong>FY</strong>2018 Total 5‐Year Cost<br />
Federal Share $ ‐ $ ‐ $ ‐ $ ‐ $ ‐ $<br />
‐<br />
<strong>TriMet</strong> Share $ 654,032 $ ‐ $ 2,674,353 $ ‐ $ ‐ $ 3,328,385<br />
Other Source $ ‐ $ ‐ $ ‐ $ ‐ $ ‐ $<br />
‐<br />
TBD $ ‐ $ ‐ $ ‐ $ ‐ $ ‐ $<br />
‐<br />
$ 654,032 $ ‐ $ 2,674,353 $ ‐ $ ‐ $ 3,328,385<br />
Page ‐ 115
<strong>Capital</strong> <strong>Asset</strong> <strong>Management</strong> & <strong>Investment</strong> Program Facilities – Customer and Operations Facilities <strong>Management</strong><br />
Facilities <strong>Management</strong> ‐ Site/Property Improvements – Detailed Projects (continued)<br />
Project Name: Sunset Transit Center ‐ Platform Pavers Replacement Project ID: TBD<br />
Project Class: Facilities Priority: SR, RoD<br />
Start Date: 7/1/2013 Completion Date: 6/30/2015 Project Type: <strong>Capital</strong><br />
Budgeted Dept: Facilities <strong>Management</strong> Project Manager: Batty<br />
PROJECT DESCRIPTION<br />
Surface replacements at the Sunset Platform.<br />
PROJECT JUSTIFICATION<br />
Platform surfaces at Sunset Transit Center are pavers mortared to a concrete base. Failure appears to be a result of lack of below surface drainage combined with<br />
impacts of using de‐icing chemicals plus unit construction that transfer train vibration to the platform. The surface is sloped toward the track and pavers are slowly<br />
migrating into the trackway. To address the problem the pavers and mortar must be removed, drainage issues addressed and the surface rebuilt. Construction to<br />
begin towards end of <strong>FY</strong><strong>2014</strong> with bulk of work summer of 2015 to be completed prior to PMLR opening.<br />
STATUS<br />
N/A<br />
Expenditure Plan <strong>FY</strong><strong>2014</strong> <strong>FY</strong>2015 <strong>FY</strong>2016 <strong>FY</strong>2017 <strong>FY</strong>2018 Total 5‐Year Cost<br />
Current Year $ 295,452 $ 1,235,827 $ ‐ $ ‐ $ ‐ $ 1,531,279<br />
$ 295,452 $ 1,235,827 $ ‐ $ ‐ $ ‐ $ 1,531,279<br />
Revenue Plan <strong>FY</strong><strong>2014</strong> <strong>FY</strong>2015 <strong>FY</strong>2016 <strong>FY</strong>2017 <strong>FY</strong>2018 Total 5‐Year Cost<br />
Federal Share $ ‐ $ ‐ $ ‐ $ ‐ $ ‐ $<br />
‐<br />
<strong>TriMet</strong> Share $ 295,452 $ 1,235,827 $ ‐ $ ‐ $ ‐ $ 1,531,279<br />
Other Source $ ‐ $ ‐ $ ‐ $ ‐ $ ‐ $<br />
‐<br />
TBD $ ‐ $ ‐ $ ‐ $ ‐ $ ‐ $<br />
‐<br />
$ 295,452 $ 1,235,827 $ ‐ $ ‐ $ ‐ $ 1,531,279<br />
Page ‐ 116
<strong>Capital</strong> <strong>Asset</strong> <strong>Management</strong> & <strong>Investment</strong> Program Facilities – Customer and Operations Facilities <strong>Management</strong><br />
Facilities <strong>Management</strong> ‐ Site/Property Improvements – Detailed Projects (continued)<br />
Project Name: Hollywood Transit Center ‐ Paving & Storm Drainage Project ID: TBD<br />
Project Class: Facilities Priority: SR, RoD<br />
Start Date: 7/1/<strong>2014</strong> Completion Date: 6/30/2015 Project Type: <strong>Capital</strong><br />
Budgeted Dept: Facilities <strong>Management</strong> Project Manager: Papadopoulos<br />
PROJECT DESCRIPTION<br />
Replacement of storm drain line and repaving of Hollywood Transit Center.<br />
PROJECT JUSTIFICATION<br />
Approximately 2/3 of the pavement at Hollywood Transit Center is asphalt pavement at the end of its useful life. Pavement needs to be removed and replaced to<br />
restore useful life with reasonable maintenance. An existing poorly functioning storm drain line would be replaced at the same time.<br />
STATUS<br />
N/A<br />
Expenditure Plan <strong>FY</strong><strong>2014</strong> <strong>FY</strong>2015 <strong>FY</strong>2016 <strong>FY</strong>2017 <strong>FY</strong>2018 Total 5‐Year Cost<br />
Current Year $ ‐ $ 200,000 $ ‐ $ ‐ $ ‐ $ 200,000<br />
$ ‐ $ 200,000 $ ‐ $ ‐ $ ‐ $ 200,000<br />
Revenue Plan <strong>FY</strong><strong>2014</strong> <strong>FY</strong>2015 <strong>FY</strong>2016 <strong>FY</strong>2017 <strong>FY</strong>2018 Total 5‐Year Cost<br />
Federal Share $ ‐ $ ‐ $ ‐ $ ‐ $ ‐ $<br />
‐<br />
<strong>TriMet</strong> Share $ ‐ $ 200,000 $ ‐ $ ‐ $ ‐ $ 200,000<br />
Other Source $ ‐ $ ‐ $ ‐ $ ‐ $ ‐ $<br />
‐<br />
TBD $ ‐ $ ‐ $ ‐ $ ‐ $ ‐ $<br />
‐<br />
$ ‐ $ 200,000 $ ‐ $ ‐ $ ‐ $ 200,000<br />
Page ‐ 117
<strong>Capital</strong> <strong>Asset</strong> <strong>Management</strong> & <strong>Investment</strong> Program Facilities – Customer and Operations Facilities <strong>Management</strong><br />
Facilities <strong>Management</strong> ‐ Site/Property Improvements – Detailed Projects (continued)<br />
Project Name: Vault Cover Replacements ‐ Morrison/Yamhill Signal Project ID: TBD<br />
Project Class: Facilities Priority: S<br />
Start Date: 7/1/2013 Completion Date: 6/30/<strong>2014</strong> Project Type: <strong>Capital</strong><br />
Budgeted Dept: Facilities <strong>Management</strong> Project Manager: Kindig/<br />
Papadopoulos<br />
PROJECT DESCRIPTION<br />
Replace signal vaults located in auto travel lanes adjacent to the track way along Morrison and Yamhill<br />
PROJECT JUSTIFICATION<br />
The vault covers are not holding up to traffic loadings and are not reparable as operating hinged covers. Instead covers are welded in place and must be cut open<br />
when access is needed. Covers need to be replaced with a design more suited to traffic conditions. There are approximately 20 vaults of this type.<br />
STATUS<br />
N/A<br />
Expenditure Plan <strong>FY</strong><strong>2014</strong> <strong>FY</strong>2015 <strong>FY</strong>2016 <strong>FY</strong>2017 <strong>FY</strong>2018 Total 5‐Year Cost<br />
Current Year $ 310,200 $ ‐ $ ‐ $ ‐ $ ‐ $ 310,200<br />
$ 310,200 $ ‐ $ ‐ $ ‐ $ ‐ $ 310,200<br />
Revenue Plan <strong>FY</strong><strong>2014</strong> <strong>FY</strong>2015 <strong>FY</strong>2016 <strong>FY</strong>2017 <strong>FY</strong>2018 Total 5‐Year Cost<br />
Federal Share $ ‐ $ ‐ $ ‐ $ ‐ $ ‐ $<br />
‐<br />
<strong>TriMet</strong> Share $ 310,200 $ ‐ $ ‐ $ ‐ $ ‐ $ 310,200<br />
Other Source $ ‐ $ ‐ $ ‐ $ ‐ $ ‐ $<br />
‐<br />
TBD $ ‐ $ ‐ $ ‐ $ ‐ $ ‐ $<br />
‐<br />
$ 310,200 $ ‐ $ ‐ $ ‐ $ ‐ $ 310,200<br />
Page ‐ 118
<strong>Capital</strong> <strong>Asset</strong> <strong>Management</strong>& <strong>Investment</strong> Program Facilities – Customer & Operations Environmental<br />
Environmental ‐ Storm Water Underground Injection Control (UIC) Program<br />
The Oregon Department of Environmental Quality (DEQ) and the Environmental Protection Agency (EPA) oversee and enforce environmental rules<br />
regarding the installation and operation of underground injection control (UIC) devices, also known as ‘drywells.’ Unlike many storm water devices,<br />
which drain to surface water (streams or creeks), UICs discharge water from paved areas to groundwater. The UIC rules are more stringent than<br />
other Clean Water Act standards, because the intent is to protect groundwater as drinking water source and must, instead, comply with the Safe<br />
Drinking Water Act.<br />
<strong>TriMet</strong> currently owns and operates over 140 drywells, which have been inventoried and registered with DEQ. A preliminary assessment begun in<br />
2002, revealed that many of <strong>TriMet</strong>’s drywells, installed 30 or more years ago, were built without pre‐treatment, drain poorly, and do not meet basic<br />
design and operation criteria.<br />
As a result, in 2003, <strong>TriMet</strong> applied to DEQ for an area‐wide permit to cover all <strong>TriMet</strong> UICs. This permit, when issued, would provide a legal shield<br />
from third‐party lawsuits related to groundwater protection, and would allow <strong>TriMet</strong> to develop a staged approach to fixing non‐compliant UICs.<br />
With this permit also comes increased monitoring, maintenance and management of these systems. Many local municipalities with large numbers<br />
of UICs also applied for a permit.<br />
Since applying for this permit, DEQ has struggled with funding the UIC program as well as working through the many issues applicants and other<br />
interested parties had (e.g., Oregon DOJ, EPA, environmental advocacy groups) around the implementation and compliance implications of the<br />
permit templates that were developed. In 2012, DEQ had turnover in management and staff working on their UIC program, which resulted in a<br />
paradigm shift of sorts and a revised permit template that resolved many of the remaining issues <strong>TriMet</strong> and others had with the permit. DEQ has<br />
once again begun drafting several individual permits and notified <strong>TriMet</strong> that its permit is in the queue to be drafted. This was anticipated and<br />
budgeted for in <strong>FY</strong>13 and will likely push into <strong>FY</strong>14. Due to these major changes in the UIC program at DEQ and revised permit template, it appears<br />
that major capital improvements previously anticipated at Center Garage and other locations may not be needed. Hence, the design work at Center<br />
was stopped in <strong>FY</strong>13 and capital improvement funds reduced and pushed out to future years after the permit requirements are better understood.<br />
Environmental ‐ Storm Water UIC Program ‐ Impact to the Budget<br />
The work for this program can be broken down as follows:<br />
1. Permit application submittals and negotiations with DEQ to permit issuance<br />
2. Preparation and submission of permit‐required plans (e.g., System‐Wide Assessment, UIC <strong>Management</strong> Plan, Sampling & Analysis<br />
Plan, Decommissioning Plan)<br />
3. Ongoing annual monitoring, sampling, analytical analyses, and reporting<br />
4. <strong>Capital</strong> repairs , including planning, design and construction<br />
Page ‐ 119
<strong>Capital</strong> <strong>Asset</strong> <strong>Management</strong>& <strong>Investment</strong> Program Facilities – Customer & Operations Environmental<br />
Environmental ‐ Storm Water UIC Program ‐ Impact to the Budget<br />
In <strong>FY</strong>14 (a carryover from <strong>FY</strong>13), the following tasks with their estimated costs anticipated:<br />
Legal assistance with DEQ negotiations $ 40,000<br />
Consulting assistance with Plans, DEQ negotiations $ 30,000<br />
<strong>Capital</strong> improvements $ 40,000<br />
Annual monitoring and sampling $ 40,000<br />
$ 150,000<br />
Due to the uncertainty of this program and unknown regulatory obligations, the money allocated in out years is somewhat of a placeholder with<br />
some capital improvements anticipated, with specifics unknown at this point.<br />
Environmental ‐ Storm Water UIC Program Summary<br />
Project Name: Storm Water Underground Injection Control (UIC) Program Project ID: 7568<br />
Project Class: Facilities Priority: S<br />
Start Date: Ongoing Completion Date: Ongoing Project Type: Operating<br />
Budgeted Dept: Safety & Security – Environmental Services Project Manager: Preston<br />
Expenditure Plan <strong>FY</strong><strong>2014</strong> <strong>FY</strong>2015 <strong>FY</strong>2016 <strong>FY</strong>2017 <strong>FY</strong>2018 Total 5‐Year Cost<br />
Current Year $ ‐ $ 250,000 $ 500,000 $ 500,000 $ 250,000 $ 1,500,000<br />
$ ‐ $ 250,000 $ 500,000 $ 500,000 $ 250,000 $ 1,500,000<br />
Revenue Plan <strong>FY</strong><strong>2014</strong> <strong>FY</strong>2015 <strong>FY</strong>2016 <strong>FY</strong>2017 <strong>FY</strong>2018 Total 5‐Year Cost<br />
Federal Share $ ‐ $ ‐ $ ‐ $ ‐ $ ‐ $<br />
‐<br />
<strong>TriMet</strong> Share $ ‐ $ 250,000 $ 500,000 $ 500,000 $ 250,000 $ 1,500,000<br />
Other Source $ ‐ $ ‐ $ ‐ $ ‐ $ ‐ $<br />
‐<br />
TBD $ ‐ $ ‐ $ ‐ $ ‐ $ ‐ $<br />
‐<br />
$ ‐ $ 250,000 $ 500,000 $ 500,000 $ 250,000 $ 1,500,000<br />
Page ‐ 120
<strong>Capital</strong> <strong>Asset</strong> <strong>Management</strong>& <strong>Investment</strong> Program Facilities – Customer & Operations Environmental<br />
Environment Projects – All Facilities Maintenance Environmental<br />
Project Name: All Facilities Maintenance Environmental Project ID: 4557<br />
Project Class: Facilities Priority: S<br />
Start Date: Ongoing Completion Date: Ongoing Project Type: Operating<br />
Budgeted Dept: Safety & Security – Environmental Services Project Manager: Preston<br />
PROJECT DESCRIPTION<br />
Upgrades and repairs to environmental infrastructure and equipment as a result of regulatory requirements, changes or unplanned failure. Systems include storm<br />
water, wastewater, underground and above ground tank and piping systems, air quality systems and others. Additionally, new focus is needed for stormwater<br />
bioswale maintenance and upgrades, due to their specialized environmental function, visibility, and increasing regulatory obligations. Bioswale maintenance and<br />
improvement landscapers have been contracted to fill this gap and addition funding is required for this new program.<br />
Planned projects include:<br />
AST tank inspections and upgrades<br />
Tank monitoring system upgrades<br />
Stormwater swale improvements, increased maintenance<br />
PROJECT JUSTIFICATION<br />
Upgrades and repair are necessary as a result of regulatory requirements, changes and/or unplanned failure.<br />
STATUS<br />
N/A<br />
Expenditure Plan <strong>FY</strong><strong>2014</strong> <strong>FY</strong>2015 <strong>FY</strong>2016 <strong>FY</strong>2017 <strong>FY</strong>2018 Total 5‐Year Cost<br />
Current Year $ 125,000 $ 125,000 $ 125,000 $ 125,000 $ 125,000 $ 625,000<br />
$ 125,000 $ 125,000 $ 125,000 $ 125,000 $ 125,000 $ 625,000<br />
Revenue Plan <strong>FY</strong><strong>2014</strong> <strong>FY</strong>2015 <strong>FY</strong>2016 <strong>FY</strong>2017 <strong>FY</strong>2018 Total 5‐Year Cost<br />
Federal Share $ ‐ $ ‐ $ ‐ $ ‐ $ ‐ $<br />
‐<br />
<strong>TriMet</strong> Share $ 125,000 $ 125,000 $ 125,000 $ 125,000 $ 125,000 $ 625,000<br />
Other Source $ ‐ $ ‐ $ ‐ $ ‐ $ ‐ $<br />
‐<br />
TBD $ ‐ $ ‐ $ ‐ $ ‐ $ ‐ $<br />
‐<br />
$ 125,000 $ 125,000 $ 125,000 $ 125,000 $ 125,000 $ 625,000<br />
Page ‐ 121
<strong>Capital</strong> <strong>Asset</strong> <strong>Management</strong>& <strong>Investment</strong> Program Facilities – Customer & Operations Environmental<br />
Environment Projects – Merlo UST Replacement<br />
Project Name: Merlo Underground Storage Tank (UST) Replacement Project ID: TBD<br />
Project Class: Facilities Priority: SR, RoD<br />
Start Date: 7/1/2013 Completion Date: 6/30/<strong>2014</strong> Project Type: <strong>Capital</strong><br />
Budgeted Dept: Safety & Security ‐ Environmental Services Project Manager: Preston<br />
PROJECT DESCRIPTION<br />
<strong>TriMet</strong> currently owns and operates 24 underground storage tanks (USTs) used for storing and dispensing diesel, motor oils, coolant, used oil, etc. Over the years,<br />
the number of underground tanks has been reduced from 47 to 24 through changing operational needs or replacing with above ground tanks. These 24 USTs have<br />
an estimated useful life of 30 years and are a necessary part of operations. Since 2005, all but one UST has been replaced (through general and ARRA funding) with<br />
new double‐walled tanks with improved leak detection and piping, bringing them up to current code and reducing <strong>TriMet</strong>’s environmental liability. The remaining<br />
tank at Merlo is a stand‐alone tank and was not easily grouped with other UST replacement projects and is the last original, single‐walled tank at <strong>TriMet</strong>.<br />
The project includes planning, design and construction to remove and replace a single‐walled 2,500‐gal used oil UST and piping and install a new double‐walled tank<br />
and piping. Decommission a small section of steel piping and replace with corrosion‐resistant double‐walled piping. The corrosion protection system for this section<br />
of steel piping is nearing the end of its useful life and needs to be replaced prior to failure. If the full UST replacement project is not funded, then the corrosion<br />
protection system will need to be re‐installed or an alternate piping project will need to completed, both requiring significant excavation.<br />
PROJECT JUSTIFICATION<br />
Recent testing of the section of steel piping indicates that the cathodic protection is nearing the end of its useful life and needs to be replaced within the next couple<br />
of years to prevent corrosion and leaks in the underground piping to this tank. Replacing the piping or installing new cathodic protection will soon be necessary to be<br />
in compliance with UST regulations and to prevent a costly cleanup. Doing this work sooner, rather than later is in <strong>TriMet</strong>’s best interest. It is also in <strong>TriMet</strong>’s best<br />
interest to replace the last remaining 30‐year old single‐walled tank and it would be most economical and efficient to do the piping and tank work at the same time.<br />
Replacing this tank and piping completes <strong>TriMet</strong>’s UST replacement program for another 25‐30 years.<br />
STATUS – N/A<br />
Expenditure Plan <strong>FY</strong><strong>2014</strong> <strong>FY</strong>2015 <strong>FY</strong>2016 <strong>FY</strong>2017 <strong>FY</strong>2018 Total 5‐Year Cost<br />
Current Year $ 150,000 $ ‐ $ ‐ $ ‐ $ ‐ $ 150,000<br />
$ 150,000 $ ‐ $ ‐ $ ‐ $ ‐ $ 150,000<br />
Revenue Plan <strong>FY</strong><strong>2014</strong> <strong>FY</strong>2015 <strong>FY</strong>2016 <strong>FY</strong>2017 <strong>FY</strong>2018 Total 5‐Year Cost<br />
Federal Share $ ‐ $ ‐ $ ‐ $ ‐ $ ‐ $<br />
‐<br />
<strong>TriMet</strong> Share $ 150,000 $ ‐ $ ‐ $ ‐ $ ‐ $ 150,000<br />
Other Source $ ‐ $ ‐ $ ‐ $ ‐ $ ‐ $<br />
‐<br />
TBD $ ‐ $ ‐ $ ‐ $ ‐ $ ‐ $<br />
‐<br />
$ 150,000 $ ‐ $ ‐ $ ‐ $ ‐ $ 150,000<br />
Page ‐ 122
<strong>Capital</strong> <strong>Asset</strong> <strong>Management</strong> & <strong>Investment</strong> Program Facilities – Customer & Operations Center Street Building – End of Life Maintenance Work<br />
Center Street Building – End of Life Maintenance Work<br />
Project Name: Center Street Building – End of Life Maintenance Work Project ID: TBD<br />
Project Class: Facilities Priority: SR, RoD<br />
Start Date: 7/1/2013 Completion Date: 6/30/<strong>2014</strong> Project Type: <strong>Capital</strong><br />
Budgeted Dept: <strong>Capital</strong> Projects – Development & Operations Support Project Manager: Munro<br />
PROJECT DESCRIPTION<br />
Building façade, replacement of all of the windows, greater fire suppression, additional HVAC and electronic equipment<br />
Construction ‐ $2,216,745<br />
Soft Costs ‐ $465,516<br />
Contingency ‐ $737,622<br />
Escalation ‐ $0<br />
PROJECT JUSTIFICATION<br />
The Center Street building is in need of additional maintenance work as part of the remodel. From an efficiency standpoint, it makes sense to pair this project with<br />
the rest of the Center Street building remodel to complete the entire building rather than piecemeal. This request covers design and construction costs to occur in<br />
step with PMLR remodeling work.<br />
STATUS<br />
N/A<br />
Expenditure Plan <strong>FY</strong><strong>2014</strong> <strong>FY</strong>2015 <strong>FY</strong>2016 <strong>FY</strong>2017 <strong>FY</strong>2018 Total 5‐Year Cost<br />
Current Year $ 3,419,883 $ ‐ $ ‐ $ ‐ $ ‐ $ 3,419,883<br />
$ 3,419,883 $ ‐ $ ‐ $ ‐ $ ‐ $ 3,419,883<br />
Revenue Plan <strong>FY</strong><strong>2014</strong> <strong>FY</strong>2015 <strong>FY</strong>2016 <strong>FY</strong>2017 <strong>FY</strong>2018 Total 5‐Year Cost<br />
Federal Share $ ‐ $ ‐ $ ‐ $ ‐ $ ‐ $<br />
‐<br />
<strong>TriMet</strong> Share $ 3,419,883 $ ‐ $ ‐ $ ‐ $ ‐ $ 3,419,883<br />
Other Source $ ‐ $ ‐ $ ‐ $ ‐ $ ‐ $<br />
‐<br />
TBD $ ‐ $ ‐ $ ‐ $ ‐ $ ‐ $<br />
‐<br />
$ 3,419,883 $ ‐ $ ‐ $ ‐ $ ‐ $ 3,419,883<br />
Page ‐ 123
<strong>Capital</strong> <strong>Asset</strong> <strong>Management</strong> & <strong>Investment</strong> Program Facilities – Customer & Operations Center Street Building – First Floor<br />
Center Street Building – First Floor<br />
Project Name: Center Street Building – First Floor Project ID: TBD<br />
Project Class: Facilities Priority: SR, RoD<br />
Start Date: 7/1/2013 Completion Date: 6/30/<strong>2014</strong> Project Type: <strong>Capital</strong><br />
Budgeted Dept: <strong>Capital</strong> Projects – Development & Operations Support Project Manager: Munro<br />
PROJECT DESCRIPTION<br />
Remodel of the Bull Pen, Lobby Area and East End Entrance<br />
Construction ‐ $1,226,696<br />
Soft Costs ‐ $480,276<br />
Contingencies ‐ $565,541<br />
Escalation ‐ $68,175<br />
PROJECT JUSTIFICATION<br />
With the new 200‐space parking lot being built to the northeast of the Center Street building, the entry door on the east end of the building will become a significant<br />
entry point for the building. This entry, the lobby and bull pen need to be modified to respond to and support the PMLR project remodeling. This request covers<br />
design and construction costs to occur in step with PMLR remodeling work.<br />
STATUS<br />
N/A<br />
Expenditure Plan <strong>FY</strong><strong>2014</strong> <strong>FY</strong>2015 <strong>FY</strong>2016 <strong>FY</strong>2017 <strong>FY</strong>2018 Total 5‐Year Cost<br />
Current Year $ 2,340,689 $ ‐ $ ‐ $ ‐ $ ‐ $ 2,340,689<br />
$ 2,340,689 $ ‐ $ ‐ $ ‐ $ ‐ $ 2,340,689<br />
Revenue Plan <strong>FY</strong><strong>2014</strong> <strong>FY</strong>2015 <strong>FY</strong>2016 <strong>FY</strong>2017 <strong>FY</strong>2018 Total 5‐Year Cost<br />
Federal Share $ ‐ $ ‐ $ ‐ $ ‐ $ ‐ $<br />
‐<br />
<strong>TriMet</strong> Share $ 2,340,689 $ ‐ $ ‐ $ ‐ $ ‐ $ 2,340,689<br />
Other Source $ ‐ $ ‐ $ ‐ $ ‐ $ ‐ $<br />
‐<br />
TBD $ ‐ $ ‐ $ ‐ $ ‐ $ ‐ $<br />
‐<br />
$ 2,340,689 $ ‐ $ ‐ $ ‐ $ ‐ $ 2,340,689<br />
Page ‐ 124
<strong>Capital</strong> <strong>Asset</strong> <strong>Management</strong> & <strong>Investment</strong> Program Facilities – Customer & Operations Line 8 & 17 Bus Turnaround & Layover Facility<br />
Line 8 & 17 Bus Turnaround & Layover Facility<br />
Project Name: Line 8 & 17 Bus Turnaround & Layover Facility Project ID: TBD<br />
Project Class: Facilities Priority: LSI<br />
Start Date: 7/1/2013 Completion Date: 6/30/2015 Project Type: <strong>Capital</strong><br />
Budgeted Dept: <strong>Capital</strong> Projects – Bus Stop Development Project Manager: Park<br />
PROJECT DESCRIPTION<br />
Acquire property, design and construct a combined layover, turnaround and restroom facility, for bus lines 8 and 17. Facility will be located in NE Portland near the<br />
current line 8 layover. Both on and off street options will be considered.<br />
PROJECT JUSTIFICATION<br />
Providing a centrally located layover facility saves <strong>TriMet</strong> an estimated $500K annually in operating costs when compared to our old location on Middlefield Rd and<br />
Vancouver Way. It is cost neutral (save utilities and cleaning) when compared to our current layover on Dekum (that we will be vacating due to neighborhood<br />
opposition and lack of a secured restroom). The transitory nature of many of our layovers and restroom agreements with local businesses is frequently problematic.<br />
Changes are often made on the fly in response to changing development patterns, unhappy neighbors, cancelled restroom agreements etc. Building a facility<br />
provides permanence, enhancing operational consistency and improving schedule reliability. A guaranteed restroom enhances operator safety and comfort.<br />
In concert with Real Property and Service Planning, we are currently searching for available properties that both meet operational and circulation requirements and<br />
are appropriately located to maximize routing efficiency. The search process should produce 2 or 3 viable options for advancement in <strong>2014</strong>.<br />
<strong>FY</strong> <strong>2014</strong> – acquire ROW, advance design and permits. <strong>FY</strong> 2015 – Construction<br />
STATUS<br />
N/A<br />
Expenditure Plan <strong>FY</strong><strong>2014</strong> <strong>FY</strong>2015 <strong>FY</strong>2016 <strong>FY</strong>2017 <strong>FY</strong>2018 Total 5‐Year Cost<br />
Current Year $ 400,000 $ 500,000 $ ‐ $ ‐ $ ‐ $ 900,000<br />
$ 400,000 $ 500,000 $ ‐ $ ‐ $ ‐ $ 900,000<br />
Revenue Plan <strong>FY</strong><strong>2014</strong> <strong>FY</strong>2015 <strong>FY</strong>2016 <strong>FY</strong>2017 <strong>FY</strong>2018 Total 5‐Year Cost<br />
Federal Share $ ‐ $ ‐ $ ‐ $ ‐ $ ‐ $<br />
‐<br />
<strong>TriMet</strong> Share $ 400,000 $ 500,000 $ ‐ $ ‐ $ ‐ $ 900,000<br />
Other Source $ ‐ $ ‐ $ ‐ $ ‐ $ ‐ $<br />
‐<br />
TBD $ ‐ $ ‐ $ ‐ $ ‐ $ ‐ $<br />
‐<br />
$ 400,000 $ 500,000 $ ‐ $ ‐ $ ‐ $ 900,000<br />
Page ‐ 125
<strong>Capital</strong> <strong>Asset</strong> <strong>Management</strong> & <strong>Investment</strong> Program Facilities – Customer & Operations Union Station Area Bus Layover & Turnaround<br />
Union Station Area Bus Layover and Turnaround<br />
Project Name: Union Station Area Bus Layover and Turnaround Project ID: TBD<br />
Project Class: Facilities Priority: LSI<br />
Start Date: 7/1/<strong>2014</strong> Completion Date: 6/30/2015 Project Type: <strong>Capital</strong><br />
Budgeted Dept: <strong>Capital</strong> Projects – Development & Operations Support Project Manager: Lehto<br />
PROJECT DESCRIPTION<br />
Design for 40’ bus vehicle<br />
Design Pavement Section: 18” Aggregate, 6” ATB, 8” AC<br />
All sidewalks on Union Station side of NW Station Way will remain<br />
Improvements limited to turnaround and up to 250’ in each direction<br />
approaching the turnaround<br />
Street section currently not adequate to support additional bus traffic.<br />
<br />
<br />
<br />
<br />
Overlay pavement that is not reconstructed to limits in sketch<br />
Road widths to stay the same<br />
No signalization other than signage required at turnaround<br />
Building facade will need reconfiguration due to amount of sidewalk being<br />
removed for turnaround<br />
Project Scope: Design/Construct intersection of NW Station Way and NW Marshall Street to accommodate a Bus Turnaround and parking for Mall Operations.<br />
Design incorporates two levels of improvements, full street reconstruction of the intersection to support bus movements, and an AC overlay to the limits of<br />
construction. Work also includes relocation/adjustment of effected utilities, drainage improvements, and restriping of the existing streets. Some enhancements may<br />
be required to the existing building façade following the construction of the new curb line at the south corner.<br />
PROJECT JUSTIFICATION<br />
Bus capacity at North Terminal and adjacent on‐street spots was reduced from 23 (20 on site, 3 on street) to 9 buses due to the Portland Mall project. This capacity<br />
will meet needs at startup, but it requires interim on‐street layover location for buses (e.g., SW Broadway and W Burnside) and on‐street dwell locations for pullouts<br />
from garages (e.g., on Burnside Bridge, at NW Everett and Broadway). On‐street locations are subject to removal due to impacts on adjacent uses and traffic/security<br />
conditions. Therefore, it is good to have a more permanent solution. In addition, space is needed for special events and bus chaining during inclement weather. As<br />
the area around North Terminal redevelops, there would likely be interest in moving the bus layover. The proposed location is between railroad tracks and a parking<br />
garage. Restroom and break room would be provided in the Smart Park garage.<br />
STATUS – N/A<br />
Expenditure Plan <strong>FY</strong><strong>2014</strong> <strong>FY</strong>2015 <strong>FY</strong>2016 <strong>FY</strong>2017 <strong>FY</strong>2018 Total 5‐Year Cost<br />
Current Year $ 1,750,000 $ ‐ $ ‐ $ ‐ $ 1,750,000<br />
$ ‐ $ 1,750,000 $ ‐ $ ‐ $ ‐ $ 1,750,000<br />
Revenue Plan <strong>FY</strong><strong>2014</strong> <strong>FY</strong>2015 <strong>FY</strong>2016 <strong>FY</strong>2017 <strong>FY</strong>2018 Total 5‐Year Cost<br />
Federal Share $ ‐ $ ‐ $ ‐ $ ‐ $ ‐ $<br />
‐<br />
<strong>TriMet</strong> Share $ ‐ $ ‐ $ ‐ $ ‐ $ ‐ $<br />
‐<br />
Other Source $ ‐ $ ‐ $ ‐ $ ‐ $ ‐ $<br />
‐<br />
TBD $ ‐ $ 1,750,000 $ ‐ $ ‐ $ ‐ $ 1,750,000<br />
$ ‐ $ 1,750,000 $ ‐ $ ‐ $ ‐ $ 1,750,000<br />
Page ‐ 126
<strong>Capital</strong> <strong>Asset</strong> <strong>Management</strong> & <strong>Investment</strong> Program Facilities – Customer & Operations Union Station Area Bus Layover & Turnaround<br />
Union Station Area Bus Layover and Turnaround (continued)<br />
Page ‐ 127
This page left intentionally blank.
SECTION 6 – TECHNOLOGY SYSTEMS
This page left intentionally blank.
<strong>Capital</strong> <strong>Asset</strong> <strong>Management</strong> & <strong>Investment</strong> Program Technology Systems Operations Control & Communication Systems<br />
<strong>Asset</strong> Category – Technology Systems – Operations Control & Communication Systems<br />
Bus Dispatch System<br />
Beginning in <strong>FY</strong>09 ‐ <strong>TriMet</strong> began replacement of the failing and rapidly aging Bus Dispatch System. The replacement of the dispatch system is<br />
concurrent with replacement and narrow banding of the radio systems mandated by the Federal Communications Commission (FCC). The new<br />
Computer Aided Dispatch (CAD)/Automatic Vehicle Location (AVL) system in undergoing final pilot testing and installation of the entire bus fleet.<br />
Final cutover is scheduled to occur in the spring 2013. Warranty payments will be made over the next three fiscal years. Condition of asset is new.<br />
Qty YEAR REPLACE- <strong>FY</strong><br />
OF ACTION YEAR MENT <strong>FY</strong>14 <strong>FY</strong>15 <strong>FY</strong>16 <strong>FY</strong>17 <strong>FY</strong>18 <strong>2014</strong>-2018<br />
PURCHASE NEEDED NEEDED CYCLE TOTALS<br />
Bus Dispatch System and <strong>TriMet</strong> Radios System<br />
replacement program contract - fixed route & radios $ - $ 385,000 $ 385,000 $ 385,000<br />
$ 770,000<br />
program management/eng. svcs. (consultant + staff)<br />
[CAD/AVL servers & workstations listed in IT Foundation]<br />
Bus Dispatch System Equipment<br />
Equipment will be inventoried upon completion of the project<br />
BUS DISPATCH TOTAL $ - $ 385,000 $ 385,000 $ 385,000 $ - $ 770,000<br />
LIFT Dispatch System<br />
The LIFT/MDT project is upgrading the dispatch system for LIFT vehicles. Installation and completion of pilot will occur in the spring of 2013.<br />
Warranty payments will be made over the next three fiscal years. Condition of asset is new.<br />
Qty YEAR REPLACE- <strong>FY</strong><br />
OF ACTION YEAR MENT <strong>FY</strong>14 <strong>FY</strong>15 <strong>FY</strong>16 <strong>FY</strong>17 <strong>FY</strong>18 <strong>2014</strong>-2018<br />
PURCHASE NEEDED NEEDED CYCLE TOTALS<br />
Paratransit Improvements<br />
LIFT MDT, Dispatch & Communications System $ - $ 72,000 $ 72,000 $ 72,000<br />
$ 144,000<br />
Equipment will be inventoried upon completion of the project.<br />
LIFT DISPATCH TOTAL $ - $ 72,000 $ 72,000 $ 72,000 $ - $ 144,000<br />
Page ‐ 131
<strong>Capital</strong> <strong>Asset</strong> <strong>Management</strong> & <strong>Investment</strong> Program Technology Systems Operations Control & Communication Systems<br />
Rail Control & SCADA Systems<br />
The Rail Control & SCADA Systems are broken up into four areas or specific projects. Below is a breakdown of the areas/projects with information or<br />
notes that relate to the table that follows:<br />
<br />
<br />
<br />
<br />
MAX Fiber Optic Cable System – Power supplies and batteries are replaced as need as part of the maintenance budget. SONET<br />
equipment is in process of being decommissioned and funded by the CCTV in order to better support IP network.<br />
Tunnel Radio System – Bi‐Directional Amplifier system is being replaced as part of BDS/Radio Replacement project and has an<br />
estimated 20 year life. Completion of this element expected in <strong>FY</strong>2013.<br />
MOW Type 1 Substation Transition to Ethernet – An engineering study is needed to determine cost and time frame to connect type<br />
1 substations to the Ethernet Network. The connection is needed to provide remote management capabilities that are not currently<br />
available.<br />
MAX Orange Line Improvements – Orange line costs to be updated as contracts bid and are awarded.<br />
Qty YEAR ACTION REPLACE- <strong>FY</strong><br />
TECHNOLOGY EQUIPMENT SYSTEMS OF NEEDED YEAR MENT <strong>2014</strong>-2018<br />
PURCHASE NEEDED CYCLE <strong>FY</strong>14 <strong>FY</strong>15 <strong>FY</strong>16 <strong>FY</strong>17 <strong>FY</strong>18 TOTALS<br />
RAIL CONTROL & SCADA SYSTEMS<br />
MAX Fiber Optic Cable System<br />
Communications Node Power Supplies (44/7/12) 63 1998/02/05 $ -<br />
Communications Node Batteries (110/20/30) 160 1998/02/05 $ -<br />
Fiber Optic Cable 1998/02/05/09/14 $ -<br />
SONET Ethernet Equipment 43 2007 10yr $ -<br />
MAX Fiber Optic Cable System Total $ - $ - $ - $ - $ - $ -<br />
IMPROVEMENT<br />
MOW Type 1 Substation Transition to Ethernet<br />
No projects at this time $ -<br />
MOW Type 1 Substation Transition to Ethernet Total $ - $ - $ - $ - $ - $ -<br />
MAX Orange Line improvements<br />
Control Center Relocation (Estimated amount only) $ 500,000 $ 500,000 $ -<br />
$ 1,000,000<br />
AIM Upgrade--ARINC Contract (Estimated amount only) $ 500,000 $ 500,000<br />
$ 1,000,000<br />
Orange Line Comm Contract (Bid Prices--Siemens Contract) $ 1,380,000 $ 1,380,000 $ 1,840,000<br />
$ 4,600,000<br />
MAX Orange Line improvements Total $ 2,380,000 $ 2,380,000 $ 1,840,000 $ - $ - $ 6,600,000<br />
Improvement Total TRIMET CAPITAL (Orange Line) $ 2,380,000 $ 2,380,000 $ 1,840,000<br />
$ 6,600,000<br />
RAIL CONTROL AND SCADA SYSTEMS TOTAL $ 2,380,000 $ 2,380,000 $ 1,840,000 $ - $ - $ 6,600,000<br />
PMLR GRANT FUNDING $ 2,380,000 $ 2,380,000 $ 1,840,000 $ - $ - $ 6,600,000<br />
REPLACEMENT & IMPROVEMENT TOTAL (<strong>TriMet</strong> <strong>Capital</strong> Only) $ -<br />
$ -<br />
The MAX Orange Line Improvement project is not part of the <strong>Capital</strong> Program appropriations as it is PMLR funded, but listed here as it is a part of<br />
the Rail Control & SCADA Systems.<br />
Page ‐ 132
<strong>Capital</strong> <strong>Asset</strong> <strong>Management</strong> & <strong>Investment</strong> Program Technology Systems Operations Control & Communication Systems<br />
Radio & Microwave Communication Systems<br />
Some of the Microwave upgrades are part of the Bus Dispatch System (BDS)/Radio replacement. The towers and microwave radios will be evaluated<br />
in 2016 to determine possible replacement schedule, hence the reason for no projected expenses in the table below.<br />
Qty YEAR ACTION REPLACE- <strong>FY</strong><br />
TECHNOLOGY EQUIPMENT SYSTEMS OF NEEDED YEAR MENT <strong>2014</strong>-2018<br />
PURCHASE NEEDED CYCLE <strong>FY</strong>14 <strong>FY</strong>15 <strong>FY</strong>16 <strong>FY</strong>17 <strong>FY</strong>18 TOTALS<br />
RADIO & MICROWAVE COMMUNICATION SYSTEMS<br />
Microwave Communication System<br />
Towers 2 1984 2016 $ -<br />
Digital Microwave Base Stations 14 2001 2016 $ -<br />
Radar Speed Guns 11 1982 $ -<br />
Microwave Communication System Total $ - $ - $ - $ - $ - $ -<br />
RADIO & MICROWAVE COMMUNICATION SYSTEMS TOTAL $ - $ - $ - $ - $ - $ -<br />
Page ‐ 133
<strong>Capital</strong> <strong>Asset</strong> <strong>Management</strong> & <strong>Investment</strong> Program Technology Systems Fare Systems<br />
<strong>Asset</strong> Category – Technology Systems – Fare Systems<br />
Fare Systems consist of a wide variety of components and software and are broken down into five different discipline areas as described in each of<br />
the headings below.<br />
Electronic Fare Collection (eFare) System, Priority= 2, Criticality = High<br />
eFare systems are electronic payment systems used in public transit around the world. This advancement in technology opens up transit to accept all<br />
modern payment types, not just cash or paper tickets. With eFare, customers acquire a payment device, tap a bus or rail validator connected to a<br />
central back office system, which then communicates with the bank.<br />
A few benefits of the eFare System include:<br />
‐ Easy to understand and simple to use<br />
‐ Reduces fare leakage and equipment maintenance costs<br />
‐ Compatible on all transit modes: bus, light rail and commuter rail<br />
‐ Provides seamless transfers between <strong>TriMet</strong> vehicles, as well as C‐TRAN and Streetcar<br />
‐ Establishes better fiscal controls<br />
‐ Brings <strong>TriMet</strong> into the mainstream of next generation payment technology<br />
Farebox System Priority= 2, Criticality = High<br />
<strong>TriMet</strong> replaced the fareboxes on its fixed‐route bus fleet in <strong>FY</strong>12, including a current‐technology farebox revenue accounting system back‐end. In<br />
<strong>FY</strong>13, the bus fareboxes will be supplemented by a transfer/fare receipt printer, replacing tissue‐paper cutter‐bar transfers used previously. The<br />
future eFare system as installed on <strong>TriMet</strong> buses will "stand‐alone" from the farebox, and the farebox/transfer printer system will be retained as the<br />
fare collection system for fixed‐route bus riders who pay cash.<br />
Due to the recent investment in renewal/upgrade of the bus farebox system, no capital replacement needs are forecasted for the system through<br />
<strong>FY</strong>18.<br />
Ticket Vending Machine (TVM) System Priority= 2, Criticality = High<br />
<strong>TriMet</strong> has 225 TVMs installed at 86 MAX light rail and 5 WES stations. In <strong>FY</strong>13, 120 of the oldest TVMs ("Type 3") were replaced with refurbished<br />
"Type 6" TVMs. The remaining 105 TVMs were procured in 2008 and consist of 36 "Type 5" TVMs installed at Mall and I‐205 MAX stations, and 69<br />
"Type 4" credit/debit card‐only TVMs. The Type 5 and 6 TVMs accept cash and make change, as well as credit/debit card payment. (Type 4 cardonly<br />
TVMs are used only at platforms where a Type 5 or 6 full‐service TVM is also available.) Associated with each TVM, is an electro‐mechanical<br />
validator unit used to validate advance‐purchased paper ticket fares. This type of fare product will no longer be used when eFare begins operation,<br />
meaning that the current‐era validator units will be removed.<br />
Page ‐ 134
<strong>Capital</strong> <strong>Asset</strong> <strong>Management</strong> & <strong>Investment</strong> Program Technology Systems Fare Systems<br />
Ticket Vending Machine (TVM) System (continued)<br />
Replacement of the current‐generation TVM system is envisioned subsequent to the eFare implementation, potentially with a smaller, lowermaintenance<br />
type of TVM designed to vend single fares for occasional riders. This may be budgeted and expensed under the eFare project. During<br />
the <strong>FY</strong>s14‐18 period, renewal/upgrade investment in the current TVM system will be needed for a TVM operating system upgrade, and to replace<br />
old, failing vaildator units.<br />
Bus Transfer Printer Priority= 2, Criticality = Medium<br />
New bus transfer printers will be installed and connected through the new CAD/AVL system. These printers will be operational on all 620 fixed route<br />
<strong>TriMet</strong> buses June 2013 (<strong>FY</strong>13). These printers will be used in place of paper tissue transfers, and will allow transfer times to be controlled from time<br />
of issue, reducing fare leakage. The paper stock will also contain a security feature, in addition to the Day Code, to reduce counterfeiting.<br />
Fare Revenue Equipment Priority= 2, Criticality = High<br />
Collecting, counting, and controlling cash requires the appropriate equipment. <strong>TriMet</strong>’s money room and <strong>TriMet</strong> Ticket Office uses currency and coin<br />
counters and verifiers to accurately count bills and coins received through bus fareboxes, on‐street sales, TVMs and the <strong>TriMet</strong> Ticket Office sales<br />
counters.<br />
Money Room Equipment:<br />
3 Cummins Jet Scan currency counters<br />
5 Glory single pocket currency counters<br />
2 Glory currency counters<br />
1 Jet Sort coin separator<br />
1 de Larue coin separator<br />
2 Glory coin verifiers<br />
In <strong>FY</strong>13, <strong>TriMet</strong> will implement an open source revenue component tracking system to track location of all TVM revenue components for internal<br />
controls. This system will use barcode technology to check these components in and out of maintenance, the money room and the revenue<br />
collection contractor.<br />
Fare Sales Systems Priority= 2, Criticality = High<br />
<strong>TriMet</strong> supports several consumer and institutional sales programs, each with its own in‐house sales system and database. Most of these systems<br />
will be replaced with the eFare system consolidating systems, and providing one CRM system providing seamless support of our riders. It will also<br />
support account based fares, allowing multiple media types to be used as valid fare. The open source point of sale system at the <strong>TriMet</strong> Ticket Office<br />
was deployed in <strong>FY</strong>08, and with Windows XP’s support expiring, the system will need software and hardware upgrades <strong>FY</strong>14, including PC, monitor,<br />
and operating systems.<br />
Fare sales come in many types and quantities. Many of these transactions involve purchasing online, by mail, at Ticket Vending<br />
Machines (TVMs), employers, schools, the <strong>TriMet</strong> Ticket Office (TTO) along with a few others. Essentially, fare sales can be broken into two<br />
Page ‐ 135
<strong>Capital</strong> <strong>Asset</strong> <strong>Management</strong> & <strong>Investment</strong> Program Technology Systems Fare Systems<br />
Fare Sales Systems (continued)<br />
categories:<br />
Consumer Sales – these sales tend to be on an individual basis and include online, mail, and TVM sales.<br />
Institutional Sales – in most cases, these sales involve employers or agencies purchasing transit passes for employees, clients, or events,<br />
including schools purchasing fares for student field trips.<br />
Fare Systems Project Summary<br />
ITC Functional Area Category: FARE SYSTEMS<br />
Fare System Replacement Program - Expenditures by <strong>TriMet</strong> <strong>FY</strong><br />
<strong>FY</strong><br />
<strong>FY</strong>14 <strong>FY</strong>15 <strong>FY</strong>16 <strong>FY</strong>17 <strong>FY</strong>18 <strong>2014</strong>-2018<br />
TOTALS<br />
A. TYPE 3 TVM FLEET REBUILD - upgrade 120 Type 3s to Type 6s + Carryover <strong>FY</strong>12 ($540,220) $<br />
-<br />
B. TVM FLEET OPERATING SYSTEM UPGRADE - 225, from Windows XP embedded, to Windows $ 227,000<br />
$ 227,000<br />
embedded standard 2009. Microsoft will not support current XP-embedded TVM OS after December 2016;<br />
Windows embedded standard (WES) is upgrade path; Microsoft states it will support WES to January 2019<br />
C. MAX VALIDATORS REPLACEMENT - 227 $ 60,000 $ -<br />
$ 60,000<br />
allow for replacing 20 failing units per year, $3,000 ea.<br />
D .TRIMET TICKET OFFICE POINT OF SALE UPGRADE -Upgrade open source point of sale from Windows $ 49,000<br />
$ 49,000<br />
XP to Windows 7, including PCs, monitors receipt printers and sale amount display. Microsoft will no support<br />
Windows XP after April <strong>2014</strong>.<br />
Fare System Replacement Program Total $ 109,000 $ 227,000 $ - $ - $ - $ 336,000<br />
Fare System Improvement Program<br />
E. ELECTRONIC FARE SYSTEM - consultant services $ 550,000 $ 650,000 $ 650,000 $ 550,000 $ 500,000 $ 2,900,000<br />
F. ELECTRONIC FARE SYSTEM - implementation contract(s) $ 1,000,000 $ 4,500,000 $ 4,500,000 $ 4,500,000 $ 1,117,790 $ 15,617,790<br />
F. FARE PULL STATION $ 124,000 $ - $ - $ - $ - $ 124,000<br />
Total Improvement of Electronic Fare Collection System $ 1,674,000 $ 5,150,000 $ 5,150,000 $ 5,050,000 1,617,790 18,641,790<br />
Totals Replacement and Improvement of all Fare Revenue Systems $ 1,783,000 $ 5,377,000 $ 5,150,000 $ 5,050,000 $ 1,617,790 $ 18,977,790<br />
Page ‐ 136
<strong>Capital</strong> <strong>Asset</strong> <strong>Management</strong> & <strong>Investment</strong> Program Technology Systems Fare Systems<br />
<strong>Asset</strong> Category – Technology Systems ‐ Fare Systems ‐ Fare Equipment<br />
Priority<br />
To be determined by CIP Committee<br />
<strong>Asset</strong> <strong>Management</strong> Goal<br />
Maintain Fare and Communications equipment that is reliable and meets service requirements.<br />
Fare machine types are as follows, Type 3’s, Type 4’s (Credit Card only), Type 5’s, Type 6’s and Type 7’s. The Type 3’s being the oldest machines in<br />
the fleet. There are 120 of them and we currently are in a replacement program for those that will take approximately 9 months to complete. The<br />
replacement fleet are Type 6’s and will improve reliability and reduce labor time spent repairing the old fleet and the components within the<br />
machine.<br />
The agency has a large inventory of camera equipment in the ROW and at Park and Rides. All of these cameras require preventative maintenance.<br />
The cameras are split into two technologies, digital and analog. The analog units are aged and have met their useful life. A replacement plan is<br />
being developed to replace the analog equipment with digital units. The replacement program will span up to three years and will develop a priority<br />
rating for cameras needing upgrades first.<br />
Key <strong>Asset</strong> <strong>Management</strong> Performance Indicators/Goals<br />
Measurement of PM compliance that is above 80% for completion percentage indicates that the system is operational without any immediate<br />
defects that require trains to be re‐routed. When measurement is below 80% on a consistent month to month basis, the State of Good Repair<br />
becomes questionable and replacement/improvements need to be addressed. Fare machines also are measured in reliability over time. The goal is<br />
to always be above 92% reliable for a given time period.<br />
How <strong>Asset</strong> is Maintained and Condition Evaluated<br />
<strong>Asset</strong>s in this discipline are mechanical and not electrical in nature. The PM routine is visual inspection and adjustment of the mechanical attributes<br />
of the switches. In order to assess condition and determine replacement/rehabilitation times accurately, measurement of all aspects of the rail has<br />
been performed by a geometry car. This measurement will be performed every two years to determine the rate of wear of the rail and to analyze<br />
various conditions of the rail structure such as line and grade, rail wear and movement and structural condition of the ballast infrastructure.<br />
Maintenance Activity Equipment Unit<br />
A Inspection Room/Cases Comm 65 Locations<br />
B Inspection Room/Cases Comm 65 Locations<br />
C Inspection Tunnel Room/Cases 65 Locations<br />
D Inspection<br />
Tunnel Equipment<br />
E Inspection Equipment<br />
Page ‐ 137
<strong>Capital</strong> <strong>Asset</strong> <strong>Management</strong> & <strong>Investment</strong> Program Technology Systems Fare Systems<br />
How <strong>Asset</strong> is Maintained and Condition Evaluated (continued)<br />
Maintenance Activity Equipment Unit<br />
G Inspection PLC Inspections 50 Locations<br />
H Inspection TTY Phones on Bridges 52 Locations<br />
J Inspection Equipment<br />
K Inspection Cameras 524 Total<br />
Monthly TVM 220 Locations<br />
Annual TVM 220 Locations<br />
Condition Scale<br />
The condition rating scale is as follows:<br />
1 – <strong>Asset</strong> is newly put into service and warranty is in effect.<br />
2 – Warranty has expired and no defects/wear has been identified during PM cycle<br />
3 – Slight wear evident, PM cycle shows no defects<br />
4 – Excess wear, defects require attention beyond PM cycle<br />
5 – <strong>Asset</strong> is out of service and can no longer function safely<br />
The fare system is between a Condition 3 and Condition 4. At the completion of the replacement program of the Type 3 TVM’s the condition<br />
will be between Condition 2 and Condition 3. The replacement program will be complete July 2013.<br />
Level of Criticality<br />
The level of criticality for this discipline is applied to the following items:<br />
Safety<br />
Service Reliability, Risk of Degradation<br />
Economic Life of the <strong>Asset</strong><br />
Level of Service <strong>Investment</strong><br />
High<br />
Medium<br />
Low<br />
Low<br />
Mid‐Life Overhaul Program<br />
Mid Life overhaul (replacement) of the Type 3 ticket machines is currently in progress. Components within the TVM, ie Bill Acceptor, Coin<br />
Mechanisms and printers go through a mid‐life overhaul.<br />
<strong>Asset</strong> Replacement Criteria<br />
The condition of Fare equipment dictates the replacement/improvement schedule.<br />
Page ‐ 138
<strong>Capital</strong> <strong>Asset</strong> <strong>Management</strong> & <strong>Investment</strong> Program Technology Systems Fare Systems<br />
Additional Analysis<br />
• None of the Fare equipment is in poor condition.<br />
Fare Equipment<br />
ITEM REQUIRED<br />
PROJECT<br />
MANAGER<br />
ACTION<br />
NEEDED<br />
<strong>FY</strong><br />
NEEDED<br />
YEAR OF<br />
PURCHASE<br />
CURRENT<br />
AGE <strong>FY</strong>14<br />
EST.<br />
DESIGN<br />
LIFESPAN COND. <strong>2014</strong> 2015 2016 2017 2018<br />
<strong>FY</strong>14-<strong>FY</strong>18<br />
TOTAL<br />
FARE EQUIPMENT<br />
Kindig<br />
PANASONIC LAPTOP REPLACE <strong>2014</strong> 2009 5 5 VERY GOOD $1,500 $1,500<br />
TOP MAX EPROM BURNER REPLACE 2016 2001 13 15 GOOD $3,600 $3,600<br />
PACE MBT250 SMD WORKSTATION REPLACE <strong>2014</strong> 2004 10 10 GOOD $2,200 $2,200<br />
HUNTER PULSE GENERATOR REPLACE 2017 2002 12 15 GOOD $3,500 $3,500<br />
WELLER DS800 SOLDER STATION REPLACE 2003 1993 21 10 POOR $1,500 $1,500<br />
BRANSON SONIC CLEANER REPLACE 2017 2002 12 15 VERY GOOD $1,200 $1,200<br />
GRAND TOTAL -- FARE EQUIPMENT. . . . $5,200 $0 $3,600 $4,700 $0 $13,500<br />
Page ‐ 139
<strong>Capital</strong> <strong>Asset</strong> <strong>Management</strong> & <strong>Investment</strong> Program Technology Systems Security Equipment Systems<br />
<strong>Asset</strong> Category – Technology Systems – Security Equipment Systems<br />
Networked CCTV System<br />
The Networked Closed Circuit Television (CCTV) system was installed primarily on MAX light rail platforms, but also at <strong>TriMet</strong> operating facilities,<br />
over a period of years beginning in 1997. Early installations were performed under the Westside light rail project and covered all elevator‐equipped<br />
MAX stations. The Interstate MAX project funded CCTV installations at its stations. Beginning in 2005, a series of annual Homeland Security grants<br />
were used to install CCTV at all other MAX stations. In addition, the Mall/I‐205 MAX project included local funding for CCTV at Mall MAX stations.<br />
All installations prior to mid‐2012 were analog technology, whereas installations after mid‐2012 are digital IP technology. Although installation<br />
across the entire MAX system will be completed in 2013, a new, ongoing program of system upgrade will be needed going forward, providing for<br />
end‐of‐life replacement of prior‐technology components (e.g. analog) with current‐technology components (digital IP), and will include installations<br />
of additional CCTV cameras as‐needed for security enhancement.<br />
TABLE SECURITY EQUIPMENT SYSTEMS<br />
ITEM REQUIRED<br />
(information as of 10/2012)<br />
Networked CCTV System<br />
QUANTITY<br />
ACTION<br />
NEEDED<br />
CCTV cameras (Light Rail/P&R) 1 744 System<br />
Upgrade<br />
CCTV cameras (Project Completion) 2 192<br />
CCTV cameras (<strong>TriMet</strong> facilities) 3 78<br />
CCTV Encoders 142<br />
CCTV Servers 42<br />
CCTV viewing stations 4 10<br />
<strong>FY</strong><br />
NEEDED<br />
<strong>2014</strong>+<br />
ongoing<br />
YEAR OF CURRENT<br />
PURCHASE AGE <strong>FY</strong>14<br />
1997 to 2012 16 to 1 10/15<br />
REPLACEMEN<br />
T<br />
CYCLE COND <strong>2014</strong> 2015 2016 2017 2018<br />
Good-2<br />
to Fair-3<br />
Total Networked CCTV System. . . .<br />
<strong>FY</strong>14-<strong>FY</strong>18<br />
TOTAL<br />
$125,000 $250,000 $250,000 $250,000 $250,000 $1,125,000<br />
$125,000 $250,000 $250,000 $250,000 $250,000 $1,125,000<br />
NOTES:<br />
1. CCTV cameras on‐line at light rail stations and park‐rides (73 of 86 stations as of 10/2012 – includes tunnel & bridge portals.<br />
2. CCTV cameras to complete installations at remaining 13 light rail stations.<br />
3. CCTV cameras on‐line at <strong>TriMet</strong> facilities.<br />
4. CCTV viewing stations include: 2 – Security Department, 2 – Claims, 1 per Bus Transportation Garage, 1 per REM Facility, 1 – Bus Maintenance.<br />
5. Represent's exhaustion of F<strong>FY</strong>10 Homeland Security grant for MAX CCTV retrofit, which is the last in the series of such grants ($125,000 carryover to <strong>FY</strong>14).<br />
Vehicle‐Borne CCTV Systems<br />
In the late 1990's, <strong>TriMet</strong> installed CCTV on an initial fleet of buses and on its Light Rail Vehicle (LRV) fleet at the time. Subsequently, CCTV was<br />
included in orders of new replacement buses, and procurement of additional LRVs under light rail extension projects, as well as on the WES DMU<br />
vehicles.<br />
All vehicle‐borne CCTV installations prior to 2013 are analog technology, whereas all installations after 2012 will be digital IP technology. The digital<br />
Page ‐ 140
<strong>Capital</strong> <strong>Asset</strong> <strong>Management</strong> & <strong>Investment</strong> Program Technology Systems Security Equipment Systems<br />
Vehicle‐Borne CCTV Systems (continued)<br />
IP technology offers the ability to off‐load incident video from a specific bus or LRV via yard wi‐fi, more efficiently than the traditional data‐pak<br />
process, and in the future is expected to enable secure live‐streaming of incident video to responding police cars. Moreover, after 2013, suppliers of<br />
vehicle‐borne CCTV systems will no longer support analog technology legacy equipment. Therefore, a multi‐year project to replace/upgrade<br />
<strong>TriMet</strong>'s vehicle‐borne CCTV equipment systems is needed over the <strong>FY</strong>s14‐18 period. (<strong>TriMet</strong>'s oldest CCTV‐equipped buses will not be included in<br />
the project, since they will be replaced during this time period with new buses equipped with new digital IP CCTV.) Order of magnitude cost<br />
estimate for the project is $6,000 per bus x 300 buses, and $12,000 per LRV x 127 LRVs, for replacing analog CCTV with digital IP equipment, and<br />
replacing current coax cabling with CAT‐5 cabling; total $1,800,000 bus + $1,524,000 MAX.<br />
TABLE S ECURITY EQUIPMENT SYSTEMS<br />
ITEM REQUIRED<br />
(information as of 10/2012) QUANTITY<br />
ACTION<br />
NEEDED<br />
Vehicle-Borne CCTV Systems<br />
CCTV cameras (bus) 1 1,570 System<br />
Upgrade<br />
On-board CCTV recorders (bus) 371<br />
CCTV cameras (LRVs) 2 963<br />
On-board CCTV recorders (LRV)<br />
127<br />
CCTV cameras (WES) 3 28<br />
On-board CCTV recorders (WES)<br />
4<br />
Data-Paks 740<br />
<strong>FY</strong><br />
NEEDED<br />
YEAR OF CURRENT<br />
PURCHASE AGE <strong>FY</strong>14<br />
<strong>2014</strong>+<br />
ongoing 1999 to 2012 14 to 1 10/15 Good-2<br />
to Fair-3<br />
OPTIMUM<br />
REPLACEMENT<br />
CYCLE COND <strong>2014</strong> 2015 2016 2017 2018<br />
<strong>FY</strong>14-<strong>FY</strong>18<br />
TOTAL<br />
$664,800 $664,800 $664,800 $664,800 $664,800 $3,324,000<br />
Total Vehicle-Borne CCTV Systems. . . . $664,800 $664,800 $664,800 $664,800 $664,800 $3,324,000<br />
NOTES:<br />
1. CCTV cameras installed on fixed‐route bus fleet (as of 10/2012, 371 of 595 active fleet buses are equipped with CCTV, with 3 to 7 cameras per bus).<br />
2. CCTV cameras installed on light rail vehicle fleet (all 127 LRVs are equipped with CCTV, with 4 to 10 cameras per LRV, including rearview).<br />
3. CCTV cameras installed on WES vehicle fleet (4 of 6 WES vehicles are equipped with CCTV, with 7 cameras each including rearview).<br />
Page ‐ 141
<strong>Capital</strong> <strong>Asset</strong> <strong>Management</strong> & <strong>Investment</strong> Program Technology Systems Security Equipment Systems<br />
MAX Intrusion Detection System<br />
Current‐era best‐technology for intrusion detection systems are CCTV‐based intelligent video systems. This will be the type of intrusion detection<br />
system installed on the Willamette River Transit Bridge and Harbor Structure under the PMLR light rail extension project. Replacement/upgrade of<br />
<strong>TriMet</strong>'s existing MAX intrusion detection systems is planned to follow the PMLR installations, in <strong>FY</strong>s16‐17. Order‐of‐magnitude cost estimate for<br />
the upgrade is $5,000 per portal.<br />
TABLE SECURITY EQUIPMENT SYSTEMS<br />
ITEM REQUIRED<br />
(information as of 10/2012)<br />
MAX Intrusion Detection Systems<br />
QUANTITY<br />
ACTION<br />
NEEDED<br />
Robertson Tunnel 1 8 System<br />
Upgrade<br />
Vanport Bridge 2 2<br />
I-205/Division 3 2<br />
<strong>FY</strong><br />
NEEDED<br />
YEAR OF CURRENT<br />
PURCHASE AGE <strong>FY</strong>14<br />
2016 1999 to 2009 14 to 4 10/15<br />
OPTIMUM<br />
REPLACEMENT<br />
CYCLE COND <strong>2014</strong> 2015 2016 2017 2018<br />
Good-2 to<br />
Fair-3<br />
<strong>FY</strong>14-<strong>FY</strong>18<br />
TOTAL<br />
$60,000 $60,000<br />
Total MAX Intrusion Detection Systems. . . . $0 $0 $60,000 $0 $0 $60,000<br />
NOTES:<br />
1. Robertson Tunnel Intrusion Detection includes infrared motion detectors, logic controller, alarm lights and audio, interface to Rail OCC, supplemented by CCTV; at each of 8<br />
tunnel portals.<br />
2. Vanport Bridge Intrusion Detection includes infrared laser scanning detection, alarm lights and audio, interface to Rail OCC, supplemented by CCTV; at each end of bridge.<br />
3. I‐205/Division Undercrossing Intrusion Detection includes infrared laser scanning detection, alarm lights and audio, interface to Rail OCC; at each end of the undercrossing.<br />
<strong>TriMet</strong> Facilities Access Control System (TRACS)<br />
"Add and Replace": Equip additional doors and gates at <strong>TriMet</strong> facilities, as‐needed to improve security. Replace end‐of‐life components of the<br />
TRACS system as‐needed.<br />
TABLE SECURITY EQUIPMENT SYSTEMS<br />
ITEM REQUIRED<br />
(information as of 10/2012)<br />
<strong>TriMet</strong> Facilities Access Control<br />
System (TRACS)<br />
QUANTITY<br />
Door and gate TRACS readers 373<br />
TRACS Server 1<br />
etc.<br />
ACTION<br />
NEEDED<br />
Add and<br />
Replace<br />
<strong>FY</strong><br />
NEEDED<br />
YEAR OF CURRENT<br />
PURCHASE AGE <strong>FY</strong>14<br />
REPLACEMEN<br />
T<br />
CYCLE COND <strong>2014</strong> 2015 2016 2017 2018<br />
<strong>FY</strong>14-<br />
<strong>FY</strong>18<br />
TOTAL<br />
<strong>2014</strong>+<br />
ongoing 1997 to 2012 16 to 1 10/20 good-2 $20,000 $20,000 $20,000 $20,000 $20,000 $100,000<br />
Total <strong>TriMet</strong> Facilities Access Control System (TRACS). . . .<br />
$20,000 $20,000 $20,000 $20,000 $20,000 $100,000<br />
Page ‐ 142
<strong>Capital</strong> <strong>Asset</strong> <strong>Management</strong> & <strong>Investment</strong> Program Technology Systems Technology Equipment Systems<br />
<strong>Asset</strong> Category – Technology Systems – Technology Equipment Systems<br />
Desktop Systems<br />
The Desktop Systems are broken up into five areas. Following is a brief description of each area along with planned replacements or upgrades. In the<br />
tables that ensue, all condition assessments are based on age of asset or using the following scale:<br />
1 – New or Excellent<br />
2 – Good<br />
3 – Fair<br />
4 – Aging<br />
5 – Replace or Retire<br />
Personal Computer Desktops & Monitors & Networked Printers<br />
Personal Computers (PCs) and Monitors for agency staff are replaced on a five year cycle. Each year 200 PCs, approximately 50 monitors and 25<br />
printers are replaced by IT technicians. New systems usually mean greater memory capacity and improved speed as technology advances. Monitors<br />
and printers are replaced when failure occurs or repair is no longer cost effective. Condition of asset is directly linked to age of asset.<br />
ITC Functional Area Category: IT FOUNDATION FISCAL FISCAL REPLACE- <strong>FY</strong><br />
ITC Subcategory: DESKTOP COMPUTING QTY ACTION YEAR YEAR OF CURRENT MENT CONDITION <strong>FY</strong>14 <strong>FY</strong>15 <strong>FY</strong>16 <strong>FY</strong> 17 <strong>FY</strong>18 <strong>2014</strong>-2018<br />
NEEDED NEEDED PURCHASE AGE CYCLE TOTALS<br />
DESKTOP SYSTEMS<br />
Desktop PC's - estimated replacement cost $ 800 ea. 1000 Upgrade <strong>2014</strong> on going 2009-2012 1 to 5 years 5 years 5 to 1 $ 160,000 $ 160,000 $ 160,000 $ 160,000 $ 160,000 $ 800,000<br />
Desktop Monitors - estimated replacement cost $200 ea. 1000 Upgrade <strong>2014</strong> on going 2009-2012 1 to 5 years 5 years 5 to 1 $ 14,000 $ 14,000 $ 14,000 $ 14,000 $ 14,000 $ 70,000<br />
Network Printers 140 Replace <strong>2014</strong> on going 2009-2012 1 to 5 years 5 years 5 to 1 $ 50,000 $ 50,000 $ 50,000 $ 50,000 $ 50,000 $ 250,000<br />
Desktop Systems Total $ 224,000 $ 224,000 $ 224,000 $ 224,000 $ 224,000 $ 1,120,000<br />
Operating System (OS) Software<br />
Support for the current OS will be terminated by Microsoft in November <strong>2014</strong>. As PCs are replaced, the OS is upgraded to Windows v.7. All<br />
remaining PCs will need to be manually upgraded prior to support termination. Condition of asset is fair.<br />
Virtualization of Shared PCs ‐ There are several PCs throughout the agency that users can log into when they are not at their desk allowing them to<br />
respond to emails or work at different locations. Virtualization of these PCs will make them more usable for staff as they move from location to<br />
location.<br />
Page ‐ 143
<strong>Capital</strong> <strong>Asset</strong> <strong>Management</strong> & <strong>Investment</strong> Program Technology Systems Technology Equipment Systems<br />
Desktop Systems (continued)<br />
ITC Functional Area Category: IT FOUNDATION FISCAL FISCAL REPLACE- <strong>FY</strong><br />
ITC Subcategory: DESKTOP COMPUTING QTY ACTION YEAR YEAR OF CURRENT MENT CONDITION <strong>FY</strong>14 <strong>FY</strong>15 <strong>FY</strong>16 <strong>FY</strong> 17 <strong>FY</strong>18 <strong>2014</strong>-2018<br />
NEEDED NEEDED PURCHASE AGE CYCLE TOTALS<br />
Operating System (OS) Software<br />
Virtualization of Shared PCs Upgrade <strong>2014</strong> unknown $ 50,000<br />
$ 50,000<br />
Upgrade to Windows 7 Upgrade <strong>2014</strong> 2004 9 varies 3 $ 250,000<br />
$ 250,000<br />
Operating System (OS) Software Total $ 300,000 $ - $ - $ - $ - $ 300,000<br />
Rail Control Desktops<br />
Rail Control systems, like agency systems, are on a 5 year replacement schedule. The rail system, due to its critical function, has additional<br />
requirements. Remote systems are provided at rail stations for operators to report for work and print out train orders. Special monitors for training and<br />
control stations are used to display the unique rail control system.<br />
ITC Functional Area Category: IT FOUNDATION FISCAL FISCAL REPLACE- <strong>FY</strong><br />
ITC Subcategory: DESKTOP COMPUTING QTY ACTION YEAR YEAR OF CURRENT MENT CONDITION <strong>FY</strong>14 <strong>FY</strong>15 <strong>FY</strong>16 <strong>FY</strong> 17 <strong>FY</strong>18 <strong>2014</strong>-2018<br />
NEEDED NEEDED PURCHASE AGE CYCLE TOTALS<br />
Rail Control Desktops<br />
PC's ( P4 2.4 GHZ's ) Rail Control $800 ea. 19 Upgrade 2018 2013 0 5 years 1 $ 15,200 $ 15,200<br />
PC's ( P4 2.4 GHZ's ) Remote Workstations $800 ea. 15 Upgrade 2018 2013 0 5 years 1 $ 12,000 $ 12,000<br />
Tools Laptop 1 Upgrade 2018 2013 0 5 years 1 $ 1,500 $ 1,500<br />
Remote Workstation Monitors 19 Replace 2021 2012 1 9 years 1 $<br />
-<br />
Samsung 570DX 17 Replace 2015 2008 5 7 years 2 $ 128,000<br />
$ 128,000<br />
46" Samsung overview 2 Replace 2017 2009 4 8 years 3 $ 3,000<br />
$ 3,000<br />
30" Samsung overview 2 Replace 2017 2009 4 8 years 3 $ 2,500<br />
$ 2,500<br />
23" Training Room Monitors 16 Replace 2015 2008 5 8 years 5 $ 12,800<br />
$ 12,800<br />
20.1" Rail Control Dual Monitors 31 Replace 2022 2013 0 9 years 1 $<br />
-<br />
Remote Workstation Printers - 600.00 each 15 Replace 2018 2013 0 5 years 1 $ 9,000 $ 9,000<br />
Training room/Control Printers 1000.00 each 4 Replace 2018 2013 0 5 years 1 $ 4,000 $ 4,000<br />
Rail Control Desktops Totals $ - $ 140,800 $ - $ 5,500 $ 41,700 $ 188,000<br />
CCTV System Desktops<br />
Systems specific to monitoring the CCTV cameras are provided in Dispatch and Control as well as at various security locations. These systems are on the<br />
same 5 year replacement schedule as agency systems.<br />
ITC Functional Area Category: IT FOUNDATION FISCAL FISCAL REPLACE- <strong>FY</strong><br />
ITC Subcategory: DESKTOP COMPUTING QTY ACTION YEAR YEAR OF CURRENT MENT CONDITION <strong>FY</strong>14 <strong>FY</strong>15 <strong>FY</strong>16 <strong>FY</strong> 17 <strong>FY</strong>18 <strong>2014</strong>-2018<br />
NEEDED NEEDED PURCHASE AGE CYCLE TOTALS<br />
CCTV System Desktops<br />
PC's ( P4 2.4 GHZ's ) Dispatch/Control 9 Replace <strong>2014</strong> 2009 4 5 years 4 $ 7,200<br />
$ 7,200<br />
20.1" LCD Monitor 18 Replace <strong>2014</strong> 2009 4 5 years 4 $ 5,400<br />
$ 5,400<br />
CCTV System Desktops Totals $ 12,600 $ - $ - $ - $ - $ 12,600<br />
Page ‐ 144
<strong>Capital</strong> <strong>Asset</strong> <strong>Management</strong> & <strong>Investment</strong> Program Technology Systems Technology Equipment Systems<br />
Desktop Systems (continued)<br />
Maintenance System Desktops<br />
Maintenance systems are used for vehicle diagnosis and viewing of the online parts catalog. Items are on a 5 year replacement schedule.<br />
ITC Functional Area Category: IT FOUNDATION FISCAL FISCAL REPLACE- <strong>FY</strong><br />
ITC Subcategory: DESKTOP COMPUTING QTY ACTION YEAR YEAR OF CURRENT MENT CONDITION <strong>FY</strong>14 <strong>FY</strong>15 <strong>FY</strong>16 <strong>FY</strong> 17 <strong>FY</strong>18 <strong>2014</strong>-2018<br />
NEEDED NEEDED PURCHASE AGE CYCLE TOTALS<br />
Maintenance Desktop Systems<br />
PCs on Carts - 800.00 each 10 Replace 2016 2011 2 5 years 2 $ 8,000<br />
$ 8,000<br />
Maintenance Laptops (1500.00 ea) 18 Replace 2018 2013 0 5 years 1 $ 27,000 $ 27,000<br />
Maintenance Laptops (1500.00 ea) 20 Replace <strong>2014</strong> 2009 4 5 years 4 $ 30,000<br />
$ 30,000<br />
Maintenance Laptops (1500.00 ea) 18 Replace 2015 2010 3 5 years 3 $ 27,000<br />
$ 27,000<br />
Maintenance Laptops (1500.00 ea) 27 Replace 2016 2011 2 5 years 2 $ 40,500<br />
$ 40,500<br />
Maintenance Laptops (1500.00 ea) 15 Replace 2017 2012 1 5 years 1 $ 22,500<br />
$ 22,500<br />
Maintenance Desktop Systems Total $ 30,000 $ 27,000 $ 48,500 $ 22,500 $ 27,000 $ 155,000<br />
TOTAL FOR ALL DESKTOP SYSTEMS<br />
ITC Functional Area Category: IT FOUNDATION<br />
<strong>FY</strong><strong>2014</strong>-2018<br />
<strong>FY</strong>14 <strong>FY</strong>15 <strong>FY</strong>16 <strong>FY</strong> 17 <strong>FY</strong>18<br />
ITC Subcategory: DESKTOP COMPUTING<br />
TOTALS<br />
DESKTOP SYSTEMS TOTAL $ 566,600 $ 391,800 $ 272,500 $ 252,000 $ 292,700 $ 1,775,600<br />
Page ‐ 145
<strong>Capital</strong> <strong>Asset</strong> <strong>Management</strong> & <strong>Investment</strong> Program Technology Systems Technology Equipment Systems<br />
Server <strong>Capital</strong><br />
<strong>TriMet</strong>'s Servers are the foundation for all the applications and data that make the agency run. Major applications and systems that run on these<br />
servers include Oracle HR and Payroll, Oracle Financials and Accounts Payable, Maintenance <strong>Management</strong> Information System (MMIS), Facilities<br />
<strong>Management</strong> Information System (FMIS), AIM ‐ Rail Control, Dispatch (CAD/AVL), Exchange Email, Hastus Scheduling, LIFT Reservation, Mapping<br />
applications, Web services, Intranet services, CCTV and storage for all the data these systems produce. Most of the equipment is on a 5 year<br />
replacement schedule.<br />
SUMMARY OF SERVERS<br />
<strong>FY</strong>14 <strong>FY</strong>15 <strong>FY</strong>16 <strong>FY</strong>17 <strong>FY</strong>18 <strong>FY</strong><strong>2014</strong>-2018<br />
TOTALS<br />
Oracle Database Servers $ 240,000 $ - $ 165,000 $ 23,500 $ 2,000 $ 430,500<br />
Oracle Development Servers 60,000 - 14,000 15,000 - 89,000<br />
SQL and IIS database server - 10,000 - - - 10,000<br />
ATIS- trip planner - - - - 19,600 19,600<br />
Hastus - - - - 9,000 9,000<br />
Tabs + - - - - 12,000 12,000<br />
Trapeze4 - PASS - 26,000 - - - 26,000<br />
Fare Systems 6,500 - 21,250 25,000 - 52,750<br />
Rail Control System (AIM) 10,000 16,000 21,000 - 4,500 51,500<br />
Rail Communication Servers - - - - 20,000 20,000<br />
Rail Large Panel Overview Servers - - - - 30,000 30,000<br />
Rail Terminal Servers - - - - 27,000 27,000<br />
Rail Time Servers - 7,000 - - - 7,000<br />
Rail Audio / Video 7,000 - - - - 7,000<br />
CCTV Storage Systesm - - 180,000 - - 180,000<br />
CCTV Digital Video Recorders - - 21,000 36,500 31,500 89,000<br />
ASA System - - - - - -<br />
Network Backup - 330,000 23,000 206,500 9,000 568,500<br />
File Storage - - - - 200,000 200,000<br />
Domain Controllers 5,000 20,000 5,000 - - 30,000<br />
Faxing - - - 6,000 5,500 11,500<br />
Security System 6,500 - - - 5,000 11,500<br />
Virtual Servers - - - 87,500 220,500 308,000<br />
E-Mail systems 7,000 - 7,000 10,000 25,000 49,000<br />
IT Infrastructure and Monitoring 7,000 - 32,000 35,000 18,500 92,500<br />
<strong>TriMet</strong> Web - - - - 24,000 24,000<br />
GIS - - 12,000 - 30,000 42,000<br />
TriNet 7,000 - - 7,000 7,000 21,000<br />
Remote KVM and Power - - - 54,000 - 54,000<br />
SERVERS TOTAL $ 356,000 $ 409,000 $ 501,250 $ 506,000 $ 700,100 $ 2,472,350<br />
A more detailed breakdown of the servers may be found in the Appendix section of this document under Technology Equipment Systems.<br />
Page ‐ 146
<strong>Capital</strong> <strong>Asset</strong> <strong>Management</strong> & <strong>Investment</strong> Program Technology Systems Technology Equipment Systems<br />
Cable Plant<br />
Cable plant covers all low voltage wiring in <strong>TriMet</strong> facilities and network cabling that link the facilities together in a communications ring. The yearly<br />
budget allotment is earmarked for maintenance, repair and improvement.<br />
ITC Functional Area Category: IT FOUNDATION Qty FISCAL REPLACE- <strong>FY</strong><br />
ITC Subcategory: CABLE PLANT YEAR OF ACTION YEAR MENT <strong>2014</strong> - 2018<br />
PURCHASE NEEDED NEEDED CYCLE <strong>2014</strong> 2015 2016 2017 2018 TOTALS<br />
Cable Plant<br />
Cable Plant Voice & Data - Core Systems Varies Varies Replace <strong>2014</strong> Varies $ 80,000 $ 50,000 $ 30,000 $ 30,000 $ 30,000 $ 220,000<br />
Cable Plant TOTAL $ 80,000 $ 50,000 $ 30,000 $ 30,000 $ 30,000 $ 220,000<br />
Data Communications<br />
Routers, switches and wireless access points are what allows the various elements (PCs, telephones, fax machines, printers) of the WAN and LAN to<br />
"talk" to each other. Replacement schedules on these devices vary from 4 years to 10 or more years.<br />
SUMMARY OF DATA<br />
<strong>FY</strong>14 <strong>FY</strong>15 <strong>FY</strong>16 <strong>FY</strong>17 <strong>FY</strong>18 <strong>FY</strong><strong>2014</strong>-2018<br />
COMMUNICATIONS<br />
TOTALS<br />
Switches & Routers $ 123,000 $ 146,200 $ 275,200 $ 793,000 $ 456,300 $ 1,793,700<br />
Remote Access 56,000 6,000 6,000 6,000 6,000 80,000<br />
Wireless Network 129,000 34,100 115,000 36,000 10,000 324,100<br />
<strong>Management</strong> Tools 20,000 40,500 20,000 9,000 - 89,500<br />
DATA COMMUNICATIONS TOTAL $ 328,000 $ 226,800 $ 416,200 $ 844,000 $ 472,300 $ 2,287,300<br />
A more detailed breakdown of the servers may be found in the Appendix section of this document under Technology Equipment Systems.<br />
Page ‐ 147
<strong>Capital</strong> <strong>Asset</strong> <strong>Management</strong> & <strong>Investment</strong> Program Technology Systems Technology Equipment Systems<br />
Voice Systems<br />
In 2008, <strong>TriMet</strong> replaced their voice system with VOIP technology. This equipment provides all telephone, voice mail and voice recording to the<br />
agency. Condition is based on age.<br />
ITC Functional Area: IT FOUNDATION Qty FISCAL REPLACE- CURRENT <strong>FY</strong><br />
ITC Subcategory: VOICE SYSTEMS YEAR OF ACTION YEAR MENT AGE CONDITION <strong>FY</strong> <strong>FY</strong> <strong>FY</strong> <strong>FY</strong> <strong>FY</strong> <strong>2014</strong>-2018<br />
PURCHASE NEEDED NEEDED CYCLE <strong>2014</strong> 2015 2016 2017 2018 TOTALS<br />
Telephone Service<br />
Center - PRI Gateway - Cisco 3845 T1 Router 1 2008 Replace <strong>2014</strong> 5 5 5 $18,000 $18,000<br />
Center - PRI Gateway - Cisco 3845 T1 Router 1 2008 Replace <strong>2014</strong> 5 5 5 $18,000 $18,000<br />
Center - Telephone Service - Cisco Unified Communications Manager 1 2008 Replace <strong>2014</strong> 5 5 5 $13,000 $13,000<br />
Center - Telephone Service - Cisco Unified Communications Manager 1 2008 Replace <strong>2014</strong> 5 5 5 $13,000 $13,000<br />
Nela - PRI Gateway - Cisco 3845 T1 Router 1 2008 Replace <strong>2014</strong> 5 5 5 $18,000 $18,000<br />
Nela - Telephone Service - Cisco Unified Communications Manager 1 2008 Replace <strong>2014</strong> 5 5 5 $13,000 $13,000<br />
Ruby - PRI Gateway - Cisco 3845 T1 Router 1 2008 Replace <strong>2014</strong> 5 5 5 $18,000 $18,000<br />
Ruby - Telephone Service - Cisco Unified Communications Manager 1 2008 Replace <strong>2014</strong> 5 5 5 $13,000 $13,000<br />
VOIP Phones & Analog Converters N/A N/A Replace <strong>2014</strong> N/A $30,000 $30,000 $30,000 $30,000 $30,000 $150,000<br />
Port/Memory Expansion Varies N/A Upgrade <strong>2014</strong> N/A $10,000 $10,000 $10,000 $10,000 $10,000 $50,000<br />
Total Telephone Service: $164,000 $40,000 $40,000 $40,000 $40,000 $324,000<br />
Voicemail Service<br />
Center - Voicemail - Cisco Unity Voice Mail Server 1 2009 Replace 2015 5 4 4 $13,000 $13,000<br />
Total Voicemail Service: $0 $13,000 $0 $0 $0 $13,000<br />
Other Voice Services<br />
Center - 238-RIDE & CAB - Cisco 7845 IPCC IVR 1 2009 Replace <strong>2014</strong> 4 4 5 $13,000 $13,000<br />
Center - 238-RIDE & CAB - Cisco 7845 IPCC IVR 1 2009 Replace <strong>2014</strong> 4 4 5 $13,000 $13,000<br />
Center - Emergency Responder Service - Emergency Responder Appliance 1 2011 Replace 2017 5 2 2 $3,800 $3,800<br />
Center - Emergency Responder Service - Emergency Responder Appliance 1 2011 Replace 2017 5 2 2 $3,800 $3,800<br />
Center - Call Reporting - Call Detail Reporting Software 1 2008 Replace <strong>2014</strong> 5 5 5 $25,000 $25,000<br />
Center - Telephone Recording - Carin Audio Recording Software 1 2009 Replace 2020 10 4 2 $0<br />
Center - Telephone Recording - Carin Audio Recording Storage System 1 2009 Replace 2015 5 4 4 $10,000 $10,000<br />
Center - Telephone Recording - Carin Central Audio Recording Server 1 2009 Replace 2015 5 4 4 $8,000 $8,000<br />
Center - Telephone Recording - Carin Local Audio Recording Server 1 2009 Replace 2015 5 4 4 $8,000 $8,000<br />
Center - Telephone Recording - Carin Local Audio Recording Server 1 2009 Replace 2015 5 4 4 $8,000 $8,000<br />
Nela - Call Center ACD - Cisco 7845 IPCC IVR 1 2008 Replace <strong>2014</strong> 5 5 5 $13,000 $13,000<br />
Nela - Call Center ACD - Cisco 7845 IPCC IVR 1 2008 Replace <strong>2014</strong> 5 5 5 $13,000 $13,000<br />
Nela - Call Center ACD - Wallboard Displays 4 2009 Replace 2015 5 4 4 $8,000 $8,000<br />
Total Other Voice Services: $77,000 $42,000 $0 $7,600 $0 $126,600<br />
Voice Systems TOTAL $241,000 $95,000 $40,000 $47,600 $40,000 $463,600<br />
Page ‐ 148
<strong>Capital</strong> <strong>Asset</strong> <strong>Management</strong> & <strong>Investment</strong> Program Technology Systems Technology Equipment Systems<br />
IT Security<br />
The security category of Technology CIP encompasses the firewalls which protect our network and sensors for intrusion detection. Condition of<br />
equipment is based on age.<br />
ITC Functional Area Category: IT FOUNDATION Qty FISCAL REPLACE- CURRENT <strong>FY</strong><br />
ITC Subcategory: IT SECURITY YEAR OF ACTION YEAR MENT AGE CONDITION <strong>FY</strong>14 <strong>FY</strong>15 <strong>FY</strong>16 <strong>FY</strong>17 <strong>FY</strong>18 <strong>2014</strong>-2018<br />
PURCHASE NEEDED NEEDED CYCLE TOTALS<br />
Center - Comm System Security - Cisco Access Control System SW 1 2008 Replace <strong>2014</strong> 5 5 3 $ 12,000<br />
$ 12,000<br />
Center - Comm System Security - Cisco Access Control System SW 1 2008 Replace <strong>2014</strong> 5 5 3 $ 12,000<br />
$ 12,000<br />
Center - Comm System Security - Cisco ASA 5505 Firewall 1 2009 Replace 2018 8 4 3 $ 1,000 $ 1,000<br />
Center - Comm System Security - Cisco ASA 5505 Firewall 1 2009 Replace 2018 8 4 3 $ 1,000 $ 1,000<br />
Center - Comm System Security - Cisco ASA 5505 Firewall 1 2009 Replace 2018 8 4 3 $ 1,000 $ 1,000<br />
Center - Comm System Security - Cisco ASA 5505 Firewall 1 2009 Replace 2018 8 4 3 $ 1,000 $ 1,000<br />
Center - Comm System Security - Cisco ASA 5505 Firewall 1 2009 Replace 2018 8 4 3 $ 1,000 $ 1,000<br />
Center - Comm System Security - Cisco ASA 5505 Firewall 1 2009 Replace 2018 8 4 3 $ 1,000 $ 1,000<br />
Center - Comm System Security - Cisco ASA 5505 Firewall 1 2009 Replace 2018 8 4 3 $ 1,000 $ 1,000<br />
Center - Comm System Security - Cisco ASA 5505 Firewall 1 2009 Replace 2018 8 4 3 $ 1,000 $ 1,000<br />
Center - Comm System Security - Cisco ASA 5505 Firewall 1 2009 Replace 2018 8 4 3 $ 1,000 $ 1,000<br />
Center - Comm System Security - Cisco ASA 5505 Firewall 1 2009 Replace 2018 8 4 3 $ 1,000 $ 1,000<br />
Center - Comm System Security - Cisco ASA 5505 Firewall 1 2009 Replace 2018 8 4 3 $ 1,000 $ 1,000<br />
Center - Comm System Security - Cisco ASA 5505 Firewall 1 2009 Replace 2018 8 4 3 $ 1,000 $ 1,000<br />
Center - Comm System Security - Cisco ASA 5505 Firewall 1 2009 Replace 2018 8 4 3 $ 1,000 $ 1,000<br />
Center - Comm System Security - Cisco ASA 5505 Firewall 1 2009 Replace 2018 8 4 3 $ 1,000 $ 1,000<br />
Center - Comm System Security - Cisco ASA 5505 Firewall 1 2009 Replace 2018 8 4 3 $ 1,000 $ 1,000<br />
Center - Comm System Security - Cisco ASA 5505 Firewall 1 2009 Replace 2018 8 4 3 $ 1,000 $ 1,000<br />
Center - Comm System Security - Cisco ASA 5505 Firewall 1 2009 Replace 2018 8 4 3 $ 1,000 $ 1,000<br />
Center - Comm System Security - Cisco ASA 5505 Firewall 1 2009 Replace 2018 8 4 3 $ 1,000 $ 1,000<br />
Center - Comm System Security - Cisco ASA 5540 Firewall 1 2009 Replace 2018 8 4 3 $ 11,000 $ 11,000<br />
Center - Comm System Security - Cisco ASA 5540 Firewall 1 2009 Replace 2018 8 4 3 $ 11,000 $ 11,000<br />
Center - Comm System Security - Cisco IPS 4240 Module 1 2004 Replace 2015 10 9 4 $ 7,200<br />
$ 7,200<br />
Center - Comm System Security - Cisco IPS 4240 Module 1 2004 Replace 2015 10 9 4 $ 7,200<br />
$ 7,200<br />
Center - Comm System Security - Cisco MARS Security Appliance 1 2008 Replace <strong>2014</strong> 5 5 3 $ 53,000<br />
$ 53,000<br />
Center - Comm System Security - Cisco Security Manager SW 1 2008 Replace <strong>2014</strong> 5 5 3 $ 4,000<br />
$ 4,000<br />
Center - Internet Security - Cisco 4260 IPS Sensor 1 2008 Replace 2019 10 5 3 $ -<br />
Center - Internet Security - Cisco 4260 IPS Sensor 1 2008 Replace 2019 10 5 3 $ -<br />
Center - Internet Security - Cisco ASA 5540 Firewall 1 2006 Replace 2015 8 7 2 $ 11,000<br />
$ 11,000<br />
Center - Internet Security - Cisco ASA 5540 Firewall 1 2006 Replace 2015 8 7 2 $ 11,000<br />
$ 11,000<br />
Center - ITS Network Security - Cisco IPS 4240 Module 1 2010 Replace 2021 10 3 4 $ -<br />
Center - PCI System Security - Cisco ASA 5510 Firewall 1 2009 Replace 2018 8 4 3 $ 5,000 $ 5,000<br />
Center - PCI System Security - Cisco ASA 5510 Firewall 1 2009 Replace 2018 8 4 3 $ 5,000 $ 5,000<br />
Center - Remote Access Services - Cisco PIX 525 firewall 1 2010 Replace 2019 8 3 4 $ -<br />
Center - Remote Access Services - Cisco PIX 525 firewall 1 2010 Replace 2019 8 3 4 $ -<br />
Holladay - Intrusion Prevention - Cisco 4260 IPS Sensor 1 2008 Replace 2019 10 5 3 $ -<br />
Nela - Intrusion Prevention - Cisco 4260 IPS Sensor 1 2008 Replace 2019 10 5 3 $ -<br />
Ruby - Comm System Security - Cisco ASA 5520 Firewall 1 2009 Replace 2018 8 4 3 $ 8,000 $ 8,000<br />
Ruby - Comm System Security - Cisco ASA 5520 Firewall 1 2009 Replace 2018 8 4 3 $ 8,000 $ 8,000<br />
Ruby - North - Comm System Security - Cisco IPS 4240 Module 1 2010 Replace 2021 10 3 4 $ -<br />
Center - Spare - Cisco ASA 5505 Firewall 1 2009 Replace 2018 8 4 3 $ 1,000 $ 1,000<br />
Center - Spare - Cisco ASA 5505 Firewall 1 2009 Replace 2018 8 4 3 $ 1,000 $ 1,000<br />
Security Device Memory Upgrades Varies N/A Upgrade <strong>2014</strong> N/A N/A N/A $ 5,000 $ 5,000 $ 5,000 $ 5,000 $ 5,000 $ 25,000<br />
IT Security TOTAL $ 86,000 $ 41,400 $ 5,000 $ 5,000 $ 73,000 $ 210,400<br />
Page ‐ 149
<strong>Capital</strong> <strong>Asset</strong> <strong>Management</strong> & <strong>Investment</strong> Program Technology Systems Technology Equipment Systems<br />
Communications Environment Systems<br />
<strong>TriMet</strong> has a substantial investment in technology and technological equipment. Environmental monitoring equipment is needed to ensure that this<br />
investment is protected from overheating, water, and power disruptions. The Net Guardian provides an alert system notifying personnel when a<br />
threat is perceived. UPS unit ensure that power continues in the event of a power loss to facilities. Condition is based on age.<br />
ITC Functional Area Category: IT FOUNDATION Qty FISCAL REPLACE- <strong>FY</strong><br />
ITC Subcategory: COMMUNICATION ENVIRONMENT SYSTEMS YEAR OF ACTION YEAR MENT CURRENT CONDITION <strong>2014</strong> - 2018<br />
PURCHASE NEEDED NEEDED CYCLE AGE <strong>2014</strong> 2015 2016 2017 2018 TOTALS<br />
Environmental Monitoring<br />
Center - Alarm Reporting - Net Guardian 1 2002 Replace <strong>2014</strong> 11 11 5 $ 5,000<br />
$ 5,000<br />
Elmonica - Alarm Reporting - Net Guardian 1 2002 Replace <strong>2014</strong> 11 11 5 $ 5,000<br />
$ 5,000<br />
Holladay - Alarm Reporting - Net Guardian 1 2002 Replace <strong>2014</strong> 11 11 5 $ 5,000<br />
$ 5,000<br />
Merlo - Alarm Reporting - Net Guardian 1 2002 Replace <strong>2014</strong> 11 11 5 $ 5,000<br />
$ 5,000<br />
Nela - Alarm Reporting - Net Guardian 1 2002 Replace <strong>2014</strong> 11 11 5 $ 5,000<br />
$ 5,000<br />
Powell - Alarm Reporting - Net Guardian 1 2002 Replace <strong>2014</strong> 11 11 5 $ 5,000<br />
$ 5,000<br />
Ruby - Alarm Reporting - Net Guardian 1 2002 Replace <strong>2014</strong> 11 11 5 $ 5,000<br />
$ 5,000<br />
Washington Park - Alarm Reporting - Net Guardian 1 2002 Replace <strong>2014</strong> 11 11 5 $ 5,000<br />
$ 5,000<br />
Total Environmental Monitoring: $ 40,000 $ - $ - $ - $ - $ 40,000<br />
Power Systems<br />
Center - Enterprise UPS - Powerware 9315-160 UPS 1 2000 Replace 2013 12 13 5 $ 150,000<br />
$ 150,000<br />
Center Maint. - Enterprise UPS - APC SUA2200XL UPS 1 2009 Replace 2018 8 4 3 $ 2,500 $ 2,500<br />
Distribution Center - Enterprise UPS - APC SU1000XL UPS 1 2009 Replace 2018 8 4 3 $ 1,000 $ 1,000<br />
Elmonica - Enterprise UPS - APC SURT6000RMXLT3U UPS 1 2009 Replace 2022 12 4 2 $ -<br />
6th St. Facilities Maint. - Enterprise UPS - APC SUA750XL UPS 1 2013 Replace 2022 8 0 1 $ -<br />
Gresham Parking Garage - Alignment UPS - Dual-lite DL1.25K UPS 1 1998 Replace 2007 8 15 5 $ 1,250<br />
$ 1,250<br />
Holgate - Enterprise UPS - APC SURT3000XLT UPS 1 2009 Replace 2018 8 4 3 $ 3,000 $ 3,000<br />
Holladay - Enterprise UPS - Best Unity UPS 1 1996 Retire 2009 12 17 5 $ -<br />
Merlo Admin - Enterprise UPS - APC SUA2200XL UPS 1 2009 Replace 2018 8 4 3 $ 2,500 $ 2,500<br />
Merlo ATP - Enterprise UPS - APC SUA2200XL UPS 1 2009 Replace 2018 8 4 3 $ 2,500 $ 2,500<br />
Merlo Fuel/Wash - Enterprise UPS - APC SUA2200XL UPS 1 2009 Replace 2018 8 4 3 $ 2,500 $ 2,500<br />
Merlo Maint. Electrical Room - Enterprise UPS - APC SUA2200XL UPS 1 2009 Replace 2018 8 4 3 $ 2,500 $ 2,500<br />
Merlo Maint. Sup. Office - Enterprise UPS - APC SU1000XL UPS 1 2009 Replace 2018 8 4 3 $ 1,000 $ 1,000<br />
Nela - Enterprise UPS - MGE 72-169802-42 UPS 1 1998 Replace 2011 12 15 5 $ 80,000<br />
$ 80,000<br />
Powell Admin - Enterprise UPS - APC SUA2200XL UPS 1 2009 Replace 2018 8 4 3 $ 2,500 $ 2,500<br />
Powell Admin Lunchroom - Enterprise UPS - APC SU1000XL UPS 1 2009 Replace 2018 8 4 3 $ 1,000 $ 1,000<br />
Powell ATP - Enterprise UPS - APC SUA3000XL UPS 1 2005 Replace <strong>2014</strong> 8 8 5 $ 3,000<br />
$ 3,000<br />
Ruby North - Enterprise UPS - Powerware 9315-80 UPS 1 2003 Replace <strong>2014</strong> 10 10 5 $ 150,000<br />
$ 150,000<br />
Ruby North - Rail UPS - Powerware 9315-50 UPS 1 2000 Replace 2013 12 13 5 $ 100,000<br />
$ 100,000<br />
Ruby South - Enterprise UPS - APC SUA2200XL UPS 1 2009 Replace 2018 8 4 3 $ 2,500 $ 2,500<br />
Ruby West - Enterprise UPS - APC SUA750XL UPS 1 2009 Replace 2018 8 4 3 $ 750 $ 750<br />
Sunset Parking Garage - Alignment UPS - Emergi-Lite 277SG UPS 1 1998 Replace 2007 8 15 5 $ 7,000<br />
$ 7,000<br />
Sunset Station - Platform UPS - Powerware PLUS 36 UPS 1 2008 Replace 2021 12 5 2 $ -<br />
TMC - Enterprise UPS - APC SUA750XL UPS 1 2009 Replace 2018 8 4 3 $ 750 $ 750<br />
Transit Police - Enterprise UPS - APC SUA2200XL UPS 1 2009 Replace 2018 8 4 3 $ 2,500 $ 2,500<br />
TTO - Enterprise UPS - APC SUA2200XL UPS 1 2010 Replace 2019 8 3 2 $ -<br />
Wilsonville Maint. - Enterprise UPS - APC SU1000XL UPS 1 2009 Replace 2018 8 4 3 $ 1,000 $ 1,000<br />
Zoo - Headhouse UPS - Powerware Plus 160 UPS 1 2003 Replace 2016 12 10 4 $ 128,000<br />
$ 128,000<br />
UPS Unit Network Monitoring Feature Varies N/A Upgrade <strong>2014</strong> N/A $ 15,000<br />
$ 15,000<br />
Battery Replacement/ Expansion Varies N/A Upgrade <strong>2014</strong> N/A $ 10,000 $ 10,000 $ 10,000 $ 10,000 $ 10,000 $ 50,000<br />
Total Power Systems: $ 516,250 $ 10,000 $ 138,000 $ 10,000 $ 38,500 $ 712,750<br />
Communications Environment TOTAL $ 556,250 $ 10,000 $ 138,000 $ 10,000 $ 38,500 $ 752,750<br />
Page ‐ 150
<strong>Capital</strong> <strong>Asset</strong> <strong>Management</strong> & <strong>Investment</strong> Program Technology Systems Technology Equipment Systems<br />
Finance and Admin Systems<br />
The Finance and Admin Systems are broken up into four project areas. Following is a brief description of each project area along with a brief<br />
description:<br />
Finance/Procurement Digital Imaging System – Replacement and upgrade of docuware. System will be used to scan invoices and link in Oracle<br />
Financial system to allow for online approval of invoices. Requires modifications to oracle, provides consultant labor for implementation and<br />
provides replacement scanning equipment.<br />
Union Pay Rates in Oracle Payroll – Currently, pay rates for union employees are not housed in the oracle payroll system. This causes inefficiencies<br />
in processing and potential for errors. This project will allow for consulting labor to update the system to track union pay rates within the source<br />
financial system for payroll, Oracle.<br />
Develop and set up Reorder Point Planning – This project will allow for reorder point planning to automatically occur in the Oracle procurement<br />
system. This will allow for efficiencies in the ordering process projected to allow for cost savings, as emergency orders will decline.<br />
Agency Copier <strong>Capital</strong> Lease – Funding of replacement leases for agency copiers based upon end dates of existing capital leases.<br />
Qty YEAR REPLACE- <strong>FY</strong><br />
FINANCE AND ADMINISTRATION SYSTEMS OF ACTION MENT <strong>2014</strong>-2018<br />
PURCHASE NEEDED CYCLE <strong>FY</strong>14 <strong>FY</strong>15 <strong>FY</strong>16 <strong>FY</strong>17 <strong>FY</strong>18 TOTALS<br />
Finance/Procurement Digital Imaging System 1 2008 Replace 5 $ 600,000<br />
$ 600,000<br />
Union Pay Rates in Oracle Payroll 1 Replace 10 $ 170,000<br />
$ 170,000<br />
Develop and set up Reorder Point Planning 1 Upgrade $ 150,000<br />
$ 150,000<br />
Agency Copier <strong>Capital</strong> Lease Replace 45 $ 360,000<br />
$ 360,000<br />
FINANCE & ADMINISTRATION SYSTEMS TOTAL $ 920,000 $ 360,000 $ - $ - $ - $ 1,280,000<br />
Page ‐ 151
<strong>Capital</strong> <strong>Asset</strong> <strong>Management</strong> & <strong>Investment</strong> Program Technology Systems Technology Equipment Systems<br />
HR Systems<br />
The project request below provides funding for consulting resources in IT to lead and implement both employee and manager self service modules.<br />
Oracle employee self‐service allows employees to view and update their personal information, such as tax withholding, home address and benefits<br />
enrollment information. Manager Self Service gives managers online, real‐time access to the tools and information they need to oversee almost<br />
every aspect of their employees, including pay, performance, and professional development. By streamlining managerial tasks, eliminating<br />
paperwork, and minimizing the need for HR involvement, they can control costs, improve productivity, and provide greater access to important<br />
business data and processes.<br />
Qty YEAR <strong>FY</strong><br />
HUMAN RESOURCES AND OF ACTION <strong>2014</strong>-2018<br />
LABOR RELATIONS SYSTEMS PURCHASE NEEDED <strong>FY</strong>14 <strong>FY</strong>15 <strong>FY</strong>16 <strong>FY</strong>17 <strong>FY</strong>18 TOTALS<br />
ORACLE IMPROVMENTS<br />
Self Service - Manager $ 150,000<br />
$ 150,000<br />
Discipline Records - build Oracle Solution $ 100,000<br />
$ 100,000<br />
HUMAN RESOURCES & LABOR RELATIONS SYSTEMS TOTAL $ 250,000 $ - $ - $ -<br />
$ 250,000<br />
CIS Systems<br />
A priority of Customer Information Services (CIS) is to Deliver timely, accurate and relevant information to riders via static and dynamic content<br />
channels, providing customer what they want (and need), when they want it. A current project of CIS is to install digital information displays at all<br />
MAX platforms, not currently fitted with electronic displays, prioritized by boarding rides.<br />
Qty YEAR REPLACE- <strong>FY</strong><br />
CUSTOMER INFORMATION OF ACTION YEAR MENT <strong>2014</strong>-2018<br />
PURCHASE NEEDED NEEDED CYCLE <strong>2014</strong> 2015 2016 2017 2018 TOTALS<br />
Transit Tracker Displays - Blue & Red MAX lines 68 2012-18 $ 235,000 $ -<br />
$ 235,000<br />
CUSTOMER INFORMATION SYSTEMS TOTAL $ 235,000 $ - $ - $ - $ - $ 235,000<br />
NOTE: <strong>FY</strong><strong>2014</strong> includes the purchase of 20 signs with a contingency of $15,000.<br />
Page ‐ 152
<strong>Capital</strong> <strong>Asset</strong> <strong>Management</strong> & <strong>Investment</strong> Program Technology Systems Operator Training Equipment<br />
Technology System Projects – Operator Training Equipment<br />
Project Name: Operator Training Equipment Project ID: TBD<br />
Project Class: Technology Systems Priority: S<br />
Start Date: 7/1/2013 Completion Date: 6/30/<strong>2014</strong> Project Type: <strong>Capital</strong><br />
Budgeted Dept: Information Technology Project Manager: Morgan, A.<br />
PROJECT DESCRIPTION<br />
Purchase of a training simulator ($300,000) and development of virtual environment based on transit agency’s specific buses and local driving environment<br />
($100,000).<br />
PROJECT JUSTIFICATION<br />
Recertification training of Bus Operators with 3 or more PAs, refresher training of Bus Operations referred to Defensive Driving Evaluations (checkrides), and handson<br />
testing during training of new‐hire Bus Operators, are all most efficiently performed with a training simulator, increasing training productivity and accuracy.<br />
STATUS<br />
N/A<br />
Expenditure Plan <strong>FY</strong><strong>2014</strong> <strong>FY</strong>2015 <strong>FY</strong>2016 <strong>FY</strong>2017 <strong>FY</strong>2018 Total 5‐Year Cost<br />
Current Year $ 400,000 $ ‐ $ ‐ $ ‐ $ ‐ $ 400,000<br />
$ 400,000 $ ‐ $ ‐ $ ‐ $ ‐ $ 400,000<br />
Revenue Plan <strong>FY</strong><strong>2014</strong> <strong>FY</strong>2015 <strong>FY</strong>2016 <strong>FY</strong>2017 <strong>FY</strong>2018 Total 5‐Year Cost<br />
Federal Share $ ‐ $ ‐ $ ‐ $ ‐ $ ‐ $<br />
‐<br />
<strong>TriMet</strong> Share $ 400,000 $ ‐ $ ‐ $ ‐ $ ‐ $ 400,000<br />
Other Source $ ‐ $ ‐ $ ‐ $ ‐ $ ‐ $<br />
‐<br />
TBD $ ‐ $ ‐ $ ‐ $ ‐ $ ‐ $<br />
‐<br />
$ 400,000 $ ‐ $ ‐ $ ‐ $ ‐ $ 400,000<br />
Page ‐ 153
<strong>Capital</strong> <strong>Asset</strong> <strong>Management</strong> & <strong>Investment</strong> Program Technology Systems Digital Sign CPU Retrofit<br />
Technology System Projects – Digital Sign CPU Retrofit<br />
Project Name: Digital Sign CPU Retrofit Project ID: TBD<br />
Project Class: Technology Systems Priority: SR, RoD<br />
Start Date: 7/1/2013 Completion Date: 6/30/<strong>2014</strong> Project Type: <strong>Capital</strong><br />
Budgeted Dept: Information Technology Project Manager: Vitko, I.<br />
PROJECT DESCRIPTION<br />
Equipment upgrade for Solari Digital Information Displays—retrofit CPUs<br />
PROJECT JUSTIFICATION<br />
<strong>TriMet</strong> is adding 54 Digital Information Displays over three years in a project to ensure that electronic messaging is available at all MAX platforms. In order to<br />
improve performance and presentation of customer information, the new displays and all future purchases will include a significant upgrade to the CPUs and server<br />
software. The current supply of 92 displays requires a major CPU retrofit in order to gain the benefits seen in the new displays; without the upgrade they will<br />
continue to encounter problems with graphics and video presentation of messaging and customer information.<br />
STATUS<br />
N/A<br />
Expenditure Plan <strong>FY</strong><strong>2014</strong> <strong>FY</strong>2015 <strong>FY</strong>2016 <strong>FY</strong>2017 <strong>FY</strong>2018 Total 5‐Year Cost<br />
Current Year $ 92,730 $ ‐ $ ‐ $ ‐ $ ‐ $ 92,730<br />
$ 92,730 $ ‐ $ ‐ $ ‐ $ ‐ $ 92,730<br />
Revenue Plan <strong>FY</strong><strong>2014</strong> <strong>FY</strong>2015 <strong>FY</strong>2016 <strong>FY</strong>2017 <strong>FY</strong>2018 Total 5‐Year Cost<br />
Federal Share $ ‐ $ ‐ $ ‐ $ ‐ $ ‐ $<br />
‐<br />
<strong>TriMet</strong> Share $ 92,730 $ ‐ $ ‐ $ ‐ $ ‐ $ 92,730<br />
Other Source $ ‐ $ ‐ $ ‐ $ ‐ $ ‐ $<br />
‐<br />
TBD $ ‐ $ ‐ $ ‐ $ ‐ $ ‐ $<br />
‐<br />
$ 92,730 $ ‐ $ ‐ $ ‐ $ ‐ $ 92,730<br />
Page ‐ 154
<strong>Capital</strong> <strong>Asset</strong> <strong>Management</strong> & <strong>Investment</strong> Program Technology Systems Call A Bus Replacement<br />
Technology System Projects – Call A Bus Replacement<br />
Project Name: Call A Bus Replacement Project ID: TBD<br />
Project Class: Technology Systems Priority: LSI<br />
Start Date: 7/1/2013 Completion Date: 6/30/<strong>2014</strong> Project Type: <strong>Capital</strong><br />
Budgeted Dept: Information Technology Project Manager: Maercklein<br />
PROJECT DESCRIPTION<br />
Call a Bus is a heavily used, unsupported customer service information system. This project request provides the funding for an external developer resource to<br />
complete the project.<br />
PROJECT JUSTIFICATION<br />
Call A Bus is a customer information technology that provides customers real time arrival information from their phone. This system processes over 1M calls per<br />
month. As it is unsupported, if the system no longer function, the adverse impact on <strong>TriMet</strong> customers, and in turn, <strong>TriMet</strong>’s reputation, would be significant. IT<br />
projects that it will take a developer 9 – 12 months of development to complete the rewrite. Internal IT resources are insufficient to meet the demands for IT<br />
support in <strong>FY</strong>14. This project is more easily contracted out to external IT resources.<br />
STATUS<br />
N/A<br />
Expenditure Plan <strong>FY</strong><strong>2014</strong> <strong>FY</strong>2015 <strong>FY</strong>2016 <strong>FY</strong>2017 <strong>FY</strong>2018 Total 5‐Year Cost<br />
Current Year $ 225,000 $ ‐ $ ‐ $ ‐ $ ‐ $ 225,000<br />
$ 225,000 $ ‐ $ ‐ $ ‐ $ ‐ $ 225,000<br />
Revenue Plan <strong>FY</strong><strong>2014</strong> <strong>FY</strong>2015 <strong>FY</strong>2016 <strong>FY</strong>2017 <strong>FY</strong>2018 Total 5‐Year Cost<br />
Federal Share $ ‐ $ ‐ $ ‐ $ ‐ $ ‐ $<br />
‐<br />
<strong>TriMet</strong> Share $ 225,000 $ ‐ $ ‐ $ ‐ $ ‐ $ 225,000<br />
Other Source $ ‐ $ ‐ $ ‐ $ ‐ $ ‐ $<br />
‐<br />
TBD $ ‐ $ ‐ $ ‐ $ ‐ $ ‐ $<br />
‐<br />
$ 225,000 $ ‐ $ ‐ $ ‐ $ ‐ $ 225,000<br />
Page ‐ 155
<strong>Capital</strong> <strong>Asset</strong> <strong>Management</strong> & <strong>Investment</strong> Program Technology Systems Disaster Recovery Network Upgrades<br />
Technology System Projects – Disaster Recovery Network Upgrades<br />
Project Name: Disaster Recovery Network Upgrades Project ID: TBD<br />
Project Class: Technology Systems Priority: S, LSI<br />
Start Date: 7/1/2013 Completion Date: 6/30/<strong>2014</strong> Project Type: <strong>Capital</strong><br />
Budgeted Dept: Information Technology Project Manager: White, R.<br />
PROJECT DESCRIPTION<br />
Upgrade Data Network Components to support system redundancies between Center St and Ruby Junction server rooms for mission critical systems.<br />
PROJECT JUSTIFICATION<br />
STATUS<br />
N/A<br />
Expenditure Plan <strong>FY</strong><strong>2014</strong> <strong>FY</strong>2015 <strong>FY</strong>2016 <strong>FY</strong>2017 <strong>FY</strong>2018 Total 5‐Year Cost<br />
Current Year $ 600,000 $ ‐ $ ‐ $ ‐ $ ‐ $ 600,000<br />
$ 600,000 $ ‐ $ ‐ $ ‐ $ ‐ $ 600,000<br />
Revenue Plan <strong>FY</strong><strong>2014</strong> <strong>FY</strong>2015 <strong>FY</strong>2016 <strong>FY</strong>2017 <strong>FY</strong>2018 Total 5‐Year Cost<br />
Federal Share $ ‐ $ ‐ $ ‐ $ ‐ $ ‐ $<br />
‐<br />
<strong>TriMet</strong> Share $ 600,000 $ ‐ $ ‐ $ ‐ $ ‐ $ 600,000<br />
Other Source $ ‐ $ ‐ $ ‐ $ ‐ $ ‐ $<br />
‐<br />
TBD $ ‐ $ ‐ $ ‐ $ ‐ $ ‐ $<br />
‐<br />
$ 600,000 $ ‐ $ ‐ $ ‐ $ ‐ $ 600,000<br />
Page ‐ 156
<strong>Capital</strong> <strong>Asset</strong> <strong>Management</strong> & <strong>Investment</strong> Program Technology Systems Ruby Server Room Improvements<br />
Technology System Projects – Ruby Server Room Improvements<br />
Project Name: Ruby Server Room Improvements Project ID: TBD<br />
Project Class: Technology Systems Priority: LSI<br />
Start Date: 7/1/2013 Completion Date: 6/30/<strong>2014</strong> Project Type: <strong>Capital</strong><br />
Budgeted Dept: Information Technology Project Manager: Fouts<br />
PROJECT DESCRIPTION<br />
Refurbish Server room infrastructure to support required server room equipment.<br />
PROJECT JUSTIFICATION<br />
Current conditions at Ruby are not adequate to support the level of service required. As part of a long term plan to maintain Ruby as the redundant failover site for<br />
<strong>TriMet</strong>’s mission critical systems, the room needs to be readied by upgrading power, wiring and room conditioning.<br />
STATUS<br />
N/A<br />
Expenditure Plan <strong>FY</strong><strong>2014</strong> <strong>FY</strong>2015 <strong>FY</strong>2016 <strong>FY</strong>2017 <strong>FY</strong>2018 Total 5‐Year Cost<br />
Current Year $ 150,000 $ ‐ $ ‐ $ ‐ $ ‐ $ 150,000<br />
$ 150,000 $ ‐ $ ‐ $ ‐ $ ‐ $ 150,000<br />
Revenue Plan <strong>FY</strong><strong>2014</strong> <strong>FY</strong>2015 <strong>FY</strong>2016 <strong>FY</strong>2017 <strong>FY</strong>2018 Total 5‐Year Cost<br />
Federal Share $ ‐ $ ‐ $ ‐ $ ‐ $ ‐ $<br />
‐<br />
<strong>TriMet</strong> Share $ 150,000 $ ‐ $ ‐ $ ‐ $ ‐ $ 150,000<br />
Other Source $ ‐ $ ‐ $ ‐ $ ‐ $ ‐ $<br />
‐<br />
TBD $ ‐ $ ‐ $ ‐ $ ‐ $ ‐ $<br />
‐<br />
$ 150,000 $ ‐ $ ‐ $ ‐ $ ‐ $ 150,000<br />
Page ‐ 157
<strong>Capital</strong> <strong>Asset</strong> <strong>Management</strong> & <strong>Investment</strong> Program Technology Systems Single Sign On<br />
Technology System Projects – Single Sign On<br />
Project Name: Single Sign On Project ID: TBD<br />
Project Class: Technology Systems Priority: LSI<br />
Start Date: 7/1/2013 Completion Date: 12/31/2013 Project Type: <strong>Capital</strong><br />
Budgeted Dept: Information Technology Project Manager: Baylor<br />
PROJECT DESCRIPTION<br />
An important feature needed for the Employee Self Service Project is for the employee to have the ability to sign on once to access the Oracle self service<br />
applications from external devices. This project creates a single sign on for Employee Service by purchasing the licenses from Oracle. A one‐time only purchase,<br />
there will be annual maintenance fees which would be about 20% of the total cost.<br />
PROJECT JUSTIFICATION<br />
In <strong>FY</strong>14, IT will be adding Oracle application Employee Self Service to the TriNet site for the purpose of replacing several employment related paper processes with<br />
automated process. This application will vastly facilitate employees ability to easily conduct and complete employment related business transactions independently<br />
from home, or the office. Two of the features include access to electronic pay slips and to enroll in a benefit plan. All Agency employees will be accessing the<br />
application at least every other week to view their pay slips and once a year to enroll in a benefit plan. In addition to increasing the reliability of the data,<br />
simplification of the process, it will also decrease the administrative workloads associated with the current process. However, it is equally important that the process<br />
for accessing the application must be as simplest method as possible. The first step in this process is provide them the ability to sign in once to access the employee<br />
self service.<br />
STATUS<br />
N/A<br />
Expenditure Plan <strong>FY</strong><strong>2014</strong> <strong>FY</strong>2015 <strong>FY</strong>2016 <strong>FY</strong>2017 <strong>FY</strong>2018 Total 5‐Year Cost<br />
Current Year $ 230,000 $ ‐ $ ‐ $ ‐ $ ‐ $ 230,000<br />
$ 230,000 $ ‐ $ ‐ $ ‐ $ ‐ $ 230,000<br />
Revenue Plan <strong>FY</strong><strong>2014</strong> <strong>FY</strong>2015 <strong>FY</strong>2016 <strong>FY</strong>2017 <strong>FY</strong>2018 Total 5‐Year Cost<br />
Federal Share $ ‐ $ ‐ $ ‐ $ ‐ $ ‐ $<br />
‐<br />
<strong>TriMet</strong> Share $ 230,000 $ ‐ $ ‐ $ ‐ $ ‐ $ 230,000<br />
Other Source $ ‐ $ ‐ $ ‐ $ ‐ $ ‐ $<br />
‐<br />
TBD $ ‐ $ ‐ $ ‐ $ ‐ $ ‐ $<br />
‐<br />
$ 230,000 $ ‐ $ ‐ $ ‐ $ ‐ $ 230,000<br />
Page ‐ 158
<strong>Capital</strong> <strong>Asset</strong> <strong>Management</strong> & <strong>Investment</strong> Program Technology Systems Time Clock Replacement<br />
Technology System Projects – Time Clock Replacement<br />
Project Name: TimeClock Replacement Project Project ID: TBD<br />
Project Class: Technology Systems Priority: LSI<br />
Start Date: 7/1/2013 Completion Date: 6/30/<strong>2014</strong> Project Type: <strong>Capital</strong><br />
Budgeted Dept: Information Technology Project Manager: Maercklein, D.<br />
PROJECT DESCRIPTION<br />
Replace outdated, manual time clocks and paper time cards with time and attendance system. Allow employees to clock in and out with their employee badge or<br />
other means of identification. Report employee hours in an easy to use format for management and timekeeping purposes. Eliminate time card errors, and provide<br />
better hours of service information.<br />
PROJECT JUSTIFICATION<br />
Our current clocks are old and no longer repairable. Parts are no longer made for them. Introducing different manual clocks would require that we use a new format<br />
of time card. It is undesirable to have to design time card printing and processing around two formats of time cards.<br />
Approximately 600 employees currently use a manual time clock and paper time card as their timekeeping method. The paper time cards must be printed,<br />
separated, sorted and distributed each week. When they are turned in they go through a manual process of work hours, absence and overtime verification. The<br />
process is very labor intensive and thus expensive.<br />
Modern time clocks include new ways to prevent employees from punching in for each other.<br />
Introducing networked, modern time clocks would save time and money for the agency.<br />
STATUS<br />
N/A<br />
Expenditure Plan <strong>FY</strong><strong>2014</strong> <strong>FY</strong>2015 <strong>FY</strong>2016 <strong>FY</strong>2017 <strong>FY</strong>2018 Total 5‐Year Cost<br />
Current Year $ 100,000 $ ‐ $ ‐ $ ‐ $ ‐ $ 100,000<br />
$ 100,000 $ ‐ $ ‐ $ ‐ $ ‐ $ 100,000<br />
Revenue Plan <strong>FY</strong><strong>2014</strong> <strong>FY</strong>2015 <strong>FY</strong>2016 <strong>FY</strong>2017 <strong>FY</strong>2018 Total 5‐Year Cost<br />
Federal Share $ ‐ $ ‐ $ ‐ $ ‐ $ ‐ $<br />
‐<br />
<strong>TriMet</strong> Share $ 100,000 $ ‐ $ ‐ $ ‐ $ ‐ $ 100,000<br />
Other Source $ ‐ $ ‐ $ ‐ $ ‐ $ ‐ $<br />
‐<br />
TBD $ ‐ $ ‐ $ ‐ $ ‐ $ ‐ $<br />
‐<br />
$ 100,000 $ ‐ $ ‐ $ ‐ $ ‐ $ 100,000<br />
Page ‐ 159
<strong>Capital</strong> <strong>Asset</strong> <strong>Management</strong> & <strong>Investment</strong> Program Technology Systems E‐Citation<br />
Technology System Projects – E‐Citation<br />
Project Name: E‐Citation Project ID: TBD<br />
Project Class: Technology Systems Priority: LSI<br />
Start Date: 7/1/2013 Completion Date: 11/30/2013 Project Type: <strong>Capital</strong><br />
Budgeted Dept: Safety, Security, and Environmental Services Project Manager: Saporta<br />
PROJECT DESCRIPTION<br />
E‐Citation is a wireless mobile application that automates the citation process that produces <strong>TriMet</strong> citations, warnings, and exclusions in an electronic format using<br />
hand‐held devices. Field Supervisors and Transit Police Officers would use the system.<br />
The system is designed to transmit citations to the courts (Multnomah, Washington, & Clackamas Counties) whenever a wifi connection is available or at the end of<br />
the day when the device is cradled. All three Courts currently use the e‐citation process. The system is designed to replace the manual paper process of issuing<br />
citations and auto‐populates the citation information on an individual by scanning the individual’s drivers license or other ID card with a bar code. Information may<br />
also be manually entered if ID is not available. Pull‐down option fields allow the Supervisor to select which violation category to use. A copy of the violation is<br />
handed to the individual, using a portable printer. At the end of the shift, the Supervisor would complete the narrative pages that were not completed in the field.<br />
For exclusions, the Supervisor would select the appropriate electronic form on the hand‐held device and scan the violator’s ID, as above. Once the data is entered,<br />
the supervisor utilizes pull down menus to compete the entry and then enters the narrative of events or does so at the end of the shift. The electronic storage of<br />
exclusions makes the information available to the Exclusions Administrator quicker than if mailed and eliminates the need to fax narratives. Time is saved at the end<br />
of the shift. Supervisors are currently required to copy, scan, or fax exclusions within 48 hrs of issuance.<br />
Additionally, a software interface will be developed allowing for the devices to link to the Law Enforcement Database (LEDS), TPD officers only, to check for<br />
outstanding warrants and existing violations and exclusions in FINS (Supervisors and TPD). Approximately 150 FINS queries are made each day, with queries ranging<br />
from 30 seconds to 2 minutes. Using an average of 1 minute per query, Control allocates approximately 2 hours of each day to FINS queries alone.<br />
Currently 1.5 FTE process approximately 3,000 warnings, citations, and exclusions monthly. With the increase in the fare inspection activities, and anticipated<br />
increase in ridership, the number of warnings, citations, and exclusions is expected to increase, requiring additional staff.<br />
Total project: $220,324<br />
Software: $100,140<br />
Ticket, Warning, & Exclusion forms on 18 devices<br />
The ability to run LEDS queries on 6 for law enforcement personnel. Query return data can be auto‐populated to the forms for easier form completion.<br />
Export of the ticket data to 1 of 3 court systems.<br />
Export of the ticket data to FINS – assuming the IT staff can accept/parse a full XML or csv dump for import into FIN.<br />
Export of the Exclusion for data and Warning form data to FINS – same assumption as the ticket data.<br />
Hardware and paper: $74,044<br />
18 Motorola handheld devices, plus cables and cradles. (10 Supervisor units, 6 TPD units, 2 spares)<br />
18 Zebra RW420 printers with Bluetooth. (10 Supervisor units, 6 TPD units, 2 spares)<br />
Page ‐ 160
<strong>Capital</strong> <strong>Asset</strong> <strong>Management</strong> & <strong>Investment</strong> Program Technology Systems E‐Citation<br />
Technology System Projects – E‐Citation (continued)<br />
Project Name: E‐Citation Project ID: TBD<br />
Project Class: Technology Systems Priority: LSI<br />
Start Date: 7/1/2013 Completion Date: 11/30/2013 Project Type: <strong>Capital</strong><br />
Budgeted Dept: Safety, Security, and Environmental Services Project Manager: Saporta<br />
PROJECT DESCRIPTION (continued)<br />
3 year no fault warranties on handheld devices and printers.<br />
2 cases of paper and all shipping fees.<br />
Train the Trainer Training: $350<br />
Remote training (via web and phone) to train IT or appropriate staff to use and provide level 1 support.<br />
Services: $26,622<br />
Includes Professional Services for scofflaw functionality (60 hours).<br />
Includes total project Implementation Services.<br />
Includes Project <strong>Management</strong>.<br />
Annual Maintenance: $19,168<br />
Includes Technical Support on software and non‐material change requests.<br />
PROJECT JUSTIFICATION<br />
Provide the reasoning for the project.<br />
1. Eliminate at least .5 FTE<br />
2. Number of warnings, citations, and exclusions are expected to increase with the addition of Supervisors and Fare Inspection staff.<br />
3. Eliminates or greatly reduces hard copy citations/warning/exclusion forms.<br />
4. Eliminates or minimizes data entry errors and data entry time. <strong>TriMet</strong> personnel and County courts currently perform data entry manually.<br />
5. Eliminates deciphering of handwriting, thus reducing errors.<br />
6. Ensures violations and exclusions are entered within required timeframes.<br />
7. Eliminates mailing, scanning, or faxing of citations and exclusions between <strong>TriMet</strong> offices and courts.<br />
8. Less time is spent entering violator’s information.<br />
9. Eliminates radio checks for warrants (TPD only) and existing violations and exclusions (Supervisors and TPD), thus reducing radio time.<br />
10. Eliminates time lag in entry of data. Violation and exclusion data would be continually up to date.<br />
11. Information is available immediately as it would be stored on the server and be retrieved quickly and provided to any authorized party (TPD, District<br />
Attorney, Field Operations, etc)<br />
12. Minimizes Supervisor overtime as completion of forms is expedited.<br />
13. Improves safety as less time is spent with violator.<br />
Page ‐ 161
<strong>Capital</strong> <strong>Asset</strong> <strong>Management</strong> & <strong>Investment</strong> Program Technology Systems E‐Citation<br />
Technology System Projects – E‐Citation (continued)<br />
Project Name: E‐Citation Project ID: TBD<br />
Project Class: Technology Systems Priority: LSI<br />
Start Date: 7/1/2013 Completion Date: 11/30/2013 Project Type: <strong>Capital</strong><br />
Budgeted Dept: Safety, Security, and Environmental Services Project Manager: Saporta<br />
STATUS<br />
There would be an annual licensing fee and equipment maintenance expenses.<br />
Expenditure Plan <strong>FY</strong><strong>2014</strong> <strong>FY</strong>2015 <strong>FY</strong>2016 <strong>FY</strong>2017 <strong>FY</strong>2018 Total 5‐Year Cost<br />
Current Year $ 220,324 $ ‐ $ ‐ $ ‐ $ ‐ $ 220,324<br />
$ 220,324 $ ‐ $ ‐ $ ‐ $ ‐ $ 220,324<br />
Revenue Plan <strong>FY</strong><strong>2014</strong> <strong>FY</strong>2015 <strong>FY</strong>2016 <strong>FY</strong>2017 <strong>FY</strong>2018 Total 5‐Year Cost<br />
Federal Share $ ‐ $ ‐ $ ‐ $ ‐ $ ‐ $<br />
‐<br />
<strong>TriMet</strong> Share $ 220,324 $ ‐ $ ‐ $ ‐ $ ‐ $ 220,324<br />
Other Source $ ‐ $ ‐ $ ‐ $ ‐ $ ‐ $<br />
‐<br />
TBD $ ‐ $ ‐ $ ‐ $ ‐ $ ‐ $<br />
‐<br />
$ 220,324 $ ‐ $ ‐ $ ‐ $ ‐ $ 220,324<br />
Page ‐ 162
SECTION 7 – NEW/IMPROVED SERVICE
This page left intentionally blank.
<strong>Capital</strong> <strong>Asset</strong> <strong>Management</strong> & <strong>Investment</strong> Program New/Improved Service BRT First Corridor – Powel – Division<br />
Bus Rapid Transit First Corridor – Powell – Division<br />
Project Name: BRT First Corridor – Powell – Division Project ID: TBD<br />
Project Class: New/Improved Service Priority: LSI<br />
Start Date: 7/1/2013 Completion Date: 6/30/2016 Project Type: <strong>Capital</strong><br />
Budgeted Dept: Public Affairs – Planning & Policy Project Manager: Lehto<br />
PROJECT DESCRIPTION<br />
BRT service with new, dedicated buses implemented under Very Small Starts federal program. This will be a limited stop, all day service, with distinctive branding<br />
and customer information, providing faster service along an existing Frequent Service Bus corridor. Project includes shelters, stop improvements, new buses<br />
dedicated to the service, and targeted transit priority treatments. Corridor Study to determine alignment and treatment details begins July, 2013.<br />
Concept schedule: Begin corridor study July, 2013. LPA summer, <strong>2014</strong>. Apply for Very Small Starts, Fall <strong>2014</strong>. Design/Engineering and start procurement of vehicles<br />
2015. Construction 2016.<br />
PROJECT JUSTIFICATION<br />
Strong transit demand in the corridor, with potential for significant growth with factors like new housing being developed in the corridor, continued growth in central<br />
Gresham and the establishment of a full campus of PCC at 82 nd /Division in addition to continued growth in South Waterfront.<br />
The majority of the General Fund contribution is assumed to be repurposed funds already budgeted for replacement buses. Figures shown are placeholders until<br />
corridor is confirmed, and vehicle needs, and budget is refined.<br />
STATUS<br />
N/A<br />
Expenditure Plan <strong>FY</strong><strong>2014</strong> <strong>FY</strong>2015 <strong>FY</strong>2016 <strong>FY</strong>2017 <strong>FY</strong>2018 Total 5‐Year Cost<br />
Current Year $ 100,000 $ 6,000,000 $ 20,000,000 $ 15,000,000 $ ‐ $ 41,100,000<br />
$ 100,000 $ 6,000,000 $ 20,000,000 $ 15,000,000 $ ‐ $ 41,100,000<br />
Revenue Plan <strong>FY</strong><strong>2014</strong> <strong>FY</strong>2015 <strong>FY</strong>2016 <strong>FY</strong>2017 <strong>FY</strong>2018 Total 5‐Year Cost<br />
Federal Share $ 100,000 $ 6,000,000 $ 20,000,000 $ 15,000,000 $ ‐ $ 41,100,000<br />
<strong>TriMet</strong> Share $ ‐ $ ‐ $ ‐ $ ‐ $ ‐ $<br />
‐<br />
Other Source $ ‐ $ ‐ $ ‐ $ ‐ $ ‐ $<br />
‐<br />
TBD $ ‐ $ ‐ $ ‐ $ ‐ $ ‐ $<br />
‐<br />
$ 100,000 $ 6,000,000 $ 20,000,000 $ 15,000,000 $ ‐ $ 41,100,000<br />
Page ‐ 165
<strong>Capital</strong> <strong>Asset</strong> <strong>Management</strong> & <strong>Investment</strong> Program New/Improved Service Tigard Park & Ride Expansion – Land Acquisition<br />
Tigard Park & Ride Expansion – Land Acquisition<br />
Project Name: Tigard Park & Ride Expansion: Land Acquisition Project ID: TBD<br />
Project Class: New/Improved Service Priority: LSI<br />
Start Date: 7/1/<strong>2014</strong> Completion Date: 6/30/2016 Project Type: <strong>Capital</strong><br />
Budgeted Dept: TBD Project Manager: TBD<br />
PROJECT DESCRIPTION<br />
Acquisition of 0.8‐acre property adjacent to the existing <strong>TriMet</strong> park and ride lot along Pacific Highway (99W).<br />
PROJECT JUSTIFICATION<br />
This acquisition would allow expansion of the existing park and ride lot and land for potential Barbur LRT, but more importantly provides street frontage for the lot,<br />
which would be used for an enhanced bus stop and a future High Capacity Transit or Bus Rapid Transit station. This lot now sits below and out‐of‐sight from Pacific<br />
Highway. The adjacent site is undeveloped. While this is not an urgent project, it takes advantage of an opportunity and is fully consistent with <strong>TriMet</strong>’s park and ride<br />
policy and the service development plans in this corridor.<br />
This project creates a new “super” bus stop and some additional parking which would have to be maintained. Timing has been moved back to <strong>FY</strong>2016 to be<br />
consistent with schedule for ongoing Southwest Corridor planning efforts led by the region, which includes transit improvements along with all other modes as<br />
potential recommendations.<br />
STATUS<br />
N/A<br />
Expenditure Plan <strong>FY</strong><strong>2014</strong> <strong>FY</strong>2015 <strong>FY</strong>2016 <strong>FY</strong>2017 <strong>FY</strong>2018 Total 5‐Year Cost<br />
Current Year $ ‐ $ ‐ $ 750,000 $ ‐ $ ‐ $ 750,000<br />
$ ‐<br />
‐ $ 750,000 $ ‐ $ ‐ $ 750,000<br />
Revenue Plan <strong>FY</strong><strong>2014</strong> <strong>FY</strong>2015 <strong>FY</strong>2016 <strong>FY</strong>2017 <strong>FY</strong>2018 Total 5‐Year Cost<br />
Federal Share $ ‐ $ ‐ $ ‐ $ ‐ $ ‐ $<br />
‐<br />
<strong>TriMet</strong> Share $ ‐ ‐ $ 750,000 $ ‐ $ ‐ $ 750,000<br />
Other Source $ ‐ $ ‐ $ ‐ $ ‐ $ ‐ $<br />
‐<br />
TBD $ ‐ $ ‐ $ ‐ $ ‐ $ ‐ $<br />
‐<br />
$ ‐ $ ‐ $ 750,000 $ ‐ $ ‐ $ 750,000<br />
Page ‐ 166
<strong>Capital</strong> Improvement Program New/Improved Service Willamette Shore Trolley Program<br />
Willamette Shore Trolley Program<br />
Project Name: Willamette Shore Trolley Program Project ID: 5581<br />
Project Class: New/Improved Service Priority: Safety<br />
Start Date: 7/1/2013 Completion Date: 6/30/<strong>2014</strong> and on‐going Project Type: Operating<br />
Budgeted Dept: <strong>Capital</strong> Projects – Development & Operations Support Project Manager: Batty<br />
PROJECT DESCRIPTION<br />
<strong>TriMet</strong> participates in the regional efforts of the Willamette Shore Consortium to preserve this right of way for future provision of public transportation to Lake<br />
Oswego from the Riverplace district. Preservation and conversion of this right of way is a regional priority, reflected in the 2020 Regional Transportation Plan.<br />
PROJECT JUSTIFICATION<br />
<strong>TriMet</strong> works with the City of Lake Oswego (LO) to maintain and preserve this right‐of‐way along the Willamette River. Usual annual maintenance includes<br />
inspection, track upgrade, tunnel repair or other structural and right‐of‐way upkeep. In addition, usual annual activities may include development of more<br />
significant maintenance project scopes.<br />
More substantial trestle maintenance work under a funding agreement with LO in <strong>FY</strong>14 is anticipated. In <strong>FY</strong> <strong>2014</strong> <strong>TriMet</strong> may incur additional expenses regarding real<br />
property ownership, rights and associated legal costs. These potential costs of $75,000 are reflected in the <strong>TriMet</strong> share.<br />
STATUS<br />
N/A<br />
Expenditure Plan <strong>FY</strong><strong>2014</strong> <strong>FY</strong>2015 <strong>FY</strong>2016 <strong>FY</strong>2017 <strong>FY</strong>2018 Total 5‐Year Cost<br />
Current Year $ 325,000 $ 50,000 $ 50,000 $ 50,000 $ 50,000 $ 525,000<br />
$ 325,000 $ 50,000 $ 50,000 $ 50,000 $ 50,000 $ 525,000<br />
Revenue Plan <strong>FY</strong><strong>2014</strong> <strong>FY</strong>2015 <strong>FY</strong>2016 <strong>FY</strong>2017 <strong>FY</strong>2018 Total 5‐Year Cost<br />
Federal Share $ ‐ $ ‐ $ ‐ $ ‐ $ ‐ $<br />
‐<br />
<strong>TriMet</strong> Share $ 125,000 $ 50,000 $ 50,000 $ 50,000 $ 50,000 $ 325,000<br />
Other Source $ 200,000 $ ‐ $ ‐ $ ‐ $ ‐ $ 200,000<br />
TBD $ ‐ $ ‐ $ ‐ $ ‐ $ ‐ $<br />
‐<br />
$ 325,000 $ 50,000 $ 50,000 $ 50,000 $ 50,000 $ 525,000<br />
Page ‐ 167
<strong>Capital</strong> <strong>Asset</strong> <strong>Management</strong> & <strong>Investment</strong> Program New/Improved Service STIP – Barbur – Hwy 99W<br />
STIP – Barbur – Hwy 99W Corridor & Access to Transit<br />
Project Name: Barbur – 99W Corridor Safety & Access to Transit Project ID: TBD<br />
Project Class: New/Improved Service Priority: S<br />
Start Date: 7/1/15 Completion Date: 6/30/18 Project Type: <strong>Capital</strong><br />
Budgeted Dept: TBD Project Manager: Lehto<br />
PROJECT DESCRIPTION<br />
Improve bus stops, construct sidewalks, enhance crossings, install signal priority and transit operation improvements on and connecting to Barbur‐99W between<br />
Portland and Sherwood. Specifically, the project would build bus stop landing pads and shelters and connect bus stops to sidewalks. Rapid flash beacons would be<br />
installed to improve safety at non‐signalized crossings. Signal priority and operational treatments would decrease travel times. Pedestrian network and connections<br />
to transit and regional trails would be improved in Tigard & Tualatin.<br />
PROJECT JUSTIFICATION<br />
Barbur‐99W is 4‐6 lanes with a maximum speed of 45 mph. <strong>TriMet</strong> lines 12, 64, and 94 serve the corridor with more than 35,000 weekly rides. Sidewalk and basic bus<br />
stop amenities are lacking in much of the corridor. Because of high speeds, crossing the corridor to a bus stop can be dangerous and safe bicycle access is limited. As<br />
employment and housing in the area grow, traffic congestion will increase, making transit less attractive by slowing travel times and lowering on‐time performance.<br />
STATUS<br />
N/A<br />
Expenditure Plan <strong>FY</strong><strong>2014</strong> <strong>FY</strong>2015 <strong>FY</strong>2016 <strong>FY</strong>2017 <strong>FY</strong>2018 Total 5‐Year Cost<br />
Current Year $ ‐ $ ‐ $ 920,400 $ 495,600 $ ‐ $ 1,416,000<br />
$ ‐ $ ‐ $ 920,400 $ 495,600 $ ‐ $ 1,416,000<br />
Revenue Plan <strong>FY</strong><strong>2014</strong> <strong>FY</strong>2015 <strong>FY</strong>2016 <strong>FY</strong>2017 <strong>FY</strong>2018 Total 5‐Year Cost<br />
Federal Share $ ‐ $ ‐ $ ‐ $ ‐ $ ‐ $<br />
‐<br />
<strong>TriMet</strong> Share $ ‐ $ ‐ $ 94,525 $ 50,898 $ ‐ $ 145,423<br />
Other Source $ ‐ $ ‐ $ 825,875 $ 444,702 $ ‐ $ 1,270,577<br />
TBD $ ‐ $ ‐ $ ‐ $ ‐ $ ‐ $<br />
‐<br />
$ ‐ $ ‐ $ 920,400 $ 495,600 $ ‐ $ 1,416,000<br />
Page ‐ 168
<strong>Capital</strong> <strong>Asset</strong> <strong>Management</strong> & <strong>Investment</strong> Program New/Improved Service STIP – Cornell‐Evergreen‐229 th<br />
STIP – Cornell‐Evergreen‐229 th Corridor Safety & Access to Transit<br />
Project Name: Cornell‐Evergreen – 229 th Corridor Safety & Access to Transit Project ID: TBD<br />
Project Class: New/Improved Service Priority: S<br />
Start Date: 7/1/2015 Completion Date: 6/30/2018 Project Type: <strong>Capital</strong><br />
Budgeted Dept: TBD Project Manager: Lehto<br />
PROJECT DESCRIPTION<br />
Improve bus stops, construct landing pads, enhance crossings, and installing signal priority on Cornell Rd., Evergreen Pkwy., and 229 th Ave. in Beaverton, Hillsboro,<br />
and Washington county. Specifically, <strong>TriMet</strong> intends to install concrete landing pads between the sidewalks and curbs at 50 bus stops, rapid flash beacons (RFB) with<br />
striping at 3 non‐signalized crossing locations, and transit signal priority at 3 intersections.<br />
PROJECT JUSTIFICATION<br />
The corridors are 3‐5 lanes wide with a maximum speed of 45 mph. <strong>TriMet</strong>’s lines 47 and 48 serve the corridors with an average of more than 2,500 weekly rides.<br />
There are 50 bus stop locations that have landscaping between the sidewalks and the curbs. Customers with mobility devices can’t access the transit service due to<br />
this gap in the pedestrian system. Also, able bodied customers must walk through wet grass or mud or enter the street when stepping on and off the bus. Some bus<br />
stops on Cornell Rd. are located at unsignalized crossings. Due to high speeds, crossing the corridors can be dangerous. As housing and employment in the area grow,<br />
traffic congestion will increase, making transit less attractive by slowing travel times and lowing on‐time performance.<br />
STATUS<br />
N/A<br />
Expenditure Plan <strong>FY</strong><strong>2014</strong> <strong>FY</strong>2015 <strong>FY</strong>2016 <strong>FY</strong>2017 <strong>FY</strong>2018 Total 5‐Year Cost<br />
Current Year $ ‐ $ ‐ $ 422,500 $ 227,500 $ ‐ $ 650,000<br />
$ ‐ $ ‐ $ 422,500 $ 227,500 $ ‐ $ 650,000<br />
Revenue Plan <strong>FY</strong><strong>2014</strong> <strong>FY</strong>2015 <strong>FY</strong>2016 <strong>FY</strong>2017 <strong>FY</strong>2018 Total 5‐Year Cost<br />
Federal Share $ ‐ $ ‐ $ 21,695 $ 11,682 $ ‐ $ 33,377<br />
<strong>TriMet</strong> Share $ ‐ $ ‐ $ 21,696 $ 11,682 $ ‐ $ 33,378<br />
Other Source $ ‐ $ ‐ $ 379,109 $ 204,136 $ ‐ $ 583,245<br />
TBD $ ‐ $ ‐ $ ‐ $ ‐ $ ‐ $<br />
‐<br />
$ ‐ $ ‐ $ 422,500 $ 227,500 $ ‐ $ 650,000<br />
Page ‐ 169
<strong>Capital</strong> <strong>Asset</strong> <strong>Management</strong> & <strong>Investment</strong> Program New/Improved Service STIP – Hwy 8<br />
STIP – Highway 8 Corridor Safety & Access to Transit<br />
Project Name: Highway 8 Corridor Safety & Access to Transit Project ID: TBD<br />
Project Class: New/Improved Service Priority: S<br />
Start Date: 7/1/2015 Completion Date: 6/30/2018 Project Type: <strong>Capital</strong><br />
Budgeted Dept: TBD Project Manager: Lehto<br />
PROJECT DESCRIPTION<br />
Improve bus stops, construct sidewalks, enhance crossings and install signal priority on and connecting to Highway 8 between 110 th Ave. in Beaverton and SW 209 th<br />
Ave. in Hillsboro. Specifically, the project would build bus stop landing pads and shelters and connect bus stops to sidewalks. Rapid flash beacons would be installed<br />
to improve safety and non‐signalized crossings near bus stops and signal and striping improvements would be made to help protect transit customers at signalized<br />
crossings. Signal priority and operational treatments at key intersections would decrease travel times.<br />
PROJECT JUSTIFICATION<br />
Highway 8 is 5‐7 lanes with a maximum speed of 45 mph. The project area runs through downtown Beaverton and low‐income parts of Aloha, Reedville and<br />
Hillsboro. The future South Hillsboro development will bring more than 10,000 new homes and a new town center to the corridor. Sidewalk and basic bus stop<br />
amenities are lacking on much of the highway, particularly on the south side of TV Hwy (OR‐8) due to a railroad right of way. Because of high speeds, crossing the<br />
corridor to a bus stop can be dangerous and safe bicycle access is limited. As the area grows, traffic congestion will increase, making transit less attractive by slowing<br />
travel times and lowering on‐time performance<br />
STATUS<br />
N/A<br />
Expenditure Plan <strong>FY</strong><strong>2014</strong> <strong>FY</strong>2015 <strong>FY</strong>2016 <strong>FY</strong>2017 <strong>FY</strong>2018 Total 5‐Year Cost<br />
Current Year $ ‐ $ ‐ $ 1,134,900 $ 611,100 $ ‐ $ 1,746,000<br />
$ ‐ $ ‐ $ 1,134,900 $ 611,100 $ ‐ $ 1,746,000<br />
Revenue Plan <strong>FY</strong><strong>2014</strong> <strong>FY</strong>2015 <strong>FY</strong>2016 <strong>FY</strong>2017 <strong>FY</strong>2018 Total 5‐Year Cost<br />
Federal Share $ ‐ $ ‐ $ ‐ $ ‐ $ ‐ $<br />
‐<br />
<strong>TriMet</strong> Share $ ‐ $ ‐ $ 116,554 $ 62,760 $ ‐ $ 179,314<br />
Other Source $ ‐ $ ‐ $ 1,018,346 $ 548,340 $ ‐ $ 1,566,686<br />
TBD $ ‐ $ ‐ $ ‐ $ ‐ $ ‐ $<br />
‐<br />
$ ‐ $ ‐ $ 1,134,900 $ 611,100 $ ‐ $ 1,746,000<br />
Page ‐ 170
<strong>Capital</strong> <strong>Asset</strong> <strong>Management</strong> & <strong>Investment</strong> Program New/Improved Service STIP – Main Street – Oregon City<br />
STIP – Main Street: 10 th ‐15 th Streets (Oregon City)<br />
Project Name: Main Street: 10 th Street – 15 th Street (Oregon City) Project ID: TBD<br />
Project Class: New/Improved Service Priority: S<br />
Start Date: 7/1/2015 Completion Date: 6/30/2018 Project Type: <strong>Capital</strong><br />
Budgeted Dept: TBD Project Manager: Lehto<br />
PROJECT DESCRIPTION<br />
<strong>TriMet</strong> is a Co‐Sponsor on this project.<br />
Leveraged STIP funding supports infrastructure improvements that encourage mixed‐use development and improved regional transportation by connecting existing<br />
transit modes and nodes. The final phase of a Connective Corridor in downtown Oregon City builds connections to a <strong>TriMet</strong> Transit Center and City park and ride<br />
integrating them as a nexus for transit.<br />
Improvements include: ADA accessibility, bicycle parking, illumination and safety ‐ open sight lines for vehicles and pedestrians. A connective corridor aligns transit<br />
infrastructure into an integrated multi‐modal system. Connecting transit (<strong>TriMet</strong> Transit Center), waterfront trails (Interweave) and the walkability of our downtown<br />
places a higher priority on transit solutions and leads to decreased single occupancy vehicle use.<br />
PROJECT JUSTIFICATION<br />
Partial funding for Oregon City’s Connective Corridor (Phase one, 2010‐2012), left transit components isolated and disconnected. In order for multi‐modal transit to<br />
well serve this community and region, connectivity needs to be improved from the City’s park & ride lot to the regional transit center and to our downtown core.<br />
Bike/Ped routes linking Oregon City with the commercial waterfront and trails need to be physically linked together. A <strong>TriMet</strong> Transit Center off 99E needs<br />
improvements for safety, access and to accommodate increased ridership driven by growing regional and downtown activity. Oregon City’s next steps will complete a<br />
connective corridor stitching together state and regional transit systems that converge in Oregon City’s 166 year‐old downtown.<br />
STATUS ‐ N/A<br />
Expenditure Plan <strong>FY</strong><strong>2014</strong> <strong>FY</strong>2015 <strong>FY</strong>2016 <strong>FY</strong>2017 <strong>FY</strong>2018 Total 5‐Year Cost<br />
Current Year $ ‐ $ ‐ $ 104,000 $ 56,000 $ ‐ $ 160,000<br />
$ ‐ $ ‐ $ 104,000 $ 56,000 $ ‐ $ 160,000<br />
Revenue Plan <strong>FY</strong><strong>2014</strong> <strong>FY</strong>2015 <strong>FY</strong>2016 <strong>FY</strong>2017 <strong>FY</strong>2018 Total 5‐Year Cost<br />
Federal Share $ ‐ $ ‐ $ ‐ $ ‐ $ ‐ $<br />
‐<br />
<strong>TriMet</strong> Share $ ‐ $ ‐ $ 10,681 $ 5,751 $ ‐ $ 16,432<br />
Other Source $ ‐ $ ‐ $ 93,319 $ 50,249 $ ‐ $ 143,568<br />
TBD $ ‐ $ ‐ $ ‐ $ ‐ $ ‐ $<br />
‐<br />
$ ‐ $ ‐ $ 104,000 $ 56,000 $ ‐ $ 160,000<br />
Page ‐ 171
<strong>Capital</strong> <strong>Asset</strong> <strong>Management</strong> & <strong>Investment</strong> Program New/Improved Service STIP – Molalla Avenue – Oregon City<br />
STIP – Molalla Avenue – Beavercreek Rd to Hwy 213 (Oregon City)<br />
Project Name: Molalla Avenue – Beavercreek Rd to Hwy 213 (Oregon City) Project ID: TBD<br />
Project Class: New/Improved Service Priority: S<br />
Start Date: 7/1/2015 Completion Date: 6/30/2018 Project Type: <strong>Capital</strong><br />
Budgeted Dept: TBD Project Manager: Lehto<br />
PROJECT DESCRIPTION<br />
<strong>TriMet</strong> is a Co‐Sponsor on this project.<br />
Molalla Avenue is a key route for all travel modes connecting the Oregon City Regional Center with Clackamas Community College. However, the segment from<br />
Beavercreek Road to OR 213 is uncomfortable, unwelcoming and at times unaccommodating for those walking, biking or accessing transit. With some of the highest<br />
population and employment densities in Oregon City adjacent to the corridor, the City, in partnership with <strong>TriMet</strong>, would like to encourage non‐motorized travel by<br />
reconfiguring the existing right‐of‐way to better accommodate all street users. The project would reduce the underutilized curb‐to‐curb pavement width to include<br />
continuous bike lanes, wider and continuous sidewalks, street furnishings, improved access management and more convenient and comfortable street crossings.<br />
PROJECT JUSTIFICATION<br />
Molalla Avenue from Beavercreek Road to OR 213 is a challenge for non‐motorized users. Excessive driveways reduce the efficiency of the street and sidewalk and<br />
bike lane gaps, coupled with inconvenient street crossings, put non‐motorized users in adverse conditions. Molalla Avenue currently functions as a barrier between<br />
residential and commercial land uses. Existing sidewalks are often curb‐tight and obstructed by utility poles or signage, further narrowing the sidewalk to widths<br />
inaccessible to wheelchairs. Street crossing opportunities are inconveniently spaced in relation to transit stops and other mid‐block activity generators. Overall,<br />
Molalla Avenue struggles to manage demand along the corridor and this project is needed to increase the efficiency of the existing right‐of‐way.<br />
STATUS<br />
N/A<br />
Expenditure Plan <strong>FY</strong><strong>2014</strong> <strong>FY</strong>2015 <strong>FY</strong>2016 <strong>FY</strong>2017 <strong>FY</strong>2018 Total 5‐Year Cost<br />
Current Year $ ‐ $ ‐ $ 94,936 $ 51,120 $ ‐ $ 146,056<br />
$ ‐ $ ‐ $ 94,936 $ 51,120 $ ‐ $ 146,056<br />
Revenue Plan <strong>FY</strong><strong>2014</strong> <strong>FY</strong>2015 <strong>FY</strong>2016 <strong>FY</strong>2017 <strong>FY</strong>2018 Total 5‐Year Cost<br />
Federal Share $ ‐ $ ‐ $ ‐ $ ‐ $ ‐ $<br />
‐<br />
<strong>TriMet</strong> Share $ ‐ $ ‐ $ 9,750 $ 5,250 $ ‐ $ 15,000<br />
Other Source $ ‐ $ ‐ $ 85,186 $ 45,870 $ ‐ $ 131,056<br />
TBD $ ‐ $ ‐ $ ‐ $ ‐ $ ‐ $<br />
‐<br />
$ ‐ $ ‐ $ 94,936 $ 51,120 $ ‐ $ 146,056<br />
Page ‐ 172
<strong>Capital</strong> <strong>Asset</strong> <strong>Management</strong> & <strong>Investment</strong> Program New/Improved Service STIP – Powell‐Division<br />
STIP – Powell‐Division Corridor Safety & Access to Transit<br />
Project Name: Powell‐Division Corridor Safety & Access to Transit Project ID: TBD<br />
Project Class: New/Improved Service Priority: S<br />
Start Date: 7/1/2015 Completion Date: 6/30/2018 Project Type: <strong>Capital</strong><br />
Budgeted Dept: TBD Project Manager: Lehto<br />
PROJECT DESCRIPTION<br />
This project makes priority improvements for safety, access to transit and transit operations in the Powell & Division corridors, with current <strong>TriMet</strong> Frequent Service<br />
lines and a designated regional High Capacity Transit development corridor. It will focus on priority safety and access improvements identified by the project<br />
partners, adopted plans, and highlighted in <strong>TriMet</strong>’s Pedestrian Network Analysis. Improved safety, access, operations reliability and travel time provide immediate<br />
benefits and set the stage for future anticipated service increases in the corridor. Identified improvements could also be included in the scope of potential Powell‐<br />
Division On‐Street Bus Rapid Transit project, which would present additional chance for using these STIP funds to leverage future improvements.<br />
PROJECT JUSTIFICATION<br />
The Powell Blvd (US26) – Division St (“Powell‐Division”) corridor is currently served by frequent service bus lines 4 and 9 and has numerous transfer points for<br />
crossing routes. Ridership in the combined corridor averages 71,000 riders per week. There are stretches of roadway without marked crossings, missing sidewalks<br />
and inaccessible bus stops. This project aims to enhance crossings in conjunction with bus stop improvements such as improved shelters and lighting to make taking<br />
transit a more attractive option. Also, this project aims to upgrade existing marked crosswalks to current standards and treatment technologies, which may include<br />
adding rapid flashing beacons where appropriate and supported by existing plans and project partners.<br />
STATUS<br />
N/A<br />
Expenditure Plan <strong>FY</strong><strong>2014</strong> <strong>FY</strong>2015 <strong>FY</strong>2016 <strong>FY</strong>2017 <strong>FY</strong>2018 Total 5‐Year Cost<br />
Current Year $ ‐ $ ‐ $ 1,216,800 $ 655,200 $ ‐ $ 1,872,000<br />
$ ‐ $ ‐ $ 1,216,800 $ 655,200 $ ‐ $ 1,872,000<br />
Revenue Plan <strong>FY</strong><strong>2014</strong> <strong>FY</strong>2015 <strong>FY</strong>2016 <strong>FY</strong>2017 <strong>FY</strong>2018 Total 5‐Year Cost<br />
Federal Share $ ‐ $ ‐ $ ‐ $ ‐ $ ‐ $<br />
‐<br />
<strong>TriMet</strong> Share $ ‐ $ ‐ $ 124,965 $ 67,289 $ ‐ $ 192,254<br />
Other Source $ ‐ $ ‐ $ 1,091,835 $ 587,911 $ ‐ $ 1,679,746<br />
TBD $ ‐ $ ‐ $ ‐ $ ‐ $ ‐ $<br />
‐<br />
$ ‐ $ ‐ $ 1,216,800 $ 655,200 $ ‐ $ 1,872,000<br />
Page ‐ 173
<strong>Capital</strong> <strong>Asset</strong> <strong>Management</strong> & <strong>Investment</strong> Program New/Improved Service STIP – Transit Corridor Pedestrian Improvements<br />
STIP – Transit Corridor Pedestrian Improvements<br />
Project Name: Transit Corridor Pedestrian Improvements (Harrison St. & King Rd.) Project ID: TBD<br />
Project Class: New/Improved Service Priority: S<br />
Start Date: 7/1/2015 Completion Date: 6/30/2018 Project Type: <strong>Capital</strong><br />
Budgeted Dept: TBD Project Manager: Lehto<br />
PROJECT DESCRIPTION<br />
<strong>TriMet</strong> is a Co‐Sponsor on this project.<br />
This Project will make ADA upgrades to sidewalks, ramps and crosswalks along the Harrison‐King corridor to create a safe and continuous network from McLoughlin<br />
Blvd and downtown Milwaukie to the east edge of the city. Current sidewalks and bus stops do not meet ADA standards and there is a need for additional safe<br />
crossings. ADA upgrades in the pedestrian network, and bus stop improvements will complement increased bus service levels and connections to the new light rail<br />
service in downtown Milwaukie. Bus service improvements envisioned with addition of Light Rail service in 2015 include frequent service (operating every 15 minutes<br />
or more seven days a week) on the McLoughlin/King Rd corridor between Clackamas Community College, downtown Milwaukie, and Clackamas Town Center.<br />
PROJECT JUSTIFICATION<br />
With the completion of Light Rail transit in Milwaukie, use of the Harrison‐King corridor is expected to intensify. Currently, sidewalks exist between McLoughlin and<br />
42nd Ave, but the ramps do not meet current ADA standards. East of 42nd Ave, along King Road, sidewalks are made of asphalt, are curb tight, and do not meet ADA<br />
all together as there are no ramped curb cuts. Pedestrian crossings are lacking throughout the entire stretch of this corridor, the City's primary cross‐city corridor.<br />
Revitalization of the city's neighborhood commercial areas also relies on pedestrian connections along this corridor (this corridor connects three neighborhood<br />
commercial centers to four neighborhoods). Improving pedestrian access from neighborhoods is one of the main needs found in a recent study.<br />
STATUS<br />
N/A<br />
Expenditure Plan <strong>FY</strong><strong>2014</strong> <strong>FY</strong>2015 <strong>FY</strong>2016 <strong>FY</strong>2017 <strong>FY</strong>2018 Total 5‐Year Cost<br />
Current Year $ ‐ $ ‐ $ 234,000 $ 126,000 $ ‐ $ 360,000<br />
$ ‐ $ ‐ $ 234,000 $ 126,000 $ ‐ $ 360,000<br />
Revenue Plan <strong>FY</strong><strong>2014</strong> <strong>FY</strong>2015 <strong>FY</strong>2016 <strong>FY</strong>2017 <strong>FY</strong>2018 Total 5‐Year Cost<br />
Federal Share $ ‐ $ ‐ $ ‐ $ ‐ $ ‐ $<br />
‐<br />
<strong>TriMet</strong> Share $ ‐ $ ‐ $ 24,032 $ 12,940 $ ‐ $ 36,972<br />
Other Source $ ‐ $ ‐ $ 209,968 $ 113,060 $ ‐ $ 323,028<br />
TBD $ ‐ $ ‐ $ ‐ $ ‐ $ ‐ $<br />
‐<br />
$ ‐ $ ‐ $ 234,000 $ 126,000 $ ‐ $ 360,000<br />
Page ‐ 174
SECTION 8 ‐ APPENDIX
This page left intentionally blank.
<strong>Capital</strong> <strong>Asset</strong> <strong>Management</strong> & <strong>Investment</strong> Program Appendix Summaries<br />
Vehicle Summary<br />
VEHICLES <strong>FY</strong>14 <strong>FY</strong>15 <strong>FY</strong>16 <strong>FY</strong>17 <strong>FY</strong>18<br />
Total<br />
<strong>FY</strong>14-<strong>FY</strong>18<br />
Fixed Route Buses<br />
Fixed Route Bus Replacements $ 26,295,002 $ 29,536,000 $ 26,670,000 $ 17,830,000 $ 17,830,000 $ 118,161,002<br />
Fixed Route Bus Components $910,195 1,936,795 2,753,998 1,811,210 1,637,068 9,049,266<br />
Bus Shop Equipment > $5,000 923,800 405,000 187,000 125,000 16,000 1,656,800<br />
Bus Maintenance Shop Equipment ≤ $5,000 259,850 207,400 115,000 90,895 58,550 731,695<br />
Project ‐ Merlo CNG Fleet Conversion ‐ 2,780,000 11,120,000 ‐ ‐ 13,900,000<br />
Project ‐ Drop‐Down Chains (183 buses) 311,500 329,000 ‐ ‐ ‐ 640,500<br />
Project ‐ Hybrid Buses for Expansion ‐ 573,200 2,292,800 ‐ ‐ 2,866,000<br />
Fixed Route Buses Subtotal $ 28,700,347 $ 35,767,395 $ 43,138,798 $ 19,857,105 $ 19,541,618 $ 147,005,263<br />
Light Rail Vehicles<br />
Light Rail Vehicle Replacements<br />
No LRV Replacements Until 2027<br />
Light Rail Vehicle Components $ 3,508,330 $ 3,113,505 $ 1,130,039 $ 511,396 $ 353,365 $ 8,616,635<br />
Light Rail Shop Equipment > $5,000 93,000 49,000 5,000 9,000 30,000 186,000<br />
Light Rail Shop Equipment ≤ $5,000 21,000 15,000 15,000 15,000 20,000 86,000<br />
Rail Equipment Maintenance 38,000 38,000 73,000 100,000 40,000 289,000<br />
Light Rail Vehicles Subtotal $ 3,660,330 $ 3,215,505 $ 1,223,039 $ 635,396 $ 443,365 $ 9,177,635<br />
ATP/LIFT Vehicles<br />
ATP‐LIFT Vehicle Replacements $ ‐ $ 4,385,500 $ 5,292,000 $ ‐ $ ‐ $ 9,677,500<br />
Light Rail Shop Equipment > $5,000 ‐ ‐ 30,000 65,000 40,000 135,000<br />
Light Rail Shop Equipment ≤ $5,000 4,000 ‐ 5,000 11,000 ‐ 20,000<br />
ATP/LIFT Vehicles Subtotal $ 4,000 $ 4,385,500 $ 5,327,000 $ 76,000 $ 40,000 $ 9,832,500<br />
Non‐Revenue Vehicles<br />
Non‐Revenue Vehicles > $5,000 $ 1,980,000 $ 1,640,000 $ 1,632,000 $ 1,328,000 $ ‐ $ 6,580,000<br />
Non‐Revenue Vehicles ≤ $5,000 ‐ 135,200 73,920 60,060 ‐ 269,180<br />
Non‐Revenue Shop Equipment ≤ $5,000 2,500 8,000 ‐ 3,000 ‐ 13,500<br />
Non‐Revenue Vehicles Subtotal $ 1,982,500 $ 1,783,200 $ 1,705,920 $ 1,391,060 $ ‐ $ 6,862,680<br />
Other Projects<br />
Automatic Train Stop (ATS) $ 500,000 $ ‐ $ ‐ $ ‐ $ ‐ $ 500,000<br />
Positive Train Control 700,000 2,500,000 3,000,000 2,000,000 ‐ 8,200,000<br />
Type 1/2/3 LRVs Destination Signs Replacement 350,000 ‐ ‐ ‐ ‐ 350,000<br />
Other Projects Subtotal $ 1,550,000 $ 2,500,000 $ 3,000,000 $ 2,000,000 $ ‐ $ 9,050,000<br />
Funding Sources<br />
Grants $ (3,831,214) $ (5,850,000) $ (4,000,000) $ ‐ $ ‐ $ (13,681,214)<br />
Bond Proceeds (17,736,688) (26,000,000) (9,400,000) (9,700,000) (20,000,000) (82,836,688)<br />
<strong>TriMet</strong> (14,329,275) (15,801,600) (40,994,756) (14,259,561) (24,983) (85,410,175)<br />
Other ‐ ‐ ‐ ‐ ‐ ‐<br />
PMLR ‐ ‐ ‐ ‐ ‐ ‐<br />
Funding Sources Total $ (35,897,177) $ (47,651,600) $ (54,394,756) $ (23,959,561) $ (20,024,983) $ (181,928,077)<br />
VEHICLES GRAND TOTAL $ 35,897,177 $ 47,651,600 $ 54,394,756 $ 23,959,561 $ 20,024,983 $ 181,928,077<br />
Page ‐ 177
<strong>Capital</strong> <strong>Asset</strong> <strong>Management</strong> & <strong>Investment</strong> Program Appendix Summaries<br />
Maintenance of Way Summary<br />
Maintenance of Way <strong>FY</strong>14 <strong>FY</strong>15 <strong>FY</strong>16 <strong>FY</strong>17 <strong>FY</strong>18<br />
Total<br />
<strong>FY</strong>14-<strong>FY</strong>18<br />
MOW Program<br />
Track & Structures $3,114,500 $1,332,500 $1,291,000 $1,209,800 $1,907,500 $ 8,855,300<br />
Overhead Catenary System $23,000 252,500 563,000 563,500 604,000 2,006,000<br />
Signals $220,000 170,000 199,000 301,000 412,500 1,302,500<br />
Substations $104,500 188,250 353,000 231,000 232,500 1,109,250<br />
FEM Communications ‐ 45,000 36,000 ‐ ‐ 81,000<br />
Maintenance of Way Subtotal $ 3,462,000 $ 1,988,250 $ 2,442,000 $ 2,305,300 $ 3,156,500 $ 13,354,050<br />
MOW Projects<br />
Conversion of MAX Track Switches $ ‐ $ 550,000 $ 3,500,000 $ 6,000,000 $ 6,100,000 $ 16,150,000<br />
Ruby Junction MOW Training Module 752,600 ‐ ‐ ‐ ‐ 752,600<br />
Steel Bridge Improvements 500,000 ‐ ‐ ‐ ‐ 500,000<br />
Kubota L Series 9 FT Backhoe 66,000 ‐ ‐ ‐ ‐ 66,000<br />
Non‐Revenue Vehicles Subtotal $ 1,318,600 $ 550,000 $ 3,500,000 $ 6,000,000 $ 6,100,000 $ 17,468,600<br />
Funding Sources<br />
Grants $ ‐ $ ‐ $ ‐ $ ‐ $ ‐ $<br />
‐<br />
Bond Proceeds ‐ ‐ ‐ ‐ ‐ ‐<br />
<strong>TriMet</strong> (4,780,600) (2,538,250) (5,942,000) (8,305,300) (9,256,500) (30,822,650)<br />
Other ‐ ‐ ‐ ‐ ‐ ‐<br />
TBD ‐ ‐ ‐ ‐ ‐ ‐<br />
Funding Sources Total $ (4,780,600) $ (2,538,250) $ (5,942,000) $ (8,305,300) $ (9,256,500) $ (30,822,650)<br />
MAINTENANCE OF WAY GRAND TOTAL $ 4,780,600 $ 2,538,250 $ 5,942,000 $ 8,305,300 $ 9,256,500 $ 30,822,650<br />
Page ‐ 178
<strong>Capital</strong> <strong>Asset</strong> <strong>Management</strong> & <strong>Investment</strong> Program Appendix Summaries<br />
Facilities – Customer & Operations Summary<br />
Facilities ‐ Customer & Operations <strong>FY</strong>14 <strong>FY</strong>15 <strong>FY</strong>16 <strong>FY</strong>17 <strong>FY</strong>18<br />
Total<br />
<strong>FY</strong>14-<strong>FY</strong>18<br />
Customer Facilities<br />
Bus Stop Development ‐ New Shelters $ 158,000 $ 166,000 $ 174,000 $ 194,000 $ ‐ $ 692,000<br />
Customer Information Services 30,000 55,000 55,000 55,000 80,000 275,000<br />
Neighborhood Shelters Replacement 30,000 30,000 30,000 30,000 30,000 150,000<br />
Neighborhood Shelters Refurbishment 100,000 100,000 100,000 108,000 108,000 516,000<br />
Bus Shelters 6,250 6,250 6,250 6,250 6,250 31,250<br />
Bus On‐Street Maintenance 100,000 100,000 100,000 100,000 100,000 500,000<br />
Bike to Transit Facilities 25,000 25,000 25,000 25,000 25,000 125,000<br />
Lloyd District Transit Tracker 10,000 10,000 10,000 10,000 ‐ 40,000<br />
Respond to ADA Audit 310,000 300,000 50,000 50,000 50,000 760,000<br />
Park & Ride Signage Share 25,000 25,000 25,000 25,000 25,000 125,000<br />
Renew the Blue 2,463,000 2,463,000 2,463,000 2,463,000 2,463,000 12,315,000<br />
Customer Facilities Subtotal $ 3,257,250 $ 3,280,250 $ 3,038,250 $ 3,066,250 $ 2,887,250 $ 15,529,250<br />
Operating Facilities<br />
Facilities <strong>Management</strong><br />
Building Area/Components $ 981,496 $ 1,119,105 $ 1,504,061 $ 863,710 $ 259,500 $ 4,727,872<br />
Electrical Equipment & Systems 45,000 30,000 260,000 45,000 ‐ 380,000<br />
HVAC Equipment & Systems 463,076 506,779 249,600 140,798 ‐ 1,360,253<br />
Lifting Equipment & Systems 472,000 247,000 473,640 278,509 27,000 1,498,149<br />
Plumbing Systems ‐ 45,000 95,000 ‐ ‐ 140,000<br />
Safety/Hazmat Systems 6,193 ‐ 6,193 ‐ 6,193 18,579<br />
Site/Property Improvements 1,518,559 1,697,061 2,842,935 261,222 183,709 6,503,486<br />
Other Equipment & Systems 101,500 419,500 408,500 98,500 98,500 1,126,500<br />
Facilities <strong>Management</strong> Subtotal $ 3,587,824 $ 4,064,445 $ 5,839,929 $ 1,687,739 $ 574,902 $ 15,754,839<br />
Environmental<br />
All Facilities Maintenance Environmental $ 125,000 $ 125,000 $ 125,000 $ 125,000 $ 125,000 $ 625,000<br />
Merlo UST Replacement 150,000 ‐ ‐ ‐ ‐ 150,000<br />
Storm Water UIC Program ‐ 250,000 500,000 500,000 250,000 1,500,000<br />
Environmental Subtotal $ 275,000 $ 375,000 $ 625,000 $ 625,000 $ 375,000 $ 2,275,000<br />
Center Street Bldg ‐ End of Life Maintenance $ 3,419,883 $ ‐ $ ‐ $ ‐ $ ‐ $ 3,419,883<br />
Center Street Bldg ‐ First Floor Remodel 2,340,689 ‐ ‐ ‐ ‐ 2,340,689<br />
Line 8 & 17 Bus Turnaround & Layover Facility 400,000 500,000 900,000<br />
Union Station Area Bus Layover ‐ 1,750,000 ‐ ‐ ‐ 1,750,000<br />
Operating Facilities Subtotal $ 10,023,396 $ 6,689,445 $ 6,464,929 $ 2,312,739 $ 949,902 $ 26,440,411<br />
Funding Sources<br />
Grants $ (141,773) $ (198,303) $ (205,482) $ (223,428) $ (71,784) $ (840,770)<br />
Bond Proceeds ‐ ‐ ‐ ‐ ‐ ‐<br />
General Fund (13,128,873) (9,771,392) (9,297,697) (5,155,561) (3,765,368) (41,118,891)<br />
Other (10,000) ‐ ‐ ‐ ‐ (10,000)<br />
TBD ‐ ‐ ‐ ‐ ‐ ‐<br />
Funding Sources Grand Total $ (13,280,646) $ (9,969,695) $ (9,503,179) $ (5,378,989) $ (3,837,152) $ (41,969,661)<br />
FACILITIES ‐ CUSTOMER & OPERATIONS GRAND TOTAL $ 13,280,646 $ 9,969,695 $ 9,503,179 $ 5,378,989 $ 3,837,152 $ 41,969,661<br />
Page ‐ 179
<strong>Capital</strong> <strong>Asset</strong> <strong>Management</strong> & <strong>Investment</strong> Program Appendix Summaries<br />
Technology Systems Summary<br />
TECHNOLOGY SYSTEMS <strong>FY</strong>14 <strong>FY</strong>15 <strong>FY</strong>16 <strong>FY</strong>17 <strong>FY</strong>18<br />
Total<br />
<strong>FY</strong>14-<strong>FY</strong>18<br />
Operations Control & Communication Systems<br />
Bus Dispatch System $ ‐ $ 385,000 $ 385,000 $ 385,000 $ ‐ $ 1,155,000<br />
Bus Dispatch System (capitalized labor/fringe) 68,447 ‐ ‐ ‐ ‐ 68,447<br />
FMIS/MMIS (capitalized labor/fringe) 40,512 ‐ ‐ ‐ ‐ 40,512<br />
LIFT Dispatch System ‐ 72,000 72,000 72,000 ‐ 216,000<br />
Rail Control & SCADA System (non‐PMLR) ‐ ‐ ‐ ‐ ‐ ‐<br />
Radio & Microwave Communications System ‐ ‐ ‐ ‐ ‐ ‐<br />
Operations Control & Communication Systems Subtotal $ 108,959 $ 457,000 $ 457,000 $ 457,000 $ ‐ $ 1,479,959<br />
Fare Systems<br />
Fare Equipment $ 5,200 $ ‐ $ 3,600 $ 4,700 $ ‐ $ 13,500<br />
Fare System Replacement Program 109,000 227,000 ‐ ‐ ‐ 336,000<br />
Electronic Fare Collection System 1,550,000 5,150,000 5,150,000 5,050,000 1,617,790 18,517,790<br />
E‐Fare System (capitalized labor/fringe) 37,398 ‐ ‐ ‐ ‐ 37,398<br />
Fare Pull Station 124,000 ‐ ‐ ‐ ‐ 124,000<br />
Fare Systems Subtotal $ 1,825,598 $ 5,377,000 $ 5,153,600 $ 5,054,700 $ 1,617,790 $ 19,028,688<br />
Security Equipment Systems<br />
Networked CCTV System $ 125,000 $ 250,000 $ 250,000 $ 250,000 $ 250,000 $ 1,125,000<br />
Vehicle‐Borne CCTV Systems 664,800 664,800 664,800 664,800 664,800 3,324,000<br />
MAX Intrusion Detection Systems ‐ ‐ 60,000 ‐ ‐ 60,000<br />
<strong>TriMet</strong> Facilities Access Control Systems (TRACS) 20,000 20,000 20,000 20,000 20,000 100,000<br />
Security Equipment Systems Subtotal $ 809,800 $ 934,800 $ 994,800 $ 934,800 $ 934,800 $ 4,609,000<br />
Technology Equipment Systems<br />
Desktop Systems $ 566,600 $ 391,800 $ 272,500 $ 252,000 $ 292,700 $ 1,775,600<br />
Server <strong>Capital</strong> 356,000 409,000 501,250 506,000 700,100 2,472,350<br />
Cable Plant 80,000 50,000 30,000 30,000 30,000 220,000<br />
Data Communications 328,000 226,800 416,200 844,000 472,300 2,287,300<br />
Voice Systems 241,000 95,000 40,000 47,600 40,000 463,600<br />
IT Security 86,000 41,400 5,000 5,000 73,000 210,400<br />
Communications Environment Systems 556,250 10,000 138,000 10,000 38,500 752,750<br />
Finance and Admin Systems 920,000 360,000 ‐ ‐ ‐ 1,280,000<br />
Human Resource Systems 250,000 ‐ ‐ ‐ ‐ 250,000<br />
Human Resource Systems (capitalized labor/fringe) 47,296 ‐ ‐ ‐ ‐ 47,296<br />
Customer Information Systems 235,000 ‐ ‐ ‐ ‐ 235,000<br />
Technology Equipment Systems Subtotal $ 3,666,146 $ 1,584,000 $ 1,402,950 $ 1,694,600 $ 1,646,600 $ 9,994,296<br />
Other Projects<br />
Operator Training Equipment $ 400,000 $ ‐ $ ‐ $ ‐ $ ‐ $ 400,000<br />
Digital Sign CPU Retrofit 92,730 ‐ ‐ ‐ ‐ 92,730<br />
Call‐A‐Bus Replacement 225,000 ‐ ‐ ‐ ‐ 225,000<br />
Disaster Reovery Network Upgrades 600,000 ‐ ‐ ‐ ‐ 600,000<br />
Ruby Server Room Improvements 150,000 ‐ ‐ ‐ ‐ 150,000<br />
Single Sign‐On 230,000 ‐ ‐ ‐ ‐ 230,000<br />
TimeClock Replacement 100,000 ‐ ‐ ‐ ‐ 100,000<br />
E‐Citation 220,324 ‐ ‐ ‐ ‐ 220,324<br />
Other Projects Subtotal $ 2,018,054 $ ‐ $ ‐ $ ‐ $ ‐ $ 2,018,054<br />
Funding Sources<br />
Grants (non‐PMLR) $ ‐ $ ‐ $ ‐ $ ‐ $ ‐ $<br />
‐<br />
Bond Proceeds ‐ ‐ ‐ ‐ ‐ ‐<br />
General Fund (8,428,557) (8,352,800) (8,008,350) (8,141,100) (4,199,190) (37,129,997)<br />
Other ‐ ‐ ‐ ‐ ‐ ‐<br />
PMLR ‐ ‐ ‐ ‐ ‐ ‐<br />
Funding Sources Total $ (8,428,557) $ (8,352,800) $ (8,008,350) $ (8,141,100) $ (4,199,190) $ (37,129,997)<br />
Page ‐ 180
<strong>Capital</strong> <strong>Asset</strong> <strong>Management</strong> & <strong>Investment</strong> Program Appendix Summaries<br />
New/Improved Service Summary<br />
New/Improved Service <strong>FY</strong>14 <strong>FY</strong>15 <strong>FY</strong>16 <strong>FY</strong>17 <strong>FY</strong>18<br />
Total<br />
<strong>FY</strong>14-<strong>FY</strong>18<br />
Projects<br />
BRT First Corridor $ 100,000 $ 6,000,000 $ 20,000,000 $ 15,000,000 $ ‐ $ 41,100,000<br />
Tigard Park & Ride Expansion ‐ ‐ 750,000 ‐ ‐ 750,000<br />
Willamette Shore Trolley Program 325,000 50,000 50,000 50,000 50,000 525,000<br />
Projects Subtotal $ 425,000 $ 6,050,000 $ 20,800,000 $ 15,050,000 $ 50,000 $ 42,375,000<br />
STIP Projects<br />
Barbur‐99W Corridor Safety & Access to Transit $ ‐ $ ‐ $ 920,400 $ 495,600 $ ‐ $ 1,416,000<br />
Cornell‐Evergreen‐229th Corridor Safety & Access to Transit ‐ ‐ 422,500 227,500 650,000<br />
Highway 8 Corridor Safety & Access to Transit ‐ ‐ 1,134,900 611,100 1,746,000<br />
Powell‐Division Corridor Safety & Access to Transit ‐ ‐ 1,216,800 655,200 1,872,000<br />
Main Street‐10th to 15th ‐ Oregon City (co‐sponsor) ‐ ‐ 104,000 56,000 160,000<br />
Molalla Avenue‐Beavercreek‐Hwy213‐Oregon City (co‐sponsor) ‐ ‐ 94,936 51,120 146,056<br />
Transit Corridor Pedestrian Improvements ‐ Milwaukie (co‐sponsor) ‐ ‐ 234,000 126,000 360,000<br />
STIP Projects Subtotal $ ‐ $ ‐ $ 4,127,536 $ 2,222,520 $ ‐ $ 6,350,056<br />
Funding Sources<br />
Grants $ (100,000) $ (6,000,000) $ (23,725,333) $ (17,005,949) $ ‐ $ (46,831,282)<br />
Bond Proceeds ‐ ‐ ‐ ‐ ‐ ‐<br />
General Fund (125,000) (50,000) (1,202,203) (266,571) (50,000) (1,693,774)<br />
Other (200,000) ‐ ‐ ‐ ‐ (200,000)<br />
TBD ‐ ‐ ‐ ‐ ‐ ‐<br />
Funding Sources Grand Total $ (425,000) $ (6,050,000) $ (24,927,536) $ (17,272,520) $ (50,000) $ (48,725,056)<br />
NEW/IMPROVED SERVICE GRAND TOTAL $ 425,000 $ 6,050,000 $ 24,927,536 $ 17,272,520 $ 50,000 $ 48,725,056<br />
Page ‐ 181
<strong>Capital</strong> <strong>Asset</strong> <strong>Management</strong> & <strong>Investment</strong> Program Appendix Summaries<br />
Combined Summary<br />
<strong>Capital</strong> <strong>Asset</strong> <strong>Management</strong> & <strong>Investment</strong> Program <strong>FY</strong>14 <strong>FY</strong>15 <strong>FY</strong>16 <strong>FY</strong>17 <strong>FY</strong>18<br />
Total<br />
<strong>FY</strong>14-<strong>FY</strong>18<br />
Vehicles<br />
Fixed Route Buses $ 28,700,346 $ 35,767,395 $ 43,138,798 $ 19,857,105 $ 19,541,618 $ 147,005,262<br />
Light Rail Vehicles 3,660,330 3,215,505 1,223,039 635,396 443,365 9,177,635<br />
ATP/LIFT Vehicles 4,000 4,385,500 5,327,000 76,000 40,000 9,832,500<br />
Non‐Revenue Vehicles 1,982,500 1,783,200 1,705,920 1,391,060 ‐ 6,862,680<br />
Other Vehicle Projects 1,550,000 2,500,000 3,000,000 2,000,000 ‐ 9,050,000<br />
Vehicles Subtotal $ 35,897,176 $ 47,651,600 $ 54,394,756 $ 23,959,561 $ 20,024,983 $ 181,928,076<br />
Maintenance of Way<br />
Track & Structures $ 3,114,500 $ 1,332,500 $ 1,291,000 $ 1,209,800 $ 1,907,500 $ 8,855,300<br />
Overhead Catenary System 23,000 252,500 563,000 563,500 604,000 2,006,000<br />
Signals 220,000 170,000 199,000 301,000 412,500 1,302,500<br />
Substations 104,500 188,250 353,000 231,000 232,500 1,109,250<br />
Communications ‐ 45,000 36,000 ‐ ‐ 81,000<br />
Other MOW Projects 1,318,600 550,000 3,500,000 6,000,000 6,100,000 17,468,600<br />
Maintenance of Way Subtotal $ 4,780,600 $ 2,538,250 $ 5,942,000 $ 8,305,300 $ 9,256,500 $ 30,822,650<br />
Facilities ‐ Customer & Operations<br />
Customer Facilities $ 3,257,250 $ 3,280,250 $ 3,038,250 $ 3,066,250 $ 2,887,250 $ 15,529,250<br />
Operating Facilities 10,023,396 6,689,445 6,464,929 2,312,739 949,902 26,440,411<br />
Facilities ‐ Customer & Operations Subtotal $ 13,280,646 $ 9,969,695 $ 9,503,179 $ 5,378,989 $ 3,837,152 $ 41,969,661<br />
Technology Systems<br />
Operations Control & Communications Equipment $ 108,959 $ 457,000 $ 457,000 $ 457,000 $ ‐ $ 1,479,959<br />
Fare Systems 1,825,598 5,377,000 5,153,600 5,054,700 1,617,790 19,028,688<br />
Security Equipment Systems 809,800 934,800 994,800 934,800 934,800 4,609,000<br />
Technology Equipment Systems 3,666,146 1,584,000 1,402,950 1,694,600 1,646,600 9,994,296<br />
Other Projects 2,018,054 ‐ ‐ ‐ ‐ 2,018,054<br />
Technology Systems Subtotal $ 8,428,557 $ 8,352,800 $ 8,008,350 $ 8,141,100 $ 4,199,190 $ 37,129,997<br />
New Improved Service<br />
Other Projects $ 425,000 $ 6,050,000 $ 20,800,000 $ 15,050,000 $ 50,000 $ 42,375,000<br />
STIP Projects ‐ ‐ 4,127,536 2,222,520 ‐ 6,350,056<br />
New‐Improved Service Subtotal $ 425,000 $ 6,050,000 $ 24,927,536 $ 17,272,520 $ 50,000 $ 48,725,056<br />
Funding Sources<br />
Grants $ (4,072,987) $ (12,048,303) $ (27,930,815) $ (17,229,377) $ (71,784) $ (61,353,266)<br />
Bond Proceeds (17,736,688) (26,000,000) (9,400,000) (9,700,000) (20,000,000) (82,836,688)<br />
<strong>TriMet</strong> (32,363,747) (28,161,242) (57,436,656) (27,986,993) (13,096,851) (159,045,489)<br />
Other (8,638,557) (8,352,800) (8,008,350) (8,141,100) (4,199,190) (37,339,997)<br />
PMLR ‐ ‐ ‐ ‐ ‐ ‐<br />
Funding Sources Total $ (62,811,979) $ (74,562,345) $ (102,775,821) $ (63,057,470) $ (37,367,825) $ (340,575,440)<br />
CAPITAL ASSET MANAGEMENT & INVESTMENT GRAND TOTAL $ 62,811,979 $ 74,562,345 $ 102,775,821 $ 63,057,470 $ 37,367,825 $ 340,575,440<br />
Page ‐ 182
<strong>Capital</strong> <strong>Asset</strong> <strong>Management</strong> & <strong>Investment</strong> Program Appendix Fixed Route Buses<br />
Projected Bus Replacement Schedule<br />
TABLE 1A. FIXED ROUTE BUSES - ACTIVE FLEET <strong>2014</strong><br />
BUS <strong>FY</strong> BUS FLEET BUS MAKE & AGE REPLACE BUSES ACTIVE FLEET SIZE AT FISCAL YEAR END<br />
FLEET ACQ LNGTH SIZE DESCRIPTION <strong>FY</strong>14 END <strong>FY</strong> 11/7/12 <strong>2014</strong> 2015 2016 2017 2018<br />
37 1991 40 63 Gillig 1400s 23 <strong>2014</strong> 22 21 0 0 0 0<br />
38 1991 30 30 Gillig 1600s 23 2013 10 10 0 0 0 0<br />
39 1991 30 13 Gillig 1600s 23 2013 6 6 0 0 0 0<br />
40 1992 40 108 FlxMetro 1700's 22 <strong>2014</strong> 44 0 0 0 0 0<br />
41 1993 30 10 FlxMetro 1900's 21 2013 6 6 0 0 0 0<br />
44 1995 40 27 FlxMetro 1800's 19 <strong>2014</strong> 25 0 0 0 0 0<br />
46 1998 40 22 New Flyer (Low Floor) 16 2017 22 22 5 0 0 0<br />
47 1998 40 60 Gillig 2100s 16 2017 60 60 60 1 0 0<br />
48 1998 40 5 Gillig 2100s 16 2017 5 5 5 5 0 0<br />
49 1999 40 58 New Flyer (Low Floor) 15 2019 58 58 58 58 4 0<br />
51 1999 40 60 New Flyer (Low Floor) 15 2020 60 60 60 60 60 24<br />
52 2001 40 60 New Flyer (Low Floor) 13 2022 59 59 59 59 59 59<br />
53 2002 40 2 New Flyer (Diesel-Electric) 12 2022 0 0 0 0 0 0<br />
54 2003 40 55 New Flyer (Low Floor) 11 2023 55 55 55 55 55 55<br />
55 2004 40 25 New Flyer (Low Floor) 10 2024 25 25 25 25 25 25<br />
56 2006 40 39 New Flyer (Low Floor) 8 2025 39 39 39 39 39 39<br />
57 2009 40 40 New Flyer (Low Floor) 5 2026 40 40 40 40 40 40<br />
58 2012 40 51 Gillig (Low Floor) 2 2029 51 51 51 51 51 51<br />
59 2012 40 4 Gillig (Low Floor BAE Hyb) 2 2029 4 4 4 4 4 4<br />
60 2013 40 70 Low Floor 1 2030 0 70 70 70 70 70<br />
61 <strong>2014</strong> 30 25 Low Floor 0 2030 0 0 25 25 25 25<br />
62 <strong>2014</strong> 40 35 Low Floor 0 2031 0 0 35 35 35 35<br />
63 2015 40 4 Low Floor (Super Hybrids) 0 2032 0 0 0 4 4 4<br />
64 2015 40 40 Low Floor 0 2032 0 0 0 60 60 60<br />
65 2016 40 40 Low Floor 0 2033 0 0 0 0 60 60<br />
66 2017 40 40 Low Floor 0 2034 0 0 0 0 0 40<br />
Total Fleet Size (Without Expansion or Special Services* Buses) 591 591 591 591 591 591<br />
Page ‐ 183
<strong>Capital</strong> <strong>Asset</strong> <strong>Management</strong> & <strong>Investment</strong> Program Appendix Fixed Route Buses<br />
Projected Bus Replacement Schedule (continued)<br />
ACTIVE FLEET CONTINUED<br />
Weighted Average Replacement Fleet Age At Year End 10.92 9.81 8.96 8.32 8.16<br />
Weighted Average Active (Replacement + Expansion) Fleet Age At Year End 10.92 9.81 8.96 8.32 8.13<br />
Low Floor Fleet (w/o Expansion Buses) => 413 483 526 585 591 591<br />
Standard (High Floor) Fleet (w/o Expansion Buses) => 178 108 65 6 0 0<br />
Replacement Buses 40 60 60 60 40<br />
Expansion Buses 0 0 0 0 2<br />
Total Buses Purchased 40 60 60 60 42<br />
Average # of Buses Purchased Annually: 45<br />
Average # of Replacement Buses Annually: 44<br />
Total Fleet Size Including Expansion Buses 591 591 591 591 593<br />
Current<br />
FLEET REQUIRED 11/7/12 <strong>2014</strong> 2015 2016 2017 2018<br />
Annual Service Expansion => 0.50% 0.50% 0.50% 0.50% 0.50%<br />
Weekly Bus Vehicle Hours 36374 36556 36739 36922 37107 37292<br />
Estimated Peak Pullouts 495 495 500 503 505 507<br />
Spares 83 83 83 83 83 83<br />
Total Fleet Required (Excluding Special Services* Buses) 578 578 583 586 588 590<br />
Spare Ratio (based on actual fleet): 19.39% 19.39% 18.20% 17.50% 17.03% 16.96%<br />
Spare Ratio (based on required fleet): 16.77% 16.77% 16.60% 16.50% 16.44% 16.37%<br />
Page ‐ 184
<strong>Capital</strong> <strong>Asset</strong> <strong>Management</strong> & <strong>Investment</strong> Program Appendix Fixed Route Buses<br />
Projected Bus Replacement Schedule (continued)<br />
TABLE 1A. FIXED ROUTE BUSES - EXPANSION & RESERVE FLEET<br />
EXPANSION FLEET REQUIREMENT<br />
BUS YEAR BUS FLEET BUS MAKE & AGE REPLACE Buses<br />
FLEET BUILT LENGTH SIZE DESCRIPTION <strong>FY</strong>14 END <strong>FY</strong> 11/7/12 <strong>2014</strong> 2015 2016 2017 2018<br />
65 2018 40 0 Low Floor 0 2034 0 0 0 0 0 2<br />
66 2019 40 0 Low Floor 0 2035 0 0 0 0 0 0<br />
67 2020 40 0 Low Floor 0 2036 0 0 0 0 0 0<br />
68 2021 40 0 Low Floor 0 2037 0 0 0 0 0 0<br />
69 2022 40 0 Low Floor 0 2038 0 0 0 0 0 0<br />
70 2023 40 0 Low Floor 0 2039 0 0 0 0 0 0<br />
71 2024 40 0 Low Floor 0 2040 0 0 0 0 0 0<br />
72 2025 40 0 Low Floor 0 2041 0 0 0 0 0 0<br />
2026 40 0 Low Floor 0 2042 0 0 0 0 0 0<br />
2027 40 0 Low Floor 0 2043 0 0 0 0 0 0<br />
73 2028 40 0 Low Floor 0 2044 0 0 0 0 0 0<br />
73 2028 40 0 Low Floor 0 2044 0 0 0 0 0 0<br />
Total Expansion Fleet Requirement 0 0 0 0 0 2<br />
Page ‐ 185
<strong>Capital</strong> <strong>Asset</strong> <strong>Management</strong> & <strong>Investment</strong> Program Appendix Fixed Route Buses<br />
Projected Bus Replacement Schedule (continued)<br />
Buses<br />
CONTINGENCY FLEET 11/7/12 <strong>2014</strong> 2015 2016 2017 2018<br />
Gillig Fleet 37 7 0 0 0 0 0<br />
Gillig Fleet 38 12 0 0 0 0 0<br />
Gillig Fleet 39 2 0 0 0 0 0<br />
Flx Metro Fleet 40 12 5 0 0 0 0<br />
Flx Metro Fleet 41 0 0 0 0 0 0<br />
Flx Metro Fleet 44 1 15 20 0 0 0<br />
Flx Metro Fleet 45 0 0 0 0 0 0<br />
New Flyer Fleet 46 0 0 0 0 20 0<br />
Gillig Fleet 47 1 0 0 20 0 0<br />
Gillig Fleet 48 0 0 0 0 0 0<br />
New Flyer Fleet 49 0 0 0 0 0 20<br />
Collins Fleet 50 0 0 0 0 0 0<br />
New Flyer Fleet 51 0 0 0 0 0 0<br />
New Flyer Fleet 52 0 0 0 0 0 0<br />
New Flyer Hybrids Fleet 53 0 0 0 0 0 0<br />
Low Floor Fleet 54 0 0 0 0 0 0<br />
Low Floor Fleet 55 0 0 0 0 0 0<br />
Low Floor Fleet 56 0 0 0 0 0 0<br />
Low Floor Fleet 57 0 0 0 0 0 0<br />
Low Floor Fleet 58 0 0 0 0 0 0<br />
Low Floor Fleet 59 0 0 0 0 0 0<br />
Low Floor Fleet 60 0 0 0 0 0 0<br />
Low Floor Fleet 61 0 0 0 0 0 0<br />
Low Floor Fleet 62 0 0 0 0 0 0<br />
Total Reserve Fleet 35 20 20 20 20 20<br />
Page ‐ 186
<strong>Capital</strong> <strong>Asset</strong> <strong>Management</strong> & <strong>Investment</strong> Program Appendix Fixed Route Buses<br />
Bus Replacement Schedule (continued)<br />
TABLE 1B. VEHICLE SYSTEMS - FIXED ROUTE BUSES<br />
CAPITAL REQUIREMENTS<br />
ITEM REQUIRED<br />
# OF<br />
VEHICLES<br />
YEAR<br />
NEEDED<br />
OPTIMUM<br />
REPLACEMENT<br />
CYCLE <strong>2014</strong> 2015 2016 2017 2018<br />
<strong>FY</strong>14-<strong>FY</strong>18<br />
TOTAL<br />
Replacement Buses<br />
Low Floor 40-foot Buses 35 <strong>2014</strong> 16 Yrs/675,000 $15,470,000 $15,470,000<br />
Low Floor 30-foot Buses 25 <strong>2014</strong> 16 Yrs/675,000 $10,675,000 $10,675,000<br />
Low Floor 40-foot Buses 4 2015 16 Yrs/675,000 $2,866,000 $2,866,000<br />
Low Floor 40-foot Hybrid Buses 60 2015 16 Yrs/675,000 $26,520,000 $26,520,000<br />
Low Floor 40-foot Buses 60 2016 16 Yrs/675,000 $26,520,000 $26,520,000<br />
Low Floor 40-foot Buses 40 2017 16 Yrs/675,000 $17,680,000 $17,680,000<br />
Low Floor 40-foot Buses 40 2018 16 Yrs/675,000 $17,680,000 $17,680,000<br />
Total Replacement . . . . $26,145,000 $29,386,000 $26,520,000 $17,680,000 $17,680,000 $117,411,000<br />
Expansion Buses<br />
Low Floor 40-foot Buses 0 <strong>2014</strong> 16 Yrs/675,000 $0 $0<br />
Low Floor 40-foot Buses 0 2015 16 Yrs/675,000 $0 $0<br />
Low Floor 40-foot Buses 0 2016 16 Yrs/675,000 $0 $0<br />
Low Floor 40-foot Buses 0 2017 16 Yrs/675,000 $0 $0<br />
Low Floor 40-foot Buses 0 2018 16 Yrs/675,000 $0 $0<br />
Total Expansion . . . .<br />
$0 $0 $0 $0 $0 $0<br />
Procurement Costs<br />
Inspections Costs for Bus Buys $150,000 $150,000 $150,000 $150,000 $150,000 $750,000<br />
Total Procurement Costs . . . . $150,000 $150,000 $150,000 $150,000 $150,000 $750,000<br />
TOTAL . . . .<br />
$26,295,000 $29,536,000 $26,670,000 $17,830,000 $17,830,000 $118,161,000<br />
Page ‐ 187
<strong>Capital</strong> <strong>Asset</strong> <strong>Management</strong> & <strong>Investment</strong> Program Appendix Fixed Route Buses<br />
Fixed Route Bus – Bus Component Replacements<br />
TABLE 1C. VEHICLE COMPONENT REPLACEMENT ‐ FIXED ROUTE BUS ‐ CAPITAL REQUIREMENTS<br />
Unit Estimated Replacements Estimated Replacement Costs <strong>FY</strong>14‐<strong>FY</strong>18<br />
Maintenance Item Fleet Cost <strong>FY</strong>14 <strong>FY</strong>15 <strong>FY</strong>16 <strong>FY</strong>17 <strong>FY</strong>18 <strong>FY</strong>14 <strong>FY</strong>15 <strong>FY</strong>16 <strong>FY</strong>17 <strong>FY</strong>18 Total<br />
EPA ‐ Engines<br />
2000 $20,617 3 2 2 $61,851 $41,234 $41,234 $0 $0 $144,319<br />
2101‐2160 $17,838 5 17 18 7 $0 $89,190 $303,246 $321,084 $124,866 $838,386<br />
2161‐2165 $17,838 1 1 3 $0 $0 $17,838 $17,838 $53,514 $89,190<br />
2201‐2258 $17,250 3 20 19 4 1 $51,750 $345,000 $327,750 $69,000 $17,250 $810,750<br />
2259‐2318 $17,250 3 22 16 1 2 $51,750 $379,500 $276,000 $17,250 $34,500 $759,000<br />
2500 $17,250 8 17 14 5 $0 $138,000 $293,250 $241,500 $86,250 $759,000<br />
2600 $17,250 2 1 13 26 $0 $34,500 $17,250 $224,250 $448,500 $724,500<br />
2700 $17,250 5 14 $0 $0 $0 $86,250 $241,500 $327,750<br />
2800 $17,250 4 1 $69,000 $0 $0 $17,250 $0 $86,250<br />
2900 $20,385 2 37 1 $0 $40,770 $754,245 $0 $20,385 $815,400<br />
*Engines not avialable reconditioned yet, used new price 3001‐3051 $47,825<br />
*Engines not avialable reconditioned yet, used new price 3052‐3055 $47,825<br />
$234,351 $1,068,194 $2,030,813 $994,422 $1,026,765 $5,354,545<br />
ABE ‐ Alternator Bearing Exchange<br />
*pricing updated to reflect contracted bearing exchange 2201‐2258 $500 17 37 20 37 20 $8,500 $18,500 $10,000 $18,500 $10,000 $65,500<br />
2259‐2318 $500 24 33 28 32 28 $12,000 $16,500 $14,000 $16,000 $14,000 $72,500<br />
2500 $500 28 29 30 29 30 $14,000 $14,500 $15,000 $14,500 $15,000 $73,000<br />
$34,500 $49,500 $39,000 $49,000 $39,000 $211,000<br />
ABR ‐ Front Air Bag Replacement<br />
*All bags priced at single units 2201‐2258 $80 31 15 4 12 32 $4,958 $2,399 $640 $1,919 $5,117 $15,032<br />
*All New Flyers use 2 bags for front suspension 2259‐2318 $80 12 30 18 7 $1,919 $4,798 $2,879 $0 $1,119 $10,715<br />
*All Gilligs use 4 bags for front suspension 2500 $80 11 13 12 20 7 $1,759 $2,079 $1,919 $3,198 $1,119 $10,075<br />
2600 $80 9 14 28 4 12 $1,439 $2,239 $4,478 $640 $1,919 $10,715<br />
2700 $80 7 5 9 6 5 $1,119 $800 $1,439 $960 $800 $5,117<br />
2800 $80 7 18 10 4 15 $1,119 $2,879 $1,599 $640 $2,399 $8,636<br />
2900 $80 21 19 30 10 $3,358 $3,038 $0 $4,798 $1,599 $12,794<br />
**Assumed same pricing as flyers 3001‐3051 $80 51 $0 $0 $16,312 $0 $0 $16,312<br />
**Assumed same pricing as flyers 3052‐3055 $80 4 $0 $0 $1,279 $0 $0 $1,279<br />
**Assumed same pricing as flyers Future 40' $80 25 $0 $0 $0 $7,996 $0 $7,996<br />
**Assumed same pricing as flyers Future 30'/35' $80 15 $0 $0 $0 $4,798 $0 $4,798<br />
**Assumed same pricing as flyers Future 40' $80 40 $0 $0 $0 $0 $12,794 $12,794<br />
$15,672 $18,231 $30,545 $24,948 $26,867 $116,262<br />
Page ‐ 188
<strong>Capital</strong> <strong>Asset</strong> <strong>Management</strong> & <strong>Investment</strong> Program Appendix Fixed Route Buses<br />
Fixed Route Bus – Bus Component Replacements (continued)<br />
Unit Estimated Replacements Estimated Replacement Costs <strong>FY</strong>14‐<strong>FY</strong>18<br />
Maintenance Item Fleet Cost <strong>FY</strong>14 <strong>FY</strong>15 <strong>FY</strong>16 <strong>FY</strong>17 <strong>FY</strong>18 <strong>FY</strong>14 <strong>FY</strong>15 <strong>FY</strong>16 <strong>FY</strong>17 <strong>FY</strong>18 Total<br />
BAV ‐ Brake Application valve<br />
1400 $92 11 7 $1,010 $643 $0 $0 $0 $1,653<br />
1601‐1630 $92 7 6 $643 $551 $0 $0 $0 $1,194<br />
1631+ $92 2 7 $184 $643 $0 $0 $0 $826<br />
1700 $92 14 $1,285 $0 $0 $0 $0 $1,285<br />
1900 $92 1 2 $92 $184 $0 $0 $0 $275<br />
1817+ $92 1 $92 $0 $0 $0 $0 $92<br />
2000 $92 5 8 9 5 $459 $735 $826 $459 $0 $2,479<br />
2101‐2160 $92 15 23 22 15 $1,377 $2,112 $2,020 $1,377 $0 $6,887<br />
2161‐2165 $92 4 1 $0 $367 $92 $0 $0 $459<br />
2201‐2258 $92 26 20 11 27 20 $2,387 $1,836 $1,010 $2,479 $1,836 $9,549<br />
2259‐2318 $92 30 16 11 33 16 $2,755 $1,469 $1,010 $3,030 $1,469 $9,733<br />
2500 $92 15 21 20 18 21 $1,377 $1,928 $1,836 $1,653 $1,928 $8,723<br />
2600 $92 11 31 12 12 31 $367 $551 $1,194 $551 $551 $3,214<br />
2700 $92 4 6 13 6 6 $826 $2,112 $643 $735 $2,204 $6,519<br />
2800 $92 9 23 7 8 24 $92 $3,306 $275 $92 $3,306 $7,070<br />
2900 $92 1 36 3 1 36 $0 $0 $4,683 $0 $0 $4,683<br />
**Assumed same pricing as flyers 3001‐3051 $92 51 $0 $0 $367 $0 $0 $367<br />
**Assumed same pricing as flyers 3052‐3055 $92 4 $0 $0 $0 $2,296 $0 $2,296<br />
**Assumed same pricing as flyers Future 30'/35' $92 25 $0 $0 $0 $2,296 $0 $2,296<br />
**Assumed same pricing as flyers Future 40' $92 15 $0 $0 $0 $1,377 $0 $1,377<br />
**Assumed same pricing as flyers Future 40' $92 40 $0 $0 $0 $0 $3,673 $3,673<br />
$12,947 $16,436 $13,957 $16,344 $14,967 $74,650<br />
BRF ‐ Front Brake Relay Valve<br />
*Pricing is assumed to match rear relay valves as front<br />
relay valve pricing was not available.<br />
1700 $20 6 $120 $0 $0 $0 $0 $120<br />
1900 $20 1 $20 $0 $0 $0 $0 $20<br />
1817+ $20 4 $80 $0 $0 $0 $0 $80<br />
2201‐2258 $20 1 3 3 42 6 $20 $60 $60 $838 $120 $1,098<br />
2259‐2318 $20 2 5 4 37 7 $40 $100 $80 $739 $140 $1,098<br />
2500 $20 3 1 3 1 4 $60 $20 $60 $20 $80 $240<br />
$0 $0 $0 $0 $0 $0<br />
$339 $180 $200 $1,597 $339 $2,655<br />
Page ‐ 189
<strong>Capital</strong> <strong>Asset</strong> <strong>Management</strong> & <strong>Investment</strong> Program Appendix Fixed Route Buses<br />
Fixed Route Bus – Bus Component Replacements (continued)<br />
Unit Estimated Replacements Estimated Replacement Costs <strong>FY</strong>14‐<strong>FY</strong>18<br />
Maintenance Item Fleet Cost <strong>FY</strong>14 <strong>FY</strong>15 <strong>FY</strong>16 <strong>FY</strong>17 <strong>FY</strong>18 <strong>FY</strong>14 <strong>FY</strong>15 <strong>FY</strong>16 <strong>FY</strong>17 <strong>FY</strong>18 Total<br />
BRR ‐ Rear Brake Relay Valve<br />
* pricing not provided for all fleets, assumed same<br />
1400 $20 9 5 $181 $101 $0 $0 $0 $282<br />
pricing for all other fleets<br />
1601‐1630 $20 6 5 $121 $101 $0 $0 $0 $221<br />
1631+ $20 2 4 $40 $80 $0 $0 $0 $121<br />
1700 $20 6 $121 $0 $0 $0 $0 $121<br />
1900 $20 1 1 $20 $20 $0 $0 $0 $40<br />
1817+ $20 4 $80 $0 $0 $0 $0 $80<br />
2000 $20 1 21 $0 $0 $20 $423 $0 $443<br />
2101‐2160 $20 3 1 40 9 $60 $20 $805 $181 $0 $1,066<br />
2161‐2165 $20 1 3 1 $0 $20 $60 $20 $0 $101<br />
2201‐2258 $20 2 1 2 53 2 $40 $20 $40 $1,066 $40 $1,207<br />
2259‐2318 $20 3 9 8 28 8 $60 $181 $161 $563 $161 $1,127<br />
2500 $20 45 7 7 $0 $905 $141 $141 $0 $1,187<br />
2600 $20 1 49 2 1 $20 $986 $0 $40 $20 $1,066<br />
2700 $20 1 1 23 $0 $20 $20 $463 $0 $503<br />
2800 $20 1 4 4 30 1 $20 $80 $80 $604 $20 $805<br />
2900 $20 39 1 $0 $785 $20 $0 $0 $805<br />
$765 $3,320 $1,348 $3,501 $241 $9,175<br />
CCF ‐ Crank Case Filter<br />
2201‐2258 $46 55 50 5 55 55 $2,509 $2,281 $228 $2,509 $2,509 $10,034<br />
*Cost is assumed for 2900's on up. 2259‐2318 $46 58 19 39 58 58 $2,645 $867 $1,779 $2,645 $2,645 $10,582<br />
2500 $46 13 10 19 21 21 $593 $456 $867 $958 $958 $3,831<br />
2800 $46 39 1 38 39 39 $1,779 $46 $1,733 $1,779 $1,779 $7,115<br />
2900 $46 40 41 43 44 48 $1,824 $1,870 $1,961 $2,007 $2,189 $9,852<br />
3001‐3051 $46 51 51 51 51 51 $2,326 $2,326 $2,326 $2,326 $2,326 $11,631<br />
3052‐3055 $46 4 4 4 4 4 $182 $182 $182 $182 $182 $912<br />
Future 30'/35' $46 25 25 25 25 $0 $1,140 $1,140 $1,140 $1,140 $4,561<br />
Future 40' $46 15 15 15 15 $0 $684 $684 $684 $684 $2,737<br />
Future 40' $46 40 40 40 $0 $0 $1,824 $1,824 $1,824 $5,473<br />
Future 40' $46 40 40 $0 $0 $0 $1,824 $1,824 $3,649<br />
Future 40' $46 40 $0 $0 $0 $0 $1,824 $1,824<br />
$11,859 $9,852 $12,725 $17,879 $19,886 $72,201<br />
Page ‐ 190
<strong>Capital</strong> <strong>Asset</strong> <strong>Management</strong> & <strong>Investment</strong> Program Appendix Fixed Route Buses<br />
Fixed Route Bus – Bus Component Replacements (continued)<br />
Unit Estimated Replacements Estimated Replacement Costs <strong>FY</strong>14‐<strong>FY</strong>18<br />
Maintenance Item Fleet Cost <strong>FY</strong>14 <strong>FY</strong>15 <strong>FY</strong>16 <strong>FY</strong>17 <strong>FY</strong>18 <strong>FY</strong>14 <strong>FY</strong>15 <strong>FY</strong>16 <strong>FY</strong>17 <strong>FY</strong>18 Total<br />
DPF ‐ Particulate Filter Cleanings<br />
2201‐2258 $220 67 96 73 81 92 $14,740 $21,120 $16,060 $17,820 $20,240 $89,980<br />
*DPF cleaning for 2800's and older is priced assuming 2259‐2318 $220 71 89 80 83 91 $15,620 $19,580 $17,600 $18,260 $20,020 $91,080<br />
half are cleaned as Tier1 and half as Tier2 over the span 2500 $220 45 58 55 43 71 $9,900 $12,760 $12,100 $9,460 $15,620 $59,840<br />
of 5 years. The active regeneration systems on 2900's 2800 $220 105 86 98 94 90 $23,100 $18,920 $21,560 $20,680 $19,800 $104,060<br />
and newer doesn't require as much/intensive of<br />
2900 $180 32 30 34 33 36 $5,760 $5,400 $6,120 $5,940 $6,480 $29,700<br />
cleaning.<br />
3000 $180 51 51 $0 $9,180 $0 $9,180 $0 $18,360<br />
3000 Hyb $180 4 4 $0 $720 $0 $720 $0 $1,440<br />
Future 30'/35 $180 25 25 $0 $0 $4,500 $0 $4,500 $9,000<br />
Future 40' $180 15 15 $0 $0 $2,700 $0 $2,700 $5,400<br />
Future 40' $180 40 $0 $0 $0 $7,200 $0 $7,200<br />
Future 40' $180 40 $0 $0 $0 $0 $7,200 $7,200<br />
$69,120 $87,680 $80,640 $89,260 $96,560 $423,260<br />
EI ‐ Fuel Injectors<br />
*Injector prices are assumed for 2900's and newer due<br />
to not having any data on price for these newer motors.<br />
2201‐2258 $359 4 28 18 6 4 $8,617 $60,320 $38,777 $12,926 $8,617 $129,258<br />
2259‐2318 $359 3 23 22 10 2 $6,463 $49,549 $47,395 $21,543 $4,309 $129,258<br />
2500 $359 4 9 22 19 5 $8,617 $19,389 $47,395 $40,932 $10,772 $127,104<br />
2600 $359 23 29 3 10 $49,549 $62,475 $6,463 $0 $21,543 $140,030<br />
2700 $359 8 17 5 $17,234 $36,623 $0 $0 $10,772 $64,629<br />
2800 $359 22 1 1 19 19 $47,395 $2,154 $2,154 $40,932 $40,932 $133,567<br />
2900 $359 1 39 1 $0 $2,154 $84,018 $0 $2,154 $88,326<br />
3001‐3051 $359 51 $0 $0 $0 $109,869 $0 $109,869<br />
3052‐3055 $359 4 $0 $0 $0 $8,617 $0 $8,617<br />
Future 30'/35' $359 25 $0 $0 $0 $0 $53,858 $53,858<br />
Future 40' $359 15 $0 $0 $0 $0 $32,315 $32,315<br />
$137,875 $232,664 $226,202 $234,819 $185,270 $1,016,830<br />
TCR ‐ Turbo Charger Replacement<br />
*Turbo costs are assumed for 2900's and newer fleets 1631+ $843 2 1 $1,686 $843 $0 $0 $0 $2,529<br />
1700 $945 10 $9,452 $0 $0 $0 $0 $9,452<br />
*1817+ pricing is assumed to match 1700's 1900 $945 2 3 $1,890 $2,836 $0 $0 $0 $4,726<br />
1817+ $832 3 $2,497 $0 $0 $0 $0 $2,497<br />
2000 $980 13 9 12 8 $12,742 $8,821 $11,762 $7,841 $0 $41,165<br />
2101‐2160 $952 15 12 17 13 $14,283 $11,427 $16,188 $12,379 $0 $54,277<br />
2161‐2165 $952 2 0 2 1 $1,904 $0 $1,904 $952 $0 $4,761<br />
2201‐2258 $1,141 4 11 30 11 2 $4,565 $12,555 $34,240 $12,555 $2,283 $66,198<br />
2259‐2318 $1,141 2 11 31 16 0 $2,283 $12,555 $35,382 $18,261 $0 $68,480<br />
Page ‐ 191
<strong>Capital</strong> <strong>Asset</strong> <strong>Management</strong> & <strong>Investment</strong> Program Appendix Fixed Route Buses<br />
Fixed Route Bus – Bus Component Replacements (continued)<br />
Unit Estimated Replacements Estimated Replacement Costs <strong>FY</strong>14‐<strong>FY</strong>18<br />
Maintenance Item Fleet Cost <strong>FY</strong>14 <strong>FY</strong>15 <strong>FY</strong>16 <strong>FY</strong>17 <strong>FY</strong>18 <strong>FY</strong>14 <strong>FY</strong>15 <strong>FY</strong>16 <strong>FY</strong>17 <strong>FY</strong>18 Total<br />
TCR ‐ Turbo Charger Replacement continued . . . 2500 $1,141 10 11 14 15 10 $11,413 $12,555 $15,979 $17,120 $11,413 $68,480<br />
2600 $1,141 10 28 11 4 8 $11,413 $31,958 $12,555 $4,565 $9,131 $69,622<br />
2700 $1,141 4 10 5 6 4 $4,565 $11,413 $5,707 $6,848 $4,565 $33,099<br />
2800 $1,141 6 15 12 7 7 $6,848 $17,120 $13,696 $7,989 $7,989 $53,643<br />
*Pricing for 2900's and newer is assumed, not data yet. 2900 $1,141 8 5 18 11 9 $9,131 $5,707 $20,544 $12,555 $10,272 $58,208<br />
3001‐3051 $1,141 51 $0 $0 $0 $58,208 $0 $58,208<br />
3052‐3055 $1,141 4 $0 $0 $0 $4,565 $0 $4,565<br />
Future 30'/35' $1,141 25 $0 $0 $0 $0 $28,534 $28,534<br />
Future 40' $1,141 15 $0 $0 $0 $0 $17,120 $17,120<br />
$94,674 $127,788 $167,956 $163,840 $91,307 $645,565<br />
TMR ‐ Thermostat Replacement<br />
1400 $26 2 $0 $52 $0 $0 $0 $52<br />
*Prices assumed for newer buses (2900+) 1601‐1630 $26 1 1 $26 $26 $0 $0 $0 $52<br />
1631+ $26 1 $0 $26 $0 $0 $0 $26<br />
1817+ $26 15 $386 $0 $0 $0 $0 $386<br />
2000 $23 7 10 3 3 $319 $455 $137 $137 $0 $1,047<br />
2101‐2160 $26 3 1 2 $77 $26 $52 $0 $0 $155<br />
2161‐2165 $26 1 $0 $0 $0 $26 $0 $26<br />
2201‐2258 $37 4 6 12 33 $150 $225 $449 $1,235 $0 $2,059<br />
2259‐2318 $37 29 4 11 16 $1,085 $150 $412 $599 $0 $2,246<br />
2500 $37 27 9 10 13 $1,011 $337 $374 $487 $0 $2,208<br />
2600 $37 18 29 4 1 7 $674 $1,085 $150 $37 $262 $2,208<br />
2700 $37 12 3 1 6 13 $449 $112 $37 $225 $487 $1,310<br />
2800 $37 4 16 15 4 5 $150 $599 $561 $150 $187 $1,647<br />
2900 $37 1 7 31 0 3 $37 $262 $1,160 $0 $112 $1,572<br />
3001‐3051 $37 51 $0 $0 $1,909 $0 $0 $1,909<br />
3052‐3055 $37 4 $0 $0 $150 $0 $0 $150<br />
Future 30'/35' $37 25 $0 $0 $0 $936 $0 $936<br />
Future 40' $37 15 $0 $0 $0 $561 $0 $561<br />
Future 40' $37 40 $0 $0 $0 $0 $1,497 $1,497<br />
$4,364 $3,354 $5,391 $4,392 $2,545 $20,045<br />
Page ‐ 192
<strong>Capital</strong> <strong>Asset</strong> <strong>Management</strong> & <strong>Investment</strong> Program Appendix Fixed Route Buses<br />
Fixed Route Bus – Bus Component Replacements (continued)<br />
Unit Estimated Replacements Estimated Replacement Costs <strong>FY</strong>14‐<strong>FY</strong>18<br />
Maintenance Item Fleet Cost <strong>FY</strong>14 <strong>FY</strong>15 <strong>FY</strong>16 <strong>FY</strong>17 <strong>FY</strong>18 <strong>FY</strong>14 <strong>FY</strong>15 <strong>FY</strong>16 <strong>FY</strong>17 <strong>FY</strong>18 Total<br />
WTR ‐ Water Pump Replacement<br />
2000 $250 4 12 6 4 $999 $2,996 $1,498 $999 $0 $6,492<br />
2201‐2258 $100 19 37 8 44 $1,900 $3,700 $800 $4,400 $0 $10,800<br />
*Prices assumed for 2900's and newer 2259‐2318 $100 26 32 3 47 12 $2,608 $3,209 $301 $4,714 $1,203 $12,035<br />
2500 $100 17 34 19 24 18 $1,705 $3,410 $1,906 $2,407 $1,805 $11,232<br />
2600 $100 29 23 29 24 24 $2,908 $2,307 $2,908 $2,407 $2,407 $12,937<br />
2700 $100 8 17 6 18 6 $802 $1,705 $602 $1,805 $602 $5,516<br />
2800 $100 22 17 23 17 23 $2,206 $1,705 $2,307 $1,705 $2,307 $10,230<br />
2900 $100 7 17 17 6 17 $702 $1,705 $1,705 $602 $1,705 $6,419<br />
3001‐3051 $100 51 $0 $0 $5,115 $0 $0 $5,115<br />
3052‐3055 $100 4 $0 $0 $401 $0 $0 $401<br />
Future 30'/35' $100 25 $0 $0 $0 $2,507 $0 $2,507<br />
Future 40' $100 15 $0 $0 $0 $1,504 $0 $1,504<br />
Future 40' $100 40 $0 $0 $0 $0 $4,012 $4,012<br />
$13,830 $20,737 $17,542 $23,050 $14,041 $89,200<br />
SSR ‐ Sardo Seat Replacement<br />
EMP Alternator Retrofit<br />
RR ‐ Radiator Replacement<br />
2500 $2,689 20 $53,780 $0 $0 $0 $0 $53,780<br />
$53,780 $0 $0 $0 $0 $53,780<br />
2101‐2160 $2,041 20 20 $40,820 $40,820 $0 $0 $0 $81,640<br />
2161‐2165 $2,041 5 $10,205 $0 $0 $0 $0 $10,205<br />
2600 $2,041 15 40 $30,615 $81,640 $0 $0 $0 $112,255<br />
$81,640 $122,460 $0 $0 $0 $204,100<br />
2201‐2258 $1,680 15 32 16 28 23 $25,200 $53,760 $26,880 $47,040 $38,640 $191,520<br />
2259‐2318 $1,680 7 41 10 30 26 $11,760 $68,880 $16,800 $50,400 $43,680 $191,520<br />
2500 $1,680 24 19 25 25 20 $40,320 $31,920 $42,000 $42,000 $33,600 $189,840<br />
2600 $1,680 40 13 25 29 2 $67,200 $21,840 $42,000 $48,720 $3,360 $183,120<br />
$144,480 $176,400 $127,680 $188,160 $119,280 $756,000<br />
Expected Costs in Routine Maintenance ‐ Grand Totals . . . .<br />
$910,195 $1,936,795 $2,753,998 $1,811,210 $1,637,068 $9,049,266<br />
Expected Costs in YOE $ . . . .<br />
$910,195 $1,985,215 $2,893,419 $1,950,475 $1,807,017<br />
Inflation Factor . . . .<br />
Year . . . .<br />
1.00 1.03 1.05 1.08 1.10<br />
1 2 3 4 5<br />
Assumed Maintenance Budget Baseline . . . .<br />
Estimated Total Maintenance Budget Need . . . .<br />
$6,224,459 $6,380,070 $6,539,572 $6,703,062 $6,870,638<br />
$7,134,654 $8,316,865 $9,293,570 $8,514,272 $8,507,706 $41,767,067<br />
Page ‐ 193
<strong>Capital</strong> <strong>Asset</strong> <strong>Management</strong> & <strong>Investment</strong> Program Appendix Fixed Route Buses<br />
Fixed Route Bus – Bus Maintenance Equipment > $5,000<br />
TABLE 12A <strong>FY</strong>14-<strong>FY</strong>18 BUS MAINTENANCE CAPITAL PROGRAMS - SHOP EQUIPMENT REPLACEMENT/REPAIR (>$5,000)<br />
PROJECT<br />
MANAGER<br />
ACTION<br />
NEEDED<br />
<strong>FY</strong><br />
NEEDED<br />
YEAR OF<br />
PURCHASE<br />
CURRENT<br />
AGE <strong>FY</strong>14<br />
OPTIMUM<br />
REPLACEMENT<br />
CYCLE COND. <strong>FY</strong>14 <strong>FY</strong>15 <strong>FY</strong>16 <strong>FY</strong>17 <strong>FY</strong>18<br />
ITEM REQUIRED<br />
CENTER MAINTENANCE BUILDING<br />
South Shop<br />
Seeley<br />
Crane, Jib Wall 1 Ton (Brake) Replace <strong>2014</strong> 1982 32 10/30 3 $10,000 $10,000<br />
Crane, Jib Wall 2 Ton (Steam) Replace <strong>2014</strong> 1982 32 10/30 1 $20,000 $20,000<br />
Lift Wheel 4 Post (Ari Herta) Replace <strong>2014</strong> 1997 17 10/15 3 $46,000 $46,000<br />
Lift Wheel 4 Post (Ari Herta) New <strong>2014</strong> 10/15 $46,000 $46,000<br />
Parts Cleaner Inland LT32 30035936 Replace 2015 2000 14 10/15 1 $4,000 $4,000<br />
Parts Cleaner Inland LT32 30035933 Replace 2015 2000 14 10/15 1 $4,000 $4,000<br />
Parts Cleaner Inland LT32 30035934 Replace 2015 2000 14 10/15 1 $4,000 $4,000<br />
Total . . . . $122,000 $12,000 $0 $0 $0 $134,000<br />
North Shop<br />
Seeley<br />
Floor Scrubber Tennant 5700 Replace 2017 2007 7 10/12 2 $15,000 $15,000<br />
Parts Cleaner Inland LT3230035937 Replace 2015 2000 14 10/15 1 $4,000 $4,000<br />
Wheel lift 4 post (Ari Hetra) Replace <strong>2014</strong> 1999 15 10/15 1 $46,000 $46,000<br />
Hetra jack stands (4) short Replace 2015 2005 9 10/20 1 $40,000 $40,000<br />
Wheel lift 4 post Replace <strong>2014</strong> 2000 14 10/15 2 $46,000 $46,000<br />
Lift Wheel 4 Post New <strong>2014</strong> 10/15 $45,000 $45,000<br />
Total . . . . $137,000 $44,000 $0 $15,000 $0 $196,000<br />
Steam Bay<br />
Seeley<br />
Omar lift Replace <strong>2014</strong> 1995 19 10/20 2 $120,000 $120,000<br />
Steam cleaner Replace <strong>2014</strong> 1995 19 10/20 2 $6,000 $6,000<br />
Total . . . . $126,000 $0 $0 $0 $0 $126,000<br />
Tire Shop<br />
Seeley<br />
Tire Changer, Hofmann Replace 2015 2006 8 10/20 2 $10,000 $10,000<br />
Tire Balancer, Hofmann Replace 2015 2005 9 10/20 2 $5,000 $5,000<br />
Tire Changer, Hofmann (car) Replace 2015 2006 8 10/20 2 $6,000 $6,000<br />
Total . . . . $0 $21,000 $0 $0 $0 $21,000<br />
UNIT REBUILD<br />
Unit Rebuild -- General<br />
Seeley<br />
Crane Jib, 2.5 ton Replace <strong>2014</strong> 1982 32 10/30 1 $20,000 $20,000<br />
Monarch Dynapak Replace <strong>2014</strong> 2001 13 5/10 3 $10,000 $10,000<br />
Cleaning Machines, Ampro (2) Replace <strong>2014</strong> 1993 21 5/10 3 $50,000 $50,000<br />
Cleaning Machine Cages, Ampro (2) Replace <strong>2014</strong> 1993 21 5/10 3 $18,000 $18,000<br />
Crane, Jib 1/2 Ton (Ampro) Mar Crane (unit) Replace <strong>2014</strong> 1982 32 10/30 1 $5,000 $5,000<br />
Press, Shop 25 Ton Replace <strong>2014</strong> 1988 26 10/20 3 $7,500 $7,500<br />
Press, Air/Hydraulic Enerpac 75 ton Replace 2015 1995 19 5/10 3 $10,000 $10,000<br />
Total . . . . $110,500 $10,000 $0 $0 $0 $120,500<br />
<strong>FY</strong>14-<strong>FY</strong>18<br />
TOTAL<br />
Page ‐ 194
<strong>Capital</strong> <strong>Asset</strong> <strong>Management</strong> & <strong>Investment</strong> Program Appendix Fixed Route Buses<br />
Fixed Route Bus – Bus Maintenance Equipment > $5,000 (continued)<br />
ITEM REQUIRED<br />
PROJECT<br />
MANAGER<br />
ACTION<br />
NEEDED<br />
<strong>FY</strong><br />
NEEDED<br />
YEAR OF<br />
PURCHASE<br />
CURRENT<br />
AGE <strong>FY</strong>14<br />
OPTIMUM<br />
REPLACEMENT<br />
CYCLE COND. <strong>FY</strong>14 <strong>FY</strong>15 <strong>FY</strong>16 <strong>FY</strong>17 <strong>FY</strong>18<br />
<strong>FY</strong>14-<strong>FY</strong>18<br />
TOTAL<br />
Unit Rebuild -- Air Electric<br />
Seeley<br />
Press, Air/Hyd, 30 Ton, (Enerpac) Replace <strong>2014</strong> 1985 29 25 2 $7,500 $7,500<br />
Press, Manual Hydraulic, 10 Ton (Red Arrow) Replace 2017 1997 17 20 1 $1,000 $1,000<br />
AR Industry Parts Washer Replace 2015 2000 14 10/20 2 $4,000 $4,000<br />
Test Bench (Farebox Eqpt) SCR022689 (GFI) Replace <strong>2014</strong> 1991 23 15 3 $8,000 $8,000<br />
Test Bench (Farebox Eqpt) SCR022690 (GFI) Replace 2016 1991 23 20 3 $8,000 $8,000<br />
Total . . . . $15,500 $4,000 $8,000 $1,000 $0 $28,500<br />
Unit Rebuild -- Differential<br />
Seeley<br />
Hydraulic power steering test stand Replace <strong>2014</strong> 1995 19 10/15 2 $10,000 $10,000<br />
Parts Cleaner Inland LT3230035937 Replace 2015 2000 14 10/15 1 $4,000 $4,000<br />
Press, Walker 10 T Replace <strong>2014</strong> 1995 19 10/20 3 $10,000 $10,000<br />
Total . . . . $20,000 $4,000 $0 $0 $0 $24,000<br />
Unit Rebuild -- Transmission<br />
Seeley<br />
Dyno Transmission (upgrade) Replace <strong>2014</strong> 2008 6 3/5 1 $60,000 $60,000<br />
Hoist, 1 Ton Electric (Coffing) Replace 2016 1982 32 10/20 2 $5,000 $5,000<br />
Hoist, 1 Ton Electric (Dayton) Replace 2016 2006 8 10/20 1 $5,000 $5,000<br />
Hoist, 1 Ton Electric (Demac) Replace 2016 2006 8 10/20 1 $5,000 $5,000<br />
Press, Enerpac 15 ton air/hydraulic Replace 2016 2006 8 10/15 1 $5,000 $5,000<br />
Parts Cleaner Inland LT3230035954 Replace 2015 2000 14 10/15 1 $4,000 $4,000<br />
Parts Cleaner Inland LT3230035955 Replace 2015 2000 14 10/15 1 $4,000 $4,000<br />
Parts Cleaner Inland LT3230035958 Replace 2015 2000 14 10/15 1 $4,000 $4,000<br />
Parts Cleaner Inland LT3230035939 Replace 2015 2000 14 10/15 1 $4,000 $4,000<br />
Parts Cleaner Inland LT3230035942 Replace 2015 2000 14 10/15 1 $4,000 $4,000<br />
Total . . . . $60,000 $20,000 $20,000 $0 $0 $100,000<br />
Unit Rebuild -- Electronics<br />
Seeley<br />
Oscilloscope (Tektronix) (2) Replace <strong>2014</strong> 1997 17 20 3 $15,000 $15,000<br />
Service Monitor (Motorola) (2) Replace <strong>2014</strong> 1995 19 10/20 2 $10,800 $10,800<br />
Motorola Test Bench (Service monitor, control panel, radio test set) Replace <strong>2014</strong> 1980 34 10 2 $50,000 $50,000<br />
Total . . . . $75,800 $0 $0 $0 $0 $75,800<br />
Unit Rebuild -- Machine<br />
Seeley<br />
Lathe, Geared Head Engine wi/Lead SC (tool mex) Replace <strong>2014</strong> 1982 32 10/30 1 $30,000 $30,000<br />
Total . . . . $30,000 $0 $0 $0 $0 $30,000<br />
TOTAL CENTER . . . . $696,800 $115,000 $28,000 $16,000 $0 $855,800<br />
POWELL MAINTENANCE BUILDING<br />
Shop Equipment<br />
Haley<br />
Alignment Equipment, Front-end Laser Beeline New 2016 $30,000 $30,000<br />
Parkimp 2 Hose Crimper Replace 2015 2008 6 10/20 1 $10,000 $10,000<br />
Wheel Lift, (4) (HETRA) Replace 2015 2005 9 10/20 1 $40,000 $40,000<br />
Wheel Lift, (4) (HETRA) Replace <strong>2014</strong> 1997 17 10/20 2 $40,000 $40,000<br />
Wheel Lift, (4) (HETRA) Replace <strong>2014</strong> 1997 17 10/20 2 $40,000 $40,000<br />
Total . . . . $80,000 $50,000 $30,000 $0 $0 $160,000<br />
Page ‐ 195
<strong>Capital</strong> <strong>Asset</strong> <strong>Management</strong> & <strong>Investment</strong> Program Appendix Fixed Route Buses<br />
Fixed Route Bus – Bus Maintenance Equipment > $5,000 (continued)<br />
ITEM REQUIRED<br />
PROJECT<br />
MANAGER<br />
ACTION<br />
NEEDED<br />
<strong>FY</strong><br />
NEEDED<br />
YEAR OF<br />
PURCHASE<br />
CURRENT<br />
AGE <strong>FY</strong>14<br />
OPTIMUM<br />
REPLACEMENT<br />
CYCLE COND. <strong>FY</strong>14 <strong>FY</strong>15 <strong>FY</strong>16 <strong>FY</strong>17 <strong>FY</strong>18<br />
<strong>FY</strong>14-<strong>FY</strong>18<br />
TOTAL<br />
Specialty Equipment<br />
Haley<br />
Floor Scrubber (Tenant 5700) Replace <strong>2014</strong> 1999 15 10 3 $15,000 $15,000<br />
Brake Lathe (Star) Repair 2015 2 $25,000 $25,000<br />
Cushman Cart Replace <strong>2014</strong> 2001 13 10 3 $5,000 $5,000<br />
Total . . . . $20,000 $25,000 $0 $0 $0 $45,000<br />
Tire Shop<br />
Haley<br />
Tire Spreader (Branick) EF/HG Replace 2015 1984 30 25 3 $12,000 $12,000<br />
Total . . . . $0 $12,000 $0 $0 $0 $12,000<br />
TOTAL POWELL . . . . $100,000 $87,000 $30,000 $0 $0 $217,000<br />
MERLO MAINTENANCE BUILDING<br />
Main Shop<br />
Johnson<br />
Alignment Equipment, Laser (Beeline) Replace 2016 2009 5 10 1 $20,000 $20,000<br />
Air Conditioning Equipment Replace <strong>2014</strong> 1998 16 5/10 2 $7,000 $7,000<br />
Brake Test Kit (Vericom) Replace 2015 1999 15 15 3 $7,000 $7,000<br />
Brake Lathe (Star) Repair 2016 2007 7 25 3 $10,000 $10,000<br />
Crane, Roll Around, 20 Ton (Acrin Warning) Replace 2016 1982 32 20 1 $14,000 $14,000<br />
Press, Hydraulic, 100 Ton, (Enerpac) Replace 2016 1993 21 15 2 $8,000 $8,000<br />
Sand Spreader, Epoke Replace 2017 1985 29 20 3 $12,000 $12,000<br />
Transmission Jack OTC Replace <strong>2014</strong> 1997 17 10 3 $6,000 $6,000<br />
Transmission Test Equipment (Voith) Replace <strong>2014</strong> 1993 21 15 3 $6,000 $6,000<br />
Wheel Hoist (Hetra) (16) Replace 2015 1997 17 15 1 $180,000 $180,000<br />
Wheel Hoist (Hetra) (6) Replace 2016 1998 16 15 1 $70,000 $70,000<br />
Total . . . . $19,000 $187,000 $122,000 $12,000 $0 $340,000<br />
Body Shop<br />
Johnson<br />
Recycler, Paint Solvent Replace 2018 2012 2 5/10 1 $10,000 $10,000<br />
Iron Worker, 35, Ton MW35 Replace 2017 1991 23 15/30 1 $20,000 $20,000<br />
Total . . . . $0 $0 $0 $20,000 $10,000 $30,000<br />
Steam Bay<br />
Johnson<br />
Chain Hoist Electric Steam Bay Replace <strong>2014</strong> 1983 31 25 3 $12,000 $12,000<br />
Total . . . . $12,000 $0 $0 $0 $0 $12,000<br />
Page ‐ 196
<strong>Capital</strong> <strong>Asset</strong> <strong>Management</strong> & <strong>Investment</strong> Program Appendix Fixed Route Buses<br />
Fixed Route Bus – Bus Maintenance Equipment > $5,000 (continued)<br />
ITEM REQUIRED<br />
PROJECT<br />
MANAGER<br />
ACTION<br />
NEEDED<br />
<strong>FY</strong><br />
NEEDED<br />
YEAR OF<br />
PURCHASE<br />
CURRENT<br />
AGE <strong>FY</strong>14<br />
OPTIMUM<br />
REPLACEMENT<br />
CYCLE COND. <strong>FY</strong>14 <strong>FY</strong>15 <strong>FY</strong>16 <strong>FY</strong>17 <strong>FY</strong>18<br />
<strong>FY</strong>14-<strong>FY</strong>18<br />
TOTAL<br />
Fuel House<br />
Johnson<br />
Floor Scrubber (Tenant) Replace 2017 1999 15 10 2 $17,000 $17,000<br />
Tire Groover Replace 2016 2010 4 30 1 $7,000 $7,000<br />
Tire Spreader (Branick) Replace 2018 2010 4 25 1 $6,000 $6,000<br />
Total . . . . $0 $0 $7,000 $17,000 $6,000 $30,000<br />
TOTAL MERLO . . . . $31,000 $187,000 $129,000 $49,000 $16,000 $412,000<br />
STORES<br />
Stores -- Center<br />
Brooks<br />
Forklift, Hyster (electric) Replace 2017 2002 12 10/15 2 $30,000 $30,000<br />
Forklift, Yale (propane) Replace <strong>2014</strong> 1999 15 10/15 3 $55,000 $55,000<br />
Total . . . . $55,000 $0 $0 $30,000 $0 $85,000<br />
Stores -- Merlo<br />
Brooks<br />
Forklift, Yale (NG) Replace 2017 1997 17 20 3 $30,000 $30,000<br />
Total . . . . $0 $0 $0 $30,000 $0 $30,000<br />
TOTAL STORES . . . . $55,000 $0 $0 $60,000 $0 $115,000<br />
NON-REVENUE VEHICLES (>$5,000)<br />
Non-Revenue Vehicles -- Center<br />
Brooks<br />
Rotary Drive-on Hoist Replace <strong>2014</strong> 2003 11 10/15 1 $7,000 $7,000<br />
Lift, Wheel 4 Post (Ari-Hetra) Replace 2015 2004 10 10/15 1 $8,000 $8,000<br />
Total . . . . $7,000 $8,000 $0 $0 $0 $15,000<br />
Non-Revenue Vehicles -- Ruby Junction<br />
Brooks<br />
Rotary Drive-on Hoist (2) Replace <strong>2014</strong> 2003 11 10/15 1 $14,000 $14,000<br />
4-Post Lift (Ari-Hetra) Replace 2015 2003 11 10/20 1 $8,000 $8,000<br />
Automotive Lift - AG15 #X-15025 (2 Post) Replace <strong>2014</strong> 1996 18 5/10 3 $12,000 $12,000<br />
Tire Mounting Machine FMC Replace <strong>2014</strong> 1996 18 5/10 3 $5,000 $5,000<br />
Tire Balancer John Bean Replace <strong>2014</strong> 1996 18 5/10 3 $3,000 $3,000<br />
Total . . . . $34,000 $8,000 $0 $0 $0 $42,000<br />
TOTAL ALL BUS MAINTENANCE (CAPITAL) . . . .<br />
$923,800 $405,000 $187,000 $125,000 $16,000 $1,656,800<br />
Page ‐ 197
<strong>Capital</strong> <strong>Asset</strong> <strong>Management</strong> & <strong>Investment</strong> Program Appendix Fixed Route Buses<br />
Fixed Route Bus – Bus Maintenance Equipment ≤ $5,000<br />
TABLE 12B <strong>FY</strong>14-<strong>FY</strong>18 BUS MAINTENANCE OPERATING PROJECTS - SHOP EQUIPMENT REPLACEMENT/REPAIR (
<strong>Capital</strong> <strong>Asset</strong> <strong>Management</strong> & <strong>Investment</strong> Program Appendix Fixed Route Buses<br />
Fixed Route Bus – Bus Maintenance Equipment ≤ $5,000 (continued)<br />
ITEM REQUIRED<br />
PROJECT<br />
MANAGER<br />
ACTION<br />
NEEDED<br />
<strong>FY</strong><br />
NEEDED<br />
YEAR OF<br />
PURCHASE<br />
CURRENT<br />
AGE <strong>FY</strong>14<br />
OPTIMUM<br />
REPLACEMENT<br />
CYCLE COND. <strong>FY</strong>14 <strong>FY</strong>15 <strong>FY</strong>16 <strong>FY</strong>17 <strong>FY</strong>18<br />
<strong>FY</strong>14-<strong>FY</strong>18<br />
TOTAL<br />
Pump, Pneumatic Power Lube Replace <strong>2014</strong> 1998 16 5/10 3 $4,000 $4,000<br />
Welder, Miller Dial Arc HF Replace <strong>2014</strong> 1979 35 10/20 3 $2,500 $2,500<br />
Welder, Miller Dial Arc HF Replace <strong>2014</strong> 1979 35 10/20 2 $2,500 $2,500<br />
Welder, Millermatic 200 Wire Feed Steel Replace <strong>2014</strong> 1988 26 10/20 2 $2,500 $2,500<br />
Total . . . . $70,450 $9,300 $1,500 $5,000 $1,200 $87,450<br />
North Shop<br />
Seeley<br />
Alignment Equipment (Replace Laser) New <strong>2014</strong> 10 $2,000 $2,000<br />
Drill Press, 13", Bench Type DP 575 #13840 Replace <strong>2014</strong> 1981 33 10/30 2 $2,000 $2,000<br />
Work benches (3) Replace <strong>2014</strong> 1980 34 30 2 $3,000 $3,000<br />
Lift bench table Replace <strong>2014</strong> 1988 26 10/20 3 $4,500 $4,500<br />
Radio cabinets (6) Replace 2015 2005 9 10/20 1 $8,000 $8,000<br />
Scaffold Replace 2015 1980 34 10/30 2 $2,000 $2,000<br />
Grease pump (Lincoln) Replace <strong>2014</strong> 1995 19 10/20 2 $4,900 $4,900<br />
Solvent tanks (3) Replace <strong>2014</strong> 1998 16 10/20 1 $3,000 $3,000<br />
Jet Disc Sander Replace 2015 2005 9 5/10 2 $1,000 $1,000<br />
Floor Scrubber (Tennant) Repair Yearly 2007 7 5/10 3 $3,500 $3,500 $3,500 $5,000 $5,000 $20,500<br />
Portable oil drains (3) Replace <strong>2014</strong> 1990 24 10/20 3 $900 $900<br />
Ladders 4' (2) Replace 2015 2004 10 5/10 1 $2,500 $2,500<br />
Ladders 12' (2) Replace <strong>2014</strong> 2000 14 5/10 1 $2,000 $2,000<br />
Portable air compressor Replace 2015 2005 9 5/10 1 $1,000 $1,000<br />
Portable battery chargers (2) Replace <strong>2014</strong> 2005 9 1/3 2 $1,500 $1,500<br />
Parts Cleaner Inland LT32 300035927 Replace 2015 2000 14 10/15 1 $4,000 $4,000<br />
Parts Cleaner Inland LT32 300035928 Replace 2015 2000 14 10/15 1 $4,000 $4,000<br />
Parts Cleaner Inland LT32 300035929 Replace 2015 2000 14 10/15 1 $4,000 $4,000<br />
Parts Cleaner Inland LT32 300035930 Replace 2015 2000 14 10/15 1 $4,000 $4,000<br />
Pump, Pneumatic Power Lube Replace <strong>2014</strong> 1998 16 5/10 3 $5,000 $5,000<br />
Low floor hyd. Pit Jack Replace <strong>2014</strong> 1999 15 10/15 3 $2,500 $2,500<br />
Low floor hyd. Pit Jack Replace <strong>2014</strong> 1999 15 10/15 3 $2,500 $2,500<br />
Low floor hyd. Pit Jack Replace <strong>2014</strong> 1999 15 10/15 3 $2,500 $2,500<br />
Low floor hyd. Pit Jack Replace <strong>2014</strong> 1999 15 10/15 3 $2,500 $2,500<br />
Total . . . . $42,300 $34,000 $3,500 $5,000 $5,000 $89,800<br />
Brake Bay<br />
Seeley<br />
Lathe, Star Transfermatic (53D8#3460) Repair 2016 1993 21 10 3 $25,000 $25,000<br />
Total . . . . $0 $0 $25,000 $0 $0 $25,000<br />
Page ‐ 199
<strong>Capital</strong> <strong>Asset</strong> <strong>Management</strong> & <strong>Investment</strong> Program Appendix Fixed Route Buses<br />
Fixed Route Bus – Bus Maintenance Equipment ≤ $5,000 (continued)<br />
ITEM REQUIRED<br />
PROJECT<br />
MANAGER<br />
ACTION<br />
NEEDED<br />
<strong>FY</strong><br />
NEEDED<br />
YEAR OF<br />
PURCHASE<br />
CURRENT<br />
AGE <strong>FY</strong>14<br />
OPTIMUM<br />
REPLACEMENT<br />
CYCLE COND. <strong>FY</strong>14 <strong>FY</strong>15 <strong>FY</strong>16 <strong>FY</strong>17 <strong>FY</strong>18<br />
<strong>FY</strong>14-<strong>FY</strong>18<br />
TOTAL<br />
Tire Shop<br />
Seeley<br />
Air gun 1" spline drive Replace 2016 2013 1 2/3 1 $1,500 $1,500<br />
Air gun 1" spline drive Replace 2016 2013 1 2/3 1 $1,300 $1,300<br />
Tire Spreader, Branick EF 91K16305 Replace <strong>2014</strong> 1992 22 10/20 3 $3,000 $3,000<br />
Total . . . . $3,000 $0 $2,800 $0 $0 $5,800<br />
UNIT REBUILD<br />
Unit Rebuild -- General<br />
Seeley<br />
Saw, Horizontal Band Jet HBS416W 404044 Replace <strong>2014</strong> 1982 32 10/20 3 $3,000 $3,000<br />
Drill Press, Pedestal Type Peerless Replace 2015 1982 32 10/30 3 $5,000 $5,000<br />
Sewing Machine, Commercial (2) Replace 2015 1983 31 10/20 3 $3,000 $3,000<br />
Hose cutter, stainless Replace <strong>2014</strong> 2007 7 5/10 1 $3,000 $3,000<br />
Shear w/36" Back Gauge Range Atlantic HDE801227 Replace <strong>2014</strong> 1990 24 10/30 3 $3,000 $3,000<br />
Welder, Millermatic 35 Wire Feed HK245781 Replace 2015 1982 32 10/20 3 $4,500 $4,500<br />
Drill, Heavy Duty Ped type 20' Replace <strong>2014</strong> 1994 20 10/30 3 $3,500 $3,500<br />
Welder, Millermatic 35 Stainless Wire Fd. JB545373 Replace 2016 1982 32 10/20 3 $4,500 $4,500<br />
Cradle, Engine 6000 Cap Replace <strong>2014</strong> 1983 31 10/30 1 $5,000 $5,000<br />
Saw, Metal Grobe Band 17" Cap Replace <strong>2014</strong> 1983 31 10/30 1 $5,000 $5,000<br />
Welder, Plasma Cutter TDC50 T52357A186401J Replace 2015 1989 25 10/20 3 $5,000 $5,000<br />
Total . . . . $22,500 $17,500 $4,500 $0 $0 $44,500<br />
Unit Rebuild -- Differential<br />
Seeley<br />
Crane, Jib 1 Ton Replace <strong>2014</strong> 1982 32 10/30 1 $5,000 $5,000<br />
Oven Replace 2016 1975 39 20/30 3 $700 $700<br />
Hoist, 1 Ton Electric Replace <strong>2014</strong> 1985 29 10/20 3 $3,000 $3,000<br />
Total . . . . $8,000 $0 $700 $0 $0 $8,700<br />
Unit Rebuild -- Air Electric<br />
Seeley<br />
Bead Blaster, (Pauley & Griffin) Replace <strong>2014</strong> 1987 27 15 3 $3,000 $3,000<br />
Chain Hoist Electric Unit Rebuild Replace <strong>2014</strong> 1997 17 10 3 $1,000 $1,000<br />
Press, Arbor Replace 2017 2007 7 10 1 $5,000 $5,000<br />
Drill Press, Pedestal Type Replace 2015 1985 29 10/15 3 $5,000 $5,000<br />
Work Table, 26" X 73" W/8" Vise (2) Replace 2015 1985 29 20 3 $1,000 $1,000<br />
Work Table, Metal (Material Flow) (3) Replace 2015 1985 29 20 3 $1,000 $1,000<br />
Work Table, Metal (Material Flow) (5) Replace 2015 1985 29 20 3 $1,200 $1,200<br />
Work Table, Metal No Vise (11) Replace 2015 1985 29 20 3 $2,400 $2,400<br />
Work Table, Metal W/Ovrhd Shlvng (3) Replace 2015 1985 29 20 3 $1,000 $1,000<br />
Total . . . . $4,000 $11,600 $0 $5,000 $0 $20,600<br />
Page ‐ 200
<strong>Capital</strong> <strong>Asset</strong> <strong>Management</strong> & <strong>Investment</strong> Program Appendix Fixed Route Buses<br />
Fixed Route Bus – Bus Maintenance Equipment ≤ $5,000 (continued)<br />
ITEM REQUIRED<br />
PROJECT<br />
MANAGER<br />
ACTION<br />
NEEDED<br />
<strong>FY</strong><br />
NEEDED<br />
YEAR OF<br />
PURCHASE<br />
CURRENT<br />
AGE <strong>FY</strong>14<br />
OPTIMUM<br />
REPLACEMENT<br />
CYCLE COND. <strong>FY</strong>14 <strong>FY</strong>15 <strong>FY</strong>16 <strong>FY</strong>17 <strong>FY</strong>18<br />
<strong>FY</strong>14-<strong>FY</strong>18<br />
TOTAL<br />
Unit Rebuild -- Transmission<br />
Seeley<br />
Press, 10 ton (manual) Replace <strong>2014</strong> 1998 16 10/20 2 $3,500 $3,500<br />
Stand, Transmission #2 Replace <strong>2014</strong> 1978 36 10/20 2 $5,000 $5,000<br />
Stand, Transmission OTC 00824 Replace <strong>2014</strong> 1990 24 10/20 2 $5,000 $5,000<br />
Stand, Transmission OTC 00942 Replace <strong>2014</strong> 1990 24 10/20 2 $5,000 $5,000<br />
Crane, Jib 1 Ton Mar #1184 Replace 2015 1982 32 10/30 1 $2,000 $2,000<br />
Crane, Jib 1 Ton Cascade Replace 2015 1982 32 10/30 1 $2,000 $2,000<br />
Crane, Jib 1 Ton Yale Replace 2015 1982 32 10/30 1 $2,000 $2,000<br />
Total . . . . $18,500 $6,000 $0 $0 $0 $24,500<br />
Unit Rebuild -- Electronic<br />
Seeley<br />
Soldering station (2) Replace <strong>2014</strong> 2006 8 3 3 $2,000 $2,000<br />
Soldering station Replace 2015 2006 8 3 3 $2,500 $2,500<br />
Soldering station Replace 2016 2013 1 3 1 $2,500 $2,500<br />
NE High Current DC Power Supply Replace 2016 2010 4 5/10 3 $500 $500<br />
Fluke 192B, Scopemeter Replace <strong>2014</strong> 2000 14 5/10 3 $3,000 $3,000<br />
Westward Drill Press, 8-Inch, Model 4TM69 Replace 2015 1995 19 10/20 3 $500 $500<br />
Total . . . . $5,000 $3,000 $3,000 $0 $0 $11,000<br />
Unit Rebuild -- Engine<br />
Seeley<br />
Hoist, 5 Ton Electric Replace 2015 1982 32 10/20 3 $3,000 $3,000<br />
Stand, Engine (3) OTC Replace 2015 1988 26 10/15 2 $12,000 $12,000<br />
Total . . . . $0 $15,000 $0 $0 $0 $15,000<br />
Unit Rebuild -- Tune<br />
Seeley<br />
Parts Cleaner Inland AL830035940 Replace 2015 2000 14 10/15 1 $4,000 $4,000<br />
Parts Cleaner Inland AL830035943 Replace 2015 2000 14 10/15 1 $4,000 $4,000<br />
Total . . . . $0 $8,000 $0 $0 $0 $8,000<br />
Unit Rebuild -- Radiator<br />
Seeley<br />
Parts Cleaner Inland LT3230035931 Replace 2015 2000 14 10/15 1 $4,000 $4,000<br />
Total . . . . $0 $4,000 $0 $0 $0 $4,000<br />
Unit Rebuild -- Lift<br />
Seeley<br />
Parts Cleaner Inland LT3230035932 Replace 2015 2000 14 10/15 1 $4,000 $4,000<br />
Crane, Spanco Gantry Replace <strong>2014</strong> 1996 18 10/20 3 $3,000 $3,000<br />
Total . . . . $3,000 $4,000 $0 $0 $0 $7,000<br />
Page ‐ 201
<strong>Capital</strong> <strong>Asset</strong> <strong>Management</strong> & <strong>Investment</strong> Program Appendix Fixed Route Buses<br />
Fixed Route Bus – Bus Maintenance Equipment ≤ $5,000 (continued)<br />
PROJECT<br />
MANAGER<br />
ACTION<br />
NEEDED<br />
<strong>FY</strong><br />
NEEDED<br />
YEAR OF<br />
PURCHASE<br />
CURRENT<br />
AGE <strong>FY</strong>14<br />
OPTIMUM<br />
REPLACEMENT<br />
CYCLE COND. <strong>FY</strong>14 <strong>FY</strong>15 <strong>FY</strong>16 <strong>FY</strong>17 <strong>FY</strong>18<br />
ITEM REQUIRED<br />
TRAINING DEPARTMENT<br />
Training -- General<br />
Brooks<br />
In Focus Projector (Merlo) Replace <strong>2014</strong> 2006 8 3/5 3 $1,500 $1,500<br />
In Focus Projector (Center) Replace <strong>2014</strong> 2006 8 3/5 3 $1,500 $1,500<br />
NEC Projector (Powell) 9400856FB Replace <strong>2014</strong> 2009 5 4/5 3 $700 $700<br />
Total . . . . $3,700 $0 $0 $0 $0 $3,700<br />
TOTAL CENTER . . . . $180,450 $112,400 $41,000 $15,000 $6,200 $355,050<br />
POWELL MAINTENANCE BUILDING<br />
Battery Room<br />
Haley<br />
Battery Chargers, Associated Model 6068 (4 x $1,650/ea) Replace <strong>2014</strong> 1995 19 10 4 $6,600 $6,600<br />
Battery Load Tester, Assoc Model 6036 Replace 2017 2007 7 10 3 $3,000 $3,000<br />
Total . . . . $6,600 $0 $0 $3,000 $0 $9,600<br />
Shop Equipment<br />
Haley<br />
Air Conditioning Pump, Thermo King Replace 2016 2000 14 10/20 3 $1,500 $1,500<br />
Press, Hydraulic, Enerpac (100 Ton) Repair Yearly 1991 23 10/20 3 $500 $500 $500 $500 $500 $2,500<br />
Air Conditioning Recycler, RTI Tech, Model RHS 780 Repair Bi-yearly 2005 9 5 3 $500 $500 $500 $1,500<br />
Air Conditioning Recycler, Robinair Enviro Repair Bi-yearly 1999 15 5 3 $500 $500 $500 $1,500<br />
Parts Cleaners Inland - Brakes IT 80 #42866 Replace 2018 2008 6 10/15 1 $3,500 $3,500<br />
Parts Cleaners Inland - Tune Up IT 80 #20624 Replace <strong>2014</strong> 1999 15 10/15 3 $3,500 $3,500<br />
Parts Cleaners Inland - Insp IT 30 #20625 Replace <strong>2014</strong> 1999 15 10/15 3 $3,500 $3,500<br />
Parts Cleaners Inland - Bay 16-17 IT 30 #20627 Replace <strong>2014</strong> 1999 15 10/15 3 $3,500 $3,500<br />
Parts Cleaners Inland - Bay 17 IT 30 #20621 Replace <strong>2014</strong> 1999 15 10/15 3 $3,500 $3,500<br />
Parts Cleaners Inland - Bay 2-3 IT 30 #20626 Replace <strong>2014</strong> 1999 15 10/15 3 $3,500 $3,500<br />
Safety Stand Wheel Lift (8) Replace 2015 1997 14 10/20 3 $6,000 $6,000<br />
Safety Stand Wheel Lift (4) Replace 2015 2005 6 10/20 1 $3,000 $3,000<br />
Safety Stand Wheel Lift, Tall (4) Replace 2017 1981 30 10/20 4 $650 $650<br />
Pressure Washer, Landa Repair <strong>2014</strong> 1999 15 5 3 $2,500 $2,500<br />
<strong>FY</strong>14-<strong>FY</strong>18<br />
TOTAL<br />
Page ‐ 202
<strong>Capital</strong> <strong>Asset</strong> <strong>Management</strong> & <strong>Investment</strong> Program Appendix Fixed Route Buses<br />
Fixed Route Bus – Bus Maintenance Equipment ≤ $5,000 (continued)<br />
ITEM REQUIRED<br />
PROJECT<br />
MANAGER<br />
ACTION<br />
NEEDED<br />
<strong>FY</strong><br />
NEEDED<br />
YEAR OF<br />
PURCHASE<br />
CURRENT<br />
AGE <strong>FY</strong>14<br />
OPTIMUM<br />
REPLACEMENT<br />
CYCLE COND. <strong>FY</strong>14 <strong>FY</strong>15 <strong>FY</strong>16 <strong>FY</strong>17 <strong>FY</strong>18<br />
<strong>FY</strong>14-<strong>FY</strong>18<br />
TOTAL<br />
Band Saw, Jet Replace <strong>2014</strong> 1995 19 10/15 3 $1,500 $1,500<br />
Battery Charger, Model Dx5-2 Replace <strong>2014</strong> 2004 10 5 3 $300 $300<br />
Battery Tester & Printer, Midtronics Repair <strong>2014</strong> 2008 6 5 2 $600 $600<br />
Brake Drum Dolly Replace 2017 2008 6 10/15 1 $1,700 $1,700<br />
Drill Press, Wilton Replace <strong>2014</strong> 1980 34 10/15 4 $2,000 $2,000<br />
Grinder, Dbl Ped., Daton Model 42911B (2) Replace <strong>2014</strong> 1984 30 5/10 3 $2,000 $2,000<br />
Jack, HDLC 4500 Cap Pallet (3) Replace 2016 1980 34 5/10 3 $1,500 $1,500<br />
KarryKrimp 2 Hose Crimper Replace 2016 2009 5 5/10 1 $600 $600<br />
Battery Charger (Dayton 1JYU3) Replace 2017 2007 7 10 2 $450 $450<br />
Oven, Linberg/Blue Replace 2015 2002 12 10/15 2 $1,000 $1,000<br />
Port-a-Power, Interpack Replace 2018 2003 11 10/15 2 $1,500 $1,500<br />
Pressure Washer, American Made Repair <strong>2014</strong> 2001 13 5 2 $5,000 $5,000<br />
Sander/Grinder, Jet Replace 2016 2001 13 10/15 2 $1,000 $1,000<br />
Tornado Super Sucker Seat Cleaner Replace 2016 2009 5 10/15 1 $600 $600<br />
Seat Cleaner, Euro Replace 2016 2007 7 10/15 1 $600 $600<br />
Total . . . . $32,900 $10,500 $7,300 $3,300 $6,500 $60,500<br />
Tools<br />
Haley<br />
Gun, Monobolt, Avdel Model 749 Replace <strong>2014</strong> 1997 17 5/10 3 $1,500 $1,500<br />
Brake Test Meter, Recond., Vericom Replace <strong>2014</strong> 2008 6 3/5 2 $3,000 $3,000<br />
Hose Cutter, Stainless Steel (Baldor L1406T) Repair Yearly 2000 14 5 3 $300 $300 $300 $300 $300 $1,500<br />
Torque Wrench, 1000 lb., Ammco Model 1150 Recalibrate Yearly 1998 16 5/10 3 $300 $300 $300 $300 $300 $1,500<br />
Torque Wrench, 600 lb. Snap-On Recalibrate Yearly 2004 10 5/8 3 $300 $300 $300 $300 $300 $1,500<br />
Total . . . . $5,400 $900 $900 $900 $900 $9,000<br />
Specialty Equipment<br />
Haley<br />
Sand Spreader, Epoke Repair Bi-yearly 1989 25 15 3 $1,000 $1,000 $1,000 $3,000<br />
Pump, Inspection Gear Oil, Lincoln St. Louis Replace <strong>2014</strong> 2001 13 10/15 3 $3,300 $3,300<br />
Pump, Inspection Gear Oil, Lincoln Replace <strong>2014</strong> 2000 14 10/15 3 $3,300 $3,300<br />
Welder, Steel, Miller 200 w/wire feed attachment Replace 2017 2008 6 10/15 1 $3,395 $3,395<br />
Cushman Cart Repair Bi-yearly 2001 13 10 3 $500 $500 $500 $1,500<br />
Floor Scrubber (Tennant) Repair Yearly 1999 15 5/10 3 $3,500 $3,500 $3,500 $3,500 $3,500 $17,500<br />
Optimice EP727 DLP Projector Display Replace <strong>2014</strong> 2009 5 5 1 $800 $800<br />
JNC 12/24 Jumper Pack (2) Replace <strong>2014</strong> 2007 7 5 3 $800 $800<br />
JNC 12/24 Jumper Pack (2) Replace <strong>2014</strong> 2009 5 5 2 $800 $800<br />
Air Gun, Titanium 2190TT-6 Replace 2015 2007 7 2/4 3 $800 $800<br />
Air Gun, Titanium 2190TT-6 (Brake Bay) Replace 2015 2007 7 2/4 3 $800 $800<br />
Air Gun, Spline Drive CP (Service Truck) Replace 2018 2001 13 10/15 2 $650 $650<br />
Air Gun, Blue Point AT/00A (Suspension Bay) Replace 2015 1997 17 10/15 3 $1,000 $1,000<br />
Pod Storeage New Yearly 2009 5 2 $1,000 $1,000 $1,000 $1,000 $1,000 $5,000<br />
Welding Set, Oxyacetylene (2) Replace <strong>2014</strong> 1997 17 3/10 3 $1,200 $1,200<br />
Total . . . . $16,200 $7,100 $6,000 $7,895 $6,650 $43,845<br />
Page ‐ 203
<strong>Capital</strong> <strong>Asset</strong> <strong>Management</strong> & <strong>Investment</strong> Program Appendix Fixed Route Buses<br />
Fixed Route Bus – Bus Maintenance Equipment ≤ $5,000 (continued)<br />
ITEM REQUIRED<br />
PROJECT<br />
MANAGER<br />
ACTION<br />
NEEDED<br />
<strong>FY</strong><br />
NEEDED<br />
YEAR OF<br />
PURCHASE<br />
CURRENT<br />
AGE <strong>FY</strong>14<br />
OPTIMUM<br />
REPLACEMENT<br />
CYCLE COND. <strong>FY</strong>14 <strong>FY</strong>15 <strong>FY</strong>16 <strong>FY</strong>17 <strong>FY</strong>18<br />
<strong>FY</strong>14-<strong>FY</strong>18<br />
TOTAL<br />
Tire Shop<br />
Haley<br />
Air Gun, IR (3) Replace 2015 2011 3 3 1 $3,000 $3,000<br />
Air Gun, IR (3) Repair Bi-yearly 2008 6 3 3 $500 $500 $500 $1,500<br />
Tire Mounting Machine (Hofmann Monty 3800) Repair Yearly 2009 5 5 1 $200 $200 $200 $200 $200 $1,000<br />
Tire Balancer (Hofmann 980L) Repair Yearly 2009 5 5 1 $200 $200 $200 $200 $200 $1,000<br />
Total . . . . $900 $3,400 $900 $400 $900 $6,500<br />
TOTAL POWELL . . . . $62,000 $21,900 $15,100 $15,495 $14,950 $129,445<br />
MERLO MAINTENANCE BUILDING<br />
Main Shop<br />
Johnson<br />
Alignment Equipment, Laser (Beeline) Repair Bi-yearly 2009 5 10 3 $3,000 $3,000 $6,000<br />
Floor Lift (Owatonna), (2) Repair 2016 1982 32 20 2 $9,000 $9,000<br />
Floor Lift, (OTC), (2) Repair 2015 1986 28 15 2 $7,000 $7,000<br />
Sand Spreader, Epoke Repair Bi-yearly 1985 29 20 2 $2,000 $2,000 $2,000 $6,000<br />
Brake Test Kit (Vericom) Repair 2016 1999 15 15 3 $2,500 $2,500<br />
Chain hoist electric, Steam Bay Repair 2017 1983 31 20 2 $5,000 $5,000<br />
Steam cleaners Apollo (2) Repair 2015 1983 31 17 3 $3,000 $3,000<br />
Drill press (4) Repair 2015 1983 31 30 1 $3,500 $3,500<br />
Low floor hyd. Pit Jack (2) Repair 2016 2002 12 20 3 $1,500 $1,500<br />
Battery tester, Midtronics & printer Repair 2016 2007 7 3 3 $2,000 $2,000<br />
Hose Cutter, Stainless Steel Repair 2018 2011 3 10 1 $1,500 $1,500<br />
Air gun, Spline Drive, Torque Limiting CP (4) Repair 2017 2001 13 5 3 $3,000 $3,000<br />
Transmission Jack (2) Replace 2016 1993 21 10 2 $5,500 $5,500<br />
Stand, Engine (Cummins) Replace 2015 1985 29 20 1 $4,000 $4,000<br />
Opacity Meter Replace 2016 1998 16 5 2 $4,000 $4,000<br />
Chain Hoist Electric Engine OH Replace 2016 1983 31 20 2 $3,000 $3,000<br />
Jack Stands, Hetra (8) Replace 2015 1997 17 10 1 $6,000 $6,000<br />
Jack Stands, Hetra (8) Replace 2015 1983 31 20 2 $6,000 $6,000<br />
Welder, Wire Feed, (Miller, Mig 2000) Replace 2016 1985 29 25 1 $5,000 $5,000<br />
Oil Filter Press, (Oberg) Replace 2015 1990 24 10 1 $3,500 $3,500<br />
Parts Washing Tank (Inland Tech) (8) Replace 2018 1983 31 20 1 $4,000 $4,000<br />
Pressure Washer, Coldwater Replace 2015 2009 5 5 1 $3,500 $3,500<br />
Puller, Seal Instrument Replace 2018 1991 23 10 2 $3,000 $3,000<br />
Floor Scrubber (Tennant) Repair Yearly 2009 5 5/10 2 $3,500 $3,500 $3,500 $3,500 $3,500 $17,500<br />
Work Table 5' X 10' Replace 2017 1985 29 20 1 $2,500 $2,500<br />
Work Table 5' X 4' Replace 2017 1985 29 20 1 $2,500 $2,500<br />
Work Table W/Vise 4" (Wilton) (5) Replace 2017 1985 29 20 1 $2,500 $2,500<br />
Work Table, 26" X 73" No Vise Replace 2017 1983 31 20 1 $2,500 $2,500<br />
Work Table, 26" X 73" W/4" Vise(4) Replace 2017 1983 31 20 1 $2,500 $2,500<br />
Total . . . . $5,500 $43,000 $38,000 $27,000 $14,000 $127,500<br />
Page ‐ 204
<strong>Capital</strong> <strong>Asset</strong> <strong>Management</strong> & <strong>Investment</strong> Program Appendix Fixed Route Buses<br />
Fixed Route Bus – Bus Maintenance Equipment ≤ $5,000 (continued)<br />
ITEM REQUIRED<br />
PROJECT<br />
MANAGER<br />
ACTION<br />
NEEDED<br />
<strong>FY</strong><br />
NEEDED<br />
YEAR OF<br />
PURCHASE<br />
CURRENT<br />
AGE <strong>FY</strong>14<br />
OPTIMUM<br />
REPLACEMENT<br />
CYCLE COND. <strong>FY</strong>14 <strong>FY</strong>15 <strong>FY</strong>16 <strong>FY</strong>17 <strong>FY</strong>18<br />
<strong>FY</strong>14-<strong>FY</strong>18<br />
TOTAL<br />
Body Shop<br />
Johnson<br />
Bending Brake - 10" (Connections Tennsmith) Replace 2015 1985 29 25 1 $4,000 $4,000<br />
Bending Brake - 4' (Connections Tennsmith) Replace 2015 1985 29 25 1 $4,000 $4,000<br />
Chain Hoist Body Shop Replace 2015 1985 29 20 2 $2,500 $2,500<br />
Plasma Cutter, Lincoln PC55 Replace 2017 2003 11 10 1 $4,000 $4,000<br />
Recycler, Paint Solvent & Gas Cleaner Repair 2018 2011 3 10 1 $2,000 $2,000<br />
Scaffold, Aluminum 8' (Alder) (4) Replace 2018 1985 29 20 1 $6,000 $6,000<br />
Vacuum Extractor Replace 2015 2009 5 5 1 $2,500 $2,500<br />
Welder, Arc, Dialarc HF, (Miller) Replace 2016 1985 29 25 1 $3,000 $3,000<br />
Welder, Dialarc HF w/Tig, (Miller) Replace 2016 1985 29 25 1 $3,000 $3,000<br />
Welder, Millermatic 200 W/Alum. Feed (Miller) Replace 2016 1981 33 25 2 $3,000 $3,000<br />
Welder, Millermatic 200 Wire Feed Alum/Stainless Replace 2018 2008 6 10/20 1 $3,500 $3,500<br />
Welder, W/Wire Feed, (Linde) Replace 2015 1990 24 25 1 $2,700 $2,700<br />
Welder, Wire Feed, Millermatic 35, (Miller) Replace 2017 1990 24 25 1 $2,500 $2,500<br />
Workbench W/Ovhd Shlvng W/Vice (Shure Lyons) (3) Replace 2017 1985 29 20 1 $2,500 $2,500<br />
Workbench W/Ovrhd Shlvng (72"x36") (Shur Lyons) Replace 2017 1985 29 20 1 $2,500 $2,500<br />
Workbench, 120"x36", No Shlvng (Shure Lyons) Replace 2017 1985 29 20 1 $2,500 $2,500<br />
Workbench, 72"x36" W/5" Vise (Shure Lyons) Replace 2017 1985 29 20 1 $2,500 $2,500<br />
Workbench, 72"x36"W/Ovrhd Shlvng (Tennsco) (2) Replace 2017 1987 27 20 1 $2,500 $2,500<br />
Workbench, W/4" & 5" Vise W/Shlvng (Shure Lyons) Replace 2017 1985 29 20 1 $2,500 $2,500<br />
Total . . . . $0 $15,700 $9,000 $21,500 $11,500 $57,700<br />
Brake Lathe Room<br />
Johnson<br />
Chain Hoist Electric Brk Lathe Room Replace 2015 1983 31 15 3 $2,500 $2,500<br />
Total . . . . $0 $2,500 $0 $0 $0 $2,500<br />
TOTAL MERLO . . . . $5,500 $61,200 $47,000 $48,500 $25,500 $187,700<br />
Page ‐ 205
<strong>Capital</strong> <strong>Asset</strong> <strong>Management</strong> & <strong>Investment</strong> Program Appendix Fixed Route Buses<br />
Fixed Route Bus – Bus Maintenance Equipment ≤ $5,000 (continued)<br />
PROJECT<br />
MANAGER<br />
ACTION<br />
NEEDED<br />
<strong>FY</strong><br />
NEEDED<br />
YEAR OF<br />
PURCHASE<br />
CURRENT<br />
AGE <strong>FY</strong>14<br />
OPTIMUM<br />
REPLACEMENT<br />
CYCLE COND. <strong>FY</strong>14 <strong>FY</strong>15 <strong>FY</strong>16 <strong>FY</strong>17 <strong>FY</strong>18<br />
ITEM REQUIRED<br />
STORES<br />
Stores -- Center<br />
Brooks<br />
Forklift, Hyster (electric) Repair Yearly 2002 12 10/15 3 $2,500 $2,500 $2,500 $2,500 $2,500 $12,500<br />
Forklift, Yale (propane) Repair Yearly 1999 15 10/15 3 $2,500 $2,500 $2,500 $2,500 $2,500 $12,500<br />
Total . . . . $5,000 $5,000 $5,000 $5,000 $5,000 $25,000<br />
Stores -- Powell<br />
Brooks<br />
Pallet Jacks (3) Repair Yearly 5/10 1 $300 $300 $300 $300 $300 $1,500<br />
Forklift, Toyota (NG) Repair Yearly 2009 5 10 1 $1,500 $1,500 $1,500 $1,500 $1,500 $7,500<br />
Total . . . . $1,800 $1,800 $1,800 $1,800 $1,800 $9,000<br />
Stores -- Merlo<br />
Brooks<br />
Pallet Jack (electric) Repair Yearly 5/10 1 $100 $100 $100 $100 $100 $500<br />
Forklift, Yale (electric) Repair Yearly 1983 31 20 3 $2,500 $2,500 $2,500 $2,500 $2,500 $12,500<br />
Forklift, Yale, (NG) Repair Yearly 1997 17 20 3 $2,500 $2,500 $2,500 $2,500 $2,500 $12,500<br />
Total . . . . $5,100 $5,100 $5,100 $5,100 $5,100 $25,500<br />
TOTAL STORES . . . . $11,900 $11,900 $11,900 $11,900 $11,900 $59,500<br />
<strong>FY</strong>14-<strong>FY</strong>18<br />
TOTAL<br />
TOTAL ALL BUS MAINTENANCE (OPERATING) . . . .<br />
$259,850 $207,400 $115,000 $90,895 $58,550 $731,695<br />
Page ‐ 206
<strong>Capital</strong> <strong>Asset</strong> <strong>Management</strong> & <strong>Investment</strong> Program Appendix LRV Components<br />
Light Rail Vehicle Component Replacements<br />
Estimated Replacements<br />
Estimated Replacement Costs<br />
Rebuild Item Fleet Unit Cost <strong>FY</strong>14 <strong>FY</strong>15 <strong>FY</strong>16 <strong>FY</strong>17 <strong>FY</strong>18 <strong>FY</strong>14 <strong>FY</strong>15 <strong>FY</strong>16 <strong>FY</strong>17 <strong>FY</strong>18 <strong>FY</strong>14‐<strong>FY</strong>18 Total<br />
Aux Inverter Type 2/3 $ 6,000.00 10 20 20 20 10 $ 60,000 $ 120,000 $ 120,000 $ 120,000 $ 60,000 $ 480,000<br />
Batteries Type 1 $ 2,500.00 20 $ 50,000 $ 75,000 $ 75,000 $ ‐ $ ‐ $ 200,000<br />
(in sets) Type 2/3 $ 2,500.00<br />
30 30 20 $ ‐ $ ‐ $ ‐ $ 50,000 $ ‐ $ 50,000<br />
Type 4 $ ‐<br />
$ ‐ $ ‐ $ ‐ $ ‐ $ ‐ $<br />
‐<br />
Body Overhaul Type 1 $ 23,500.00 3 3 3 $ 70,500 $ 70,500 $ 70,500 $ ‐ $ ‐ $ 211,500<br />
Type 2/3 $ 5,000.00<br />
12 12 $ ‐ $ ‐ $ ‐ $ 60,000 $ 60,000 $ 120,000<br />
Type 4 $ ‐<br />
$ ‐ $ ‐ $ ‐ $ ‐ $ ‐ $<br />
‐<br />
Brake Actuators Center Truck Type 2/3 $ 1,000.00 40 40 40 40 40 $ 40,000 $ 40,000 $ 40,000 $ 40,000 $ 40,000 $ 200,000<br />
Type 4 $ 1,000.00 40 40 10 10 10 $ 40,000 $ 40,000 $ 10,000 $ 10,000 $ 10,000 $ 110,000<br />
Brake Actuators Motor Truck Type 1 $ 500.00 20 20 20 20 20 $ 10,000 $ 10,000 $ 10,000 $ 10,000 $ 10,000 $ 50,000<br />
Type 2/3 $ 2,200.00 40 40 40 40 40 $ 88,000 $ 88,000 $ 88,000 $ 88,000 $ 88,000 $ 440,000<br />
Type 4 $ 2,200.00 80 80 20 20 20 $ 176,000 $ 176,000 $ 44,000 $ 44,000 $ 44,000 $ 484,000<br />
Brake Calipers Type 1 $ 50.00 12 12 12 12 12 $ 600 $ 600 $ 600 $ 600 $ 600 $ 3,000<br />
Type 2/3 $ 2,600.00<br />
$ ‐ $ ‐ $ ‐ $ ‐ $ ‐ $<br />
‐<br />
Type 4 $ ‐<br />
$ ‐ $ ‐ $ ‐ $ ‐ $ ‐ $<br />
‐<br />
Brake Disc Poli Type 1 $ 1,500.00 5 5 5 5 5 $ 7,500 $ 7,500 $ 7,500 $ 7,500 $ 7,500 $ 37,500<br />
Bridgeplates Type 2/3 $ 1,000.00 96 96 76 160 160 $ 96,000 $ 96,000 $ 76,000 $ 160,000 $ 160,000 $ 588,000<br />
Couplers Type 1 $ 2,000.00<br />
26 $ ‐ $ ‐ $ ‐ $ ‐ $ 52,000 $ 52,000<br />
Type 2/3 $ 2,000.00 100 30 $ 200,000 $ 60,000 $ ‐ $ ‐ $ ‐ $ 260,000<br />
Type 4 $ ‐<br />
$ ‐ $ ‐ $ ‐ $ ‐ $ ‐ $<br />
‐<br />
Coupling Elements Type 1 $ 2,200.00 10 10 10 10 10 $ 22,000 $ 22,000 $ 22,000 $ 22,000 $ 22,000 $ 110,000<br />
Type 2/3 $ 1,600.00 80 80 80 40 $ 128,000 $ 128,000 $ 128,000 $ 64,000 $ ‐ $ 448,000<br />
Type 4 $ ‐<br />
$ ‐ $ ‐ $ ‐ $ ‐ $ ‐ $<br />
‐<br />
DC/DC Static Converter Type 1 $ 3,500.00<br />
13 13 $ ‐ $ 45,500 $ 45,500 $ ‐ $ ‐ $ 91,000<br />
Doors Type 1 $ 4,000.00<br />
70 70 70 $ ‐ $ ‐ $ 280,000 $ 280,000 $ 280,000 $ 840,000<br />
Type 2/3 $ 4,000.00 300 300 $ 1,200,000 $ 1,200,000 $ ‐ $ ‐ $ ‐ $ 2,400,000<br />
Door Operators Type 1 $ 400.00<br />
$ ‐ $ ‐ $ ‐ $ ‐ $ ‐ $<br />
‐<br />
Type 2/3 $ 4,000.00<br />
$ ‐ $ ‐ $ ‐ $ ‐ $ ‐ $<br />
‐<br />
Page ‐ 207
<strong>Capital</strong> <strong>Asset</strong> <strong>Management</strong> & <strong>Investment</strong> Program Appendix LRV Components<br />
Light Rail Vehicle Component Replacements<br />
Estimated Replacements<br />
Estimated Replacement Costs<br />
Rebuild Item Fleet Unit Cost <strong>FY</strong>14 <strong>FY</strong>15 <strong>FY</strong>16 <strong>FY</strong>17 <strong>FY</strong>18 <strong>FY</strong>14 <strong>FY</strong>15 <strong>FY</strong>16 <strong>FY</strong>17 <strong>FY</strong>18 <strong>FY</strong>14‐<strong>FY</strong>18 Total<br />
EHU Center Truck Type 2/3 $ 5,000.00 15 15 15 15 15 $ 75,000 $ 75,000 $ 75,000 $ 75,000 $ 75,000 $ 375,000<br />
Type 4 $ 5,000.00 12 12 4 4 4 $ 60,000 $ 60,000 $ 20,000 $ 20,000 $ 20,000 $ 180,000<br />
EHU Motor Truck Type 2/3 $ 3,500.00 25 25 25 25 25 $ 87,500 $ 87,500 $ 87,500 $ 87,500 $ 87,500 $ 437,500<br />
Type 4 $ 3,500.00 13 20 20 8 8 $ 45,500 $ 70,000 $ 70,000 $ 28,000 $ 28,000 $ 241,500<br />
Gearbox Type 1 $ 10,000.00 10 10 10 10 10 $ 100,000 $ 100,000 $ 100,000 $ 100,000 $ 100,000 $ 500,000<br />
Type 2/3 $ 5,200.00 70 45 8 8 8 $ 364,000 $ 234,000 $ 41,600 $ 41,600 $ 41,600 $ 722,800<br />
*contracted Type 2/3 $ 9,000.00 70 45 $ 630,000 $ 405,000 $ ‐ $ ‐ $ ‐ $ 1,035,000<br />
Type 4 $ ‐<br />
22 12 $ ‐ $ ‐ $ ‐ $ ‐ $ ‐ $<br />
‐<br />
Ground Brush Type 1 $ 500.00 20 20 20 20 20 $ 10,000 $ 10,000 $ 10,000 $ 10,000 $ 10,000 $ 50,000<br />
HPCU Type 1 $ 700.00<br />
$ ‐ $ ‐ $ ‐ $ ‐ $ ‐ $<br />
‐<br />
HVAC Compressor Type 1 $ 3,000.00 2 2 2 2 2 $ 6,000 $ 6,000 $ 6,000 $ 6,000 $ 6,000 $ 30,000<br />
Type 2/3 $ 3,000.00 3 3 3 3 3 $ 9,000 $ 9,000 $ 9,000 $ 9,000 $ 9,000 $ 45,000<br />
Type 4 $ ‐ $ ‐ $ ‐ $ ‐ $ ‐ $<br />
‐<br />
Journal Bearings CT Type 2/3 $ 3,000.00 70 30 $ 210,000 $ 90,000 $ ‐ $ ‐ $ ‐ $ 300,000<br />
Journal Bearings MT Type 1 $ 2,040.00<br />
$ ‐ $ ‐ $ ‐ $ ‐ $ ‐ $<br />
‐<br />
Type 2/3 $ 2,040.00<br />
43 $ ‐ $ ‐ $ ‐ $ ‐ $ 87,720 $ 87,720<br />
Load Weigh Sensor Type 1 $ 500.00 20 20 20 20 20 $ 10,000 $ 10,000 $ 10,000 $ 10,000 $ 10,000 $ 50,000<br />
Type 2/3 $ ‐ $ ‐ $ ‐ $ ‐ $ ‐ $<br />
‐<br />
Type 4 $ ‐ $ ‐ $ ‐ $ ‐ $ ‐ $<br />
‐<br />
Motor Truck Wiring Type 2/3 $ ‐<br />
$ ‐ $ ‐ $ ‐ $ ‐ $ ‐ $<br />
‐<br />
Pantograph Type 1 $ 230.77<br />
26 $ ‐ $ ‐ $ 6,000 $ ‐ $ ‐ $ 6,000<br />
Type 2/3 $ 230.00<br />
27 27 27 $ ‐ $ 6,210 $ 6,210 $ 6,210 $ ‐ $ 18,630<br />
Type 4 $ 272.73<br />
22 10 $ ‐ $ ‐ $ 6,000 $ ‐ $ 2,727 $ 8,727<br />
Pre‐excitation Contactor Type 1 $ 500.00 20 20 12 $ 10,000 $ 10,000 $ 6,000 $ ‐ $ ‐ $ 26,000<br />
Primary Suspension Type 1 $ 4,000.00 6 6 6 6 6 $ 24,000 $ 24,000 $ 24,000 $ 24,000 $ 24,000 $ 120,000<br />
Type 2/3 $ 500.00 80 80 80 80 80 $ 40,000 $ 40,000 $ 40,000 $ 40,000 $ 40,000 $ 200,000<br />
Type 4 $ 500.00 20 60 40 22 12 $ 10,000 $ 30,000 $ 20,000 $ 11,000 $ 6,000 $ 77,000<br />
Page ‐ 208
<strong>Capital</strong> <strong>Asset</strong> <strong>Management</strong> & <strong>Investment</strong> Program Appendix LRV Components<br />
Light Rail Vehicle Component Replacements<br />
Estimated Replacements<br />
Estimated Replacement Costs<br />
Rebuild Item Fleet Unit Cost <strong>FY</strong>14 <strong>FY</strong>15 <strong>FY</strong>16 <strong>FY</strong>17 <strong>FY</strong>18 <strong>FY</strong>14 <strong>FY</strong>15 <strong>FY</strong>16 <strong>FY</strong>17 <strong>FY</strong>18 <strong>FY</strong>14‐<strong>FY</strong>18 Total<br />
Secondary Suspension Type 1 $ 3,500.00<br />
10 10 $ ‐ $ ‐ $ ‐ $ 35,000 $ 35,000 $ 70,000<br />
Type 2/3 $ ‐ $ ‐ $ ‐ $ ‐ $ ‐ $<br />
‐<br />
Type 4 $ ‐ $ ‐ $ ‐ $ ‐ $ ‐ $<br />
‐<br />
Slewing Ring Type 1 $ 2,000.00 7 7 7 $ 14,000 $ 14,000 $ 14,000 $ ‐ $ ‐ $ 42,000<br />
Type 2/3 $ 4,000.00 30 10 10 $ 120,000 $ 40,000 $ 40,000 $ ‐ $ ‐ $ 200,000<br />
Type 4 $ ‐<br />
$ ‐ $ ‐ $ ‐ $ ‐ $ ‐ $<br />
‐<br />
Tire Replacement Center Truck Type 1 $ 9,000.00 8 8 4 3 3 $ 72,000 $ 72,000 $ 36,000 $ 27,000 $ 27,000 $ 234,000<br />
(in sets) Type 2/3 $ 8,500.00 18 18 18 16 16 $ 153,000 $ 153,000 $ 153,000 $ 136,000 $ 136,000 $ 731,000<br />
Type 4 $ 8,500.00 10 10 5 2 2 $ 85,000 $ 85,000 $ 42,500 $ 17,000 $ 17,000 $ 246,500<br />
Tire Replacement Motor Truck Type 1 $ 9,000.00 16 16 6 6 6 $ 144,000 $ 144,000 $ 54,000 $ 54,000 $ 54,000 $ 450,000<br />
(in sets) Type 2/3 $ 9,000.00 48 48 48 27 27 $ 432,000 $ 432,000 $ 432,000 $ 243,000 $ 243,000 $ 1,782,000<br />
Type 4 $ 8,500.00<br />
20 15 5 4 $ ‐ $ 170,000 $ 127,500 $ 42,500 $ 34,000 $ 374,000<br />
Traction Motor Type 1 $ 5,000.00 12 12 6 6 6 $ 60,000 $ 60,000 $ 30,000 $ 30,000 $ 30,000 $ 210,000<br />
Type 2/3 $ 5,000.00 50 50 50 50 50 $ 250,000 $ 250,000 $ 250,000 $ 250,000 $ 250,000 $ 1,250,000<br />
Type 4 $ 5,000.00<br />
40 22 12 $ ‐ $ ‐ $ 200,000 $ 110,000 $ 60,000 $ 370,000<br />
Wiper/Car Body Type 2/3 $ 100.00 5 5 20 20 10 $ 500 $ 500 $ 2,000 $ 2,000 $ 1,000 $ 6,000<br />
Estimated Replacements<br />
Estimated Replacement Costs<br />
Rebuild Item Fleet Unit Cost <strong>FY</strong>14 <strong>FY</strong>15 <strong>FY</strong>16 <strong>FY</strong>17 <strong>FY</strong>18 <strong>FY</strong>14 <strong>FY</strong>15 <strong>FY</strong>16 <strong>FY</strong>17 <strong>FY</strong>18 <strong>FY</strong>14‐<strong>FY</strong>18 Total<br />
Totals Type 1 179 172 240 188 214 $ 610,000 $ 680,500 $ 806,500 $ 615,500 $ 667,500 $ 3,380,000<br />
Type 2/3 1,150 1,037 590 603 539 $ 4,183,000 $ 3,554,210 $ 1,588,310 $ 1,472,310 $ 1,378,820 $ 12,176,650<br />
Type 4 175 242 176 115 94 $ 416,500 $ 631,000 $ 540,000 $ 282,500 $ 221,727 $ 2,091,727<br />
Total 1,504 1,451 1,006 906 847 $ 5,209,500 $ 4,865,710 $ 2,934,810 $ 2,370,310 $ 2,268,047 $ 17,648,377<br />
Assumed Maintenance Budget Baseline (3% inflation) $ 1,701,170 $ 1,752,205 $ 1,804,771 $ 1,858,914 $ 1,914,682 $ 9,031,743<br />
Net Additional LRV Component Overhaul Total $ 3,508,330 $ 3,113,505 $ 1,130,039 $ 511,396 $ 353,365 $ 8,616,635<br />
Car Count<br />
Average<br />
Per Car Type 1 26 6.88 6.62 9.23 7.23 8.23 $ 23,462 $ 26,173 $ 31,019 $ 23,673 $ 25,673 $ 26,000<br />
Type 2/3 79 14.56 13.13 7.47 7.63 6.82 $ 52,949 $ 44,990 $ 20,105 $ 18,637 $ 17,453 $ 30,827<br />
Type 4 22 7.95 11.00 8.00 5.23 4.27 $ 18,932 $ 28,682 $ 24,545 $ 12,841 $ 10,079 $ 19,016<br />
Average 11.84 11.43 7.92 7.13 6.67 $ 41,020 $ 38,313 $ 23,109 $ 18,664 $ 17,859 $ 27,793<br />
Page ‐ 209
<strong>Capital</strong> <strong>Asset</strong> <strong>Management</strong> & <strong>Investment</strong> Program Appendix Non‐Revenue Vehicles<br />
Non‐Revenue Vehicle Replacements > $5,000 Table 16A<br />
VEH.#<br />
CONDITION BASED REPLACEMENT TABLE<br />
VEHICLE DESCRIPTION<br />
NON-REVENUE VEHICLES<br />
DEPT<br />
MODEL<br />
YEAR<br />
CURRENT<br />
AGE <strong>FY</strong>14<br />
<strong>FY</strong><br />
NEEDED COND. <strong>FY</strong>14 <strong>FY</strong>15 <strong>FY</strong>16 <strong>FY</strong>17 <strong>FY</strong>18<br />
<strong>FY</strong>14-<strong>FY</strong>18<br />
TOTALS<br />
ASSIGNED - STAFF<br />
2 DODGE VAN (Surveillance Van -- No Listed Mileage) Transit Police 1987 27 2016 3 $30,000 $30,000<br />
95 3 WHEEL ELECTRIC SCOOTER Trans Trainers 1988 26 2015 3 $5,000 $5,000<br />
154 FORD TAURUS WAGON Merlo Trans 1992 22 <strong>2014</strong> 3 $25,000 $25,000<br />
155 FORD TAURUS WAGON Powell Trans 1992 22 <strong>2014</strong> 3 $25,000 $25,000<br />
161 CHEVROLET ASTRO VAN Center Trans 1992 22 <strong>2014</strong> 3 $25,000 $25,000<br />
162 CHEVROLET ASTROVAN IDP 1992 22 <strong>2014</strong> 3 $25,000 $25,000<br />
163 CHEVROLET ASTROVAN TS/Mail Room 1992 22 <strong>2014</strong> 3 $25,000 $25,000<br />
812 FORD TAURUS SEDAN Shelly Lomax 1999 15 2015 2 $25,000 $25,000<br />
813 FORD TAURUS SEDAN Powell Trans 1995 19 2016 2 $25,000 $25,000<br />
815 FORD TAURUS SEDAN Powell Trans 1995 19 2015 3 $22,000 $22,000<br />
818 FORD TEMPO SEDAN Ruby Road Ops 1994 20 <strong>2014</strong> 2 $25,000 $25,000<br />
821 JEEP CHEROKEE 4 X 4 Safety HS 1995 19 2015 3 $30,000 $30,000<br />
822 FORD RANGER PU 2WD IDP 1995 19 2016 2 $25,000 $25,000<br />
827 FORD TAURUS Merlo Trans 1996 18 <strong>2014</strong> 2 $25,000 $25,000<br />
851 FORD WINDSTAR MINI VAN Marketing 1996 18 2016 2 $25,000 $25,000<br />
860 DODGE CARAVAN Safety/Drug Test 1997 17 <strong>2014</strong> 1 $25,000 $25,000<br />
893 CHEVY LUMINA SEDAN Customer Service 1998 16 2016 1 $25,000 $25,000<br />
1042 CUSHMAN GAS 3 WHEELER IT Dept. 1990 24 2015 2 $14,000 $14,000<br />
1064 CHEVROLET 1 TON VAN Distribution Ctr 1999 15 2016 1 $30,000 $30,000<br />
1105 GRUMMEN VAN (TICKET BOOTH) Ticket booth 1991 23 2016 1 $30,000 $30,000<br />
1108 CHEVROLET CARGO VAN IDP 2002 12 2016 2 $30,000 $30,000<br />
23 Total . . . . $200,000 $96,000 $220,000 $0 $0 $516,000<br />
Page ‐ 210
<strong>Capital</strong> <strong>Asset</strong> <strong>Management</strong> & <strong>Investment</strong> Program Appendix Non‐Revenue Vehicles<br />
Non‐Revenue Vehicle Replacements > $5,000 Table 16A (continued)<br />
VEH.#<br />
POOL<br />
CONDITION BASED REPLACEMENT TABLE<br />
VEHICLE DESCRIPTION<br />
DEPT<br />
MODEL<br />
YEAR<br />
CURRENT<br />
AGE <strong>FY</strong>14<br />
<strong>FY</strong><br />
NEEDED COND. <strong>FY</strong>14 <strong>FY</strong>15 <strong>FY</strong>16 <strong>FY</strong>17 <strong>FY</strong>18<br />
<strong>FY</strong>14-<strong>FY</strong>18<br />
TOTALS<br />
197 FORD TAURUS SEDAN (new eng@119k) Holgate Pool 1994 20 2015 2 $25,000 $25,000<br />
318 FORD WINDSTAR (new engine @ 80k) Ruby Pool 1995 19 2016 3 $25,000 $25,000<br />
847 CHEVROLET CLUB WAGON - 11 PASS Holgate Pool 1996 18 2015 2 $30,000 $30,000<br />
1056 DODGE WAGON ATP Pool 1999 15 2015 2 $30,000 $30,000<br />
1059 DODGE SEDAN Holgate Pool 1999 15 2016 2 $25,000 $25,000<br />
1080 TOYOTA PRIUS - HYBRID Center Pool 2000 14 2017 1 $25,000 $25,000<br />
1084 FORD ECONOLINE - 15 PASS Ruby Pool 1999 15 2017 1 $30,000 $30,000<br />
12 Total . . . .<br />
$0 $85,000 $50,000 $55,000 $0 $190,000<br />
ASSIGNED - FIELD OPERATIONS<br />
829 8-PASSENGER VAN (Fare Inspectors) Field Ops-Rail 1996 18 2015 2 $30,000 $30,000<br />
839 FORD F-150 PICKUP Field Ops-Rail 1996 18 <strong>2014</strong> 3 $25,000 $25,000<br />
854 FORD EXPLORER Field Ops-Rail 1997 17 <strong>2014</strong> 3 $25,000 $25,000<br />
855 FORD EXPLORER (new eng@ 154k) Field Ops-Rail 1997 17 <strong>2014</strong> 3 $25,000 $25,000<br />
856 FORD EXPLORER (206,442) Field Ops-Rail 1997 17 <strong>2014</strong> 3 $25,000 $25,000<br />
885 FORD F-150 PICKUP (new eng@82k) Field Ops-Rail 1997 17 2015 3 $25,000 $25,000<br />
1036 FORD EXPLORER Field Ops-Rail 1998 16 2015 3 $25,000 $25,000<br />
1060 JEEP-CHEROKEE Field Ops-Rail 1999 15 2015 3 $25,000 $25,000<br />
1072 FORD F-150 (new eng@142k) Field Ops-Rail 2000 14 2015 3 $25,000 $25,000<br />
1073 FORD F-150 (new eng) Field Ops-Rail 2000 14 <strong>2014</strong> 3 $25,000 $25,000<br />
1095 FORD F-150 (201,547) Field Ops-Rail 2001 13 <strong>2014</strong> 3 $25,000 $25,000<br />
1100 FORD F-150 (new eng@ 199k) (217,806) Field Ops-Rail 2001 13 <strong>2014</strong> 3 $25,000 $25,000<br />
1103 FORD F-150 (new eng@ 174k) (236,920) Field Ops-Bus 2001 13 2015 3 $25,000 $25,000<br />
34 Total . . . . $175,000 $155,000 $0 $0 $0 $330,000<br />
Page ‐ 211
<strong>Capital</strong> <strong>Asset</strong> <strong>Management</strong> & <strong>Investment</strong> Program Appendix Non‐Revenue Vehicles<br />
Non‐Revenue Vehicle Replacements > $5,000 Table 16A (continued)<br />
VEH.#<br />
CONDITION BASED REPLACEMENT TABLE<br />
VEHICLE DESCRIPTION<br />
DEPT<br />
MODEL<br />
YEAR<br />
CURRENT<br />
AGE <strong>FY</strong>14<br />
<strong>FY</strong><br />
NEEDED COND. <strong>FY</strong>14 <strong>FY</strong>15 <strong>FY</strong>16 <strong>FY</strong>17 <strong>FY</strong>18<br />
<strong>FY</strong>14-<strong>FY</strong>18<br />
TOTALS<br />
ASSIGNED - BUS MAINTENANCE<br />
1 CHAINING TRUCK -CHEVY (No Listed Mileage) Powell Maint 1985 29 2017 3 $30,000 $30,000<br />
104 FORD -F-350 Powell Maint 2007 7 1 $0<br />
118 DODGE PICKUP (4x4) Center NRV 1991 23 2015 2 $25,000 $25,000<br />
172 FORD RANGER 4X4 Center NRV 1992 22 <strong>2014</strong> 2 $25,000 $25,000<br />
173 GMC CUSTOM SAND TRK Merlo Maint 1992 22 2016 2 $50,000 $50,000<br />
188 GMC CUSTOM SAND TRK Center Maint 1993 21 2016 2 $50,000 $50,000<br />
190 FORD PICKUP 2WD Ruby NRV 1993 21 <strong>2014</strong> 2 $25,000 $25,000<br />
304 FORD RNGR EXT CAB PU Center NRV 1994 20 <strong>2014</strong> 2 $25,000 $25,000<br />
803 CHEVY ASTRO VAN (153,704) Merlo NRV 1995 19 2017 3 $25,000 $25,000<br />
810 GMC SAND TRUCK Powell Maint 1995 19 2016 2 $50,000 $50,000<br />
828 AEROSTAR MINI VAN Powell Maint 1996 18 2015 3 $25,000 $25,000<br />
838 FORD F150 PICKUP Merlo Maint 1996 18 2016 2 $30,000 $30,000<br />
846 CHEVROLET ASTRO VAN Center NRV 1996 18 2017 3 $30,000 $30,000<br />
848 CHEVROLET 3/4 T TRK Merlo Maint 1996 18 <strong>2014</strong> 2 $30,000 $30,000<br />
859 FORD 1 TON TRUCK - RADIO SRV. Center Maint 1997 17 2015 2 $30,000 $30,000<br />
1057 GMC STEP VAN-Chain Truck Center Maint 1998 16 2015 2 $30,000 $30,000<br />
1061 STEP VAN-RADIO SERVICE Merlo Maint 1999 15 2016 2 $30,000 $30,000<br />
1062 STEP VAN-RADIO SERVICE Powell Maint 1999 15 2016 2 $30,000 $30,000<br />
1075 HONDA INSIGHT- HYBRID Center NRV 2000 14 2017 2 $25,000 $25,000<br />
TBD MONEY RUN TRUCK REPLACEMENT - PENDING Center Maint 2013 1 2025 1 $0<br />
1090 FORD 1 TON DUALLY PICKUP Center Maint 2001 13 2017 2 $30,000 $30,000<br />
1204 FORD F-450 CREW CAB - MERLO SERVICE TRUCK Merlo Maint 2012 2 1 $0<br />
22 Total . . . . $105,000 $110,000 $240,000 $140,000 $0 $595,000<br />
ASSIGNED - FACILITIES MAINTENANCE<br />
27 KUBOTA RIDING LAWN MOWER Elmonica-FM 2007 7 2017 2 $15,000 $15,000<br />
33 17' TRAILER (LAND SCAPERS) Elmonica-FM 2007 7 2017 2 $15,000 $15,000<br />
92 CASE CRANE Ruby-FM 1983 31 2015 2 $15,000 $15,000<br />
115 GMC STEP VAN Merlo-FM 1991 23 2015 2 $30,000 $30,000<br />
171 FORD RANGER 4X4 Ruby-FM 1992 22 <strong>2014</strong> 2 $25,000 $25,000<br />
183 1-TON P/U DODGE Ruby-FM 1993 21 <strong>2014</strong> 2 $25,000 $25,000<br />
TBD FORD E-350 CARGO VAN 9th St.-FM 2012 2 2024 1 $30,000 $30,000<br />
193 FORD 1 TON PU Center-FM 1994 20 <strong>2014</strong> 3 $30,000 $30,000<br />
Page ‐ 212
<strong>Capital</strong> <strong>Asset</strong> <strong>Management</strong> & <strong>Investment</strong> Program Appendix Non‐Revenue Vehicles<br />
Non‐Revenue Vehicle Replacements > $5,000 Table 16A (continued)<br />
CONDITION BASED REPLACEMENT TABLE<br />
MODEL CURRENT <strong>FY</strong><br />
<strong>FY</strong>14-<strong>FY</strong>18<br />
VEH.# VEHICLE DESCRIPTION<br />
DEPT YEAR AGE <strong>FY</strong>14 NEEDED COND. <strong>FY</strong>14 <strong>FY</strong>15 <strong>FY</strong>16 <strong>FY</strong>17 <strong>FY</strong>18 TOTALS<br />
259 FORD RANGER PU 4x4 9th St.-FM 1998 16 2015 3 $30,000 $30,000<br />
265 STEP VAN (new engine 74K miles) 9th St.-FM 1998 16 2015 3 $30,000 $30,000<br />
834 3/4 TON VAN-ELMO Merlo-FM 1996 18 <strong>2014</strong> 2 $30,000 $30,000<br />
836 3/4 TON VAN CLEANER (159,030) Ruby FM 1996 18 2016 3 $30,000 $30,000<br />
841 3/4 TON PICKUP-ELMO Elmonica-FM 1996 18 <strong>2014</strong> 3 $30,000 $30,000<br />
842 1-TON 4WD STAKEBED W/DUMP BOX Center-FM 1996 18 <strong>2014</strong> 3 $30,000 $30,000<br />
843 1-TON HI-CUBE VAN Ruby-FM 1996 18 <strong>2014</strong> 2 $35,000 $35,000<br />
844 LANDSCAPER'S TRAILER Ruby-FM 1996 18 <strong>2014</strong> 3 $30,000 $30,000<br />
875 3/4 TON VAN Elmonica-FM 1997 17 <strong>2014</strong> 3 $30,000 $30,000<br />
877 3/4 TON VAN FM-PM 1997 17 <strong>2014</strong> 3 $25,000 $25,000<br />
880 1-TON PICKUP Ruby-FM 1997 17 2015 2 $25,000 $25,000<br />
886 STEPVAN Merlo-FM 1997 17 2016 2 $35,000 $35,000<br />
887 STEPVAN Center-FM 1997 17 2016 2 $30,000 $30,000<br />
890 FORD RANGER PICK UP 4x4 Ruby-FM 1998 16 2017 2 $25,000 $25,000<br />
891 FORD RANGER PICK UP 4x4 Ruby-FM 1998 16 2016 2 $25,000 $25,000<br />
892 FORD RANGER PICK UP 4x4 Center-FM 1998 16 2015 2 $25,000 $25,000<br />
1012 VAN-FORD ELMO Merlo-FM 1998 16 2015 2 $30,000 $30,000<br />
1030 CHEVROLET 2500 CREW CAB Elmonica-FM 1998 16 2015 2 $30,000 $30,000<br />
1031 FORD RANGER PICK UP 4x4 Merlo-FM 1998 16 2016 2 $30,000 $30,000<br />
1032 FORD PICKUP Ruby-FM 1998 16 2016 2 $30,000 $30,000<br />
1055 1-TON 4WD STAKEBED W/DUMP BOX Elmonica-FM 1998 16 2016 2 $30,000 $30,000<br />
1066 FORD RANGER PICK UP 4x4 Elmonica-FM 1999 15 2015 2 $25,000 $25,000<br />
1067 FORD 1-TON VAN Ruby-FM 1999 15 2017 2 $30,000 $30,000<br />
1069 LRV MAINT. UTILITY CART Ruby-FM 1999 15 2017 2 $14,000 $14,000<br />
1070 LRV MAINT. UTILITY CART Ruby-FM 1999 15 2017 2 $14,000 $14,000<br />
1074 1-TON PICKUP Ruby-FM 2000 14 2015 3 $30,000 $30,000<br />
1076 FORD 350 - 1 TON Center-FM 2000 14 2016 2 $35,000 $35,000<br />
1078 STEP VAN 9th St.-FM 2000 14 2016 2 $30,000 $30,000<br />
1086 GMC SAVANNA VAN Elmonica-FM 2001 13 2017 2 $30,000 $30,000<br />
1087 GMC SAVANNA VAN (new eng@133k) Ruby-FM 2001 13 2016 2 $30,000 $30,000<br />
1092 FORD 1 TON DUALLY PICKUP Powell-FM 2001 13 2017 2 $30,000 $30,000<br />
60 Total . . . . $290,000 $270,000 $335,000 $173,000 $0 $1,068,000<br />
Page ‐ 213
<strong>Capital</strong> <strong>Asset</strong> <strong>Management</strong> & <strong>Investment</strong> Program Appendix Non‐Revenue Vehicles<br />
Non‐Revenue Vehicle Replacements > $5,000 Table 16A (continued)<br />
VEH.#<br />
CONDITION BASED REPLACEMENT TABLE<br />
VEHICLE DESCRIPTION<br />
DEPT<br />
MODEL<br />
YEAR<br />
CURRENT<br />
AGE <strong>FY</strong>14<br />
<strong>FY</strong><br />
NEEDED COND. <strong>FY</strong>14 <strong>FY</strong>15 <strong>FY</strong>16 <strong>FY</strong>17 <strong>FY</strong>18<br />
<strong>FY</strong>14-<strong>FY</strong>18<br />
TOTALS<br />
ASSIGNED - STORES<br />
837 FORD 1-TON VAN Ruby Stores 1996 18 2015 2 $30,000 $30,000<br />
857 FORD ECONOLINE Powell Stores 1997 17 2016 2 $30,000 $30,000<br />
858 FORD ECONOLINE Merlo Stores 1997 17 2017 2 $30,000 $30,000<br />
3 Total . . . .<br />
$0 $30,000 $30,000 $30,000 $0 $90,000<br />
ASSIGNED - CAPITAL PROJECTS (HS)<br />
181 ASTRO VAN CRC Pool 1993 21 2015 3 $25,000 $25,000<br />
187 FORD RANGER 4X4 Bus Stops 1993 21 2015 2 $25,000 $25,000<br />
301 FORD RNGR EXT CAB PU Milwaukie Project 1994 20 2016 2 $25,000 $25,000<br />
302 FORD RNGR EXT CAB PU Stimulus Project 1994 20 2016 2 $25,000 $25,000<br />
303 FORD RNGR EXT CAB PU Stimulus Project 1994 20 2016 2 $25,000 $25,000<br />
305 FORD RNGR EXT CAB PU Milwaukie Project 1994 20 2015 2 $25,000 $25,000<br />
306 FORD RNGR EXT CAB PU Stimulus Project 1994 20 2016 2 $25,000 $25,000<br />
308 JEEP 4X4 CHEROKEE CRC Pool 1994 20 2016 2 $25,000 $25,000<br />
309 JEEP 4X4 CHEROKEE CRC Pool 1994 20 2016 2 $25,000 $25,000<br />
811 FORD RANGER PICKUP 2WD Milwaukie Project 1995 19 2017 2 $25,000 $25,000<br />
819 FORD TEMPO SEDAN Customer Service 1994 20 2015 3 $25,000 $25,000<br />
820 JEEP 4X4 CHEROKEE CRC Pool 1995 19 2017 2 $25,000 $25,000<br />
823 FORD RANGER PU 2WD CRC Pool 1995 19 2017 2 $25,000 $25,000<br />
824 FORD RANGER PU 2WD Stimulus Project 1995 19 2017 2 $25,000 $25,000<br />
825 FORD RANGER PU 2WD Milwaukie Project 1995 19 2017 2 $25,000 $25,000<br />
826 FORD RANGER PU 2WD Stimulus Project 1995 19 2015 2 $25,000 $25,000<br />
19 Total . . . .<br />
$0 $125,000 $150,000 $125,000 $0 $400,000<br />
ASSIGNED - ATP MAINT<br />
186 DODGE 3/4 TON PU ATP Maint 1993 21 <strong>2014</strong> 3 $25,000 $25,000<br />
2 Total . . . . $25,000 $0 $0 $0 $0 $25,000<br />
Page ‐ 214
<strong>Capital</strong> <strong>Asset</strong> <strong>Management</strong> & <strong>Investment</strong> Program Appendix Non‐Revenue Vehicles<br />
Non‐Revenue Vehicle Replacements > $5,000 Table 16A (continued)<br />
VEH.#<br />
CONDITION BASED REPLACEMENT TABLE<br />
VEHICLE DESCRIPTION<br />
DEPT<br />
MODEL<br />
YEAR<br />
CURRENT<br />
AGE <strong>FY</strong>14<br />
<strong>FY</strong><br />
NEEDED COND. <strong>FY</strong>14 <strong>FY</strong>15 <strong>FY</strong>16 <strong>FY</strong>17 <strong>FY</strong>18<br />
<strong>FY</strong>14-<strong>FY</strong>18<br />
TOTALS<br />
ASSIGNED - RAIL MAINT<br />
79 CUSHMAN UTILITY CART Ruby REM 1986 28 2015 3 $14,000 $14,000<br />
82 LRV CLEANING CART Elmo REM 1997 17 2015 3 $14,000 $14,000<br />
83 LRV CLEANING CART Elmo REM 1997 17 2015 3 $14,000 $14,000<br />
84 LRV CLEANING CART Ruby REM 1997 17 2015 2 $14,000 $14,000<br />
85 Electric Cart EZGO Ruby REM 2001 13 2016 2 $14,000 $14,000<br />
86 Electric Cart EZGO Ruby REM 2001 13 2016 2 $14,000 $14,000<br />
87 Electric Cart EZGO Ruby REM 2001 13 2016 2 $14,000 $14,000<br />
91 AIR COMPRESSOR TRAILER Ruby MOW 1998 16 2017 2 $10,000 $10,000<br />
117 DODGE 3/4 TON PU (153,999) Ruby REM 1991 23 2017 3 $25,000 $25,000<br />
119 S-10 CHEVY BLAZER (162,081) Ruby MOW 1991 23 2016 3 $25,000 $25,000<br />
138 HI-RAIL TRAILER Ruby MOW 1986 28 2017 1 $5,000 $5,000<br />
139 RE-RAIL TRAILER Ruby MOW 1986 28 2017 1 $15,000 $15,000<br />
182 ASTRO VAN (new eng@ 143k) Ruby Substation 1993 21 2015 3 $25,000 $25,000<br />
192 1/2 TON PICKUP (FORD) MOW 1993 21 2015 3 $28,000 $28,000<br />
194 FORD 1 TON CREW DUMP Elmo MOW 1994 20 2015 2 $35,000 $35,000<br />
195 CHEVY ASTRO VAN (156,538) Ruby FEM 1994 20 2016 3 $25,000 $25,000<br />
307 FORD RNGR EXT CAB PU Ruby MOW 1994 20 2016 3 $25,000 $25,000<br />
310 1-TON CREW CAB FLATBED TILT (new eng@192k) Ruby MOW 1994 20 2015 3 $35,000 $35,000<br />
316 FORD 1/2 T PU W/UTILITY BOX Ruby MOW 1994 20 2015 3 $30,000 $30,000<br />
805 1-TON VAN Elmo MOW 1995 19 <strong>2014</strong> 3 $25,000 $25,000<br />
806 1-TON VAN-RJ Ruby MOW 1995 19 <strong>2014</strong> 3 $25,000 $25,000<br />
807 1-TON VAN-RJ Ruby MOW 1995 19 <strong>2014</strong> 3 $25,000 $25,000<br />
817 FORD TAURUS SEDAN Elmo MOW 1995 19 <strong>2014</strong> 3 $25,000 $25,000<br />
832 3/4 TON VAN Ruby MOW 1996 18 <strong>2014</strong> 3 $25,000 $25,000<br />
833 3/4 TON VAN-ELMO Elmo MOW 1996 18 <strong>2014</strong> 3 $25,000 $25,000<br />
835 1-TON VAN Ruby MOW 1996 18 <strong>2014</strong> 3 $25,000 $25,000<br />
840 3/4 TON PICKUP Ruby MOW 1996 18 <strong>2014</strong> 3 $25,000 $25,000<br />
873 1-TON VAN Ruby MOW 1997 17 <strong>2014</strong> 2 $30,000 $30,000<br />
Page ‐ 215
<strong>Capital</strong> <strong>Asset</strong> <strong>Management</strong> & <strong>Investment</strong> Program Appendix Non‐Revenue Vehicles<br />
Non‐Revenue Vehicle Replacements > $5,000 Table 16A (continued)<br />
CONDITION BASED REPLACEMENT TABLE<br />
MODEL CURRENT <strong>FY</strong><br />
<strong>FY</strong>14-<strong>FY</strong>18<br />
VEH.# VEHICLE DESCRIPTION<br />
DEPT YEAR AGE <strong>FY</strong>14 NEEDED COND. <strong>FY</strong>14 <strong>FY</strong>15 <strong>FY</strong>16 <strong>FY</strong>17 <strong>FY</strong>18 TOTALS<br />
874 1-TON VAN Elmo MOW 1997 17 <strong>2014</strong> 2 $30,000 $30,000<br />
876 FORD E-250 CARGO Elmo MOW 1998 16 2015 3 $75,000 $75,000<br />
879 1/2 TON VAN Ruby MOW 1997 17 <strong>2014</strong> 2 $30,000 $30,000<br />
881 1-TON PICKUP-ELMO MOW TK 1997 17 <strong>2014</strong> 2 $30,000 $30,000<br />
882 1-TON UTILITYBED 4WD-ELMO MOW TK 1997 17 <strong>2014</strong> 2 $30,000 $30,000<br />
888 1-TON PICKUP Ruby MOW 1997 17 <strong>2014</strong> 3 $30,000 $30,000<br />
889 1-TON PICKUP-RJ Elmo MOW 1997 17 <strong>2014</strong> 3 $30,000 $30,000<br />
1000 3/4-TON VAN MOW OCS 1998 16 2016 2 $30,000 $30,000<br />
1001 3/4-TON VAN Ruby MOW 1998 16 <strong>2014</strong> 3 $25,000 $25,000<br />
1010 1-TON VAN Elmo MOW 1998 16 2015 3 $30,000 $30,000<br />
1011 1-TON VAN-RJ Ruby MOW 1998 16 2015 2 $30,000 $30,000<br />
1044 1-TON PICKUP RJ (new eng @ 40K) Ruby MOW 1998 16 <strong>2014</strong> 2 $30,000 $30,000<br />
1045 1-TON PICKUP Elmo REM 1998 16 <strong>2014</strong> 2 $30,000 $30,000<br />
1048 AIR COMPRESSOR TRAILER Elmo MOW 1998 16 2017 2 $30,000 $30,000<br />
1054 1-TON STAKEBED TRUCK Elmo MOW 1998 16 <strong>2014</strong> 2 $30,000 $30,000<br />
1065 1-TON STAKEBED W/LIFT GATE Elmo MOW 1999 15 2015 2 $30,000 $30,000<br />
1068 HI-RAIL CREW CAB PICKUP-DIESEL Ruby MOW 1999 15 2015 2 $35,000 $35,000<br />
1079 1-TON VAN Elmo MOW 2000 14 2017 2 $35,000 $35,000<br />
1088 GMC SAVANNA VAN Ruby MOW 2001 13 2016 1 $30,000 $30,000<br />
1089 GMC SAVANNA VAN MOW-SUB 2001 13 2016 2 $30,000 $30,000<br />
1091 FORD F-350 Ruby REM 2001 13 2017 1 $30,000 $30,000<br />
1137 FORD MINI BUS-SIGNAL TESTING (207,919) Ruby Elmo 1995 19 <strong>2014</strong> 3 $30,000 $30,000<br />
1138 FORD MINI BUS-SIGNAL TESTING (198,541) Elmo MOW 1995 19 2015 3 $30,000 $30,000<br />
1140 CHEVY 1-TON CARGO VAN Ruby MOW 2003 11 2017 2 $30,000 $30,000<br />
86 Total . . . . $555,000 $439,000 $207,000 $180,000 $0 $1,381,000<br />
261 TOTAL NON-REVENUE VEHICLES . . . . $1,350,000 $1,310,000 $1,232,000 $703,000 $0 $4,595,000<br />
Page ‐ 216
<strong>Capital</strong> <strong>Asset</strong> <strong>Management</strong> & <strong>Investment</strong> Program Appendix Non‐Revenue Vehicles<br />
Non‐Revenue Vehicle Replacements > $5,000 Table 16A (continued)<br />
CONDITION BASED REPLACEMENT TABLE<br />
MODEL CURRENT <strong>FY</strong><br />
<strong>FY</strong>14-<strong>FY</strong>18<br />
VEH.# VEHICLE DESCRIPTION<br />
DEPT YEAR AGE <strong>FY</strong>14 NEEDED COND. <strong>FY</strong>14 <strong>FY</strong>15 <strong>FY</strong>16 <strong>FY</strong>17 <strong>FY</strong>18 TOTALS<br />
HEAVY DUTY NON-REVENUE VEHICLES<br />
200 UNIMOG (Replace with 2nd Brandt Truck) Elmo REM 1985 29 <strong>2014</strong> 1 $250,000 $250,000<br />
202 HI-RAIL (Bucket Truck Conversion) Ruby MOW 1987 27 2016 2 $150,000 $150,000<br />
203 HI-RAIL CRANE TRUCK Ruby MOW 1986 28 <strong>2014</strong> 3 $250,000 $250,000<br />
204 HI-RAIL BUCKET TRUCK Ruby MOW 1987 27 2017 3 $250,000 $250,000<br />
1046 HY-RAIL PLATFORM TRUCK Ruby MOW 1998 16 <strong>2014</strong> 2 $130,000 $130,000<br />
1047 FORD F-350 MERLO SERVICE TRUCK (117,107) Merlo Maint 1998 16 2015 2 $80,000 $80,000<br />
1071 HI-RAIL BUCKET TRUCK Ruby MOW 1998 16 2015 3 $250,000 $250,000<br />
1081 HY-RAIL PLATFORM TRUCK Ruby MOW 2000 14 2017 3 $250,000 $250,000<br />
1082 HY-RAIL BUCKET TRUCK Ruby MOW 1999 15 2016 3 $250,000 $250,000<br />
1104 FORD F-550 HIGH RAIL VEHICLE Elmo MOW 2002 12 2017 1 $50,000 $50,000<br />
1144 STREET SWEEPER Ruby FM 2003 11 2017 3 $75,000 $75,000<br />
1201 INTERNATIONAL- Tow Truck Powell Maint 2004 10 1 $0<br />
1202 INTERNATIONAL- Tow Truck Center Maint 2004 10 1 $0<br />
1203 GMC TOW TRUCK Merlo Maint 2009 5 1 $0<br />
19 TOTAL HEAVY DUTY NON-REVENUE VEHICLES . . . . $630,000 $330,000 $400,000 $625,000 $0 $1,985,000<br />
Summary of Non‐Revenue Vehicle Replacements > $5,000 – Table 16A<br />
SUMMARY OF NRV VEHICLES<br />
Number<br />
of <strong>FY</strong>14 <strong>FY</strong>15 <strong>FY</strong>16 <strong>FY</strong>17 <strong>FY</strong>18 <strong>FY</strong><strong>2014</strong>-2018<br />
Vehicles<br />
TOTALS<br />
ASSIGNED - STAFF<br />
23 $ 200,000 $ 96,000 $ 220,000 $ - $ - $ 516,000<br />
POOL<br />
12 - 85,000 50,000 55,000 - 190,000<br />
ASSIGNED - FIELD OPERATIONS<br />
34 175,000 155,000 - - - 330,000<br />
ASSIGNED - BUS MAINTENANCE 22 105,000 110,000 240,000 140,000 - 595,000<br />
ASSIGNED - FACILITIES MAINTENANCE 60 290,000 270,000 335,000 173,000 - 1,068,000<br />
ASSIGNED - STORES<br />
3 - 30,000 30,000 30,000 - 90,000<br />
ASSIGNED - CAPITAL PROJECTS (HS)<br />
19 - 125,000 150,000 125,000 - 400,000<br />
ASSIGNED - ATP MAINT<br />
2 25,000 - - - - 25,000<br />
ASSIGNED - RAIL MAINT<br />
86 555,000 439,000 207,000 180,000 - 1,381,000<br />
HEAVY DUTY NON-REVENUE VEHICLES 19 630,000 330,000 400,000 625,000 - 1,985,000<br />
TOTAL NON-REVENUE VEHICLES 280 $ 1,980,000 $ 1,640,000 $ 1,632,000 $ 1,328,000 $ - $ 6,580,000<br />
Page ‐ 217
<strong>Capital</strong> <strong>Asset</strong> <strong>Management</strong> & <strong>Investment</strong> Program Appendix Non‐Revenue Vehicles<br />
Non‐Revenue Vehicle Replacements ≤ $5,000 – Table 16B<br />
VEH.# COST OF FORECASTED MAJOR REPAIRS<br />
DEPT<br />
MODEL<br />
YEAR<br />
CURRENT<br />
AGE <strong>FY</strong>14<br />
<strong>FY</strong><br />
NEEDED COND. <strong>FY</strong>14 <strong>FY</strong>15 <strong>FY</strong>16 <strong>FY</strong>17 <strong>FY</strong>18<br />
<strong>FY</strong>14-<strong>FY</strong>18<br />
TOTALS<br />
ASSIGNED - STAFF<br />
2 DODGE AIRES VAN Transit Police 1987 27 2015 3 $4,400 $4,400<br />
155 FORD TAURUS WAGON Powell Trans 1992 22 2015 3 $4,400 $4,400<br />
161 CHEVROLET ASTRO VAN Center Trans 1992 22 <strong>2014</strong> 3 $4,190 $4,190<br />
163 CHEVROLET ASTROVAN TS/Mail Room 1992 22 2016 3 $4,620 $4,620<br />
813 FORD TAURUS SEDAN Powell Trans 1995 19 2015 2 $4,400 $4,400<br />
815 FORD TAURUS SEDAN Powell Trans 1995 19 <strong>2014</strong> 3 $4,190 $4,190<br />
822 FORD RANGER PU 2WD IDP 1995 19 2015 2 $4,400 $4,400<br />
851 FORD WINDSTAR MINI VAN Marketing 1996 18 <strong>2014</strong> 2 $4,190 $4,190<br />
893 CHEVY LUMINA SEDAN Customer Service 1998 16 <strong>2014</strong> 1 $4,190 $4,190<br />
1105 GRUMMEN VAN (TICKET BOOTH) Ticket booth 1991 23 2016 1 $4,620 $4,620<br />
1108 CHEVROLET CARGO VAN IDP 2002 12 Various 2 $4,190 $4,620 $8,810<br />
23 Total . . . . $20,950 $17,600 $13,860 $0 $0 $52,410<br />
POOL<br />
318 FORD WINDSTAR (new engine @ 80k) Ruby Pool 1995 19 <strong>2014</strong> 3 $4,190 $4,190<br />
1080 TOYOTA PRIUS - HYBRID Center Pool 2000 14 2015 1 $4,400 $4,400<br />
1084 FORD ECONOLINE - 15 PASS Ruby Pool 1999 15 2015 1 $4,400 $4,400<br />
1124 FORD ECONOLINE - 12 PASS, Previously Cedar Shuttle Elmonica Pool 2002 12 Various 2 $4,620 $4,620 $9,240<br />
1125 FORD ECONOLINE - 12 PASS, Previously Cedar Shuttle Merlo Pool 2002 12 2015 2 $4,400 $4,400<br />
1126 FORD ECONOLINE - 12 PASS, Previously Cedar Shuttle Ruby Pool 2002 12 Various 2 $4,620 $4,620 $9,240<br />
12 Total . . . . $4,190 $13,200 $9,240 $9,240 $0 $35,870<br />
ASSIGNED - FIELD OPERATIONS<br />
854 FORD EXPLORER Field Ops-Rail 1997 17 <strong>2014</strong> 3 $4,190 $4,190<br />
856 FORD EXPLORER Field Ops-Rail 1997 17 <strong>2014</strong> 3 $4,190 $4,190<br />
1036 FORD EXPLORER Field Ops-Rail 1998 16 <strong>2014</strong> 3 $4,190 $4,190<br />
1072 FORD F-150 (new eng@142k) Field Ops-Rail 2000 14 <strong>2014</strong> 3 $4,190 $4,190<br />
1073 FORD F-150 (new eng) Field Ops-Rail 2000 14 2015 3 $4,400 $4,400<br />
1095 FORD F-150 Field Ops-Rail 2001 13 <strong>2014</strong> 3 $4,190 $4,190<br />
34 Total . . . . $20,950 $4,400 $0 $0 $0 $25,350<br />
Page ‐ 218
<strong>Capital</strong> <strong>Asset</strong> <strong>Management</strong> & <strong>Investment</strong> Program Appendix Non‐Revenue Vehicles<br />
Non‐Revenue Vehicle Replacements ≤ $5,000 – Table 16B (continued)<br />
VEH.# COST OF FORECASTED MAJOR REPAIRS<br />
DEPT<br />
MODEL<br />
YEAR<br />
CURRENT<br />
AGE <strong>FY</strong>14<br />
<strong>FY</strong><br />
NEEDED COND. <strong>FY</strong>14 <strong>FY</strong>15 <strong>FY</strong>16 <strong>FY</strong>17 <strong>FY</strong>18<br />
<strong>FY</strong>14-<strong>FY</strong>18<br />
TOTALS<br />
ASSIGNED - BUS MAINTENANCE<br />
104 FORD -F-350 Powell Maint 2007 7 Various 1 $4,620 $4,620 $9,240<br />
172 FORD RANGER 4X4 Center NRV 1992 22 <strong>2014</strong> 2 $4,190 $4,190<br />
803 CHEVY ASTRO VAN Merlo NRV 1995 19 <strong>2014</strong> 3 $4,190 $4,190<br />
810 GMC SAND TRUCK Powell Maint 1995 19 2015 2 $4,400 $4,400<br />
838 FORD F-150 PICKUP Merlo Maint 1996 18 <strong>2014</strong> 2 $4,190 $4,190<br />
848 CHEVROLET 3/4 T TRK Merlo Maint 1996 18 <strong>2014</strong> 2 $4,190 $4,190<br />
859 FORD 1 TON TRUCK - RADIO SRV. Center Maint 1997 17 <strong>2014</strong> 2 $4,190 $4,190<br />
1047 FORD F-350 MERLO SERVICE TRUCK Merlo Maint 1998 16 Various 2 $4,190 $4,620 $4,620 $13,430<br />
1057 GMC STEP VAN-Chain Truck Center Maint 1998 16 2015 2 $4,400 $4,400<br />
1061 STEP VAN-RADIO SERVICE Merlo Maint 1999 15 <strong>2014</strong> 2 $4,190 $4,190<br />
1075 HONDA INSIGHT- HYBRID Center NRV 2000 14 2015 2 $4,400 $4,400<br />
1090 FORD 1 TON DUALLY PICKUP Center Maint 2001 13 2015 2 $4,400 $4,400<br />
1201 INTERNATIONAL- Tow Truck Powell Maint 2004 10 Various 1 $4,620 $4,620 $9,240<br />
1202 INTERNATIONAL- Tow Truck Center Maint 2004 10 2015 1 $4,400 $4,400<br />
1203 GMC TOW TRUCK Merlo Maint 2009 5 Various 1 $4,620 $4,620 $9,240<br />
28 Total . . . . $29,330 $22,000 $18,480 $18,480 $0 $88,290<br />
ASSIGNED - FACILITIES MAINTENANCE<br />
183 1-TON P/U DODGE Ruby-FM 1993 21 Various 2 $4,620 $4,620 $9,240<br />
265 STEP VAN (new engine 74K miles) 9th St.-FM 1998 16 <strong>2014</strong> 3 $4,190 $4,190<br />
836 3/4 TON VAN CLEANER Ruby FM 1996 18 <strong>2014</strong> 3 $4,190 $4,190<br />
842 1-TON 4WD STAKEBED W/DUMP BOX Center-FM 1996 18 2015 3 $4,400 $4,400<br />
875 3/4 TON VAN Elmonica-FM 1997 17 <strong>2014</strong> 3 $4,190 $4,190<br />
877 3/4 TON VAN FM-PM 1997 17 2015 3 $4,400 $4,400<br />
887 STEPVAN Center-FM 1997 17 <strong>2014</strong> 2 $1,800 $1,800<br />
891 FORD RANGER PICK UP 4x4 Ruby-FM 1998 16 <strong>2014</strong> 2 $4,190 $4,190<br />
892 FORD RANGER PICK UP 4x4 Center-FM 1998 16 <strong>2014</strong> 2 $4,190 $4,190<br />
1032 FORD PICKUP Ruby-FM 1998 16 <strong>2014</strong> 2 $4,190 $4,190<br />
Page ‐ 219
<strong>Capital</strong> <strong>Asset</strong> <strong>Management</strong> & <strong>Investment</strong> Program Appendix Non‐Revenue Vehicles<br />
Non‐Revenue Vehicle Replacements ≤ $5,000 – Table 16B (continued)<br />
VEH.# COST OF FORECASTED MAJOR REPAIRS<br />
DEPT<br />
MODEL<br />
YEAR<br />
CURRENT<br />
AGE <strong>FY</strong>14<br />
<strong>FY</strong><br />
NEEDED COND. <strong>FY</strong>14 <strong>FY</strong>15 <strong>FY</strong>16 <strong>FY</strong>17 <strong>FY</strong>18<br />
<strong>FY</strong>14-<strong>FY</strong>18<br />
TOTALS<br />
1074 1-TON PICKUP Ruby-FM 2000 14 Various 3 $4,620 $4,620 $9,240<br />
1078 STEP VAN 9th St.-FM 2000 14 <strong>2014</strong> 2 $4,190 $4,190<br />
1086 GMC SAVANNA VAN Elmonica-FM 2001 13 2015 2 $4,400 $4,400<br />
1087 GMC SAVANNA VAN (new eng@133k) Ruby-FM 2001 13 2015 2 $4,400 $4,400<br />
1092 FORD 1 TON DUALLY PICKUP Powell-FM 2001 13 <strong>2014</strong> 2 $4,190 $4,190<br />
1141 FORD 1 TON TRUCK EXT CAB Elmonica-FM 2004 10 2015 1 $4,400 $4,400<br />
1144 STREET SWEEPER Ruby-FM 2003 11 <strong>2014</strong> 3 $4,190 $4,190<br />
61 Total . . . . $39,510 $22,000 $9,240 $9,240 $0 $79,990<br />
ASSIGNED - STORES<br />
857 FORD ECONOLINE Powell Stores 1997 17 2015 2 $4,400 $4,400<br />
858 FORD ECONOLINE Merlo Stores 1997 17 <strong>2014</strong> 2 $4,190 $4,190<br />
3 Total . . . . $4,190 $4,400 $0 $0 $0 $8,590<br />
ASSIGNED - CAPITAL PROJECTS (HS)<br />
187 FORD RANGER 4X4 Bus Stops 1993 21 2015 2 $4,400 $4,400<br />
302 FORD RNGR EXT CAB PU Stimulus Project 1994 20 2015 2 $4,400 $4,400<br />
305 FORD RNGR EXT CAB PU Milwaukie Project 1994 20 <strong>2014</strong> 2 $4,190 $4,190<br />
308 JEEP 4X4 CHEROKEE CRC Pool 1994 20 <strong>2014</strong> 2 $3,990 $3,990<br />
309 JEEP 4X4 CHEROKEE CRC Pool 1994 20 <strong>2014</strong> 2 $4,190 $4,190<br />
611 FORD ESCAPE CRC Pool 2007 7 Various 1 $4,620 $4,620 $9,240<br />
612 FORD ESCAPE Holladay Pool 2007 7 2015 1 $4,400 $4,400<br />
613 FORD ESCAPE CRC Pool 2007 7 Various 1 $4,620 $4,620 $9,240<br />
823 FORD RANGER PU 2WD CRC Pool 1995 19 <strong>2014</strong> 2 $4,190 $4,190<br />
824 FORD RANGER PU 2WD Stimulus Project 1995 19 2015 2 $4,400 $4,400<br />
19 Total . . . . $16,560 $17,600 $9,240 $9,240 $0 $52,640<br />
ASSIGNED - ATP MAINT<br />
186 DODGE 3/4 TON PU ATP Maint 1993 21 <strong>2014</strong> 3 $4,190 $4,190<br />
1077 FORD SERVICE TRUCK - 1 TON ATP Maint 2000 14 2015 1 $4,400 $4,400<br />
2 Total . . . . $4,190 $4,400 $0 $0 $0 $8,590<br />
Page ‐ 220
<strong>Capital</strong> <strong>Asset</strong> <strong>Management</strong> & <strong>Investment</strong> Program Appendix Non‐Revenue Vehicles<br />
Non‐Revenue Vehicle Replacements ≤ $5,000 – Table 16B (continued)<br />
VEH.# COST OF FORECASTED MAJOR REPAIRS<br />
DEPT<br />
MODEL<br />
YEAR<br />
CURRENT<br />
AGE <strong>FY</strong>14<br />
<strong>FY</strong><br />
NEEDED COND. <strong>FY</strong>14 <strong>FY</strong>15 <strong>FY</strong>16 <strong>FY</strong>17 <strong>FY</strong>18<br />
<strong>FY</strong>14-<strong>FY</strong>18<br />
TOTALS<br />
ASSIGNED - RAIL MAINT<br />
83 LRV CLEANING CART Elmo REM 1997 17 <strong>2014</strong> 3 $1,000 $1,000<br />
87 Electric Cart EZGO Ruby REM 2001 13 <strong>2014</strong> 2 $1,000 $1,000<br />
182 ASTRO VAN (new eng@ 143k) Ruby Substation 1993 21 <strong>2014</strong> 3 $4,190 $4,190<br />
195 CHEVY ASTRO VAN Ruby FEM 1994 20 <strong>2014</strong> 3 $4,190 $4,190<br />
202 HI-RAIL Bucket Truck Conversion Ruby MOW 1987 27 2015 2 $4,400 $4,400<br />
203 HI-RAIL CRANE TRUCK Ruby MOW 1986 28 2015 3 $4,400 $4,400<br />
204 HI-RAIL BUCKET TRUCK Ruby MOW 1987 27 <strong>2014</strong> 3 $4,190 $4,190<br />
805 1-TON VAN Elmo MOW 1995 19 2015 3 $4,400 $4,400<br />
806 1-TON VAN-RJ Ruby MOW 1995 19 <strong>2014</strong> 3 $4,190 $4,190<br />
833 3/4 TON VAN-ELMO Elmo MOW 1996 18 <strong>2014</strong> 3 $4,190 $4,190<br />
835 1-TON VAN Ruby MOW 1996 18 2015 3 $4,400 $4,400<br />
876 FORD E-250 CARGO Elmo MOW 1998 16 2015 3 $4,400 $4,400<br />
881 1-TON PICKUP-ELMO MOW TK 1997 17 <strong>2014</strong> 2 $4,190 $4,190<br />
882 1-TON UTILITYBED 4WD-ELMO MOW TK 1997 17 <strong>2014</strong> 2 $4,190 $4,190<br />
889 1-TON PICKUP-RJ Elmo MOW 1997 17 <strong>2014</strong> 3 $4,190 $4,190<br />
1044 1-TON PICKUP RJ (new eng @ 40K) Ruby MOW 1998 16 <strong>2014</strong> 2 $4,190 $4,190<br />
1053 CAR MOVER"BRANDT TRUCK" Ruby REM 1998 16 Various 1 $4,190 $4,620 $4,620 $13,430<br />
1079 1-TON VAN Elmo MOW 2000 14 <strong>2014</strong> 2 $4,190 $4,190<br />
1088 GMC SAVANNA VAN Ruby MOW 2001 13 <strong>2014</strong> 1 $4,190 $4,190<br />
1089 GMC SAVANNA VAN MOW SUB 2001 13 2015 2 $3,800 $3,800<br />
1091 FORD F-350 Ruby REM 2001 13 2015 1 $3,800 $3,800<br />
1104 FORD F-550 HIGH RAIL VEHICLE Elmo MOW 2002 12 <strong>2014</strong> 1 $4,190 $4,190<br />
1109 FORD PUMP TRUCK Ruby Elmo 1999 15 <strong>2014</strong> 1 $3,990 $3,990<br />
1139 GMC DUMP TRUCK, HI-RAIL Ruby MOW 2002 12 Various 1 $4,620 $4,620 $9,240<br />
1140 CHEVY 1-TON CARGO VAN Ruby MOW 2003 11 <strong>2014</strong> 2 $4,190 $4,190<br />
1142 FORD I TON CREW CAB Elmo MOW 2004 10 Various 1 $4,620 $4,620 $9,240<br />
97 Total . . . . $64,650 $29,600 $13,860 $13,860 $0 $121,970<br />
279 TOTAL NON-REVENUE VEHICLES . . . . $204,520 $135,200 $73,920 $60,060 $0 $473,700<br />
ADJUSTED AMOUNT $0 $135,200 $73,920 $60,060 $0 $269,180<br />
*<strong>FY</strong>14 budgeted appropriations will only include carryover amount ($132,407) and not forecasted costs.<br />
Page ‐ 221
<strong>Capital</strong> <strong>Asset</strong> <strong>Management</strong> & <strong>Investment</strong> Program Appendix Non‐Revenue Vehicles<br />
Summary of Non‐Revenue Vehicle Replacements ≤ $5,000 – Table 16B<br />
SUMMARY OF NRV ≤ $5,000<br />
<strong>FY</strong>14 <strong>FY</strong>15 <strong>FY</strong>16 <strong>FY</strong>17 <strong>FY</strong>18 <strong>FY</strong><strong>2014</strong>-2018<br />
TOTALS<br />
ASSIGNED - STAFF<br />
$ 20,950 $ 17,600 $ 13,860 $ - $ - $ 52,410<br />
POOL<br />
4,190 13,200 9,240 9,240 - 35,870<br />
ASSIGNED - FIELD OPERATIONS<br />
20,950 4,400 - - - 25,350<br />
ASSIGNED - BUS MAINTENANCE 29,330 22,000 18,480 18,480 - 88,290<br />
ASSIGNED - FACILITIES MAINTENANCE 39,510 22,000 9,240 9,240 - 79,990<br />
ASSIGNED - STORES<br />
4,190 4,400 - - - 8,590<br />
ASSIGNED - CAPITAL PROJECTS (HS) 16,560 17,600 9,240 9,240 - 52,640<br />
ASSIGNED - ATP MAINT<br />
4,190 4,400 - - - 8,590<br />
ASSIGNED - RAIL MAINT<br />
64,650 29,600 13,860 13,860 - 121,970<br />
TOTAL NON-REVENUE VEHICLES $ 204,520 $ 135,200 $ 73,920 $ 60,060 $ - $ 473,700<br />
ADJUSTED AMOUNT $ - $ 135,200 $ 73,920 $ 60,060 $ - $ 269,180<br />
Non‐Revenue Shop Equipment – Table 12C<br />
TABLE 12C <strong>FY</strong>14-<strong>FY</strong>18 BUS MAINTENANCE NON-REVENUE CAPITAL PROGRAMS - SHOP EQUIPMENT REPLACEMENT/REPAIR<br />
ITEM REQUIRED<br />
PROJECT ACTION<br />
MANAGER NEEDED<br />
<strong>FY</strong><br />
NEEDED<br />
YEAR OF CURRENT<br />
PURCHASE AGE <strong>FY</strong>14<br />
OPTIMUM<br />
REPLACEMENT<br />
CYCLE COND. <strong>FY</strong>14 <strong>FY</strong>15 <strong>FY</strong>16 <strong>FY</strong>17 <strong>FY</strong>18<br />
<strong>FY</strong>14-<strong>FY</strong>18<br />
TOTAL<br />
NON-REVENUE VEHICLES (
<strong>Capital</strong> <strong>Asset</strong> <strong>Management</strong> & <strong>Investment</strong> Program Appendix Facilities <strong>Management</strong><br />
Facilities <strong>Management</strong> ‐ Building Area/Component<br />
Item Location Project mgr Bus/Rail Condition<br />
Useful life<br />
(typ) <strong>FY</strong>14 <strong>FY</strong>15 <strong>FY</strong>16 <strong>FY</strong>17 <strong>FY</strong>18<br />
Total<br />
<strong>FY</strong>14‐<strong>FY</strong>18<br />
*IMPROVEMENT ‐ Bay Utility Relocations Bay M4E ELMONICA Papadopoulos R n/a n/a $ ‐ $ ‐ $ 32,706 $ ‐ $ ‐ $ 32,706<br />
*IMPROVEMENT ‐ Build Permanent Operator/Others Restrooms VARIOUS locations Papadopoulos R ‐ 110,000 110,000 110,000 110,000 440,000<br />
*IMPROVEMENT ‐ Pallet Rack Cover Exterior ELMONICA Papadopoulos R n/a 30 28,710 28,710<br />
*IMPROVEMENT ‐ Railing Repainting Interior ‐ New Color ELMONICA Papadopoulos R n/a 10 ‐ 54,863 ‐ ‐ ‐ 54,863<br />
*IMPROVEMENT ‐ Refurbish Lobby and East Entry CENTER ADMINISTRATION Papadopoulos B 3 15 ‐ ‐ ‐ ‐ ‐ ‐<br />
*IMPROVEMENT ‐ REM Storage ELMONICA Papadopoulos R n/a 20 261,038 ‐ ‐ ‐ ‐ 261,038<br />
*IMPROVEMENT ‐ Supervisor Office Relocation ELMONICA Papadopoulos R n/a 15 ‐ 29,375 101,533 ‐ ‐ 130,908<br />
*IMPROVEMENT ‐ TEI & Master Plan ‐ new construction POWELL Papadopoulos B 3 50 60,000 129,851 477,822 ‐ ‐ 667,673<br />
DOORS exterior mandoor south end, 2nd floor CENTER MAINT Nordstrom/Ronan B 3 40 3,000 ‐ ‐ ‐ ‐ 3,000<br />
DOORS OVERHEAD Motors POWELL Nordstrom/Ronan B 3 20 17,500 15,000 ‐ ‐ ‐ 32,500<br />
EXTERIOR Painting PLATFORMS ‐ MAX Papadopoulos R 3 10 80,000 80,000 80,000 80,000 80,000 400,000<br />
EXTERIOR Painting/Reseal LAYOVER FOSTER Papadopoulos B 2 10 1,200 ‐ ‐ ‐ ‐ 1,200<br />
EXTERIOR Painting/Reseal RUBY NORTH Papadopoulos R 2 10 100,000 ‐ ‐ ‐ ‐ 100,000<br />
EXTERIOR Painting/Reseal TRANSIT CENTER BARBUR Papadopoulos B 2 10 55,000 ‐ ‐ ‐ ‐ 55,000<br />
EXTERIOR Painting/Reseal TRANSIT CENTER TIGARD Papadopoulos B 2 10 ‐ 18,000 ‐ ‐ ‐ 18,000<br />
EXTERIOR Painting/Reseal ???? PARKING GARAGE DISRICT‐WIDE Papadopoulos R 2 10 85,000 85,000 ‐ ‐ ‐ 170,000<br />
EXTERIOR Painting/Reseal CMU PARK & RIDE TUALATIN NORTH/SOUTH Papadopoulos B 3 5 ‐ ‐ 4,500 ‐ ‐ 4,500<br />
FLOOR CARPET RUBY NORTH Papadopoulos R 2 15 ‐ ‐ ‐ 100,000 ‐ 100,000<br />
FLOOR CARPET, 2ND FLR HALLWAY ‐ replace ELMONICA Papadopoulos R 3 15 5,000 ‐ ‐ ‐ ‐ 5,000<br />
FLOOR CONCRETE Non‐Skid Coating CENTER MAINT Ntekpere B 2 4 ‐ ‐ ‐ 90,000 ‐ 90,000<br />
FLOOR CONCRETE Non‐Skid Coating CENTER MAINTENANCE FUEL HOUSE Ntekpere B 2 4 ‐ ‐ ‐ 27,000 ‐ 27,000<br />
FLOOR CONCRETE Non‐Skid Coating MERLO MAINTENANCE Ntekpere B 2 4 ‐ ‐ ‐ 20,000 ‐ 20,000<br />
FLOOR CONCRETE Non‐Skid Coating POWELL FUEL HOUSE Ntekpere B 2 4 ‐ ‐ ‐ 20,000 ‐ 20,000<br />
FLOOR EPOXY TERMINAL FOREST GROVE Nordstrom/Ronan B 2 6 ‐ ‐ 2,000 ‐ ‐ 2,000<br />
FLOOR EPOXY TRANSIT CENTER ROSE QUARTER Nordstrom/Ronan B 2 6 ‐ ‐ 3,000 ‐ ‐ 3,000<br />
IMPROVEMENT Mezzanine for Storage RUBY SOUTH Papadopoulos R n/a 30 ‐ ‐ 30,000 150,000 ‐ 180,000<br />
IMPROVEMENT Tenant ELMONICA Papadopoulos R 2 15 $ ‐ $ ‐ $ ‐ $ 108,000 $ ‐ $ 108,000<br />
*INTERIOR ‐ Refurbish Admin/Operator Report Area MERLO ADMINISTRATION Papadopoulos B 3 15 $ ‐ $ 107,000 $ 393,000 $ ‐ $ ‐ $ 500,000<br />
*INTERIOR ‐ Refurbish Layover & Crew Rooms VARIOUS locations ‐ Rail layovers Papadopoulos R 3 15 40,000 52,000 52,000 52,000 52,000 248,000<br />
*INTERIOR ‐ Refurbish OPS (admin, bullpen, restrooms) POWELL Papadopoulos B 3 15 96,258 350,016 ‐ ‐ ‐ 446,274<br />
INTERIOR Painting/Tile work CENTER MAINT Papadopoulos B 2 15 100,000 ‐ ‐ ‐ ‐ 100,000<br />
INTERIOR Painting/Tile work NELA ATP Papadopoulos B 2 15 ‐ ‐ ‐ 30,000 ‐ 30,000<br />
INTERIOR Painting/Tile work RUBY NORTH Papadopoulos R 2 15 ‐ ‐ 160,000 ‐ ‐ 160,000<br />
INTERIOR Painting/Tile work TRANSIT CENTER OREGON CITY Papadopoulos B 2 15 ‐ ‐ 1,000 ‐ ‐ 1,000<br />
INTERIOR Refurbish TRANSIT CENTER HILLSBORO Papadopoulos B 3 15 ‐ 30,000 ‐ ‐ ‐ 30,000<br />
INTERIOR Refurbish Lunchroom RUBY NORTH Papadopoulos R 2 15 ‐ ‐ ‐ 25,000 ‐ 25,000<br />
INTERIOR Restrooms ‐ upgrade/refurbish RUBY NORTH Papadopoulos R 2 15 ‐ ‐ 39,000 ‐ ‐ 39,000<br />
LIGHTING (Shop) CENTER MAINT Nordstrom/Ronan B n/a 2 4,000 ‐ 4,000 ‐ 4,000 12,000<br />
LIGHTING (Shop) MERLO MAINTENANCE Nordstrom/Ronan B n/a 2 4,000 ‐ 4,000 ‐ 4,000 12,000<br />
LIGHTING (Shop) NELA ATP Nordstrom/Ronan B n/a 2 1,500 ‐ 1,500 ‐ 1,500 4,500<br />
LIGHTING (Shop) POWELL Nordstrom/Ronan B n/a 2 4,000 ‐ 4,000 ‐ 4,000 12,000<br />
LIGHTING Ceiling lights ‐24 hour lighting VINTAGE TROLLEY BARN Nordstrom/Ronan R n/a 2 500 ‐ 500 ‐ 500 1,500<br />
LIGHTING interior CENTER ADMINISTRATION Nordstrom/Ronan B n/a 2 1,500 ‐ 1,500 ‐ 1,500 4,500<br />
LIGHTING interior MERLO ADMINISTRATION Nordstrom/Ronan B n/a 2 1,500 ‐ 1,500 ‐ 1,500 4,500<br />
LIGHTING Paint Bay MERLO MAINTENANCE Nordstrom/Ronan B n/a 2 500 ‐ 500 ‐ 500 1,500<br />
ROOF Inspect/repair EPDM CENTER ADMINISTRATION Papadopoulos B 2 5 25,000 ‐ ‐ ‐ ‐ 25,000<br />
ROOF Inspect/repair EPDM NELA ATP Papadopoulos B 2 5 25,000 ‐ ‐ ‐ ‐ 25,000<br />
SHELTER/WIND SCREEN (ongoing glass replacement?) PLATFORMS ‐ WES Nordstrom/Ronan R 2 2 ‐ 3,000 ‐ 3,000 ‐ 6,000<br />
WINDOWS Replace CENTER MAINT Papadopoulos B 2 40 ‐ 35,000 ‐ ‐ ‐ 35,000<br />
WINDOWS Replace POWELL Papadopoulos B 2 40 ‐ 20,000 ‐ 20,000 ‐ 40,000<br />
WINDOWS Reseal MERLO MAINTENANCE Nordstrom/Ronan B 3 5 10,000 ‐ ‐ ‐ ‐ 10,000<br />
Total Building Area/Components $ 981,496 $ 1,119,105 $ 1,504,061 $ 863,710 $ 259,500 $ 4,727,872<br />
Note: Items marked with asterisk (*) indicate item is project.<br />
Page ‐ 223
<strong>Capital</strong> <strong>Asset</strong> <strong>Management</strong> & <strong>Investment</strong> Program Appendix Facilities <strong>Management</strong><br />
Facilities <strong>Management</strong> ‐ Electrical Equipment & Systems<br />
Item Location Project mgr Bus/Rail Condition<br />
Useful life<br />
(typ) <strong>FY</strong>14 <strong>FY</strong>15 <strong>FY</strong>16 <strong>FY</strong>17 <strong>FY</strong>18<br />
Total<br />
<strong>FY</strong>14‐<strong>FY</strong>18<br />
ELECTRICAL Generator ‐ ADD ELMONICA Papadopoulos R n/a 25 $ ‐ $ 30,000 $ 220,000 $ ‐ $ ‐ $ 250,000<br />
ELECTRICAL UPS Batteries CENTER ADMINISTRATION Ntekpere B n/a 3 10,000 ‐ ‐ 10,000 ‐ 20,000<br />
ELECTRICAL UPS Batteries CENTER MAINT Ntekpere B n/a 3 ‐ ‐ 10,000 ‐ ‐ 10,000<br />
ELECTRICAL UPS Batteries ELMONICA Ntekpere R n/a 3 15,000 ‐ ‐ 15,000 ‐ 30,000<br />
ELECTRICAL UPS Batteries MERLO ADMINISTRATION Ntekpere B n/a 3 ‐ ‐ 7,500 ‐ ‐ 7,500<br />
ELECTRICAL UPS Batteries NELA ATP Ntekpere B n/a 3 ‐ ‐ 15,000 ‐ ‐ 15,000<br />
ELECTRICAL UPS Batteries POWELL Ntekpere B n/a 3 ‐ ‐ 7,500 ‐ ‐ 7,500<br />
ELECTRICAL UPS Batteries RUBY NORTH, 2 LOCATIONS Ntekpere R n/a 3 20,000 ‐ ‐ 20,000 ‐ 40,000<br />
Total Electrical Equipment & Systems $ 45,000 $ 30,000 $ 260,000 $ 45,000 $ ‐ $ 380,000<br />
Facilities <strong>Management</strong> ‐ HVAC Equipment & Systems<br />
Item Location Project mgr Bus/Rail Condition<br />
Useful life<br />
(typ) <strong>FY</strong>14 <strong>FY</strong>15 <strong>FY</strong>16 <strong>FY</strong>17 <strong>FY</strong>18<br />
Total<br />
<strong>FY</strong>14‐<strong>FY</strong>18<br />
*HVAC ‐ Battery Room Ventilation ‐ Improve/Eval CENTER MAINT Papadopoulos B 2 n/a $ 44,625 $ 125,449 $ ‐ $ ‐ $ ‐ $ 170,074<br />
*HVAC ‐ Server Room Remodel ‐ Energy Trust Eligible RUBY NORTH Papadopoulos R n/a n/a 26,100 57,330 ‐ ‐ ‐ 83,430<br />
*HVAC ‐ Welding Area Ventilation ELMONICA Papadopoulos R n/a 20 ‐ ‐ 27,600 100,798 ‐ 128,398<br />
*HVAC DDC Replacement RUBY NORTH Papadopoulos R 3 25 119,351 ‐ ‐ ‐ ‐ 119,351<br />
HVAC Replacement Carnes Upblast fans ??? MERLO MAINTENANCE Nordstrom/Ronan B 2 20 ‐ 30,000 ‐ ‐ ‐ 30,000<br />
HVAC Boiler Evaluate/replace RUBY NORTH Nordstrom/Ronan R 3 35 3,000 34,000 ‐ ‐ ‐ 37,000<br />
HVAC contol upgrade ELMONICA Ntekpere R 2 25 ‐ 40,000 ‐ ‐ ‐ 40,000<br />
HVAC Duct Cleaning POWELL Ntekpere B n/a 7 ‐ ‐ ‐ 5,000 ‐ 5,000<br />
HVAC Exhaust Fans Overhaul MERLO MAINTENANCE Papadopoulos B 2 10 ‐ ‐ ‐ 35,000 ‐ 35,000<br />
HVAC Infrared Heater Replacement CENTER MAINT Papadopoulos B 3 20 270,000 220,000 222,000 ‐ ‐ 712,000<br />
Total HVAC Equipment & Systems $ 463,076 $ 506,779 $ 249,600 $ 140,798 $ ‐ $ 1,360,253<br />
Note: Items marked with asterisk (*) indicate item is project.<br />
Page ‐ 224
<strong>Capital</strong> <strong>Asset</strong> <strong>Management</strong> & <strong>Investment</strong> Program Appendix Facilities <strong>Management</strong><br />
Facilities <strong>Management</strong> ‐ Lifting Equipment & Systems<br />
Item Location Project mgr Bus/Rail Condition<br />
Useful life<br />
(typ) <strong>FY</strong>14 <strong>FY</strong>15 <strong>FY</strong>16 <strong>FY</strong>17 <strong>FY</strong>18<br />
Total<br />
<strong>FY</strong>14‐<strong>FY</strong>18<br />
*HOISTS Unit 9 & 13 POWELL Papadopoulos B 3 30 $ ‐ $ ‐ $ ‐ $ 230,000 $ ‐ $ 230,000<br />
*HOISTS Unit <strong>FY</strong>14 ‐ #27 & #28; <strong>FY</strong>17 ‐ #7 CENTER MAINT Papadopoulos B 3 30 421,000 ‐ ‐ ‐ ‐ 421,000<br />
*HOISTS Unit <strong>FY</strong>15 ‐ #8; <strong>FY</strong>16 ‐ #9 & #10 MERLO MAINTENANCE Papadopoulos B 3 30 ‐ 220,000 446,640 ‐ ‐ 666,640<br />
*IMPROVEMENT ‐ Jib Crane for Rebuild Area ELMONICA Papadopoulos R n/a n/a ‐ ‐ ‐ 21,509 ‐ 21,509<br />
ELEVATOR Flr Lining‐ CTC, STC, Grshm, Gtwy PARKING GARAGE DISRICT‐WIDE Ntekpere R 3 7 10,000 10,000 10,000 10,000 10,000 50,000<br />
ELEVATOR Flr lining ‐Gtwy, 82 nd , 42 nd , 60 th ,STC PLATFORMS MAX Ntekpere R 3 7 10,000 10,000 10,000 10,000 10,000 50,000<br />
HOISTS‐ INGROUND ‐ cylinder rechroming POWELL Nordstrom/Ronan B 3 20 24,000 ‐ ‐ ‐ ‐ 24,000<br />
Hoists Omer lift pin PARTS BUS GARAGES ‐ ALL Nordstrom/Ronan B n/a 30 7,000 7,000 7,000 7,000 7,000 35,000<br />
Total Lifting Equipment & Systems $ 472,000 $ 247,000 $ 473,640 $ 278,509 $ 27,000 $ 1,498,149<br />
Note: Items marked with asterisk (*) indicate item is project.<br />
Facilities <strong>Management</strong> ‐ Plumbing Systems<br />
Item Location Project mgr Bus/Rail Condition<br />
Useful life<br />
(typ) <strong>FY</strong>14 <strong>FY</strong>15 <strong>FY</strong>16 <strong>FY</strong>17 <strong>FY</strong>18<br />
Total<br />
<strong>FY</strong>14‐<strong>FY</strong>18<br />
PLUMBING 17th Ave backflow CENTER ADMINISTRATION Papadopoulos B 2 onetime $ ‐ $ ‐ $ 70,000 $ ‐ $ ‐ $ 70,000<br />
PLUMBING Mop Sinks Add at Sunset, 185th TRANSIT CENTER DISRICT‐WIDE Ntekpere R n/a onetime ‐ ‐ 10,000 ‐ ‐ 10,000<br />
PLUMBING Sewer Line to Street CENTER ADMINISTRATION Nordstrom/Ronan B 3 20 ‐ ‐ 15,000 ‐ ‐ 15,000<br />
PLUMBING Storm Drain yard POWELL ATP Ntekpere B 2 20 ‐ 25,000 ‐ ‐ ‐ 25,000<br />
PLUMBING STORM DRAINS yard POWELL Papadopoulos B 3 20 ‐ 20,000 ‐ ‐ ‐ 20,000<br />
Total Plumbing Systems $ ‐ $ 45,000 $ 95,000 $ ‐ $ ‐ $ 140,000<br />
Facilities <strong>Management</strong> ‐ Safety/Hazmat Systems<br />
Item Location Project mgr Bus/Rail Condition<br />
Useful life<br />
(typ) <strong>FY</strong>14 <strong>FY</strong>15 <strong>FY</strong>16 <strong>FY</strong>17 <strong>FY</strong>18<br />
Total<br />
<strong>FY</strong>14‐<strong>FY</strong>18<br />
CO2 sensors ‐ garage exhaust TRANSIT CENTER CLACKAMAS TWN CNTR Nordstrom/Ronan B n/a 2 $ 6,193 $ ‐ $ 6,193 $ ‐ $ 6,193 $ 18,579<br />
Total Safety‐Hazmat Systems $ 6,193 $ ‐ $ 6,193 $ ‐ $ 6,193 $ 18,579<br />
Page ‐ 225
<strong>Capital</strong> <strong>Asset</strong> <strong>Management</strong> & <strong>Investment</strong> Program Appendix Facilities <strong>Management</strong><br />
Facilities <strong>Management</strong> ‐ Site/Property Improvements<br />
ITEM LOCATION Project mgr Bus/Rail Condition<br />
Useful life<br />
(typ) <strong>FY</strong>14 <strong>FY</strong>15 <strong>FY</strong>16 <strong>FY</strong>17 <strong>FY</strong>18<br />
Total<br />
<strong>FY</strong>14‐<strong>FY</strong>18<br />
*DEMOLITION ‐ Blue Flame Building Powell Papadopoulos B 3 n/a $ 37,854 $ ‐ $ ‐ $ ‐ $ ‐ $ 37,854<br />
*IMPROVEMENT ‐ Station Finishes & Landscaping PLATFORMS ‐ WASHINGTON PARK Papadopoulos R 3 30 654,032 ‐ 2,674,353 ‐ ‐ 3,328,385<br />
*PLATFORM PAVERS ‐ Sunset T/C Replacement TRANSIT CENTER ‐ SUNSET Papadopoulos R 3 onetime 295,452 1,235,827 ‐ ‐ ‐ 1,531,279<br />
*TRANSIT CENTER ‐ Hollywood Paving & Storm Drainage TRANSIT CENTER Hollywood/NE 42nd Papadopoulos B 3 27 ‐ 200,000 ‐ ‐ ‐ 200,000<br />
*VAULT COVERS ‐ Downtown Vault Lid Replacements Various: Morrison & Yamhill Kindig/Papadopoulos R 3 n/a 310,200 ‐ ‐ ‐ ‐ 310,200<br />
FENCING Chain Link add TRANSIT CENTER WILLOW CREEK Nordstrom/Ronan B n/a 10 3,000 ‐ ‐ ‐ ‐ 3,000<br />
Gate Operator Replacement (2) RUBY WEST Nordstrom/Ronan R 2 7 14,000 ‐ ‐ ‐ ‐ 14,000<br />
IMPROVEMENT Trash Recepticle Liners‐District wide PLATFORMS ‐ MAX Cook R n/a n/a ‐ 12,000 ‐ 12,000 ‐ 24,000<br />
LANDSCAPING ELMONICA Cook R 3 n/a ‐ 2,000 ‐ 2,000 ‐ 4,000<br />
LANDSCAPING MERLO ATP Cook B 2 n/a ‐ ‐ 1,000 ‐ ‐ 1,000<br />
LANDSCAPING PLATFORMS ‐ MAX Cook R 3 n/a ‐ 2,000 ‐ 2,000 ‐ 4,000<br />
LANDSCAPING PLATFORMS ‐ WES Cook R 3 n/a ‐ 2,500 ‐ 2,500 ‐ 5,000<br />
LANDSCAPING POWELL ATP Cook B 3 n/a 1,000 ‐ ‐ 1,000 ‐ 2,000<br />
LANDSCAPING RUBY NORTH Cook R 3 n/a 2,000 ‐ ‐ 2,000 ‐ 4,000<br />
LANDSCAPING TRANSIT CENTER DISRICT‐WIDE Cook R 3 n/a ‐ 15,000 ‐ 15,000 ‐ 30,000<br />
LANDSCAPING VINTAGE TROLLEY BARN Cook R 3 n/a 1,000 ‐ ‐ 1,000 ‐ 2,000<br />
LANDSCAPING WES OPERATIONS Cook R 2 n/a ‐ ‐ 1,000 ‐ ‐ 1,000<br />
LANDSCAPING Bark dust/irrigation NELA ATP Cook B 2 n/a ‐ ‐ 2,000 ‐ ‐ 2,000<br />
LANDSCAPING improve (permits) MERLO MAINTENANCE Cook B 2 n/a ‐ ‐ 2,000 ‐ ‐ 2,000<br />
LANDSCAPING Systems CENTER MAINT Cook B 2 n/a ‐ ‐ 2,000 ‐ ‐ 2,000<br />
LANDSCAPING Systems MERLO ADMINISTRATION Cook B 2 n/a ‐ ‐ 2,000 ‐ ‐ 2,000<br />
LANDSCAPING Systems POWELL Cook B 2 n/a ‐ ‐ 2,000 ‐ ‐ 2,000<br />
LIGHTING ELMONICA Nordstrom/Ronan R n/a 2 ‐ 4,000 ‐ 4,000 ‐ 8,000<br />
LIGHTING RUBY NORTH Nordstrom/Ronan R n/a 2 ‐ 4,000 ‐ 4,000 ‐ 8,000<br />
LIGHTING RUBY SOUTH Nordstrom/Ronan R n/a 2 ‐ 2,000 ‐ 2,000 ‐ 4,000<br />
LIGHTING RUBY WEST Nordstrom/Ronan R n/a 2 ‐ 1,000 ‐ 1,000 ‐ 2,000<br />
LIGHTING WES OPERATIONS Nordstrom/Ronan R n/a 2 ‐ 2,000 ‐ 2,000 ‐ 4,000<br />
LIGHTING upgrades DISTRICT‐WIDE Nordstrom/Ronan R n/a n/a ‐ 25,000 ‐ 25,000 ‐ 50,000<br />
LIGHTING Central PLATFORMS ‐ MAX Nordstrom/Ronan R n/a 2 ‐ 6,000 ‐ 6,000 ‐ 12,000<br />
LIGHTING Eastside PLATFORMS ‐ MAX Nordstrom/Ronan R n/a 2 11,000 ‐ 11,000 ‐ 11,000 33,000<br />
LIGHTING interior Layover LAYOVER FOSTER Nordstrom/Ronan B n/a 2 500 ‐ 500 ‐ 500 1,500<br />
LIGHTING parking lot ‐ employee, Upgrade MERLO Nordstrom/Ronan B n/a 2 40,000 ‐ ‐ ‐ ‐ 40,000<br />
Note: Items marked with asterisk (*) indicate item is project.<br />
Page ‐ 226
<strong>Capital</strong> <strong>Asset</strong> <strong>Management</strong> & <strong>Investment</strong> Program Appendix Facilities <strong>Management</strong><br />
Facilities <strong>Management</strong> ‐ Site/Property Improvements (continued)<br />
ITEM LOCATION Project mgr Bus/Rail Condition<br />
Useful life<br />
(typ) <strong>FY</strong>14 <strong>FY</strong>15 <strong>FY</strong>16 <strong>FY</strong>17 <strong>FY</strong>18<br />
Total<br />
<strong>FY</strong>14‐<strong>FY</strong>18<br />
LIGHTING Parking Lot ‐ N&S PARK & RIDE TUALATIN NORTH/SOUTH Nordstrom/Ronan B n/a 2 $ ‐ $ 4,000 $ ‐ $ 4,000 $ ‐ $ 8,000<br />
LIGHTING Parking Lot/Platform PARK & RIDE MILWAUKIE Nordstrom/Ronan B n/a 2 1,000 ‐ 1,000 ‐ 1,000 3,000<br />
LIGHTING Parking Lot/Platform PARK & RIDE MOHAWK Nordstrom/Ronan B n/a 2 ‐ 2,000 ‐ 2,000 ‐ 4,000<br />
LIGHTING Parking Lot/Platform PARK & RIDE PROGRESS Nordstrom/Ronan B n/a 2 ‐ 2,000 ‐ 2,000 ‐ 4,000<br />
LIGHTING Parking Lot/Platform PARK & RIDE TIGARD Nordstrom/Ronan B n/a 2 2,000 ‐ 2,000 ‐ 2,000 6,000<br />
LIGHTING Parking Lot/Platform TERMINAL FOREST GROVE Nordstrom/Ronan B n/a 2 2,000 ‐ 2,000 ‐ 2,000 6,000<br />
LIGHTING Parking Lot/Platform TERMINUS NORTH MALL Nordstrom/Ronan B n/a 2 ‐ 1,000 ‐ 1,000 ‐ 2,000<br />
LIGHTING Parking Lot/Platform TRANSIT CENTER BARBUR Nordstrom/Ronan B n/a 2 ‐ 2,000 ‐ 2,000 ‐ 4,000<br />
LIGHTING Parking Lot/Platform TRANSIT CENTER BEAVERTON Nordstrom/Ronan B n/a 2 2,000 ‐ 2,000 ‐ 2,000 6,000<br />
LIGHTING Parking Lot/Platform TRANSIT CENTER CLACKAMAS TWN CNTR Nordstrom/Ronan B n/a 2 ‐ 2,000 ‐ 2,000 ‐ 4,000<br />
LIGHTING Parking Lot/Platform TRANSIT CENTER OREGON CITY Nordstrom/Ronan B n/a 2 ‐ 2,500 ‐ 2,500 ‐ 5,000<br />
LIGHTING Parking Lot/Platform TRANSIT CENTER ROSE QUARTER Nordstrom/Ronan B n/a 2 ‐ 1,000 ‐ 1,000 ‐ 2,000<br />
LIGHTING Parking Lot/Platform TRANSIT CENTER TIGARD Nordstrom/Ronan B n/a 2 2,000 ‐ 2,000 ‐ 2,000 6,000<br />
LIGHTING System wide relamp PARK & RIDE DISRICT‐WIDE Nordstrom/Ronan R n/a 2 ‐ 10,000 ‐ 10,000 ‐ 20,000<br />
LIGHTING System wide relamp‐STC, Parkrose, Gateway TRANSIT CENTER DISRICT‐WIDE Nordstrom/Ronan R n/a 2 ‐ 25,000 ‐ 25,000 ‐ 50,000<br />
LIGHTING Tualatin, Tigard, Wilsonville PLATFORMS ‐ WES Nordstrom/Ronan R n/a 2 ‐ 3,000 ‐ 3,000 ‐ 6,000<br />
LIGHTING Westside PLATFORMS ‐ MAX Nordstrom/Ronan R n/a 2 ‐ 16,000 ‐ 16,000 ‐ 32,000<br />
PAVEMENT ASPHALT sealcoat CENTER ADMINISTRATION front Nordstrom/Ronan B n/a 4 ‐ ‐ 2,058 ‐ ‐ 2,058<br />
PAVEMENT ASPHALT sealcoat ELMONICA Nordstrom/Ronan R n/a 4 ‐ 12,418 ‐ ‐ ‐ 12,418<br />
PAVEMENT ASPHALT sealcoat MERLO & MERLO ATP ‐ all Nordstrom/Ronan B n/a 4 ‐ 19,510 ‐ ‐ ‐ 19,510<br />
PAVEMENT ASPHALT sealcoat NELA ATP Nordstrom/Ronan B n/a 4 ‐ ‐ 10,222 ‐ ‐ 10,222<br />
PAVEMENT ASPHALT sealcoat Orenco Pkwy Road (agreement) Nordstrom/Ronan R n/a 4 ‐ ‐ ‐ 2,883 ‐ 2,883<br />
PAVEMENT ASPHALT sealcoat PARK & RIDE Beaverton Creek Nordstrom/Ronan R n/a 4 ‐ ‐ ‐ 20,506 ‐ 20,506<br />
PAVEMENT ASPHALT sealcoat PARK & RIDE BTC parking Nordstrom/Ronan R n/a 4 ‐ ‐ ‐ 2,404 ‐ 2,404<br />
PAVEMENT ASPHALT sealcoat PARK & RIDE Cleaveland Nordstrom/Ronan R n/a 4 17,318 ‐ ‐ ‐ 17,318 34,636<br />
PAVEMENT ASPHALT sealcoat PARK & RIDE Delta Park Nordstrom/Ronan R n/a 4 11,106 ‐ ‐ ‐ 11,106 22,212<br />
PAVEMENT ASPHALT sealcoat PARK & RIDE Fair Complex Nordstrom/Ronan R n/a 4 ‐ ‐ ‐ 21,800 ‐ 21,800<br />
PAVEMENT ASPHALT sealcoat PARK & RIDE Gateway Nordstrom/Ronan R n/a 4 11,673 ‐ ‐ ‐ 11,673 23,346<br />
PAVEMENT ASPHALT sealcoat PARK & RIDE Gresham Cty Hall Nordstrom/Ronan R n/a 4 15,655 ‐ ‐ ‐ 15,655 31,310<br />
PAVEMENT ASPHALT sealcoat PARK & RIDE Hall/Nimbus Nordstrom/Ronan R n/a 4 ‐ ‐ ‐ 4,456 ‐ 4,456<br />
PAVEMENT ASPHALT sealcoat PARK & RIDE Milikan Way Nordstrom/Ronan R n/a 4 ‐ ‐ ‐ 20,231 ‐ 20,231<br />
PAVEMENT ASPHALT sealcoat PARK & RIDE MILWAUKIE Nordstrom/Ronan B n/a 4 ‐ ‐ 16,755 ‐ ‐ 16,755<br />
PAVEMENT ASPHALT sealcoat PARK & RIDE MOHAWK Nordstrom/Ronan B n/a 4 ‐ 10,272 ‐ ‐ ‐ 10,272<br />
PAVEMENT ASPHALT sealcoat PARK & RIDE Orenco Nordstrom/Ronan R n/a 4 ‐ ‐ ‐ 10,802 ‐ 10,802<br />
PAVEMENT ASPHALT sealcoat PARK & RIDE Parkrose Nordstrom/Ronan R n/a 4 12,025 ‐ ‐ ‐ 12,025 24,050<br />
Page ‐ 227
<strong>Capital</strong> <strong>Asset</strong> <strong>Management</strong> & <strong>Investment</strong> Program Appendix Facilities <strong>Management</strong><br />
Facilities <strong>Management</strong> ‐ Site/Property Improvements (continued)<br />
ITEM LOCATION Project mgr Bus/Rail Condition<br />
Useful life<br />
(typ) <strong>FY</strong>14 <strong>FY</strong>15 <strong>FY</strong>16 <strong>FY</strong>17 <strong>FY</strong>18<br />
Total<br />
<strong>FY</strong>14‐<strong>FY</strong>18<br />
PAVEMENT ASPHALT sealcoat PARK & RIDE PROGRESS Nordstrom/Ronan B n/a 4 $ ‐ $ 6,304 $ ‐ $ ‐ $ ‐ $ 6,304<br />
PAVEMENT ASPHALT sealcoat PARK & RIDE Quatama Nordstrom/Ronan R n/a 4 ‐ ‐ ‐ 14,843 ‐ 14,843<br />
PAVEMENT ASPHALT sealcoat PARK & RIDE QUICK DROP Merlo Road Nordstrom/Ronan R n/a 4 ‐ ‐ ‐ 1,218 ‐ 1,218<br />
PAVEMENT ASPHALT sealcoat PARK & RIDE SE 122nd/Burnside Nordstrom/Ronan R n/a 4 18,738 ‐ ‐ ‐ 18,738 37,476<br />
PAVEMENT ASPHALT sealcoat PARK & RIDE SE 124th/Ash Nordstrom/Ronan R n/a 4 18,738 ‐ ‐ ‐ 18,738 37,476<br />
PAVEMENT ASPHALT sealcoat PARK & RIDE SE 181ST Nordstrom/Ronan R n/a 4 9,718 ‐ ‐ ‐ 9,718 19,436<br />
PAVEMENT ASPHALT sealcoat PARK & RIDE SE Fuller Road Nordstrom/Ronan R n/a 4 ‐ ‐ 23,921 ‐ ‐ 23,921<br />
PAVEMENT ASPHALT sealcoat PARK & RIDE SE HOLGATE Nordstrom/Ronan R n/a 4 ‐ ‐ 5,122 ‐ ‐ 5,122<br />
PAVEMENT ASPHALT sealcoat PARK & RIDE SE Main Street Nordstrom/Ronan R n/a 4 ‐ ‐ 16,439 ‐ ‐ 16,439<br />
PAVEMENT ASPHALT sealcoat PARK & RIDE SE Powell Nordstrom/Ronan R n/a 4 ‐ ‐ 15,419 ‐ ‐ 15,419<br />
PAVEMENT ASPHALT sealcoat PARK & RIDE SW 170th/Elmonica Nordstrom/Ronan R n/a 4 ‐ ‐ ‐ ‐ 23,688 23,688<br />
PAVEMENT ASPHALT sealcoat PARK & RIDE TIGARD Nordstrom/Ronan B n/a 4 ‐ 8,777 ‐ ‐ ‐ 8,777<br />
PAVEMENT ASPHALT sealcoat PARK & RIDE TUALATIN NORTH/SOUTH Nordstrom/Ronan B n/a 4 ‐ 19,936 ‐ ‐ ‐ 19,936<br />
PAVEMENT ASPHALT sealcoat PARK & RIDE Tualatin South (WES) Nordstrom/Ronan R n/a 4 ‐ ‐ ‐ 3,000 ‐ 3,000<br />
PAVEMENT ASPHALT sealcoat PARK & RIDE Willow Creek Nordstrom/Ronan R n/a 4 ‐ ‐ 26,990 ‐ ‐ 26,990<br />
PAVEMENT ASPHALT sealcoat POWELL Nordstrom/Ronan B n/a 4 ‐ ‐ 10,000 ‐ ‐ 10,000<br />
PAVEMENT ASPHALT sealcoat RUBY NORTH (main lot) Nordstrom/Ronan R n/a 4 13,327 ‐ ‐ ‐ 13,327 26,654<br />
PAVEMENT ASPHALT sealcoat RUBY SOUTH (employee lot) Nordstrom/Ronan R n/a 4 4,667 ‐ ‐ ‐ 4,667 9,334<br />
PAVEMENT ASPHALT sealcoat RUBY SOUTH parking lot Nordstrom/Ronan R n/a 4 ‐ 4,667 ‐ ‐ ‐ 4,667<br />
PAVEMENT ASPHALT sealcoat RUBY WEST Nordstrom/Ronan R n/a 4 1,404 ‐ ‐ ‐ 1,404 2,808<br />
PAVEMENT ASPHALT sealcoat SIGNAL BUILDING Rose Qtr Nordstrom/Ronan R n/a 4 ‐ ‐ 35 ‐ ‐ 35<br />
PAVEMENT ASPHALT sealcoat SUBSTATION N Church St Nordstrom/Ronan R n/a 4 82 ‐ ‐ ‐ 82 164<br />
PAVEMENT ASPHALT sealcoat SUBSTATION N Graham Street Nordstrom/Ronan R n/a 4 35 ‐ ‐ ‐ 35 70<br />
PAVEMENT ASPHALT sealcoat SUBSTATION NE 122nd Nordstrom/Ronan R n/a 4 35 ‐ ‐ ‐ 35 70<br />
PAVEMENT ASPHALT sealcoat SUBSTATION SW 153RD Nordstrom/Ronan R n/a 4 ‐ ‐ 35 ‐ ‐ 35<br />
PAVEMENT ASPHALT sealcoat SUBSTATION SW Lincoln Nordstrom/Ronan R n/a 4 ‐ ‐ 35 ‐ ‐ 35<br />
PAVEMENT ASPHALT sealcoat SUBSTATION SW Walker Nordstrom/Ronan R n/a 4 ‐ ‐ 35 ‐ ‐ 35<br />
PAVEMENT ASPHALT sealcoat TERMINAL South Nordstrom/Ronan R n/a 4 ‐ ‐ 35 ‐ ‐ 35<br />
PAVEMENT ASPHALT sealcoat TERMINUS NORTH MALL Nordstrom/Ronan B n/a 4 ‐ ‐ 35 ‐ ‐ 35<br />
PAVEMENT ASPHALT sealcoat TRANSIT CENTER BARBUR Nordstrom/Ronan B n/a 4 ‐ 19,282 ‐ ‐ ‐ 19,282<br />
PAVEMENT ASPHALT sealcoat TRANSIT CENTER BEAVERTON (Quick DroNordstrom/Ronan B n/a 4 ‐ 2,219 ‐ ‐ ‐ 2,219<br />
PAVEMENT ASPHALT sealcoat TRANSIT CENTER TIGARD Nordstrom/Ronan B n/a 4 ‐ 6,149 ‐ ‐ ‐ 6,149<br />
PAVEMENT ASPHALT sealcoat TUNNEL ACCESS East Nordstrom/Ronan R n/a 4 ‐ ‐ 2,148 ‐ ‐ 2,148<br />
PAVEMENT ASPHALT sealcoat WES ADMIN/MAINT Nordstrom/Ronan R n/a 4 ‐ ‐ 3,379 ‐ 3,379<br />
PAVEMENT ASPHALT sealcoat WEST VENT parking lot Nordstrom/Ronan R n/a 4 ‐ ‐ 1,798 ‐ 1,798<br />
PAVEMENT GRAVEL SUBSTATION 32ND AVE (Fred Meyer) Nordstrom/Ronan R 2 2 ‐ 200 ‐ 200 ‐ 400<br />
PAVEMENT GRAVEL VINTAGE TROLLEY BARN Nordstrom/Ronan R 2 2 ‐ 3,500 ‐ 3,500 ‐ 7,000<br />
PAVEMENT GRAVEL (Maint employee lot) POWELL Nordstrom/Ronan B 2 2 5,000 ‐ 5,000 ‐ 5,000 15,000<br />
Total Site‐Property Improvements $ 1,518,559 $1,697,061 $2,842,935 $261,222 $183,709 $ 6,503,486<br />
Page ‐ 228
<strong>Capital</strong> <strong>Asset</strong> <strong>Management</strong> & <strong>Investment</strong> Program Appendix Facilities <strong>Management</strong><br />
Facilities <strong>Management</strong> ‐ Other Systems & Equipment<br />
ITEM LOCATION Project mgr Bus/Rail Condition<br />
Useful life<br />
(typ) <strong>FY</strong>14 <strong>FY</strong>15 <strong>FY</strong>16 <strong>FY</strong>17 <strong>FY</strong>18<br />
Total<br />
<strong>FY</strong>14‐<strong>FY</strong>18<br />
EQUIPMENT AmPro Thermal Parts Cleaner CENTER MAINT Papadopoulos B 2 20 $ ‐ $ 16,000 $ ‐ $ ‐ $ ‐ $ 16,000<br />
EQUIPMENT Cyclone Blower CENTER MAINT Papadopoulos B 3 15 ‐ 150,000 150,000 ‐ ‐ 300,000<br />
EQUIPMENT Cyclone Blower POWELL Papadopoulos B 3 15 ‐ 150,000 150,000 ‐ ‐ 300,000<br />
LANDSCAPE ‐ Blower, Shindaiwa EB45 (3) 1 Echo Papadopoulos R 3 7 500 500 500 500 500 2,500<br />
LANDSCAPE ‐ Chain Saw 20", Shindaiwa Papadopoulos R n/a n/a 1,000 ‐ ‐ ‐ ‐ 1,000<br />
LANDSCAPE ‐ Trimmer‐Power, w/extension/hedger head Papadopoulos R n/a n/a 2,000 ‐ ‐ ‐ ‐ 2,000<br />
STORAGE ‐ FM Center shop relocation to Hub IVON FACILITIES SHOP Papadopoulos R n/a 8 ‐ ‐ 10,000 ‐ ‐ 10,000<br />
FUEL NOZZLE ‐ HIGH PRESSURE (2) CENTER MAINT Papadopoulos R n/a 5 4,000 4,000 4,000 4,000 4,000 20,000<br />
FUEL NOZZLE ‐ HIGH PRESSURE (2) CENTER MAINT Papadopoulos R n/a 5 6,000 6,000 6,000 6,000 6,000 30,000<br />
FUEL NOZZLE ‐ HIGH PRESSURE (2) MERLO MAINTENANCE Papadopoulos R n/a 5 4,000 4,000 4,000 4,000 4,000 20,000<br />
FUEL NOZZLE ‐ HIGH PRESSURE (2) MERLO MAINTENANCE Papadopoulos R n/a 5 6,000 6,000 6,000 6,000 6,000 30,000<br />
FUEL NOZZLE ‐ HIGH PRESSURE (2) POWELL MAINTENANCE Papadopoulos R n/a 5 4,000 4,000 4,000 4,000 4,000 20,000<br />
FUEL NOZZLE ‐ HIGH PRESSURE (2) POWELL MAINTENANCE Papadopoulos R n/a 5 6,000 6,000 6,000 6,000 6,000 30,000<br />
BRUSHES CENTER MAINT Papadopoulos B n/a n/a 9,000 9,000 9,000 9,000 9,000 45,000<br />
BRUSHES MERLO MAINTENANCE Papadopoulos B n/a n/a 9,000 9,000 9,000 9,000 9,000 45,000<br />
BRUSHES POWELL MAINTENANCE Papadopoulos B n/a n/a 9,000 9,000 9,000 9,000 9,000 45,000<br />
HOSE REELS ‐ LUBE, (4/YR) BUS GARAGES ‐ ALL Papadopoulos R n/a 8 ‐ 5,000 ‐ ‐ ‐ 5,000<br />
HOSE REELS ‐ LUBE, 4/YR CENTER MAINT Papadopoulos R n/a 8 2,500 2,500 2,500 2,500 2,500 12,500<br />
HOSE REELS ‐ LUBE, 4/YR MERLO MAINTENANCE Papadopoulos R n/a 8 2,500 2,500 2,500 2,500 2,500 12,500<br />
HOSE REELS ‐ LUBE, 4/YR POWELL MAINTENANCE Papadopoulos R n/a 8 2,500 2,500 2,500 2,500 2,500 12,500<br />
METERING GUN ‐ Digital, 160, Replace 10 yr, (Merlo) Papadopoulos R n/a 8 12,500 12,500 12,500 12,500 12,500 62,500<br />
OIL METERING GUN CENTER MAINT Papadopoulos R n/a 8 4,500 4,500 4,500 4,500 4,500 22,500<br />
OIL METERING GUN MERLO MAINTENANCE Papadopoulos R n/a 8 4,500 4,500 4,500 4,500 4,500 22,500<br />
OIL METERING GUN POWELL MAINTENANCE Papadopoulos B n/a 8 4,500 4,500 4,500 4,500 4,500 22,500<br />
PUMP‐ PNUEMATIC LUBE CENTER MAINT Papadopoulos B n/a 8 2,500 2,500 2,500 2,500 2,500 12,500<br />
PUMP‐ PNUEMATIC LUBE MERLO MAINTENANCE Papadopoulos B n/a 8 2,500 2,500 2,500 2,500 2,500 12,500<br />
PUMP‐ PNUEMATIC LUBE POWELL MAINTENANCE Papadopoulos B n/a 8 2,500 2,500 2,500 2,500 2,500 12,500<br />
Total Other Systems and Equipment $ 101,500 $ 419,500 $ 408,500 $ 98,500 $ 98,500 $ 1,126,500<br />
Page ‐ 229
<strong>Capital</strong> <strong>Asset</strong> <strong>Management</strong> & <strong>Investment</strong> Program Appendix Technology Equipment Systems<br />
Server <strong>Capital</strong><br />
ITC Functional Area Category: IT FOUNDATION Qty FISCAL REPLACE- CURRENT CONDITION <strong>FY</strong>14 <strong>FY</strong>15 <strong>FY</strong>16 <strong>FY</strong>17 <strong>FY</strong>18 <strong>FY</strong><br />
ITC Subcategory: Servers YEAR OF ACTION YEAR MENT AGE <strong>2014</strong>-2018<br />
PURCHASE NEEDED NEEDED CYCLE TOTALS<br />
Application/Database Servers<br />
Oracle Database servers<br />
Eos - Primary enterprise database server 1 2008 Replace <strong>2014</strong> 6 5 5 $ 80,000<br />
$ 80,000<br />
6540 Storage for Eos 1 2008 Replace <strong>2014</strong> 6 5 5 40,000 40,000<br />
Eris - Secondary enterprise database server 1 2008 Replace <strong>2014</strong> 6 5 5 80,000 80,000<br />
6540 Storage for Eris 1 2008 Replace <strong>2014</strong> 6 5 5 40,000 40,000<br />
Juno - Oracle Financials database server 1 2012 Replace 2017 5 1 1 $ 7,500<br />
7,500<br />
Janus - Oracle Financials application server 1 2012 Replace 2017 5 1 1 7,500 7,500<br />
Ntap1 - storage for Oracle Financials 1 2011 Replace 2016 5 2 2 $ 165,000<br />
165,000<br />
Console switch - KVM for Sun systems 1 2013 Replace 2018 5 0 1 2,000 2,000<br />
Orthrus - GFI Database Server 1 2012 Replace 2017 5 1 1 8,500 8,500<br />
Oracle Database Servers Total $ 240,000 $ - $ 165,000 $ 23,500 $ 2,000 $ 430,500<br />
Oracle Development servers<br />
Flo/ Jeeves2 - Oracle Financials test database/application s 1 2008 Replace 2013 5 5 5 $ 60,000<br />
$ 60,000<br />
Theia - Oracle test servers 1 2012 Replace 2017 5 1 1 $ 7,500<br />
7,500<br />
Rhea - Oracle test servers 1 2012 Replace 2017 5 1 1 7,500 7,500<br />
Helios- Oracle Financials database Test server 1 2011 Replace 2016 5 2 2 $ 7,000<br />
7,000<br />
Sol - Oracle Financials application Test server 1 2011 Replace 2016 5 2 2 7,000 7,000<br />
Oracle Development Servers Total $ 60,000 $ - $ 14,000 $ 15,000 $ - $ 89,000<br />
SQL and IIS database server<br />
Csapps2- New Claims system 1 2009 Replace <strong>2014</strong> 5 4 4 $ 10,000<br />
$ 10,000<br />
SQL and IIS database Server Total $ - $ 10,000 $ - $ - $ - $ 10,000<br />
ATIS- trip planner<br />
Tpsm1 - ATIS Master server 1 2013 Replace 2018 5 0 1 $ 3,200 $ 3,200<br />
Tpsq0 - ATIS queue server 1 (trip planner for 238-RIDE) 1 2013 Replace 2018 5 0 1 3,200 3,200<br />
Tpsq1 - ATIS queue server 2 (trip planner for 238-RIDE) 1 2013 Replace 2018 5 0 1 3,200 3,200<br />
Gohost3 - ATIS internet trip planner 1 2013 Replace 2018 5 0 1 5,000 5,000<br />
Gohost4 - ATIS internet trip planner 1 2013 Replace 2018 5 0 1 5,000 5,000<br />
ATIS- Trip Planner Total $ - $ - $ - $ - $ 19,600 $ 19,600<br />
Hastus<br />
Hastus1- Scheduling Server 1 2013 Replace 2018 5 0 1 $ 9,000 $ 9,000<br />
Hastus Total $ - $ - $ - $ - $ 9,000 $ 9,000<br />
Tabs +<br />
Nstest3 - 4F2WW41 1 2013 Replace 2018 5 0 1 $ 6,000 $ 6,000<br />
Nsapps - 1CSGMB1 1 2013 Replace 2018 5 0 1 6,000 6,000<br />
Tabs + Total $ - $ - $ - $ - $ 12,000 $ 12,000<br />
Trapeze4 - PASS<br />
Liftdb1 - PASS database server 1 2010 Replace 2015 5 3 3 $ 8,000<br />
$ 8,000<br />
Liftdb1 - storage 1 2010 Replace 2015 5 3 3 5,000 5,000<br />
Liftdb2 - PASS Test database server 1 2010 Replace 2015 5 3 3 8,000 8,000<br />
LIftdb2 - Test Storage 1 2010 Replace 2015 5 3 3 5,000 5,000<br />
Trapeze4 - PASS Total $ - $ 26,000 $ - $ - $ - $ 26,000<br />
Page ‐ 230
<strong>Capital</strong> <strong>Asset</strong> <strong>Management</strong> & <strong>Investment</strong> Program Appendix Technology Equipment Systems<br />
Server <strong>Capital</strong> (continued)<br />
ITC Functional Area Category: IT FOUNDATION Qty FISCAL REPLACE- CURRENT CONDITION <strong>FY</strong>14 <strong>FY</strong>15 <strong>FY</strong>16 <strong>FY</strong>17 <strong>FY</strong>18 <strong>FY</strong><br />
ITC Subcategory: Servers YEAR OF ACTION YEAR MENT AGE <strong>2014</strong>-2018<br />
PURCHASE NEEDED NEEDED CYCLE TOTALS<br />
FARE SYSTEMS<br />
RJVMC01 1 2012 Replace 2017 5 1 1 $ 6,500<br />
$ 6,500<br />
RJVM01 1 2011 Replace 2016 5 2 2 $ 6,500<br />
6,500<br />
RJVM02 1 2011 Replace 2016 5 2 2 6,500 6,500<br />
RJVM03 1 2012 Replace 2017 5 1 1 6,500 6,500<br />
RJVMstore01 1 2012 Replace 2017 5 1 1 12,000 12,000<br />
Test database sirloin.FCN test 1 2009 Replace <strong>2014</strong> 5 4 4 $ 6,500<br />
6,500<br />
Test app server Hostilicius.FCN test 1 2011 Replace 2016 5 2 2 8,250 8,250<br />
FARE SYSTEMS Total $ 6,500 $ - $ 21,250 $ 25,000 $ - $ 52,750<br />
RAIL CONTROL SYSTEM (AIM)<br />
Aimsys1 - CCS Application server (280R) 1 2010 Replace 2016 5 3 3 $ 7,000<br />
$ 7,000<br />
Aimsys2 - CCS Application server (280R) 1 2010 Replace 2016 5 3 3 7,000 7,000<br />
Aimdbs1 - CCS Database server Ruby (Dell server) 1 2010 Replace 2015 5 3 3 $ 8,000<br />
8,000<br />
Aimdbs1 - Attached storage (Ruby) 1 2009 Replace <strong>2014</strong> 5 4 4 $ 5,000<br />
5,000<br />
Aimdbs2 - CCS Database server Center (Dell server) 1 2010 Replace 2015 5 3 3 8,000 8,000<br />
Aimdbs2 - Attached storage (Center street) 1 2009 Replace <strong>2014</strong> 5 4 4 5,000 5,000<br />
Trsys3 - CCS Dev Application server (280R) 1 2010 Replace 2015 5 3 3 7,000 7,000<br />
silence (CCS) 1 2013 Replace 2018 5 0 1 4,500 4,500<br />
RAIL CONTROL SYSTEM (AIM) Total $ 10,000 $ 16,000 $ 21,000 $ - $ 4,500 $ 51,500<br />
Rail Communication Servers<br />
Chief - CCS Domain controller 1 2013 Replace 2018 5 0 1 $ 5,000 $ 5,000<br />
Siegfried - CCS Domain controller 1 2013 Replace 2018 5 0 1 5,000 5,000<br />
control - Communication server 1 2013 Replace 2018 5 0 1 5,000 5,000<br />
kaos - Communication server 1 2013 Replace 2018 5 0 1 5,000 5,000<br />
Rail Communication Servers Total $ - $ - $ - $ - $ 20,000 $ 20,000<br />
Rail Large Panel Overview Servers<br />
Kennedy - Overview Servers 1 2013 Replace 2018 5 0 1 $ 5,000 $ 5,000<br />
Carter - Overview Server 1 2013 Replace 2018 5 0 1 5,000 5,000<br />
Clinton - Overview Server 1 2013 Replace 2018 5 0 1 5,000 5,000<br />
Nixon - Overview Server 1 2013 Replace 2018 5 0 1 5,000 5,000<br />
Reagan - Overview Server 1 2013 Replace 2018 5 0 1 5,000 5,000<br />
Gingrich - Overview Server 1 2013 Replace 2018 5 0 1 5,000 5,000<br />
Rail Large Panel Overview Servers Total $ - $ - $ - $ - $ 30,000 $ 30,000<br />
Rail Terminal Servers<br />
Term Server 32 port - TRTSV1A 1 2013 Replace 2018 5 0 1 $ 4,500 $ 4,500<br />
Term Server 32 port - TRTSV2A 1 2013 Replace 2018 5 0 1 4,500 4,500<br />
Term Server 32 port - TRTSV3A 1 2013 Replace 2018 5 0 1 4,500 4,500<br />
Term Server 32 port - TRTSV1B 1 2013 Replace 2018 5 0 1 4,500 4,500<br />
Term Server 32 port - TRTSV2B 1 2013 Replace 2018 5 0 1 4,500 4,500<br />
Term Server 32 port - TRTSV3B 1 2013 Replace 2018 5 0 1 4,500 4,500<br />
Rail Terminal Servers Total $ - $ - $ - $ - $ 27,000 $ 27,000<br />
Rail Time Servers<br />
TrntpA - Ethernet Time Server 1 2010 Replace 2015 5 3 3 $ 3,500<br />
$ 3,500<br />
TrntpB - Ethernet Time Server 1 2010 Replace 2015 5 3 3 3,500 3,500<br />
Rail Time Servers Total $ - $ 7,000 $ - $ - $ - $ 7,000<br />
Rail Audio / Video<br />
Avocent AutoView 400 -KVM 1 2009 Replace <strong>2014</strong> 5 4 4 $ 2,000<br />
$ 2,000<br />
Video Switch, 16 channel VGA 1 2009 Replace <strong>2014</strong> 5 4 4 5,000 5,000<br />
Rail Audio / Video Total $ 7,000 $ - $ - $ - $ - $ 7,000<br />
CCTV Storage Systesm<br />
Dell MD31xx SAN 120 TB 1 2011 Replace 2016 5 2 2 $ 80,000<br />
$ 80,000<br />
Dell EMC SAN 60 TB 1 2011 Replace 2016 5 2 2 50,000 50,000<br />
Dell SAN 110 TB 1 2011 Replace 2016 5 2 2 50,000 50,000<br />
CCTV Storage Systems Total $ - $ - $ 180,000 $ - $ - $ 180,000<br />
Page ‐ 231
<strong>Capital</strong> <strong>Asset</strong> <strong>Management</strong> & <strong>Investment</strong> Program Appendix Technology Equipment Systems<br />
Server <strong>Capital</strong> (continued)<br />
ITC Functional Area Category: IT FOUNDATION Qty FISCAL REPLACE- CURRENT CONDITION <strong>FY</strong>14 <strong>FY</strong>15 <strong>FY</strong>16 <strong>FY</strong>17 <strong>FY</strong>18 <strong>FY</strong><br />
ITC Subcategory: Servers YEAR OF ACTION YEAR MENT AGE <strong>2014</strong>-2018<br />
PURCHASE NEEDED NEEDED CYCLE TOTALS<br />
CCTV Digital Video Recorders<br />
Nextivams2 1 2012 Replace 2017 5 1 1 $ 5,000<br />
$ 5,000<br />
Digital Video Recorders 1 1 2012 Replace 2017 5 1 1 4,500 4,500<br />
Digital Video Recorders 2 1 2012 Replace 2017 5 1 1 4,500 4,500<br />
Digital Video Recorders 3 1 2012 Replace 2017 5 1 1 4,500 4,500<br />
Digital Video Recorders 4 1 2012 Replace 2017 5 1 1 4,500 4,500<br />
Digital Video Recorders 5 1 2012 Replace 2017 5 1 1 4,500 4,500<br />
Digital Video Recorders 6 1 2012 Replace 2017 5 1 1 4,500 4,500<br />
Digital Video Recorders 7 1 2012 Replace 2017 5 1 1 4,500 4,500<br />
Digital Video Recorders 8 1 2013 Replace 2018 5 0 1 $ 4,500<br />
4,500<br />
Digital Video Recorders 9 1 2013 Replace 2018 5 0 1 4,500 4,500<br />
Digital Video Recorders 10 1 2013 Replace 2018 5 0 1 4,500 4,500<br />
Digital Video Recorders 11 1 2013 Replace 2018 5 0 1 4,500 4,500<br />
Digital Video Recorders 12 1 2013 Replace 2018 5 0 1 4,500 4,500<br />
Digital Video Recorders 13 1 2013 Replace 2018 5 0 1 4,500 4,500<br />
Digital Video Recorders 14 1 2013 Replace 2018 5 0 1 4,500 4,500<br />
Digital Video Recorders 16 1 2011 Replace 2016 5 2 2 $ 3,000<br />
3,000<br />
Digital Video Recorders 17 1 2011 Replace 2016 5 2 2 3,000 3,000<br />
Digital Video Recorders 18 1 2011 Replace 2016 5 2 2 3,000 3,000<br />
Digital Video Recorders 19 1 2011 Replace 2016 5 2 2 3,000 3,000<br />
Digital Video Recorders 20 1 2011 Replace 2016 5 2 2 3,000 3,000<br />
Digital Video Recorders 21 1 2011 Replace 2016 5 2 2 3,000 3,000<br />
Digital Video Recorders 22 1 2011 Replace 2016 5 2 2 3,000 3,000<br />
CCTV Digital Video Recorders Total $ - $ - $ 21,000 $ 36,500 $ 31,500 $ 89,000<br />
ASA SYSTEM - Added to IT Foundation in <strong>FY</strong>06<br />
Helheim - ASA Server (Center gateway) 1 2011 Retire 5 1 Will be retired with CAD/AVL system- have purchased a spare<br />
$<br />
-<br />
Niflheim - ASA Server (Center) 1 2011 Retire 5 1 -<br />
Jotunheim - ASA Server ( Powell) 1 2011 Retire 5 1 -<br />
Nidavellir - ASA Server (Merlo) 1 2011 Retire 5 1 -<br />
ASA SYSTEM Total $ - $ - $ - $ - $ - $<br />
-<br />
IT Foundation Servers<br />
Network Backup<br />
Csnbmaster 1 2013 Replace 2018 5 0 1 $ 9,000 $ 9,000<br />
Csnbmedia01 1 2011 Replace 2016 5 2 2 $ 9,000<br />
9,000<br />
Csnbmedia02 1 2011 Replace 2016 5 2 2 9,000 9,000<br />
Qualstar Tape library for Backups 2 2 2010 Replace 2015 5 3 3 $ 150,000<br />
150,000<br />
CSDD01 -Data Domain storage system ( Center) 1 2010 Replace 2015 5 3 3 180,000 180,000<br />
Csevault 1 2011 Replace 2016 5 2 2 5,000 5,000<br />
RJDD01 -Data Domain storage system ( Ruby) 1 2012 Replace 2017 5 1 1 $ 200,000<br />
200,000<br />
RJNBmedia 1 2012 Replace 2017 5 1 1 6,500 6,500<br />
Network Backup Total $ - $ 330,000 $ 23,000 $ 206,500 $ 9,000 $ 568,500<br />
File Storage<br />
Ntap2- NetAPP File storage 80TB (personal, global, backu 1 2012 Replace 2018 6 1 1 $ 200,000 $ 200,000<br />
File Storage Total $ - $ - $ - $ - $ 200,000 $ 200,000<br />
Page ‐ 232
<strong>Capital</strong> <strong>Asset</strong> <strong>Management</strong> & <strong>Investment</strong> Program Appendix Technology Equipment Systems<br />
Server <strong>Capital</strong> (continued)<br />
ITC Functional Area Category: IT FOUNDATION Qty FISCAL REPLACE- CURRENT CONDITION <strong>FY</strong>14 <strong>FY</strong>15 <strong>FY</strong>16 <strong>FY</strong>17 <strong>FY</strong>18 <strong>FY</strong><br />
ITC Subcategory: Servers YEAR OF ACTION YEAR MENT AGE <strong>2014</strong>-2018<br />
PURCHASE NEEDED NEEDED CYCLE TOTALS<br />
Domain Controllers<br />
CSDC01 - Center street 1 2011 Replace 2016 5 2 2 $ 5,000<br />
$ 5,000<br />
CSDC02 - Center street 1 2010 Replace 2015 5 3 3 $ 5,000<br />
5,000<br />
HADC01 - Harrison 1 2010 Replace 2015 5 3 3 $ 5,000<br />
5,000<br />
RJDC01 - Ruby Junction 1 2010 Replace 2015 5 3 3 5,000 5,000<br />
HSDC01- Holladay Street 1 2010 Replace 2015 5 3 3 5,000 5,000<br />
NSDC01 - Nela 1 2010 Replace 2015 5 3 3 5,000 5,000<br />
Domain Controllers Total $ 5,000 $ 20,000 $ 5,000 $ - $ - $ 30,000<br />
Faxing<br />
BOS - Faxing /network monitoring 1 2012 Replace 2017 5 1 1 $ 6,000<br />
$ 6,000<br />
Athena- Back up to Oracle fax server 1 2013 Replace 2018 5 0 1 $ 5,500<br />
5,500<br />
Faxing Total $ - $ - $ - $ 6,000 $ 5,500 $ 11,500<br />
Security SYSTEM<br />
CSwebsec1 - Websense server for webfilter 1 2009 Replace <strong>2014</strong> 5 4 4 $ 6,500<br />
$ 6,500<br />
Csdss - Websense server for DSS 1 2013 Replace 2018 5 0 1 5,000 5,000<br />
Security System Total $ 6,500 $ - $ - $ - $ 5,000 $ 11,500<br />
Virtual Servers<br />
RJVMsrv01 - server 1 2012 Replace 2017 5 1 1 $ 8,000<br />
$ 8,000<br />
Csvmsrv1 - server 1 2012 Replace 2017 5 1 1 8,000 8,000<br />
Csvmsrv02 - server 1 2012 Replace 2017 5 1 1 8,000 8,000<br />
Csvmsrv03 - server 1 2012 Replace 2017 5 1 1 8,000 8,000<br />
Csvmc01 - server controller 1 2013 Replace 2018 5 0 1 $ 5,500<br />
5,500<br />
Csvmstore01 - San Storage 1 2013 Replace 2018 5 0 1 30,000 30,000<br />
Csvmstore02 - San Storage 1 2013 Replace 2018 5 0 1 30,000 30,000<br />
Csvmstore03 - San Storage 1 2013 Replace 2018 5 0 1 30,000 30,000<br />
Csvmesx01 - servers 1 2013 Replace 2018 5 0 1 20,000 20,000<br />
Csvmesx02 - servers 1 2013 Replace 2018 5 0 1 20,000 20,000<br />
Csvmesx03 - servers 1 2013 Replace 2018 5 0 1 20,000 20,000<br />
Csvmesx04 - servers 1 2013 Replace 2018 5 0 1 20,000 20,000<br />
Nsvmsrv1 - server 1 2013 Replace 2018 5 0 1 25,000 25,000<br />
Nsvmsrv2 - server 1 2013 Replace 2018 5 0 1 20,000 20,000<br />
Nsvmsrv3 - server 1 2012 Replace 2017 5 1 1 8,500 8,500<br />
NSvmstore01 - San Storage 1 2012 Replace 2017 5 1 1 30,000 30,000<br />
Nsvmsrv4 - server 1 2012 Replace 2017 5 1 1 8,500 8,500<br />
Nsvmesx01 - server 1 2012 Replace 2017 5 1 1 8,500 8,500<br />
Virtual Servers Total $ - $ - $ - $ 87,500 $ 220,500 $ 308,000<br />
E-Mail systems<br />
Csmail3 - E-Mail server (rename csxchgw) 1 2009 Replace <strong>2014</strong> 5 4 4 $ 7,000<br />
$ 7,000<br />
Csmail4 - E-Mail server 1 2011 Replace 2016 5 2 2 $ 7,000<br />
7,000<br />
Csmail5 1 2013 Replace 2018 5 0 1 $ 5,000<br />
5,000<br />
Cscas01 1 2012 Replace 2017 5 1 1 $ 5,000<br />
5,000<br />
Cscas02 1 2012 Replace 2017 5 1 1 5,000 5,000<br />
Csxchstore01 1 2013 Replace 2018 5 0 1 10,000 10,000<br />
Csxchstore02 1 2013 Replace 2018 5 0 1 10,000 10,000<br />
E-Mail Systems Total $ 7,000 $ - $ 7,000 $ 10,000 $ 25,000 $ 49,000<br />
Page ‐ 233
<strong>Capital</strong> <strong>Asset</strong> <strong>Management</strong> & <strong>Investment</strong> Program Appendix Technology Equipment Systems<br />
Server <strong>Capital</strong> (continued)<br />
ITC Functional Area Category: IT FOUNDATION Qty FISCAL REPLACE- CURRENT CONDITION <strong>FY</strong>14 <strong>FY</strong>15 <strong>FY</strong>16 <strong>FY</strong>17 <strong>FY</strong>18 <strong>FY</strong><br />
ITC Subcategory: Servers YEAR OF ACTION YEAR MENT AGE <strong>2014</strong>-2018<br />
PURCHASE NEEDED NEEDED CYCLE TOTALS<br />
IT Infrastructure and Monitoring<br />
Csvaronis 1 2012 Replace 2017 5 1 1 $ 8,500<br />
$ 8,500<br />
Orion - Solorwinds 1 2013 Replace 2018 5 0 1 $ 6,500<br />
6,500<br />
Cssql01 - IT SQL DB Server 1 2009 Replace 2016 7 4 4 $ 6,000<br />
6,000<br />
Cssql02 - SQL Server - SolarWinds DB 1 2011 Replace 2016 5 2 2 6,000 6,000<br />
Netcom1 1 2012 Replace 2017 5 1 1 6,000 6,000<br />
Netcom2 1 2013 Replace 2018 5 0 1 6,000 6,000<br />
Netcom3 1 2012 Replace 2017 5 1 1 6,000 6,000<br />
Netcom4 1 2012 Replace 2017 5 1 1 6,000 6,000<br />
Cscm- Site distribution server 1 2013 Replace 2018 5 0 1 6,000 6,000<br />
Inetgw - Internet mail/ftp/pop3 gateway 1 2011 Replace 2017 5 2 2 8,000 8,000<br />
Load balancer #1 1 2011 Replace 2016 5 2 2 6,000 6,000<br />
Load balancer #2 1 2011 Replace 2016 5 2 2 6,000 6,000<br />
share.trimet.org 1 2012 Replace 2017 5 1 1 8,500 8,500<br />
Solari1 - for Signs on the alignment 1 2008 Replace <strong>2014</strong> 5 5 5 $ 7,000<br />
7,000<br />
IT Infrastructure and Monitoring Total $ 7,000 $ - $ 32,000 $ 35,000 $ 18,500 $ 92,500<br />
<strong>TriMet</strong> Web<br />
Web3 - Primary Internet web server 1 2013 Replace 2018 5 0 1 $ 12,000 $ 12,000<br />
Web4 - Secpmdaru Omtermet web server 1 2013 Replace 2018 5 0 1 12,000 12,000<br />
<strong>TriMet</strong> Web Total $ - $ - $ - $ - $ 24,000 $ 24,000<br />
GIS<br />
Maps6 - Internet Map server 1 2011 Replace 2016 5 2 2 $ 6,000<br />
$ 6,000<br />
Maps7 - Internet Map server 1 2011 Replace 2016 5 2 2 6,000 6,000<br />
Maps5 - Internet Map server 1 2013 Replace 2018 5 0 1 $ 10,000<br />
10,000<br />
Maps1 - Internet Map server 1 2013 Replace 2018 5 0 1 10,000 10,000<br />
Maps2 - Internet Map server 1 2013 Replace 2018 5 0 1 10,000 10,000<br />
GIS Total $ - $ - $ 12,000 $ - $ 30,000 $ 42,000<br />
TriNet<br />
Daphnis - Intranet server 1 2012 Replace 2017 5 1 1 $ 7,000<br />
$ 7,000<br />
Ares - intranet test/Dev 1 2013 Replace 2018 5 0 1 $ 7,000<br />
7,000<br />
Pan - Intranet server 1 2009 Replace <strong>2014</strong> 5 4 4 $ 7,000<br />
7,000<br />
TriNet Total $ 7,000 $ - $ - $ 7,000 $ 7,000 $ 21,000<br />
Remote KVM and Power<br />
NSKVM01 - Remote KVM for Nela 1 2012 Replace 2017 5 1 1 $ 2,500<br />
$ 2,500<br />
CSKVM01 - Remote KVM for Center 1 2012 Replace 2017 5 1 1 2,500 2,500<br />
CSKVM02 - Remote KVM for Center 1 2012 Replace 2017 5 1 1 2,500 2,500<br />
HSKVM01 - Remote KVM for Holladay 1 2012 Replace 2017 5 1 1 2,500 2,500<br />
RJKVM01 - Remote KVM for Ruby 1 2012 Replace 2017 5 1 1 2,500 2,500<br />
RJKVM02 - Remote KVM for Ruby 1 2012 Replace 2017 5 1 1 2,500 2,500<br />
Server Tech Failsafe PTXL-HF 16 port Remote Power 1 2012 Replace 2017 5 1 1 3,000 3,000<br />
Server Tech Failsafe PTXL-HF 16 port Remote Power 1 2012 Replace 2017 5 1 1 3,000 3,000<br />
Server Tech Failsafe PTXL-HF 16 port Remote Power 1 2012 Replace 2017 5 1 1 3,000 3,000<br />
Server Tech Failsafe PTXL-HF 16 port Remote Power 1 2012 Replace 2017 5 1 1 3,000 3,000<br />
Server Tech Failsafe PTXL-HF 16 port Remote Power 1 2012 Replace 2017 5 1 1 3,000 3,000<br />
Server Tech Failsafe PTXL-HF 16 port Remote Power 1 2012 Replace 2017 5 1 1 3,000 3,000<br />
Server Tech Failsafe PTXL-HF 16 port Remote Power 1 2012 Replace 2017 5 1 1 3,000 3,000<br />
Server Tech Failsafe PTXL-HF 16 port Remote Power 1 2012 Replace 2017 5 1 1 3,000 3,000<br />
Server Tech Failsafe PTXL-HF 16 port Remote Power 1 2012 Replace 2017 5 1 1 3,000 3,000<br />
Server Tech Failsafe PTXL-HF 16 port Remote Power 1 2012 Replace 2017 5 1 1 3,000 3,000<br />
Server Tech Failsafe PTXL-HF 16 port Remote Power 1 2012 Replace 2017 5 1 1 3,000 3,000<br />
Server Tech Failsafe PTXL-HF 16 port Remote Power 1 2012 Replace 2017 5 1 1 3,000 3,000<br />
Server Tech Failsafe PTXL-HF 16 port Remote Power 1 2012 Replace 2017 5 1 1 3,000 3,000<br />
Remote KVM and Power Total $ - $ - $ - $ 54,000 $ - $ 54,000<br />
Page ‐ 234
<strong>Capital</strong> <strong>Asset</strong> <strong>Management</strong> & <strong>Investment</strong> Program Appendix Technology Equipment Systems<br />
Server <strong>Capital</strong> (continued)<br />
SUMMARY OF SERVERS<br />
<strong>FY</strong>14 <strong>FY</strong>15 <strong>FY</strong>16 <strong>FY</strong>17 <strong>FY</strong>18 <strong>FY</strong><strong>2014</strong>-2018<br />
TOTALS<br />
Oracle Database Servers $ 240,000 $ - $ 165,000 $ 23,500 $ 2,000 $ 430,500<br />
Oracle Development Servers 60,000 - 14,000 15,000 - 89,000<br />
SQL and IIS database server - 10,000 - - - 10,000<br />
ATIS- trip planner - - - - 19,600 19,600<br />
Hastus - - - - 9,000 9,000<br />
Tabs + - - - - 12,000 12,000<br />
Trapeze4 - PASS - 26,000 - - - 26,000<br />
Fare Systems 6,500 - 21,250 25,000 - 52,750<br />
Rail Control System (AIM) 10,000 16,000 21,000 - 4,500 51,500<br />
Rail Communication Servers - - - - 20,000 20,000<br />
Rail Large Panel Overview Servers - - - - 30,000 30,000<br />
Rail Terminal Servers - - - - 27,000 27,000<br />
Rail Time Servers - 7,000 - - - 7,000<br />
Rail Audio / Video 7,000 - - - - 7,000<br />
CCTV Storage Systesm - - 180,000 - - 180,000<br />
CCTV Digital Video Recorders - - 21,000 36,500 31,500 89,000<br />
ASA System - - - - - -<br />
Network Backup - 330,000 23,000 206,500 9,000 568,500<br />
File Storage - - - - 200,000 200,000<br />
Domain Controllers 5,000 20,000 5,000 - - 30,000<br />
Faxing - - - 6,000 5,500 11,500<br />
Security System 6,500 - - - 5,000 11,500<br />
Virtual Servers - - - 87,500 220,500 308,000<br />
E-Mail systems 7,000 - 7,000 10,000 25,000 49,000<br />
IT Infrastructure and Monitoring 7,000 - 32,000 35,000 18,500 92,500<br />
<strong>TriMet</strong> Web - - - - 24,000 24,000<br />
GIS - - 12,000 - 30,000 42,000<br />
TriNet 7,000 - - 7,000 7,000 21,000<br />
Remote KVM and Power - - - 54,000 - 54,000<br />
SERVERS TOTAL $ 356,000 $ 409,000 $ 501,250 $ 506,000 $ 700,100 $ 2,472,350<br />
Page ‐ 235
<strong>Capital</strong> <strong>Asset</strong> <strong>Management</strong> & <strong>Investment</strong> Program Appendix Technology Equipment Systems<br />
Data Communications<br />
ITC Functional Area Category: IT FOUNDATION Qty FISCAL FISCAL REPLACE- CURRENT CONDITION <strong>FY</strong><br />
ITC Subcategory: COMMUNICATIONS SYSTEM YEAR OF ACTION YEAR MENT AGE <strong>FY</strong>14 <strong>FY</strong>15 <strong>FY</strong>16 <strong>FY</strong>17 <strong>FY</strong>18 <strong>2014</strong>-2018<br />
PURCHASE NEEDED NEEDED CYCLE TOTALS<br />
Switches & Routers<br />
102nd Station - Rail Alignment Communications - Cisco IE 3000 switch 1 2010 Replace 2016 5 3 2 $ 6,700<br />
$ 6,700<br />
122nd Station - Rail Alignment Communications - Cisco IE 3000 switch 1 2010 Replace 2016 5 3 2 $ 6,700<br />
$ 6,700<br />
148th Station - Rail Alignment Communications - Cisco IE 3000 switch 1 2010 Replace 2016 5 3 2 $ 6,700<br />
$ 6,700<br />
162nd Station - Rail Alignment Communications - Cisco IE 3000 switch 1 2012 Replace 2018 5 1 1 $ 6,700 $ 6,700<br />
170th Station - Rail Alignment Communications - Cisco IE 3000 switch 1 2012 Replace 2018 5 1 1 $ 6,700 $ 6,700<br />
181st Station - Rail Alignment Communications - Cisco IE 3000 switch 1 2012 Replace 2018 5 1 1 $ 6,700 $ 6,700<br />
188th Station - Rail Alignment Communications - Cisco IE 3000 switch 1 2012 Replace 2018 5 1 1 $ 6,700 $ 6,700<br />
42nd Station - Rail Alignment Communications - Cisco IE 3000 switch 1 2012 Replace 2018 5 1 1 $ 6,700 $ 6,700<br />
60th Station - Rail Alignment Communications - Cisco IE 3000 switch 1 2012 Replace 2018 5 1 1 $ 6,700 $ 6,700<br />
7th Ave, Station - Rail Alignment Communications - Cisco IE 3010-24TC switch 1 2012 Replace 2018 5 1 1 $ 3,700 $ 3,700<br />
82nd Station - Rail Alignment Communications - Cisco IE 3000 switch 1 2012 Replace 2018 5 1 1 $ 6,700 $ 6,700<br />
Albina Station - Rail Alignment Communications - Cisco IE 3000 switch 1 2012 Replace 2018 5 1 1 $ 6,700 $ 6,700<br />
Beaverton Central Station - Rail Alignment Communications - Cisco IE 3000 switch 1 2012 Replace 2018 5 1 1 $ 6,700 $ 6,700<br />
Beaverton Creek Station - Rail Alignment Communications - Cisco IE 3000 switch 1 2011 Replace 2017 5 2 2 $ 6,700<br />
$ 6,700<br />
Beaverton TC - Rail Alignment Communications - Cisco IE 3000 switch 1 2012 Replace 2018 5 1 1 $ 6,700 $ 6,700<br />
Cascades Station - Rail Alignment Communications - Cisco IE 3000 switch 1 2012 Replace 2018 5 1 1 $ 6,700 $ 6,700<br />
Center - 1st fl - Network Distribution - Cisco 4506 switch 1 2011 Replace 2017 5 2 2 $ 33,000<br />
$ 33,000<br />
Center - 2nd fl - Network Distribution - Cisco 4506 switch 1 2011 Replace 2017 5 2 2 $ 33,000<br />
$ 33,000<br />
Center - 3rd fl - Network Distribution - Cisco 4506 switch 1 2011 Replace 2017 5 2 2 $ 33,000<br />
$ 33,000<br />
Center - 4th fl - Network Distribution - Cisco 4506 switch 1 2011 Replace 2017 5 2 2 $ 33,000<br />
$ 33,000<br />
Center - Internal T1s - Cisco 3845 T1 Router 1 2009 Replace 2015 5 4 3 $ 18,000<br />
$ 18,000<br />
Center - Internet Connection - Cisco 4506 switch 1 2013 Replace 2019 5 0 1 $ -<br />
Center - Internet Connection - Cisco ASR 1006 Internet Router/Firewall 1 2009 Replace 2018 8 4 3 $ 102,000 $ 102,000<br />
Center - iSCSI - Cisco 2960 switch 1 2011 Replace 2017 5 2 2 $ 3,000<br />
$ 3,000<br />
Center - iSCSI - Cisco 2960 switch 1 2011 Replace 2017 5 2 2 $ 3,000<br />
$ 3,000<br />
Page ‐ 236
<strong>Capital</strong> <strong>Asset</strong> <strong>Management</strong> & <strong>Investment</strong> Program Appendix Technology Equipment Systems<br />
Data Communications (continued)<br />
ITC Functional Area Category: IT FOUNDATION Qty FISCAL FISCAL REPLACE- CURRENT CONDITION <strong>FY</strong><br />
ITC Subcategory: COMMUNICATIONS SYSTEM YEAR OF ACTION YEAR MENT AGE <strong>FY</strong>14 <strong>FY</strong>15 <strong>FY</strong>16 <strong>FY</strong>17 <strong>FY</strong>18 <strong>2014</strong>-2018<br />
PURCHASE NEEDED NEEDED CYCLE TOTALS<br />
Center - ITS Network - Cisco 3750 L3 Switch 1 2006 Replace 2015 8 7 1 $ 12,000<br />
$ 12,000<br />
Center - Network Core - Cisco 6500 switch 1 2011 Replace 2017 5 2 2 $ 120,000<br />
$ 120,000<br />
Center - Network Core - Cisco 6500 switch 1 2011 Replace 2017 5 2 2 $ 120,000<br />
$ 120,000<br />
Center - Server Farm - Cisco 4507 switch 1 2011 Replace 2017 5 2 2 $ 53,000<br />
$ 53,000<br />
Center - Spare - Cisco 1841 Router 1 2005 Replace 2016 10 8 4 $ 5,000<br />
$ 5,000<br />
Center - Spare - Cisco 1841 Router 1 2005 Replace 2016 10 8 4 $ 5,000<br />
$ 5,000<br />
Center - Spare - Cisco 3560 switch 1 2008 Replace 2017 8 5 3 $ 3,500<br />
$ 3,500<br />
Center - Spare - Cisco 3560 switch 1 2008 Replace 2017 8 5 3 $ 3,500<br />
$ 3,500<br />
Center - Spare - Cisco 3560 switch 1 2008 Replace 2017 8 5 3 $ 3,500<br />
$ 3,500<br />
Center - Spare - Cisco 3560 switch 1 2008 Replace 2017 8 5 3 $ 3,500<br />
$ 3,500<br />
Center - Yard Wireless - Cisco 2960 8-Port Switch 1 2010 Replace 2016 5 3 2 $ 1,300<br />
$ 1,300<br />
Center - Yard Wireless - Cisco 2960 8-Port Switch 1 2010 Replace 2016 5 3 2 $ 1,300<br />
$ 1,300<br />
Center - Yard Wireless - Cisco 2960 8-Port Switch 1 2010 Replace 2016 5 3 2 $ 1,300<br />
$ 1,300<br />
Center - Yard Wireless - Cisco 2960 8-Port Switch 1 2010 Replace 2016 5 3 2 $ 1,300<br />
$ 1,300<br />
Center - Yard Wireless Spare - Cisco 2960 8-Port Switch 1 2010 Replace 2016 5 3 2 $ 1,300<br />
$ 1,300<br />
Center - Spare - Cisco 3560 switch 1 2008 Replace 2017 8 5 3 $ 3,500<br />
$ 3,500<br />
Center Maint. - Fuel System Monitoring - Cisco 2960 switch 1 2011 Replace 2017 5 2 2 $ 3,000<br />
$ 3,000<br />
Center Maint. - Network Distribution - Cisco 3750 L2 Switch 1 2005 Replace <strong>2014</strong> 8 8 5 $ 8,000<br />
$ 8,000<br />
Center Maint. - Network Distribution - Cisco 3750 L2 Switch 1 2005 Replace <strong>2014</strong> 8 8 5 $ 8,000<br />
$ 8,000<br />
Center Maint. - Network Distribution - Cisco 3750 L2 Switch 1 2005 Replace <strong>2014</strong> 8 8 5 $ 8,000<br />
$ 8,000<br />
Civic Drive Station - Rail Alignment Communications - Cisco IE 3000 switch 1 2010 Replace 2016 5 3 2 $ 6,700<br />
$ 6,700<br />
Clackamas Parking Garage - Rail Operations & CCTV - Cisco 3750 L2 Switch 1 2009 Replace 2015 5 4 3 $ 8,000<br />
$ 8,000<br />
Cleveland Station - Rail Alignment Communications - Cisco IE 3000 switch 1 2012 Replace 2018 5 1 1 $ 6,700 $ 6,700<br />
College/ 6th Ave. Station - Rail Alignment Communications - Cisco IE 3000 switch 1 2012 Replace 2018 5 1 1 $ 6,700 $ 6,700<br />
Convention Center Station - Rail Alignment Communications - Cisco IE 3010-24TC s 1 2012 Replace 2018 5 1 1 $ 3,700 $ 3,700<br />
Delta Park Station - Rail Alignment Communications - Cisco IE 3000 switch 1 2012 Replace 2018 5 1 1 $ 6,700 $ 6,700<br />
Distribution Center - Network Distribution - Cisco 3560 switch 1 2006 Replace 2015 8 7 4 $ 3,500<br />
$ 3,500<br />
Division Station - Rail Operations & CCTV - Cisco 3750 L2 Switch 1 2009 Replace 2015 5 4 3 $ 8,000<br />
$ 8,000<br />
East Portal - Rail Alignment Communications - Cisco IE 3000 switch 1 2012 Replace 2018 5 1 1 $ 6,700 $ 6,700<br />
Elmonica - Network Distribution - Cisco 4507 switch 1 2011 Replace 2017 5 2 2 $ 53,000<br />
$ 53,000<br />
Elmonica - Rail Alignment Communications - Cisco IE 3000 switch 1 2012 Replace 2018 5 1 1 $ 6,700 $ 6,700<br />
Elmonica - Transit Tracker - Cisco 1841 Router 1 2005 Retire 2016 10 8 4 $ -<br />
Expo Center Station - Rail Alignment Communications - Cisco IE 3000 switch 1 2012 Replace 2018 5 1 1 $ 6,700 $ 6,700<br />
Fairplex Station - Rail Alignment Communications - Cisco IE 3000 switch 1 2012 Replace 2018 5 1 1 $ 6,700 $ 6,700<br />
Flavel Station - Rail Operations & CCTV - Cisco 3750 L2 Switch 1 2009 Replace 2015 5 4 3 $ 8,000<br />
$ 8,000<br />
Foster Station - Rail Operations & CCTV - Cisco 3750 L2 Switch 1 2009 Replace 2015 5 4 3 $ 8,000<br />
$ 8,000<br />
Fuller Station - Rail Operations & CCTV - Cisco 3750 L2 Switch 1 2009 Replace 2015 5 4 3 $ 8,000<br />
$ 8,000<br />
Gateway TC - CCTV - Cisco 3550 switch 1 2011 Retire 2017 5 2 2 $ -<br />
Gateway Garage - Rail Alignment Communications - Cisco IE 3000 switch 1 2012 Replace 2018 5 1 1 $ 6,700 $ 6,700<br />
Gateway TC - Rail Alignment Communications - Cisco IE 3000 switch 1 2010 Replace 2016 5 3 2 $ 6,700<br />
$ 6,700<br />
Government Center Station - Rail Alignment Communications - Cisco IE 3000 switch 1 2012 Replace 2018 5 1 1 $ 6,700 $ 6,700<br />
Gresham Central Station - Rail Alignment Communications - Cisco IE 3000 switch 1 2012 Replace 2018 5 1 1 $ 6,700 $ 6,700<br />
Gresham City Hall Station (1) - Rail Alignment Communications - Cisco IE 3000 swi 1 2010 Replace 2016 5 3 2 $ 6,700<br />
$ 6,700<br />
Gresham City Hall Station (2) - Rail Alignment Communications - Cisco IE 3000 swi 1 2012 Replace 2018 5 1 1 $ 6,700 $ 6,700<br />
Hawthorn Farm Station - Rail Alignment Communications - Cisco IE 3000 switch 1 2012 Replace 2018 5 1 1 $ 6,700 $ 6,700<br />
Hillsboro Central Station - Rail Alignment Communications - Cisco IE 3000 switch 1 2012 Replace 2018 5 1 1 $ 6,700 $ 6,700<br />
Holladay - Network Core - Cisco 6500 switch 1 2009 Retire 2015 5 4 3 $ -<br />
Center - Spare - Cisco 2960 switch 1 2006 Spare 2018 11 7 3 $ -<br />
Center - Spare - Cisco 3560 switch 1 2006 Spare 2015 8 7 2 $ -<br />
Irving Tower - Rail Operations & CCTV - Cisco 4507 switch 1 2009 Upgrade 2015 5 4 3 $ 36,000<br />
$ 36,000<br />
Jackson/5th Ave. Station - Rail Alignment Communications - Cisco IE 3000 switch 1 2012 Replace 2018 5 1 1 $ 6,700 $ 6,700<br />
Jackson Crew Room - Rail Alignment Communications - Cisco 2960 switch 2 2013 Replace 2019 5 0 1 $ -<br />
Kenton Station - Rail Alignment Communications - Cisco IE 3000 switch 1 2012 Replace 2018 5 1 1 $ 6,700 $ 6,700<br />
Killingsworth Station - Rail Alignment Communications - Cisco IE 3000 switch 1 2012 Replace 2018 5 1 1 $ 6,700 $ 6,700<br />
Lloyd Center Station - Rail Alignment Communications - Cisco IE 3000 switch 1 2012 Replace 2018 5 1 1 $ 6,700 $ 6,700<br />
Lombard Station - Rail Alignment Communications - Cisco IE 3000 switch 1 2012 Replace 2018 5 1 1 $ 6,700 $ 6,700<br />
Main St. Station - Rail Operations & CCTV - Cisco 3750 L2 Switch 1 2009 Replace 2015 5 4 3 $ 8,000<br />
$ 8,000<br />
Merlo - Network Distribution - Cisco 4507 switch 1 2011 Replace 2017 5 2 2 $ 53,000<br />
$ 53,000<br />
Merlo - Yard Wireless - Cisco 2960 8-Port Switch 1 2010 Replace 2016 5 3 2 $ 1,300<br />
$ 1,300<br />
Merlo - Yard Wireless - Cisco 2960 8-Port Switch 1 2010 Replace 2016 5 3 2 $ 1,300<br />
$ 1,300<br />
Page ‐ 237
<strong>Capital</strong> <strong>Asset</strong> <strong>Management</strong> & <strong>Investment</strong> Program Appendix Technology Equipment Systems<br />
Data Communications (continued)<br />
ITC Functional Area Category: IT FOUNDATION Qty FISCAL FISCAL REPLACE- CURRENT CONDITION <strong>FY</strong><br />
ITC Subcategory: COMMUNICATIONS SYSTEM YEAR OF ACTION YEAR MENT AGE <strong>FY</strong>14 <strong>FY</strong>15 <strong>FY</strong>16 <strong>FY</strong>17 <strong>FY</strong>18 <strong>2014</strong>-2018<br />
PURCHASE NEEDED NEEDED CYCLE TOTALS<br />
Merlo - Yard Wireless - Cisco 2960 8-Port Switch 1 2010 Replace 2016 5 3 2 $ 1,300<br />
$ 1,300<br />
Merlo - Yard Wireless - Cisco 2960 8-Port Switch 1 2010 Replace 2016 5 3 2 $ 1,300<br />
$ 1,300<br />
Merlo - Yard Wireless - Cisco 2960 8-Port Switch 1 2010 Replace 2016 5 3 2 $ 1,300<br />
$ 1,300<br />
Merlo ATP - Network Distribution - Cisco 2960 switch 1 2008 Replace <strong>2014</strong> 5 5 3 $ 3,000<br />
$ 3,000<br />
Merlo Formans Office - Network Distribution - Cisco 3560 switch 1 2007 Replace 2016 8 6 4 $ 3,500<br />
$ 3,500<br />
Merlo Fuel/Wash - Network Distribution - Cisco 2960 switch 1 2008 Replace <strong>2014</strong> 5 5 3 $ 3,000<br />
$ 3,000<br />
Merlo Maint. - Network Distribution - Cisco 3750 L2 Switch 1 2003 Replace <strong>2014</strong> 10 10 5 $ 8,000<br />
$ 8,000<br />
Merlo Maint. - Network Distribution - Cisco 3750 L2 Switch 1 2008 Replace <strong>2014</strong> 5 5 3 $ 8,000<br />
$ 8,000<br />
Merlo Station - Rail Alignment Communications - Cisco IE 3000 switch 1 2011 Replace 2017 5 2 2 $ 6,700<br />
$ 6,700<br />
Millikan Way Station - Rail Alignment Communications - Cisco IE 3000 switch 1 2012 Replace 2018 5 1 1 $ 6,700 $ 6,700<br />
Mount Hood Station - Rail Alignment Communications - Cisco IE 3000 switch 1 2012 Replace 2018 5 1 1 $ 6,700 $ 6,700<br />
Nela - Network Core - Cisco 6500 switch 1 2008 Upgrade 2015 6 5 2 $ 33,000<br />
$ 33,000<br />
Old Town Station - Rail Alignment Communications - Cisco IE 3010-16S switch 1 2012 Replace 2018 5 1 1 $ 3,600 $ 3,600<br />
Orenco Station - Rail Alignment Communications - Cisco IE 3000 switch 1 2012 Replace 2018 5 1 1 $ 6,700 $ 6,700<br />
Orenco TPSS - Rail Alignment Communications - Cisco IE 3000 switch 1 2012 Replace 2018 5 1 1 $ 6,700 $ 6,700<br />
Overlook Station - Rail Alignment Communications - Cisco IE 3000 switch 1 2012 Replace 2018 5 1 1 $ 6,700 $ 6,700<br />
Parkrose - Transit Tracker - Cisco 1841 Router 1 2005 Retire 2016 10 8 4 $ -<br />
Parkrose Station - Rail Alignment Communications - Cisco IE 3000 switch 1 2012 Replace 2018 5 1 1 $ 6,700 $ 6,700<br />
PDX Station - Rail Alignment Communications - Cisco IE 3000 switch 1 2012 Replace 2018 5 1 1 $ 6,700 $ 6,700<br />
PGE Park Station - Rail Alignment Communications - Cisco IE 3000 switch 1 2011 Replace 2017 5 2 2 $ 6,700<br />
$ 6,700<br />
Pioneer Courthouse Square - Rail Alignment Communications - Cisco IE 3000 switc 1 2012 Replace 2018 5 1 1 $ 6,700 $ 6,700<br />
Powell - Network Core - Cisco 4507 switch 1 2011 Replace 2017 5 2 2 $ 53,000<br />
$ 53,000<br />
Powell - Yard Wireless - Cisco 2960 8-Port Switch 1 2010 Replace 2016 5 3 2 $ 1,300<br />
$ 1,300<br />
Powell - Yard Wireless - Cisco 2960 8-Port Switch 1 2010 Replace 2016 5 3 2 $ 1,300<br />
$ 1,300<br />
Powell - Yard Wireless - Cisco 2960 8-Port Switch 1 2010 Replace 2016 5 3 2 $ 1,300<br />
$ 1,300<br />
Powell - Yard Wireless - Cisco 2960 8-Port Switch 1 2010 Replace 2016 5 3 2 $ 1,300<br />
$ 1,300<br />
Powell - Yard Wireless - Cisco 2960 8-Port Switch 1 2010 Replace 2016 5 3 2 $ 1,300<br />
$ 1,300<br />
Powell ATP - Network Distribution - Cisco 3560 switch 1 2008 Replace 2017 8 5 3 $ 3,500<br />
$ 3,500<br />
Powell Maint. - Network Distribution - Cisco 3750 L2 Switch 1 2008 Replace <strong>2014</strong> 5 5 3 $ 8,000<br />
$ 8,000<br />
Powell Maint. - Network Distribution - Cisco 3750 L2 Switch 1 2008 Replace <strong>2014</strong> 5 5 3 $ 8,000<br />
$ 8,000<br />
Powell Station - Rail Operations & CCTV - Cisco 3750 L2 Switch 1 2009 Replace 2015 5 4 3 $ 8,000<br />
$ 8,000<br />
Prescott Station - Rail Alignment Communications - Cisco IE 3000 switch 1 2012 Replace 2018 5 1 1 $ 6,700 $ 6,700<br />
PSU Station - Rail Operations & CCTV - Cisco 4507 switch 1 2009 Upgrade 2015 5 4 3 $ 38,000<br />
$ 38,000<br />
Quatama Station - Rail Alignment Communications - Cisco IE 3000 switch 1 2011 Replace 2017 5 2 2 $ 6,700<br />
$ 6,700<br />
Rocky Butte Station - Rail Alignment Communications - Cisco IE 3000 switch 1 2012 Replace 2018 5 1 1 $ 6,700 $ 6,700<br />
Rosa Parks Station - Rail Alignment Communications - Cisco IE 3000 switch 1 2012 Replace 2018 5 1 1 $ 6,700 $ 6,700<br />
Rose Quarter Bus Bldg - Network Distribution - Cisco 2960 switch 1 2010 Replace 2016 5 3 2 $ 3,000<br />
$ 3,000<br />
Rose Quarter Interstate Station - Rail Alignment Communications - Cisco IE 3000 sw 1 2012 Replace 2018 5 1 1 $ 6,700 $ 6,700<br />
Rose Quarter Station - Rail Alignment Communications - Cisco IE 3000 switch 1 2012 Replace 2018 5 1 1 $ 6,700 $ 6,700<br />
Rose Quarter Trolley Barn - Network Distribution - Cisco 2960 switch 1 2010 Replace 2016 5 3 2 $ 3,000<br />
$ 3,000<br />
Ruby - Rail Operations & CCTV - Cisco 3750 L2 Switch 1 2009 Retire 2015 5 4 3 $ -<br />
Ruby Jct. - Spare - Cisco 3845 T1 Router 1 2009 Spare 2015 5 4 3 $ -<br />
Ruby Jct. - Network Core - Cisco 6500 switch 1 2011 Replace 2017 5 2 2 $ 120,000<br />
$ 120,000<br />
Ruby Jct. - Rail Control System - Cisco 4503 switch 1 2008 Replace <strong>2014</strong> 5 5 3 $ 16,000<br />
$ 16,000<br />
Ruby Jct. - Rail Control System - Cisco 4507 Enhanced Series switch 1 2010 Replace 2016 5 3 2 $ 74,000<br />
$ 74,000<br />
Ruby North - CCTV - Cisco 3750 L2 Switch 1 2006 Replace <strong>2014</strong> 7 7 4 $ 4,000<br />
$ 4,000<br />
Ruby North - CCTV - Cisco 3750 L2 Switch 1 2005 Replace <strong>2014</strong> 8 8 1 $ 4,000<br />
$ 4,000<br />
Ruby North - CCTV - Cisco 3750 L2 Switch 1 2005 Replace <strong>2014</strong> 8 8 1 $ 4,000<br />
$ 4,000<br />
Ruby North - CCTV iSCSI - Cisco 2960 switch 1 2008 Replace <strong>2014</strong> 5 5 3 $ 3,000<br />
$ 3,000<br />
Ruby North - CCTV iSCSI - Cisco 2960 switch 1 2008 Replace <strong>2014</strong> 5 5 3 $ 3,000<br />
$ 3,000<br />
Ruby North - Fare Network - Cisco 3560 switch 1 2006 Replace 2015 8 7 2 $ 3,500<br />
$ 3,500<br />
Ruby South - Network Distribution - Cisco 4503 switch 1 2006 Upgrade 2015 8 7 2 $ 9,000<br />
$ 9,000<br />
Ruby West - Network Distribution - Cisco 3560 switch 1 2010 Replace 2017 6 3 2 $ 3,500<br />
$ 3,500<br />
Skidmore Station - Rail Alignment Communications - Cisco IE 3010-16S switch 2 2012 Retire 2018 5 1 1 $ -<br />
Sunset TC Parking Garage - Rail Alignment Communications - Cisco IE 3000 switch 1 2012 Replace 2018 5 1 1 $ 6,700 $ 6,700<br />
Sunset TC Station - Rail Alignment Communications - Cisco IE 3000 switch 1 2012 Replace 2018 5 1 1 $ 6,700 $ 6,700<br />
Transit Mobility Center - Network Distribution - Cisco 3560 switch 1 2013 Replace 2020 6 0 1 $ -<br />
Transit Mobility Center - Network Distribution - Cisco 3560 switch 1 2013 Replace 2020 6 0 1 $ -<br />
Transit Police - Network Distribution - Cisco 4503 switch 1 2009 Upgrade 2015 5 4 3 $ 13,000<br />
$ 13,000<br />
TTO - Network Distribution - Cisco 2960 switch 1 2013 Replace 2019 5 0 1 $ -<br />
Page ‐ 238
<strong>Capital</strong> <strong>Asset</strong> <strong>Management</strong> & <strong>Investment</strong> Program Appendix Technology Equipment Systems<br />
Data Communications (continued)<br />
ITC Functional Area Category: IT FOUNDATION Qty FISCAL FISCAL REPLACE- CURRENT CONDITION <strong>FY</strong><br />
ITC Subcategory: COMMUNICATIONS SYSTEM YEAR OF ACTION YEAR MENT AGE <strong>FY</strong>14 <strong>FY</strong>15 <strong>FY</strong>16 <strong>FY</strong>17 <strong>FY</strong>18 <strong>2014</strong>-2018<br />
PURCHASE NEEDED NEEDED CYCLE TOTALS<br />
TTO - Network Distribution - Cisco 2960 switch 1 2013 Replace 2019 5 0 1 $ -<br />
Center - Spare - Cisco 3750 L3 Switch 1 2005 Replace <strong>2014</strong> 8 8 4 $ 12,000<br />
$ 12,000<br />
6th St. Facilities Maint - Network Distribution - Cisco 3750 L3 Switch 1 2008 Replace <strong>2014</strong> 5 5 3 $ 12,000<br />
$ 12,000<br />
Tuality Station - Rail Alignment Communications - Cisco IE 3000 switch 1 2012 Replace 2018 5 1 1 $ 6,700 $ 6,700<br />
Washington Park (Telco) - Network Distribution - Cisco 2960 switch 1 2009 Replace 2015 5 4 3 $ 3,000<br />
$ 3,000<br />
Washington Park (Control) - Network Distribution - Cisco 3560 switch 1 2008 Replace 2017 8 5 3 $ 3,500<br />
$ 3,500<br />
Washington Park - Rail Alignment Communications - Cisco IE 3000 switch 1 2012 Replace 2018 5 1 1 $ 6,700 $ 6,700<br />
Washington Park - Transit Tracker - Cisco 1841 Router 1 2005 Retire 2016 10 8 4 $ -<br />
Washington St. Station - Rail Alignment Communications - Cisco IE 3000 switch 1 2012 Replace 2018 5 1 1 $ 6,700 $ 6,700<br />
West Portal - Rail Alignment Communications - Cisco IE 3000 switch 1 2012 Replace 2018 5 1 1 $ 6,700 $ 6,700<br />
West Vent - Rail Alignment Communications - Cisco IE 3000 switch 1 2012 Replace 2018 5 1 1 $ 6,700 $ 6,700<br />
Willow Creek Station - Rail Alignment Communications - Cisco IE 3000 switch 1 2011 Replace 2017 5 2 2 $ 6,700<br />
$ 6,700<br />
Wilsonville - Network Distribution - Cisco 2851 Router 1 2009 Replace 2015 5 4 3 $ 1,200<br />
$ 1,200<br />
Wilsonville - Network Distribution - Cisco 3560 switch 1 2008 Replace 2017 8 5 3 $ 3,500<br />
$ 3,500<br />
Switch & Router Memory Upgrades Varies N/A Upgrade <strong>2014</strong> N/A $ 5,000 $ 5,000 $ 5,000 $ 5,000 $ 5,000 $ 25,000<br />
Switch & Router Port Expansion Varies N/A Upgrade <strong>2014</strong> N/A $ 10,000 $ 10,000 $ 10,000 $ 10,000 $ 10,000 $ 50,000<br />
Total Switches & Routers: $ 123,000 $ 146,200 $ 275,200 $ 793,000 $ 456,300 $ 1,793,700<br />
Remote Access<br />
Center - Remote Access - Access solutions 1 2002 Replace <strong>2014</strong> 11 11 5 $ 50,000<br />
$ 50,000<br />
Remote Access Keyfobs Varies Varies Replace <strong>2014</strong> Varies $ 6,000 $ 6,000 $ 6,000 $ 6,000 $ 6,000 $ 30,000<br />
Total Remote Access: $ 56,000 $ 6,000 $ 6,000 $ 6,000 $ 6,000 $ 80,000<br />
Wireless Network<br />
Powell - Fuel House Bridge - Cisco 1200 Access Point 1 2011 Replace 2016 4 2 2 $ 1,000<br />
$ 1,000<br />
Powell - Fuel House Bridge - Cisco 1200 Access Point 1 2011 Replace 2016 4 2 2 $ 1,000<br />
$ 1,000<br />
12th & Washington Station - PCI Wireless Monitoring - Cisco 1131 Access Point 1 2011 Replace 2017 5 2 2 $ 500<br />
$ 500<br />
170th Station - PCI Wireless Monitoring - Cisco 1131 Access Point 1 2011 Replace 2017 5 2 2 $ 500<br />
$ 500<br />
172nd Station - PCI Wireless Monitoring - Cisco 1131 Access Point 1 2011 Replace 2017 5 2 2 $ 500<br />
$ 500<br />
1st&Yamhill Station - PCI Wireless Monitoring - Cisco 1131 Access Point 1 2011 Replace 2017 5 2 2 $ 500<br />
$ 500<br />
3rd & Morrison Station - PCI Wireless Monitoring - Cisco 1131 Access Point 1 2011 Replace 2017 5 2 2 $ 500<br />
$ 500<br />
42nd Station - PCI Wireless Monitoring - Cisco 1131 Access Point 1 2011 Replace 2017 5 2 2 $ 500<br />
$ 500<br />
5th&Couch Station - PCI Wireless Monitoring - Cisco 1131 Access Point 1 2011 Replace 2017 5 2 2 $ 500<br />
$ 500<br />
5th&Glisan Station - PCI Wireless Monitoring - Cisco 1131 Access Point 1 2011 Replace 2017 5 2 2 $ 500<br />
$ 500<br />
5th&Jefferson Station - PCI Wireless Monitoring - Cisco 1131 Access Point 1 2011 Replace 2017 5 2 2 $ 500<br />
$ 500<br />
6th&Hoyt Station - PCI Wireless Monitoring - Cisco 1131 Access Point 1 2011 Replace 2017 5 2 2 $ 500<br />
$ 500<br />
6th&Madison Station - PCI Wireless Monitoring - Cisco 1131 Access Point 1 2011 Replace 2017 5 2 2 $ 500<br />
$ 500<br />
6th&Montgomery Station - PCI Wireless Monitoring - Cisco 1131 Access Point 1 2011 Replace 2017 5 2 2 $ 500<br />
$ 500<br />
6th&Pine Station - PCI Wireless Monitoring - Cisco 1131 Access Point 1 2011 Replace 2017 5 2 2 $ 500<br />
$ 500<br />
82nd Station - PCI Wireless Monitoring - Cisco 1131 Access Point 1 2011 Replace 2017 5 2 2 $ 500<br />
$ 500<br />
Beaverton Central Station - PCI Wireless Monitoring - Cisco 1131 Access Point 1 2011 Replace 2017 5 2 2 $ 500<br />
$ 500<br />
Beaverton Creek Station - PCI Wireless Monitoring - Cisco 1131 Access Point 1 2011 Replace 2017 5 2 2 $ 500<br />
$ 500<br />
Civic Drive Station - PCI Wireless Monitoring - Cisco 1131 Access Point 1 2011 Replace 2017 5 2 2 $ 500<br />
$ 500<br />
Clackamas TC Station - PCI Wireless Monitoring - Cisco 1131 Access Point 1 2011 Replace 2017 5 2 2 $ 500<br />
$ 500<br />
Division Station - PCI Wireless Monitoring - Cisco 1131 Access Point 1 2011 Replace 2017 5 2 2 $ 500<br />
$ 500<br />
East Portal Station - PCI Wireless Monitoring - Cisco 1131 Access Point 1 2011 Replace 2017 5 2 2 $ 500<br />
$ 500<br />
Fairplex Station - PCI Wireless Monitoring - Cisco 1131 Access Point 1 2011 Replace 2017 5 2 2 $ 500<br />
$ 500<br />
Flavel Station - PCI Wireless Monitoring - Cisco 1131 Access Point 1 2011 Replace 2017 5 2 2 $ 500<br />
$ 500<br />
Foster Station - PCI Wireless Monitoring - Cisco 1131 Access Point 1 2011 Replace 2017 5 2 2 $ 500<br />
$ 500<br />
Fuller Station - PCI Wireless Monitoring - Cisco 1131 Access Point 1 2011 Replace 2017 5 2 2 $ 500<br />
$ 500<br />
Gateway Station - PCI Wireless Monitoring - Cisco 1131 Access Point 1 2011 Replace 2017 5 2 2 $ 500<br />
$ 500<br />
Goose Hollow Station - PCI Wireless Monitoring - Cisco 1131 Access Point 1 2011 Replace 2017 5 2 2 $ 500<br />
$ 500<br />
Gresham Central Station - PCI Wireless Monitoring - Cisco 1131 Access Point 1 2011 Replace 2017 5 2 2 $ 500<br />
$ 500<br />
Gresham City Hall Station - PCI Wireless Monitoring - Cisco 1131 Access Point 1 2011 Replace 2017 5 2 2 $ 500<br />
$ 500<br />
Hawthorn Farm Station - PCI Wireless Monitoring - Cisco 1131 Access Point 1 2011 Replace 2017 5 2 2 $ 500<br />
$ 500<br />
Hillsboro TC Station - PCI Wireless Monitoring - Cisco 1131 Access Point 1 2011 Replace 2017 5 2 2 $ 500<br />
$ 500<br />
Irving Tower Station - PCI Wireless Monitoring - Cisco 1131 Access Point 1 2011 Replace 2017 5 2 2 $ 500<br />
$ 500<br />
Jackson Campus Station - PCI Wireless Monitoring - Cisco 1131 Access Point 1 2011 Replace 2017 5 2 2 $ 500<br />
$ 500<br />
Jeld-Wen Field Station - PCI Wireless Monitoring - Cisco 1131 Access Point 1 2011 Replace 2017 5 2 2 $ 500<br />
$ 500<br />
Kings Hill Station - PCI Wireless Monitoring - Cisco 1131 Access Point 1 2011 Replace 2017 5 2 2 $ 500<br />
$ 500<br />
Page ‐ 239
<strong>Capital</strong> <strong>Asset</strong> <strong>Management</strong> & <strong>Investment</strong> Program Appendix Technology Equipment Systems<br />
Data Communications (continued)<br />
ITC Functional Area Category: IT FOUNDATION Qty FISCAL FISCAL REPLACE- CURRENT CONDITION <strong>FY</strong><br />
ITC Subcategory: COMMUNICATIONS SYSTEM YEAR OF ACTION YEAR MENT AGE <strong>FY</strong>14 <strong>FY</strong>15 <strong>FY</strong>16 <strong>FY</strong>17 <strong>FY</strong>18 <strong>2014</strong>-2018<br />
PURCHASE NEEDED NEEDED CYCLE TOTALS<br />
Library SW 9th Station - PCI Wireless Monitoring - Cisco 1131 Access Point 1 2011 Replace 2017 5 2 2 $ 500<br />
$ 500<br />
Main Station - PCI Wireless Monitoring - Cisco 1131 Access Point 1 2011 Replace 2017 5 2 2 $ 500<br />
$ 500<br />
Mall-SW4th Station - PCI Wireless Monitoring - Cisco 1131 Access Point 1 2011 Replace 2017 5 2 2 $ 500<br />
$ 500<br />
Mall-SW5th Station - PCI Wireless Monitoring - Cisco 1131 Access Point 1 2011 Replace 2017 5 2 2 $ 500<br />
$ 500<br />
Merlo Station Station - PCI Wireless Monitoring - Cisco 1131 Access Point 1 2011 Replace 2017 5 2 2 $ 500<br />
$ 500<br />
Milikan Way Station - PCI Wireless Monitoring - Cisco 1131 Access Point 1 2011 Replace 2017 5 2 2 $ 500<br />
$ 500<br />
Mt Hood Station - PCI Wireless Monitoring - Cisco 1131 Access Point 1 2011 Replace 2017 5 2 2 $ 500<br />
$ 500<br />
PGE Station - PCI Wireless Monitoring - Cisco 1131 Access Point 1 2011 Replace 2017 5 2 2 $ 500<br />
$ 500<br />
Pioneer Square North Station - PCI Wireless Monitoring - Cisco 1131 Access Point 1 2011 Replace 2017 5 2 2 $ 500<br />
$ 500<br />
Pioneer Square South Station - PCI Wireless Monitoring - Cisco 1131 Access Poin 1 2011 Replace 2017 5 2 2 $ 500<br />
$ 500<br />
PioneerCourthouse Station - PCI Wireless Monitoring - Cisco 1131 Access Point 1 2011 Replace 2017 5 2 2 $ 500<br />
$ 500<br />
PioneerPlace Station - PCI Wireless Monitoring - Cisco 1131 Access Point 1 2011 Replace 2017 5 2 2 $ 500<br />
$ 500<br />
Powell Station - PCI Wireless Monitoring - Cisco 1131 Access Point 1 2011 Replace 2017 5 2 2 $ 500<br />
$ 500<br />
PSU Comm Rm Station - PCI Wireless Monitoring - Cisco 1131 Access Point 1 2011 Replace 2017 5 2 2 $ 500<br />
$ 500<br />
Quatama Station - PCI Wireless Monitoring - Cisco 1131 Access Point 1 2011 Replace 2017 5 2 2 $ 500<br />
$ 500<br />
Rockwood Station - PCI Wireless Monitoring - Cisco 1131 Access Point 1 2011 Replace 2017 5 2 2 $ 500<br />
$ 500<br />
Skidmore 2 Station - PCI Wireless Monitoring - Cisco 1131 Access Point 1 2011 Replace 2017 5 2 2 $ 500<br />
$ 500<br />
Skidmore Station - PCI Wireless Monitoring - Cisco 1131 Access Point 1 2011 Replace 2017 5 2 2 $ 500<br />
$ 500<br />
TTO - PCI Wireless Monitoring - Cisco 1131 Access Point 1 2011 Replace 2017 5 2 2 $ 500<br />
$ 500<br />
Tuality Station - PCI Wireless Monitoring - Cisco 1131 Access Point 1 2011 Replace 2017 5 2 2 $ 500<br />
$ 500<br />
Washington Park CM Station - PCI Wireless Monitoring - Cisco 1131 Access Point 1 2011 Replace 2017 5 2 2 $ 500<br />
$ 500<br />
Washington Park Station - PCI Wireless Monitoring - Cisco 1131 Access Point 1 2011 Replace 2017 5 2 2 $ 500<br />
$ 500<br />
Washington Park2 Station - PCI Wireless Monitoring - Cisco 1131 Access Point 1 2011 Replace 2017 5 2 2 $ 500<br />
$ 500<br />
Willow Creek Station - PCI Wireless Monitoring - Cisco 1131 Access Point 1 2011 Replace 2017 5 2 2 $ 500<br />
$ 500<br />
102nd Station - PCI Wireless Stationing - Cisco 1131 Access Point 1 2011 Replace 2017 5 2 2 $ 500<br />
$ 500<br />
122nd Station - PCI Wireless Stationing - Cisco 1131 Access Point 1 2011 Replace 2017 5 2 2 $ 500<br />
$ 500<br />
148th Station - PCI Wireless Stationing - Cisco 1131 Access Point 1 2011 Replace 2017 5 2 2 $ 500<br />
$ 500<br />
162nd Station - PCI Wireless Stationing - Cisco 1131 Access Point 1 2011 Replace 2017 5 2 2 $ 500<br />
$ 500<br />
181st Station - PCI Wireless Stationing - Cisco 1131 Access Point 1 2011 Replace 2017 5 2 2 $ 500<br />
$ 500<br />
197th Station - PCI Wireless Stationing - Cisco 1131 Access Point 1 2011 Replace 2017 5 2 2 $ 500<br />
$ 500<br />
5th&Oak Station - PCI Wireless Stationing - Cisco 1131 Access Point 1 2011 Replace 2017 5 2 2 $ 500<br />
$ 500<br />
60th Station - PCI Wireless Stationing - Cisco 1131 Access Point 1 2011 Replace 2017 5 2 2 $ 500<br />
$ 500<br />
6th&Davis Station - PCI Wireless Stationing - Cisco 1131 Access Point 1 2011 Replace 2017 5 2 2 $ 500<br />
$ 500<br />
Cascade Station - PCI Wireless Stationing - Cisco 1131 Access Point 1 2011 Replace 2017 5 2 2 $ 500<br />
$ 500<br />
Convention CTR Station - PCI Wireless Stationing - Cisco 1131 Access Point 1 2011 Replace 2017 5 2 2 $ 500<br />
$ 500<br />
Galleria SW 10th Station - PCI Wireless Stationing - Cisco 1131 Access Point 1 2011 Replace 2017 5 2 2 $ 500<br />
$ 500<br />
Center - Spare - Cisco 1200 Access Point 1 2009 Replace <strong>2014</strong> 4 4 3 $ 1,000<br />
$ 1,000<br />
Center - Spare - Cisco 1242 Access Point 1 2010 Replace 2015 4 3 2 $ 1,000<br />
$ 1,000<br />
Center - Spare - Cisco 1242 Access Point 1 2010 Replace 2015 4 3 2 $ 1,000<br />
$ 1,000<br />
Center - Spare - Cisco 1242 Access Point 1 2010 Replace 2015 4 3 2 $ 1,000<br />
$ 1,000<br />
Center - Spare - Cisco 1242 Access Point 1 2010 Replace 2015 4 3 2 $ 1,000<br />
$ 1,000<br />
Center - Spare - Cisco 1242 Access Point 1 2010 Replace 2015 4 3 2 $ 1,000<br />
$ 1,000<br />
Center - Spare - Cisco 1242 Access Point 1 2010 Replace 2015 4 3 2 $ 1,000<br />
$ 1,000<br />
Center - Spare - Cisco 1242 Access Point 1 2010 Replace 2015 4 3 2 $ 1,000<br />
$ 1,000<br />
Center - Spare - Cisco 1252 802.11n Access Point 1 2010 Replace 2016 5 3 2 $ 1,000<br />
$ 1,000<br />
Albina Station - WiFi Services - Cisco 1200 Access Point 1 2013 Replace 2018 4 0 1 $ 1,000 $ 1,000<br />
Beaverton Station - WiFi Services - Cisco 1200 Access Point 1 2009 Replace <strong>2014</strong> 4 4 3 $ 1,000<br />
$ 1,000<br />
Center - WiFi Services - Wireless LAN Controller 1 2010 Replace 2016 5 3 2 $ 37,000<br />
$ 37,000<br />
Center - WiFi Services - Wireless LAN Controller 1 2010 Replace 2016 5 3 2 $ 37,000<br />
$ 37,000<br />
Center 2nd Fl. East - WiFi Services - Cisco 1200 Access Point 1 2009 Replace <strong>2014</strong> 4 4 1 $ 1,000<br />
$ 1,000<br />
Center 2nd Fl. West - WiFi Services - Cisco 1200 Access Point 1 2009 Replace <strong>2014</strong> 4 4 1 $ 1,000<br />
$ 1,000<br />
Center 3rd Fl. East - WiFi Services - Cisco 1200 Access Point 1 2009 Replace <strong>2014</strong> 4 4 1 $ 1,000<br />
$ 1,000<br />
Center 3rd Fl. West - WiFi Services - Cisco 1200 Access Point 1 2009 Replace <strong>2014</strong> 4 4 1 $ 1,000<br />
$ 1,000<br />
Center 4th Fl. East - WiFi Services - Cisco 1200 Access Point 1 2009 Replace <strong>2014</strong> 4 4 1 $ 1,000<br />
$ 1,000<br />
Center 4th Fl. West - WiFi Services - Cisco 1200 Access Point 1 2009 Replace <strong>2014</strong> 4 4 1 $ 1,000<br />
$ 1,000<br />
Center Conf Rm D - WiFi Services - Cisco 1200 Access Point 1 2009 Replace <strong>2014</strong> 4 4 1 $ 1,000<br />
$ 1,000<br />
Cleveland Station - WiFi Services - Cisco 1200 Access Point 1 2009 Replace <strong>2014</strong> 4 4 1 $ 1,000<br />
$ 1,000<br />
cs-admin roof South - WiFi Services - Cisco 1200 Access Point 1 2009 Replace <strong>2014</strong> 4 4 1 $ 1,000<br />
$ 1,000<br />
cs-garage-1st-1 - WiFi Services - Cisco 1200 Access Point 1 2009 Replace <strong>2014</strong> 4 4 1 $ 1,000<br />
$ 1,000<br />
cs-garage-1st-10 - WiFi Services - Cisco 1200 Access Point 1 2009 Replace <strong>2014</strong> 4 4 1 $ 1,000<br />
$ 1,000<br />
Page ‐ 240
<strong>Capital</strong> <strong>Asset</strong> <strong>Management</strong> & <strong>Investment</strong> Program Appendix Technology Equipment Systems<br />
Data Communications (continued)<br />
ITC Functional Area Category: IT FOUNDATION Qty FISCAL FISCAL REPLACE- CURRENT CONDITION <strong>FY</strong><br />
ITC Subcategory: COMMUNICATIONS SYSTEM YEAR OF ACTION YEAR MENT AGE <strong>FY</strong>14 <strong>FY</strong>15 <strong>FY</strong>16 <strong>FY</strong>17 <strong>FY</strong>18 <strong>2014</strong>-2018<br />
PURCHASE NEEDED NEEDED CYCLE TOTALS<br />
cs-garage-1st-11 - WiFi Services - Cisco 1200 Access Point 1 2009 Replace <strong>2014</strong> 4 4 1 $ 1,000<br />
$ 1,000<br />
cs-garage-1st-12 - WiFi Services - Cisco 1200 Access Point 1 2009 Replace <strong>2014</strong> 4 4 1 $ 1,000<br />
$ 1,000<br />
cs-garage-1st-2 - WiFi Services - Cisco 1200 Access Point 1 2009 Replace <strong>2014</strong> 4 4 1 $ 1,000<br />
$ 1,000<br />
cs-garage-1st-3 - WiFi Services - Cisco 1200 Access Point 1 2009 Replace <strong>2014</strong> 4 4 1 $ 1,000<br />
$ 1,000<br />
cs-garage-1st-4 - WiFi Services - Cisco 1200 Access Point 1 2009 Replace <strong>2014</strong> 4 4 1 $ 1,000<br />
$ 1,000<br />
cs-garage-1st-5 - WiFi Services - Cisco 1200 Access Point 1 2009 Replace <strong>2014</strong> 4 4 1 $ 1,000<br />
$ 1,000<br />
cs-garage-1st-6 - WiFi Services - Cisco 1200 Access Point 1 2009 Replace <strong>2014</strong> 4 4 1 $ 1,000<br />
$ 1,000<br />
cs-garage-1st-7 - WiFi Services - Cisco 1200 Access Point 1 2009 Replace <strong>2014</strong> 4 4 1 $ 1,000<br />
$ 1,000<br />
cs-garage-1st-8 - WiFi Services - Cisco 1200 Access Point 1 2009 Replace <strong>2014</strong> 4 4 1 $ 1,000<br />
$ 1,000<br />
cs-garage-1st-9 - WiFi Services - Cisco 1200 Access Point 1 2009 Replace <strong>2014</strong> 4 4 1 $ 1,000<br />
$ 1,000<br />
cs-garage-2nd-1 - WiFi Services - Cisco 1200 Access Point 1 2009 Replace <strong>2014</strong> 4 4 1 $ 1,000<br />
$ 1,000<br />
cs-garage-2nd-2 - WiFi Services - Cisco 1200 Access Point 1 2009 Replace <strong>2014</strong> 4 4 1 $ 1,000<br />
$ 1,000<br />
cs-garage-2nd-3 - WiFi Services - Cisco 1200 Access Point 1 2009 Replace <strong>2014</strong> 4 4 1 $ 1,000<br />
$ 1,000<br />
cs-garage-2nd-break-rm - WiFi Services - Cisco 1200 Access Point 1 2009 Replace <strong>2014</strong> 4 4 1 $ 1,000<br />
$ 1,000<br />
cs-garage-yard-1 - WiFi Services - Cisco 1200 Access Point 1 2009 Replace <strong>2014</strong> 4 4 1 $ 1,000<br />
$ 1,000<br />
cs-garage-yard-2 - WiFi Services - Cisco 1200 Access Point 1 2009 Replace <strong>2014</strong> 4 4 1 $ 1,000<br />
$ 1,000<br />
cs-garage-yard-3 - WiFi Services - Cisco 1200 Access Point 1 2009 Replace <strong>2014</strong> 4 4 1 $ 1,000<br />
$ 1,000<br />
cs-garage-yard-4 - WiFi Services - Cisco 1200 Access Point 1 2009 Replace <strong>2014</strong> 4 4 1 $ 1,000<br />
$ 1,000<br />
cs-guard-shack-1 - WiFi Services - Cisco 1200 Access Point 1 2009 Replace <strong>2014</strong> 4 4 1 $ 1,000<br />
$ 1,000<br />
cs-Money room 1 - WiFi Services - Cisco 1200 Access Point 1 2009 Replace <strong>2014</strong> 4 4 1 $ 1,000<br />
$ 1,000<br />
cs-server-rm-1 - WiFi Services - Cisco 1200 Access Point 1 2009 Replace <strong>2014</strong> 4 4 1 $ 1,000<br />
$ 1,000<br />
ctr-net-comm-1 - WiFi Services - Cisco 1200 Access Point 1 2012 Replace 2017 4 1 1 $ 1,000<br />
$ 1,000<br />
Delta Park Station - WiFi Services - Cisco 1200 Access Point 1 2009 Replace <strong>2014</strong> 4 4 1 $ 1,000<br />
$ 1,000<br />
Elmo_1st_1 - WiFi Services - Cisco 1200 Access Point 1 2009 Replace <strong>2014</strong> 4 4 1 $ 1,000<br />
$ 1,000<br />
Elmo_1st_2 - WiFi Services - Cisco 1200 Access Point 1 2009 Replace <strong>2014</strong> 4 4 1 $ 1,000<br />
$ 1,000<br />
Elmo_1st_3 - WiFi Services - Cisco 1200 Access Point 1 2009 Replace <strong>2014</strong> 4 4 1 $ 1,000<br />
$ 1,000<br />
Elmo_1st_4 - WiFi Services - Cisco 1200 Access Point 1 2009 Replace <strong>2014</strong> 4 4 1 $ 1,000<br />
$ 1,000<br />
Elmo_1st_5 - WiFi Services - Cisco 1200 Access Point 1 2009 Replace <strong>2014</strong> 4 4 1 $ 1,000<br />
$ 1,000<br />
Elmo_1st_6 - WiFi Services - Cisco 1200 Access Point 1 2009 Replace <strong>2014</strong> 4 4 1 $ 1,000<br />
$ 1,000<br />
Elmo_1st_7 - WiFi Services - Cisco 1200 Access Point 1 2009 Replace <strong>2014</strong> 4 4 1 $ 1,000<br />
$ 1,000<br />
Elmo_1st_8 - WiFi Services - Cisco 1200 Access Point 1 2009 Replace <strong>2014</strong> 4 4 1 $ 1,000<br />
$ 1,000<br />
Elmo_2nd_1 - WiFi Services - Cisco 1200 Access Point 1 2009 Replace <strong>2014</strong> 4 4 1 $ 1,000<br />
$ 1,000<br />
Elmo_2nd_2 - WiFi Services - Cisco 1200 Access Point 1 2009 Replace <strong>2014</strong> 4 4 1 $ 1,000<br />
$ 1,000<br />
Elmo_2nd_3 - WiFi Services - Cisco 1200 Access Point 1 2009 Replace <strong>2014</strong> 4 4 1 $ 1,000<br />
$ 1,000<br />
Expo Ctr. Station - WiFi Services - Cisco 1200 Access Point 1 2009 Replace <strong>2014</strong> 4 4 1 $ 1,000<br />
$ 1,000<br />
Hatfield Station - WiFi Services - Cisco 1200 Access Point 1 2009 Replace <strong>2014</strong> 4 4 1 $ 1,000<br />
$ 1,000<br />
holgate-2nd-1 - WiFi Services - Cisco 1200 Access Point 1 2009 Replace <strong>2014</strong> 4 4 1 $ 1,000<br />
$ 1,000<br />
Holladay St. - WiFi Services - Cisco 1200 Access Point 1 2009 Replace <strong>2014</strong> 4 4 1 $ 1,000<br />
$ 1,000<br />
Kaiser - WiFi Services - Cisco 1200 Access Point 1 2009 Replace <strong>2014</strong> 4 4 1 $ 1,000<br />
$ 1,000<br />
Kaiser - WiFi Services - Cisco 1200 Access Point 1 2009 Replace <strong>2014</strong> 4 4 1 $ 1,000<br />
$ 1,000<br />
Kenton Station - WiFi Services - Cisco 1200 Access Point 1 2009 Replace <strong>2014</strong> 4 4 1 $ 1,000<br />
$ 1,000<br />
Killingsworth Station - WiFi Services - Cisco 1200 Access Point 1 2009 Replace <strong>2014</strong> 4 4 1 $ 1,000<br />
$ 1,000<br />
Lloyd Center Station - WiFi Services - Cisco 1200 Access Point 1 2009 Replace <strong>2014</strong> 4 4 1 $ 1,000<br />
$ 1,000<br />
Lombard Station - WiFi Services - Cisco 1200 Access Point 1 2009 Replace <strong>2014</strong> 4 4 1 $ 1,000<br />
$ 1,000<br />
Merlo Fuel Wash - WiFi Services - Cisco 1242 Access Point 1 2010 Replace 2015 4 3 2 $ 1,000<br />
$ 1,000<br />
Merlo Fuel Wash - WiFi Services - Cisco 1242 Access Point 1 2010 Replace 2015 4 3 2 $ 1,000<br />
$ 1,000<br />
Merlo Lift - WiFi Services - Cisco 1242 Access Point 1 2010 Replace 2015 4 3 2 $ 1,000<br />
$ 1,000<br />
Merlo Lift - WiFi Services - Cisco 1242 Access Point 1 2010 Replace 2015 4 3 2 $ 1,000<br />
$ 1,000<br />
Merlo Storage Shed - WiFi Services - Cisco 1242 Access Point 1 2010 Replace 2015 4 3 2 $ 1,000<br />
$ 1,000<br />
Merlo_Garage_1st_2 - WiFi Services - Cisco 1200 Access Point 1 2009 Replace <strong>2014</strong> 4 4 1 $ 1,000<br />
$ 1,000<br />
Merlo_Garage_1st_3 - WiFi Services - Cisco 1200 Access Point 1 2009 Replace <strong>2014</strong> 4 4 1 $ 1,000<br />
$ 1,000<br />
Merlo_Garage_1st_4 - WiFi Services - Cisco 1200 Access Point 1 2009 Replace <strong>2014</strong> 4 4 1 $ 1,000<br />
$ 1,000<br />
Merlo_Garage_1st_5 - WiFi Services - Cisco 1200 Access Point 1 2009 Replace <strong>2014</strong> 4 4 1 $ 1,000<br />
$ 1,000<br />
Merlo_Garage_1st_6 - WiFi Services - Cisco 1200 Access Point 1 2009 Replace <strong>2014</strong> 4 4 1 $ 1,000<br />
$ 1,000<br />
Merlo_Garage_1st_7 - WiFi Services - Cisco 1200 Access Point 1 2009 Replace <strong>2014</strong> 4 4 1 $ 1,000<br />
$ 1,000<br />
Merlo_Garage_2nd_1 - WiFi Services - Cisco 1200 Access Point 1 2009 Replace <strong>2014</strong> 4 4 1 $ 1,000<br />
$ 1,000<br />
Merlo_Garage_2nd_2 - WiFi Services - Cisco 1200 Access Point 1 2009 Replace <strong>2014</strong> 4 4 1 $ 1,000<br />
$ 1,000<br />
Merlo_Garage_2nd_3 - WiFi Services - Cisco 1200 Access Point 1 2009 Replace <strong>2014</strong> 4 4 1 $ 1,000<br />
$ 1,000<br />
Merlo_Garage_2nd_4 - WiFi Services - Cisco 1200 Access Point 1 2009 Replace <strong>2014</strong> 4 4 1 $ 1,000<br />
$ 1,000<br />
Merlo_Garage_Airspace_1 - WiFi Services - Cisco 1200 Access Point 1 2009 Replace <strong>2014</strong> 4 4 1 $ 1,000<br />
$ 1,000<br />
Page ‐ 241
<strong>Capital</strong> <strong>Asset</strong> <strong>Management</strong> & <strong>Investment</strong> Program Appendix Technology Equipment Systems<br />
Data Communications (continued)<br />
ITC Functional Area Category: IT FOUNDATION Qty FISCAL FISCAL REPLACE- CURRENT CONDITION <strong>FY</strong><br />
ITC Subcategory: COMMUNICATIONS SYSTEM YEAR OF ACTION YEAR MENT AGE <strong>FY</strong>14 <strong>FY</strong>15 <strong>FY</strong>16 <strong>FY</strong>17 <strong>FY</strong>18 <strong>2014</strong>-2018<br />
PURCHASE NEEDED NEEDED CYCLE TOTALS<br />
Merlo_Spotter_1 - WiFi Services - Cisco 1200 Access Point 1 2009 Replace <strong>2014</strong> 4 4 1 $ 1,000<br />
$ 1,000<br />
Merlo_Spotter_2 - WiFi Services - Cisco 1200 Access Point 1 2009 Replace <strong>2014</strong> 4 4 1 $ 1,000<br />
$ 1,000<br />
Merlo-Airspace-Admin1 - WiFi Services - Cisco 1200 Access Point 1 2009 Replace <strong>2014</strong> 4 4 1 $ 1,000<br />
$ 1,000<br />
Merlo-Airspace-Admin2 - WiFi Services - Cisco 1200 Access Point 1 2009 Replace <strong>2014</strong> 4 4 1 $ 1,000<br />
$ 1,000<br />
Nela-Garage-Airspace-1 - WiFi Services - Cisco 1200 Access Point 1 2009 Replace <strong>2014</strong> 4 4 1 $ 1,000<br />
$ 1,000<br />
Nela-Garage-Airspace-2 - WiFi Services - Cisco 1200 Access Point 1 2009 Replace <strong>2014</strong> 4 4 1 $ 1,000<br />
$ 1,000<br />
Overlook Station - WiFi Services - Cisco 1200 Access Point 1 2009 Replace <strong>2014</strong> 4 4 1 $ 1,000<br />
$ 1,000<br />
Parkrose - WiFi Services - Cisco 1200 Access Point 1 2009 Replace <strong>2014</strong> 4 4 1 $ 1,000<br />
$ 1,000<br />
PDX Airport - WiFi Services - Cisco 1200 Access Point 1 2009 Replace <strong>2014</strong> 4 4 1 $ 1,000<br />
$ 1,000<br />
Portland Blvd Station - WiFi Services - Cisco 1200 Access Point 1 2009 Replace <strong>2014</strong> 4 4 1 $ 1,000<br />
$ 1,000<br />
Powell-Admin-Airspace-7 - WiFi Services - Cisco 1200 Access Point 1 2009 Replace <strong>2014</strong> 4 4 1 $ 1,000<br />
$ 1,000<br />
Powell-Admin-Airspace-8 - WiFi Services - Cisco 1200 Access Point 1 2009 Replace <strong>2014</strong> 4 4 1 $ 1,000<br />
$ 1,000<br />
Powell-ATP-Airspace-1 - WiFi Services - Cisco 1200 Access Point 1 2009 Replace <strong>2014</strong> 4 4 1 $ 1,000<br />
$ 1,000<br />
Powell-Garage-Airspace-1 - WiFi Services - Cisco 1200 Access Point 1 2009 Replace <strong>2014</strong> 4 4 1 $ 1,000<br />
$ 1,000<br />
Powell-Garage-Airspace-2 - WiFi Services - Cisco 1200 Access Point 1 2009 Replace <strong>2014</strong> 4 4 1 $ 1,000<br />
$ 1,000<br />
Powell-Garage-Airspace-3 - WiFi Services - Cisco 1200 Access Point 1 2009 Replace <strong>2014</strong> 4 4 1 $ 1,000<br />
$ 1,000<br />
Powell-Garage-Airspace-4 - WiFi Services - Cisco 1200 Access Point 1 2009 Replace <strong>2014</strong> 4 4 1 $ 1,000<br />
$ 1,000<br />
Powell-Garage-Airspace-5 - WiFi Services - Cisco 1200 Access Point 1 2009 Replace <strong>2014</strong> 4 4 1 $ 1,000<br />
$ 1,000<br />
Powell-Garage-Airspace-6 - WiFi Services - Cisco 1200 Access Point 1 2009 Replace <strong>2014</strong> 4 4 1 $ 1,000<br />
$ 1,000<br />
Prescott Station - WiFi Services - Cisco 1200 Access Point 1 2009 Replace <strong>2014</strong> 4 4 1 $ 1,000<br />
$ 1,000<br />
RJ_Conf_Rm_1 - WiFi Services - Cisco 1200 Access Point 1 2009 Replace <strong>2014</strong> 4 4 1 $ 1,000<br />
$ 1,000<br />
RJ_Situation_Room_1 - WiFi Services - Cisco 1200 Access Point 1 2009 Replace <strong>2014</strong> 4 4 1 $ 1,000<br />
$ 1,000<br />
rj-airspace-1 - WiFi Services - Cisco 1200 Access Point 1 2009 Replace <strong>2014</strong> 4 4 1 $ 1,000<br />
$ 1,000<br />
rj-airspace-2 - WiFi Services - Cisco 1200 Access Point 1 2009 Replace <strong>2014</strong> 4 4 1 $ 1,000<br />
$ 1,000<br />
rj-airspace-3 - WiFi Services - Cisco 1200 Access Point 1 2009 Replace <strong>2014</strong> 4 4 1 $ 1,000<br />
$ 1,000<br />
rj-north-1st-1 - WiFi Services - Cisco 1200 Access Point 1 2009 Replace <strong>2014</strong> 4 4 1 $ 1,000<br />
$ 1,000<br />
rj-north-1st-2 - WiFi Services - Cisco 1200 Access Point 1 2009 Replace <strong>2014</strong> 4 4 1 $ 1,000<br />
$ 1,000<br />
rj-north-1st-3 - WiFi Services - Cisco 1200 Access Point 1 2009 Replace <strong>2014</strong> 4 4 1 $ 1,000<br />
$ 1,000<br />
rj-north-1st-4 - WiFi Services - Cisco 1200 Access Point 1 2009 Replace <strong>2014</strong> 4 4 1 $ 1,000<br />
$ 1,000<br />
rj-north-1st-5 - WiFi Services - Cisco 1200 Access Point 1 2009 Replace <strong>2014</strong> 4 4 1 $ 1,000<br />
$ 1,000<br />
rj-north-2nd-1 - WiFi Services - Cisco 1200 Access Point 1 2009 Replace <strong>2014</strong> 4 4 1 $ 1,000<br />
$ 1,000<br />
rj-north-2nd-2 - WiFi Services - Cisco 1200 Access Point 1 2009 Replace <strong>2014</strong> 4 4 1 $ 1,000<br />
$ 1,000<br />
rj-north-basement-1 - WiFi Services - Cisco 1200 Access Point 1 2009 Replace <strong>2014</strong> 4 4 1 $ 1,000<br />
$ 1,000<br />
rj-north-basement-2 - WiFi Services - Cisco 1200 Access Point 1 2009 Replace <strong>2014</strong> 4 4 1 $ 1,000<br />
$ 1,000<br />
rj-north-basement-3 - WiFi Services - Cisco 1200 Access Point 1 2009 Replace <strong>2014</strong> 4 4 1 $ 1,000<br />
$ 1,000<br />
rj-north-basement-4 - WiFi Services - Cisco 1200 Access Point 1 2009 Replace <strong>2014</strong> 4 4 1 $ 1,000<br />
$ 1,000<br />
rj-north-basement-ld - WiFi Services - Cisco 1200 Access Point 1 2009 Replace <strong>2014</strong> 4 4 1 $ 1,000<br />
$ 1,000<br />
rj-south-1st-1 - WiFi Services - Cisco 1200 Access Point 1 2009 Replace <strong>2014</strong> 4 4 1 $ 1,000<br />
$ 1,000<br />
rj-south-1st-2 - WiFi Services - Cisco 1200 Access Point 1 2009 Replace <strong>2014</strong> 4 4 1 $ 1,000<br />
$ 1,000<br />
rj-south-1st-3 - WiFi Services - Cisco 1200 Access Point 1 2009 Replace <strong>2014</strong> 4 4 1 $ 1,000<br />
$ 1,000<br />
rj-west-1 - WiFi Services - Cisco 1200 Access Point 1 2009 Replace <strong>2014</strong> 4 4 1 $ 1,000<br />
$ 1,000<br />
Rose Qtr Station - WiFi Services - Cisco 1200 Access Point 1 2009 Replace <strong>2014</strong> 4 4 1 $ 1,000<br />
$ 1,000<br />
Sunset TC Station - WiFi Services - Cisco 1200 Access Point 1 2009 Replace <strong>2014</strong> 4 4 1 $ 1,000<br />
$ 1,000<br />
Transit Police - WiFi Services - Cisco 1200 Access Point 1 2009 Replace <strong>2014</strong> 4 4 1 $ 1,000<br />
$ 1,000<br />
WES Trains - WiFi Services - Feeney Wireless Router 1 2008 Replace 2015 6 5 2 $ 1,700<br />
$ 1,700<br />
WES Trains - WiFi Services - Feeney Wireless Router 1 2008 Replace 2015 6 5 2 $ 1,700<br />
$ 1,700<br />
WES Trains - WiFi Services - Feeney Wireless Router 1 2008 Replace 2015 6 5 2 $ 1,700<br />
$ 1,700<br />
WES Trains - WiFi Services - Feeney Wireless Router 1 2008 Replace 2015 6 5 2 $ 1,700<br />
$ 1,700<br />
WES Trains - WiFi Services - Feeney Wireless Router 1 2008 Replace 2015 6 5 2 $ 1,700<br />
$ 1,700<br />
WES Trains - WiFi Services - Feeney Wireless Router 1 2008 Replace 2015 6 5 2 $ 1,700<br />
$ 1,700<br />
WES Trains - WiFi Services - Feeney Wireless Router 1 2008 Replace 2015 6 5 2 $ 1,700<br />
$ 1,700<br />
WES Trains - WiFi Services - Feeney Wireless Router 1 2008 Replace 2015 6 5 2 $ 1,700<br />
$ 1,700<br />
WES Trains - WiFi Services - Feeney Wireless Router 1 2008 Replace 2015 6 5 2 $ 1,700<br />
$ 1,700<br />
WES Trains - WiFi Services - Feeney Wireless Router 1 2008 Replace 2015 6 5 2 $ 1,700<br />
$ 1,700<br />
WES Trains - WiFi Services - Feeney Wireless Router 1 2008 Replace 2015 6 5 2 $ 1,700<br />
$ 1,700<br />
WES Trains - WiFi Services - Feeney Wireless Router 1 2008 Replace 2015 6 5 2 $ 1,700<br />
$ 1,700<br />
WES_BTC - WiFi Services - Cisco 1200 Access Point 1 2013 Replace 2018 4 0 1 $ 1,000 $ 1,000<br />
WES_Hall - WiFi Services - Cisco 1200 Access Point 1 2013 Replace 2018 4 0 1 $ 1,000 $ 1,000<br />
WES_Tigard - WiFi Services - Cisco 1200 Access Point 1 2013 Replace 2018 4 0 1 $ 1,000 $ 1,000<br />
WES_Tualatin - WiFi Services - Cisco 1200 Access Point 1 2013 Replace 2018 4 0 1 $ 1,000 $ 1,000<br />
Page ‐ 242
<strong>Capital</strong> <strong>Asset</strong> <strong>Management</strong> & <strong>Investment</strong> Program Appendix Technology Equipment Systems<br />
Data Communications (continued)<br />
ITC Functional Area Category: IT FOUNDATION Qty FISCAL FISCAL REPLACE- CURRENT CONDITION <strong>FY</strong><br />
ITC Subcategory: COMMUNICATIONS SYSTEM YEAR OF ACTION YEAR MENT AGE <strong>FY</strong>14 <strong>FY</strong>15 <strong>FY</strong>16 <strong>FY</strong>17 <strong>FY</strong>18 <strong>2014</strong>-2018<br />
PURCHASE NEEDED NEEDED CYCLE TOTALS<br />
wilsonville-aironet-1 - WiFi Services - Cisco 1200 Access Point 1 2013 Replace 2018 4 0 1 $ 1,000 $ 1,000<br />
wilsonville-aironet-2 - WiFi Services - Cisco 1200 Access Point 1 2013 Replace 2018 4 0 1 $ 1,000 $ 1,000<br />
wilsonville-aironet-3 - WiFi Services - Cisco 1200 Access Point 1 2013 Replace 2018 4 0 1 $ 1,000 $ 1,000<br />
wilsonville-aironet-4 - WiFi Services - Cisco 1200 Access Point 1 2013 Replace 2018 4 0 1 $ 1,000 $ 1,000<br />
wilsonville-aironet-5 - WiFi Services - Cisco 1200 Access Point 1 2013 Replace 2018 4 0 1 $ 1,000 $ 1,000<br />
WES Trains - WiFi Services - Spare - Feeney Wireless Router 1 2008 Replace 2015 6 5 2 $ 1,700<br />
$ 1,700<br />
I205 Project Office - Wireless Bridge - Cisco 1200 Access Point 1 2011 Replace 2016 4 2 3 $ 1,000<br />
$ 1,000<br />
I205 Project Office - Wireless Bridge - Cisco 1200 Access Point 1 2011 Replace 2016 4 2 3 $ 1,000<br />
$ 1,000<br />
I205 Project Office - Wireless Bridge - Cisco 1200 Access Point 1 2011 Replace 2016 4 2 3 $ 1,000<br />
$ 1,000<br />
I205 Project Office - Wireless Bridge - Cisco 1200 Access Point 1 2011 Replace 2016 4 2 3 $ 1,000<br />
$ 1,000<br />
RQ-Aironet-Bridge-1 - Wireless Bridge - Cisco 1200 Access Point 1 2011 Replace 2016 4 2 3 $ 1,000<br />
$ 1,000<br />
RQ-Aironet-Bridge-2 - Wireless Bridge - Cisco 1200 Access Point 1 2011 Replace 2016 4 2 3 $ 1,000<br />
$ 1,000<br />
Center - Yard Wireless Services - Cisco 1252 802.11n Access Point 1 2010 Replace 2016 5 3 3 $ 1,000<br />
$ 1,000<br />
Center - Yard Wireless Services - Cisco 1252 802.11n Access Point 1 2010 Replace 2016 5 3 3 $ 1,000<br />
$ 1,000<br />
Center - Yard Wireless Services - Cisco 1252 802.11n Access Point 1 2010 Replace 2016 5 3 3 $ 1,000<br />
$ 1,000<br />
Center - Yard Wireless Services - Cisco 1252 802.11n Access Point 1 2010 Replace 2016 5 3 2 $ 1,000<br />
$ 1,000<br />
Center - Yard Wireless Services - Cisco 1252 802.11n Access Point 1 2010 Replace 2016 5 3 2 $ 1,000<br />
$ 1,000<br />
Center - Yard Wireless Services - Cisco 1252 802.11n Access Point 1 2010 Replace 2016 5 3 2 $ 1,000<br />
$ 1,000<br />
Center - Yard Wireless Services - Cisco 1252 802.11n Access Point 1 2010 Replace 2016 5 3 2 $ 1,000<br />
$ 1,000<br />
Center - Yard Wireless Services - Cisco 1252 802.11n Access Point 1 2010 Replace 2016 5 3 2 $ 1,000<br />
$ 1,000<br />
Center - Yard Wireless Services - Cisco 1252 802.11n Access Point 1 2010 Replace 2016 5 3 2 $ 1,000<br />
$ 1,000<br />
Center - Yard Wireless Services - Cisco 1252 802.11n Access Point 1 2010 Replace 2016 5 3 2 $ 1,000<br />
$ 1,000<br />
Elmo-Yard-1 - Yard Wireless Services - Cisco 1200 Access Point 1 2009 Replace <strong>2014</strong> 4 4 1 $ 1,000<br />
$ 1,000<br />
Elmo-Yard-2 - Yard Wireless Services - Cisco 1200 Access Point 1 2009 Replace <strong>2014</strong> 4 4 1 $ 1,000<br />
$ 1,000<br />
Merlo - Yard Wireless Services - Cisco 1252 802.11n Access Point 1 2010 Replace 2016 5 3 2 $ 1,000<br />
$ 1,000<br />
Merlo - Yard Wireless Services - Cisco 1252 802.11n Access Point 1 2010 Replace 2016 5 3 2 $ 1,000<br />
$ 1,000<br />
Merlo - Yard Wireless Services - Cisco 1252 802.11n Access Point 1 2010 Replace 2016 5 3 2 $ 1,000<br />
$ 1,000<br />
Merlo - Yard Wireless Services - Cisco 1252 802.11n Access Point 1 2010 Replace 2016 5 3 2 $ 1,000<br />
$ 1,000<br />
Merlo - Yard Wireless Services - Cisco 1252 802.11n Access Point 1 2010 Replace 2016 5 3 2 $ 1,000<br />
$ 1,000<br />
Merlo - Yard Wireless Services - Cisco 1252 802.11n Access Point 1 2010 Replace 2016 5 3 2 $ 1,000<br />
$ 1,000<br />
Merlo - Yard Wireless Services - Cisco 1252 802.11n Access Point 1 2010 Replace 2016 5 3 2 $ 1,000<br />
$ 1,000<br />
Merlo - Yard Wireless Services - Cisco 1252 802.11n Access Point 1 2010 Replace 2016 5 3 2 $ 1,000<br />
$ 1,000<br />
Merlo - Yard Wireless Services - Cisco 1252 802.11n Access Point 1 2010 Replace 2016 5 3 2 $ 1,000<br />
$ 1,000<br />
Merlo - Yard Wireless Services - Cisco 1252 802.11n Access Point 1 2010 Replace 2016 5 3 2 $ 1,000<br />
$ 1,000<br />
Merlo-Yard-1 - Yard Wireless Services - Cisco 1200 Access Point 1 2009 Replace <strong>2014</strong> 4 4 1 $ 1,000<br />
$ 1,000<br />
Merlo-Yard-2 - Yard Wireless Services - Cisco 1200 Access Point 1 2009 Replace <strong>2014</strong> 4 4 1 $ 1,000<br />
$ 1,000<br />
Merlo-Yard-3 - Yard Wireless Services - Cisco 1200 Access Point 1 2009 Replace <strong>2014</strong> 4 4 1 $ 1,000<br />
$ 1,000<br />
Nela - Yard Wireless Services - Cisco 1252 802.11n Access Point 1 2010 Replace 2016 5 3 2 $ 1,000<br />
$ 1,000<br />
Nela - Yard Wireless Services - Cisco 1252 802.11n Access Point 1 2010 Replace 2016 5 3 2 $ 1,000<br />
$ 1,000<br />
Nela-Yard-Airspace-1 - Yard Wireless Services - Cisco 1200 Access Point 1 2009 Replace <strong>2014</strong> 4 4 1 $ 1,000<br />
$ 1,000<br />
Nela-Yard-Airspace-2 - Yard Wireless Services - Cisco 1200 Access Point 1 2009 Replace <strong>2014</strong> 4 4 1 $ 1,000<br />
$ 1,000<br />
Powell - Yard Wireless Services - Cisco 1252 802.11n Access Point 1 2010 Replace 2016 5 3 2 $ 1,000<br />
$ 1,000<br />
Powell - Yard Wireless Services - Cisco 1252 802.11n Access Point 1 2010 Replace 2016 5 3 2 $ 1,000<br />
$ 1,000<br />
Powell - Yard Wireless Services - Cisco 1252 802.11n Access Point 1 2010 Replace 2016 5 3 2 $ 1,000<br />
$ 1,000<br />
Powell - Yard Wireless Services - Cisco 1252 802.11n Access Point 1 2010 Replace 2016 5 3 2 $ 1,000<br />
$ 1,000<br />
Powell - Yard Wireless Services - Cisco 1252 802.11n Access Point 1 2010 Replace 2016 5 3 2 $ 1,000<br />
$ 1,000<br />
Powell - Yard Wireless Services - Cisco 1252 802.11n Access Point 1 2010 Replace 2016 5 3 2 $ 1,000<br />
$ 1,000<br />
Powell - Yard Wireless Services - Cisco 1252 802.11n Access Point 1 2010 Replace 2016 5 3 2 $ 1,000<br />
$ 1,000<br />
Powell - Yard Wireless Services - Cisco 1252 802.11n Access Point 1 2010 Replace 2016 5 3 2 $ 1,000<br />
$ 1,000<br />
Powell - Yard Wireless Services - Cisco 1252 802.11n Access Point 1 2010 Replace 2016 5 3 2 $ 1,000<br />
$ 1,000<br />
Powell - Yard Wireless Services - Cisco 1252 802.11n Access Point 1 2010 Replace 2016 5 3 2 $ 1,000<br />
$ 1,000<br />
Powell-Yard_Airspace_1 - Yard Wireless Services - Cisco 1200 Access Point 1 2009 Replace <strong>2014</strong> 4 4 1 $ 1,000<br />
$ 1,000<br />
Powell-Yard-Airspace-2 - Yard Wireless Services - Cisco 1200 Access Point 1 2009 Replace <strong>2014</strong> 4 4 1 $ 1,000<br />
$ 1,000<br />
Powell-Yard-Airspace-3 - Yard Wireless Services - Cisco 1200 Access Point 1 2009 Replace <strong>2014</strong> 4 4 1 $ 1,000<br />
$ 1,000<br />
Powell-Yard-Airspace-4 - Yard Wireless Services - Cisco 1200 Access Point 1 2009 Replace <strong>2014</strong> 4 4 1 $ 1,000<br />
$ 1,000<br />
rj-north-yard-1 - Yard Wireless Services - Cisco 1200 Access Point 1 2009 Replace <strong>2014</strong> 4 4 1 $ 1,000<br />
$ 1,000<br />
rj-north-yard-2 - Yard Wireless Services - Cisco 1200 Access Point 1 2009 Replace <strong>2014</strong> 4 4 1 $ 1,000<br />
$ 1,000<br />
rj-north-yard-3 - Yard Wireless Services - Cisco 1200 Access Point 1 2009 Replace <strong>2014</strong> 4 4 1 $ 1,000<br />
$ 1,000<br />
rj-south-yard-1 - Yard Wireless Services - Cisco 1200 Access Point 1 2009 Replace <strong>2014</strong> 4 4 1 $ 1,000<br />
$ 1,000<br />
rj-south-yard-2 - Yard Wireless Services - Cisco 1200 Access Point 1 2009 Replace <strong>2014</strong> 4 4 1 $ 1,000<br />
$ 1,000<br />
Page ‐ 243
<strong>Capital</strong> <strong>Asset</strong> <strong>Management</strong> & <strong>Investment</strong> Program Appendix Technology Equipment Systems<br />
Data Communications (continued)<br />
ITC Functional Area Category: IT FOUNDATION Qty FISCAL FISCAL REPLACE- CURRENT CONDITION <strong>FY</strong><br />
ITC Subcategory: COMMUNICATIONS SYSTEM YEAR OF ACTION YEAR MENT AGE <strong>FY</strong>14 <strong>FY</strong>15 <strong>FY</strong>16 <strong>FY</strong>17 <strong>FY</strong>18 <strong>2014</strong>-2018<br />
PURCHASE NEEDED NEEDED CYCLE TOTALS<br />
rj-west-yard-1 - Yard Wireless Services - Cisco 1200 Access Point 1 2009 Replace <strong>2014</strong> 4 4 1 $ 1,000<br />
$ 1,000<br />
rj-west-yard-2 - Yard Wireless Services - Cisco 1200 Access Point 1 2009 Replace <strong>2014</strong> 4 4 1 $ 1,000<br />
$ 1,000<br />
Total Wireless Network: $ 129,000 $ 34,100 $ 115,000 $ 36,000 $ 10,000 $ 324,100<br />
<strong>Management</strong> Tools<br />
Center - Copper & Fiber Testing - Omniscanner2 Cable Scanner 1 2000 Replace 2015 14 13 4 $ 7,500<br />
$ 7,500<br />
Center - Fiber Testing - Wavetek OTDR 1 2010 Replace 2021 10 3 2 $ -<br />
Center - Network Performance <strong>Management</strong> - Cisco LAN <strong>Management</strong> System 1 2011 Replace 2015 3 2 4 $ 10,000<br />
$ 10,000<br />
Center - Network Performance <strong>Management</strong> - Cisco QOS <strong>Management</strong> SW 1 2007 Replace 2015 7 6 4 $ 15,000<br />
$ 15,000<br />
Center - Network Timing Source Clock - Symetricom 3000 Stratum Clock 1 2010 Replace 2019 8 3 3 $ -<br />
Center - WiFi Survey & Testing - Wireless Survey Kit 1 2010 Replace 2016 5 3 3 $ 20,000<br />
$ 20,000<br />
Center - Wireless Services - Cisco Wireless Control System SW 1 2013 Replace 2017 3 0 1 $ 4,000<br />
$ 4,000<br />
Comm Engineer - Comm System Troubleshooting - Dell Laptop 1 2011 Replace 2015 3 2 4 $ 2,500<br />
$ 2,500<br />
Comm Engineer - Comm System Troubleshooting - Dell Laptop 1 2011 Replace 2015 3 2 4 $ 2,500<br />
$ 2,500<br />
Comm Engineer - Comm System Troubleshooting - Dell Laptop 1 2013 Replace 2017 3 0 1 $ 2,500<br />
$ 2,500<br />
Comm Engineer - Comm System Troubleshooting - Dell Laptop 1 2013 Replace 2017 3 0 1 $ 2,500<br />
$ 2,500<br />
Comm Manager - Comm System Troubleshooting - Dell Laptop 1 2011 Replace 2015 3 2 4 $ 2,500<br />
$ 2,500<br />
Ruby - Network Timing Source Clock - Symetricom 3000 Stratum Clock 1 2010 Replace 2019 8 3 3 $ -<br />
<strong>Management</strong> Tool Upgrades Varies N/A Upgrade <strong>2014</strong> N/A $ 20,000 $ 500<br />
$ 20,500<br />
Total <strong>Management</strong> Tools: $ 20,000 $ 40,500 $ 20,000 $ 9,000 $ - $ 89,500<br />
REPLACEMENT TOTAL $ 328,000 $ 226,800 $ 416,200 $ 844,000 $ 472,300 $ 2,287,300<br />
Routers, Switches and Wireless access points are what allows the various elements (PCs, telephones, fax machines, printers) of the WAN and LAN to "talk" to each other. Replacement schedules on these devices vary from 4 years to 10 or more years.<br />
Condition is based on age. 1- New or Excellent. 2- Good. 3-Fair. 4-Aging. 5-Replace.<br />
Page ‐ 244
SECTION 9 – MATRICES
This page left intentionally blank.
ADOPTED <strong>FY</strong>13-14 <strong>Capital</strong> & Operating Project Budget by Division-Forecast Budget 6/19/2013<br />
A B C D E F G H I J K L M N O P Q R S T U V W X Y<br />
<strong>FY</strong>13-14 Forecast Budget Federal Share <strong>TriMet</strong> Share Other Source Requirements CFDA<br />
New Money<br />
Detailed Project Description/ <strong>Asset</strong> Category Page Project Budgeted Budgeted Operating Cost Project Grant Approved Section Other Total <strong>FY</strong>14 Total Local Revenue Total<br />
Detailed Project Name Number Manager Division Department <strong>Capital</strong> Fund Expense Center Section Number Extension STIP Project Description 5307 CMAQ TIGGER Federal Share Request Share (Incl State) Bonds<br />
1 Automatic Train Stop (ATS) Vehicles 52 Heilig, T. <strong>Capital</strong> Projects Development & Ops Support capital 10 1052870 000 00 5618 00000 Automatic Train Stop 0 500,000 500,000 500,000<br />
2 Bus Shop Equipment > $5,000 Vehicles 194 Nielsen, T. Operations Bus Maintenance capital 10 1111050 000 00 4006 00000 Bus Shop Equipment Replacement 0 923,800 923,800 923,800<br />
3 Fixed Route Buses-60 Vehicles 183 Haley, G. Operations Bus Maintenance capital 10 1052870 000 00 4058 20801 Y 60 Replacement Low-Floor 40' Buses 5,150,000 5,150,000 9,658,313 9,658,313 11,486,688 26,295,001 20.526<br />
4 Light Rail Vehicle Equipment >$5,000 Vehicles 42 Grove, Mark Operations Rail Equip Maintenance capital 10 1111050 000 00 7503 00000 Light Rail Shop Equipment 0 93,000 93,000 93,000<br />
5 Non-Revenue Vehicles >$5,000 Vehicles 210 Nielsen, T. Operations Bus Maintenance capital 10 1111040 000 00 4001 00000 Non-Revenue Vehicle Replacement 0 1,980,000 1,980,000 1,980,000<br />
6 Positive Train Control Vehicles 53 Heilig, T. <strong>Capital</strong> Projects Development & Ops Support capital 10 1052870 000 00 7563 00000 Positive Train Control 0 700,000 700,000 700,000<br />
7 Rail Maintenance Equipment (capital) Vehicles 44 Grove, Mark Operations Rail Equip Maintenance capital 10 1052870 000 00 7504 00000 Rail Maintenance Equipment 0 25,000 25,000 25,000<br />
8 Kubota L Series 9FT Backhoe MOW 76 Kindig, R. Operations Rail MOW capital 10 1052870 000 00 7576 00000 Kubota L Series 9FT Backhoe 0 66,000 66,000 66,000<br />
9 MOW-Signals MOW 64 Kindig, R. Operations Rail MOW capital 10 1052870 000 00 7535 00000 Signal Replacements 0 220,000 220,000 220,000<br />
10 MOW-Substations MOW 68 Kindig, R. Operations Rail MOW capital 10 1052870 000 00 7535 00000 Substation Retrofits/Replacements 0 100,000 100,000 100,000<br />
11 MOW-Track & Structures (capital) MOW 57 Kindig, R. Operations Rail MOW capital 10 1052870 000 00 7559 00000 Track/Structure Replacements 0 2,380,000 2,380,000 2,380,000<br />
12 Ruby Junction MOW Training Module MOW 74 Kindig, R. Operations Rail MOW capital 10 1052870 000 00 7577 00000 Install Rail Components for Training Purposes 0 752,600 752,600 752,600<br />
13 Bus Hoist Replacements Facilities 112 Papadopoulos, E. Operations Facilities <strong>Management</strong> capital 10 1052870 000 00 4547 00000 Bus Hoist Replacements 0 421,000 421,000 421,000<br />
14 Bus Stop Development - New Shelters (MTIP 89.73%, TM 10.2Facilities 85 Park, Y. <strong>Capital</strong> Projects Bus Stop Development capital 10 1052870 000 00 5508 16187 Y Bus Stop Development-New Shelters 141,773 141,773 16,227 16,227 158,000 20.507<br />
15 Center Maint. Battery Room Ventilation Facilities 107 Papadopoulos, E. Operations Facilities <strong>Management</strong> capital 10 1052870 000 00 4643 00000 Evaluate/Improve Battery Room Ventilation 0 44,625 44,625 44,625<br />
16 Center Street t Building - End of Life Maintenance Work Facilities 123 Munro <strong>Capital</strong> lProjects Development t&O Ops Support capital 10 1052870 000 00 4644 00000 Building Façade, Windows, Fire Suppression, HVAC 0 3,419,883 3,419,883 3,419,883<br />
17 Center Street Building - First Floor Facilities 121 Munro <strong>Capital</strong> Projects Development & Ops Support capital 10 1052870 000 00 4645 00000 Remodel Bullpen, Lobby Area & East End Entrance 0 2,340,689 2,340,689 2,340,689<br />
18 HVAC Equipment & Systems Replacement Facilities 224 Papadopoulos, E. Operations Facilities <strong>Management</strong> capital 10 1052870 000 00 4604 00000 HVAC Replacements 0 273,000 273,000 273,000<br />
19 Line 8 & 17 Bus Turnaround & Layover Facility Facilities 125 Park, Y. <strong>Capital</strong> Projects Bus Stop Development capital 10 1052870 000 00 4646 00000 Line 8 & 17 Bus Layover & Turnaround Facility 0 400,000 400,000 400,000<br />
20 Merlo UST Replacement Facilities 122 Preston, K. Safety & Security Safety, Security & Environmental capital 10 1052870 000 00 4647 00000 Replace Underground Storage Tank at Merlo 0 150,000 150,000 150,000<br />
21 Powell - Refurbish OPS (admin, bullpen, restrooms) Facilities 106 Papadopoulos, E. Operations Facilities <strong>Management</strong> capital 10 1052870 000 00 4574 00000 Upgrade/Refurbish Ops Facilities 0 96,258 96,258 96,258<br />
22 REM Storage Facilities 101 Papadopoulos, E. Operations Facilities <strong>Management</strong> capital 10 1052870 000 00 4594 00000 Elmonica REM Storage 0 261,038 261,038 261,038<br />
23 Ruby North - DDC Replacement Facilities 110 Papadopoulos, E. Operations Facilities <strong>Management</strong> capital 10 1052870 000 00 4577 00000 Direct Digital Control Replacement - Ruby North 0 119,351 119,351 119,351<br />
24 Ruby North - Server Room Remodel Facilities 108 Papadopoulos, E. Operations Facilities <strong>Management</strong> capital 10 1052870 000 00 4577 00000 Reconfigure/Upgrade Server Room 0 26,100 26,100 26,100<br />
25 Sunset Transit Center - Platform Pavers Replacement Facilities 116 Batty, S. Operations Facilities <strong>Management</strong> capital 10 1052870 000 00 4648 00000 Surface Replacements at Sunset Platform 0 295,452 295,452 295,452<br />
26 TEI & Master Plan - New Construction (Powell) Facilities 103 Papadopoulos, E. Operations Facilities <strong>Management</strong> capital 10 1052870 000 00 4649 00000 Update MP, Design & Construct TEI Facility 0 60,000 60,000 60,000<br />
27 Vault Cover Replacements - Morrison/Yamhill Signal Facilities 118 Papadopoulos, E. Operations Facilities <strong>Management</strong> capital 10 1052870 000 00 4650 00000 Replace Signal Vaults along Morrison & Yamhill 0 310,200 310,200 310,200<br />
28 Washington park - Station Finishes & Landscaping Facilities 115 Batty, S. Operations Facilities <strong>Management</strong> capital 10 1052870 000 00 4651 00000 Replace/Upgrade Elevators/Platforms at Washington Park 0 654,032 654,032 654,032<br />
30 Bus Dispatch Replacement Project (capitalized labor/fringe) Technology O'Connor, A.J. Information Technology Information Technology capital 10 1052870 000 00 1054 00000 Bus Dispatch Replacement 0 68,447 68,447 68,447<br />
31 Call A Bus Replacement Technology 155 Maercklein, D. Information Technology Information Technology capital 10 1052870 000 00 1128 00000 Call A Bus Replacement 0 225,000 225,000 225,000<br />
32 Networked CCTV Systems Technology 141 Saporta, H. Safety & Security Safety, Security & Environmental capital 10 1052870 000 00 1129 00000 CCTV Cameras Installed on Buses 0 664,800 664,800 664,800<br />
33 Vehicle Borne CCTV Systems Technology 140 Saporta, H. Safety & Security Safety, Security & Environmental capital 10 1052870 000 00 1130 00000 CCTV Cameras Installed on Light Rail Vehicles 0 125,000 125,000 125,000<br />
34 Communication Environment Replacement - capital Technology 150 White, R. Information Technology Information Technology capital 10 1052870 000 00 1131 00000 Communications Environment Total 0 542,000 542,000 542,000<br />
35 Data Communication Systems Replacement - capital Technology 147, 236 White, R. Information Technology Information Technology capital 10 1052870 000 00 1095 00000 Switches & Routers, Remote Access, Wireless Network, Mgmt Tools 0 131,000 131,000 131,000<br />
36 Develop & Set-Up Reorder Point Planning Technology 151 Baker, L. Finance & Administration Financial Services capital 10 1052870 000 00 1132 00000 Develop & Set-up Reorder Point Planning 0 150,000 150,000 150,000<br />
37 Digital Sign CPU Retrofit Technology 154 Vitko, I. Information Technology Information Technology capital 10 1052870 000 00 1133 00000 Equipment Upgrade for Solari Digital Info Displays 0 92,730 92,730 92,730<br />
38 Disaster Recovery Network Updates Technology 156 White, R. Information Technology Information Technology capital 10 1052870 000 00 1134 00000 Disaster Recovery Network Upgrades 0 600,000 600,000 600,000<br />
39 Discipline Records - Build Oracle Solution Technology 152 Maercklein, D. Information Technology Information Technology capital 10 1052870 000 00 1135 00000 Discipline Records - Build Oracle Solution 0 100,000 100,000 100,000<br />
40 E-Citation ti Technology 160 Saporta, H. Sft Safety &S Security Sft Safety, Security &E Environmental tl capital 10 1052870 000 00 1136 00000 E-Citation ti 0 220,324 220,324 220,324<br />
41 Electronic Fare System Technology 136 Tucker, C. Finance & Administration Fare Revenue capital 10 1052870 000 00 7544 00000 Electronic Fare Implementation Plan 0 1,550,000 1,550,000 1,550,000<br />
42 Electronic Fare System (capitalized labor/fringe) Technology Tucker, C. Finance & Administration Fare Revenue capital 10 1052870 000 00 7544 00000 Electronic Fare Implementation Plan 0 37,398 37,398 37,398<br />
43 Fare Pull Station Technology 136 Tucker, C. Finance & Administration Fare Revenue capital 10 1052870 000 00 1137 00000 Fare Pull Station 0 124,000 124,000 124,000<br />
44 Finance/Procurment Digital Imaging System Technology 151 Baker, L. Finance & Administration Financial Services capital 10 1052870 000 00 1138 00000 Finance/Procurement Digital Imaging System 0 600,000 600,000 600,000<br />
45 FMIS/MMIS Project (capitalized labor/fringe) Technology Maercklein, D. Information Technology Information Technology capital 10 1052870 000 00 1108 00000 FMIS/MMIS 0 40,512 40,512 40,512<br />
46 IT Security Systems Replacement (capital) Technology 149 White, R. Information Technology Information Technology capital 10 1052870 000 00 1094 00000 IT Security Systems Replacement 0 82,000 82,000 82,000<br />
48 Employee Self Service (capitalized labor/fringe) Technology Baylor, B. Information Technology Information Technology capital 10 1052870 000 00 1118 00000 Operator Employee Service 0 16,761 16,761 16,761<br />
49 Operator Self Service (capitalized labor/fringe) Technology Baylor, B. Information Technology Information Technology capital 10 1052870 000 00 1111 00000 Operator Self Service 0 13,774 13,774 13,774<br />
50 Operator Training Equipment Technology 153 Morgan, A. Operations Operations Support capital 10 1052870 000 00 1139 00000 Training Simulator & Development of Virtual Environment 0 400,000 400,000 400,000<br />
51 Ruby Server Room Improvements Technology 157 Fouts, M. Information Technology Information Technology capital 10 1052870 000 00 1140 00000 Ruby Server Room Improvements 0 150,000 150,000 150,000<br />
52 Self Service Manager Technology 152 Baylor, B. Information Technology Information Technology capital 10 1052870 000 00 1141 00000 Employee/Manager Self Serve Tools/Information 0 150,000 150,000 150,000<br />
53 Self Service Manager (capitalized labor/fringe) Technology Baylor, B. Information Technology Information Technology capital 10 1052870 000 00 1141 00000 Employee/Manager Self Serve Tools/Information 0 16,761 16,761 16,761<br />
54 Servers Replacement Technology 146, 230 Fouts, M. Information Technology Information Technology capital 10 1052870 000 00 1070 00000 Servers Replacement 0 354,000 354,000 354,000<br />
55 Single Sign-On Technology 158 Baylor, B. Information Technology Information Technology capital 10 1052870 000 00 1142 00000 Single Sign On 0 230,000 230,000 230,000<br />
56 TimeClock Replacement Technology 159 Maercklein, D. Information Technology Information Technology capital 10 1052870 000 00 1143 00000 TimeClock Replacement 0 100,000 100,000 100,000<br />
57 <strong>TriMet</strong> Ticket Office Point of Sale Upgrade Technology 136 Tucker, C. Finance & Administration Fare Revenue capital 10 1052870 000 00 1144 00000 TTO Point of Sale Upgrade 0 49,000 49,000 49,000<br />
58 Union Pay Rates in Oracle Payroll Technology 151 Baker, L. Finance & Administration Financial Services capital 10 1052870 000 00 1145 00000 Union Pay Rates in Oracle Payroll 0 170,000 170,000 170,000<br />
59 Voice Systems Technology 148 White, R. Information Technology Information Technology capital 10 1052870 000 00 1017 00000 Voice Systems Replacement 0 241,000 241,000 241,000<br />
60 BRT First Corridor (Powell-Division) New-Improved Svc 165 Lehto, A. Public Affairs Planning & Policy capital 10 1052870 000 00 1146 xxxxx Bus Rapid Transit Service 100,000 100,000 0 0 100,000<br />
61 ATP-LIFT Vehicle Equipment Replacement
ADOPTED <strong>FY</strong>13-14 <strong>Capital</strong> & Operating Project Budget by Division-Forecast Budget 6/19/2013<br />
A B C D E F G H I J K L M N O P Q R S T U V W X Y<br />
<strong>FY</strong>13-14 Forecast Budget Federal Share <strong>TriMet</strong> Share Other Source Requirements CFDA<br />
New Money<br />
Detailed Project Description/ <strong>Asset</strong> Category Page Project Budgeted Budgeted Operating Cost Project Grant Approved Section Other Total <strong>FY</strong>14 Total Local Revenue Total<br />
Detailed Project Name Number Manager Division Department <strong>Capital</strong> Fund Expense Center Section Number Extension STIP Project Description 5307 CMAQ TIGGER Federal Share Request Share (Incl State) Bonds<br />
75 Steel Bridge Improvements MOW 75 Kindig, R. Operations Rail MOW operating 10 5049151 785 90 7580 00000 Steel Bridge Improvements 0 500,000 500,000 500,000<br />
76 All Facilities Maintenance Environmental Facilities 121 Preston, K. Safety & Security Safety, Security & Environmental operating 10 5035100 712 90 4557 00000 All Facilities Maintenance Environmental 0 125,000 125,000 125,000<br />
77 Bike to Transit Facilities Facilities 86 Owen, J. Public Affairs Planning & Policy operating 10 5049622 210 90 2902 00000 Bike to Transit Facilities 0 25,000 25,000 25,000<br />
78 Building Area/Components Replacement Facilities 223 Papadopoulos, E. Operations Facilities <strong>Management</strong> operating 10 5035100 750 94 4652 00000 Carpet Repl. - Elmonica 2nd Floor Hallway 0 5,000 5,000 5,000<br />
79 Building Area/Components Replacement Facilities 223 Papadopoulos, E. Operations Facilities <strong>Management</strong> operating 10 5035100 750 90 4652 00000 Door Repl. - Center Maint Exterior Man Door 2nd Floor 0 3,000 3,000 3,000<br />
80 Building Area/Components Replacement Facilities 223 Papadopoulos, E. Operations Facilities <strong>Management</strong> operating 10 5035100 750 92 4652 00000 Door Repl. - Powell Maint Overhead Motors 0 17,500 17,500 17,500<br />
81 Building Area/Components Replacement Facilities 223 Papadopoulos, E. Operations Facilities <strong>Management</strong> operating 10 5035100 750 90 4652 00000 Lighting Repl. - Center Admin Interior Lighting 0 1,500 1,500 1,500<br />
82 Building Area/Components Replacement Facilities 223 Papadopoulos, E. Operations Facilities <strong>Management</strong> operating 10 5035100 750 90 4652 00000 Lighting Repl. - Center Maint Shop Lighting 0 4,000 4,000 4,000<br />
83 Building Area/Components Replacement Facilities 223 Papadopoulos, E. Operations Facilities <strong>Management</strong> operating 10 5035100 750 91 4652 00000 Lighting Repl. - Merlo Admin Interior Lighting 0 1,500 1,500 1,500<br />
84 Building Area/Components Replacement Facilities 223 Papadopoulos, E. Operations Facilities <strong>Management</strong> operating 10 5035100 750 91 4652 00000 Lighting Repl. - Merlo Maint Shop Lighting 0 4,000 4,000 4,000<br />
85 Building Area/Components Replacement Facilities 223 Papadopoulos, E. Operations Facilities <strong>Management</strong> operating 10 5035100 750 91 4652 00000 Lighting Repl. - Merlo Maint Paint Bay Lighting 0 500 500 500<br />
86 Building Area/Components Replacement Facilities 223 Papadopoulos, E. Operations Facilities <strong>Management</strong> operating 10 5035100 750 95 4652 00000 Lighting Repl. - Nela ATP Shop Lighting 0 1,500 1,500 1,500<br />
87 Building Area/Components Replacement Facilities 223 Papadopoulos, E. Operations Facilities <strong>Management</strong> operating 10 5035100 750 92 4652 00000 Lighting Repl. - Powell Maint Shop Lighting 0 4,000 4,000 4,000<br />
88 Building Area/Components Replacement Facilities 223 Papadopoulos, E. Operations Facilities <strong>Management</strong> operating 10 5035100 750 97 4652 00000 Lighting Repl. - Vintage Trolley 24-hour Ceiling Lights 0 500 500 500<br />
89 Building Area/Components Replacement Facilities 223 Papadopoulos, E. Operations Facilities <strong>Management</strong> operating 10 5049170 750 96 4652 00000 Painting Exterior - MAX Platforms 0 80,000 80,000 80,000<br />
90 Building Area/Components Replacement Facilities 223 Papadopoulos, E. Operations Facilities <strong>Management</strong> operating 10 5035100 750 90 4652 00000 Painting Interior - Center Maint 0 100,000000 100,000000 100,000000<br />
91 Building Area/Components Replacement Facilities 223 Papadopoulos, E. Operations Facilities <strong>Management</strong> operating 10 5049170 750 96 4652 00000 Painting/Reseal Exterior - Barbur TC 0 55,000 55,000 55,000<br />
92 Building Area/Components Replacement Facilities 223 Papadopoulos, E. Operations Facilities <strong>Management</strong> operating 10 5049170 750 96 4652 00000 Painting/Reseal Exterior - Foster Layover 0 1,200 1,200 1,200<br />
93 Building Area/Components Replacement Facilities 223 Papadopoulos, E. Operations Facilities <strong>Management</strong> operating 10 5049170 750 96 4652 00000 Painting/Reseal Exterior - Parking Garage DW 0 85,000 85,000 85,000<br />
94 Building Area/Components Replacement Facilities 223 Papadopoulos, E. Operations Facilities <strong>Management</strong> operating 10 5035100 750 93 4652 00000 Painting/Reseal Exterior - Ruby North 0 100,000 100,000 100,000<br />
95 Building Area/Components Replacement Facilities 223 Papadopoulos, E. Operations Facilities <strong>Management</strong> operating 10 5035100 750 90 4652 00000 Roof Inspection & Repair - Center Admin 0 25,000 25,000 25,000<br />
96 Building Area/Components Replacement Facilities 223 Papadopoulos, E. Operations Facilities <strong>Management</strong> operating 10 5035100 750 95 4652 00000 Roof Inspection & Repair - Nela ATP 0 25,000 25,000 25,000<br />
97 Building Area/Components Replacement Facilities 223 Papadopoulos, E. Operations Facilities <strong>Management</strong> operating 10 5035100 750 91 4652 00000 Window Reseal - Merlo Maint 0 10,000 10,000 10,000<br />
98 Bus On-Street Related Maintenance Facilities 87 Park, Y. <strong>Capital</strong> Projects Bus Stop Development operating 10 5049162 763 99 5563 00000 Bus On-Street Related Maintenance 0 100,000 100,000 100,000<br />
99 Electrical Equipment & Systems Replacement Facilities 224 Papadopoulos, E. Operations Facilities <strong>Management</strong> operating 10 5035100 750 90 4653 00000 UPS Batteries - Center Admin 0 10,000 10,000 10,000<br />
100 Electrical Equipment & Systems Replacement Facilities 224 Papadopoulos, E. Operations Facilities <strong>Management</strong> operating 10 5035100 750 94 4653 00000 UPS Batteries - Elmonica 0 15,000 15,000 15,000<br />
101 Electrical Equipment & Systems Replacement Facilities 224 Papadopoulos, E. Operations Facilities <strong>Management</strong> operating 10 5035100 755 93 4653 00000 UPS Batteries - Ruby North 0 20,000 20,000 20,000<br />
102 Lifting Equipment & Systems Replacement Facilities 225 Papadopoulos, E. Operations Facilities <strong>Management</strong> operating 10 5049170 755 96 4654 00000 Elevator Floor Lining Repl - MAX Platforms 0 10,000 10,000 10,000<br />
103 Lifting Equipment & Systems Replacement Facilities 225 Papadopoulos, E. Operations Facilities <strong>Management</strong> operating 10 5049170 750 96 4654 00000 Elevator Floor Lining Repl - Parking Garage DW 0 10,000 10,000 10,000<br />
104 Lifting Equipment & Systems Replacement Facilities 225 Papadopoulos, E. Operations Facilities <strong>Management</strong> operating 10 5035100 750 90 4654 00000 Hoists - Omer Lift Pin Parts - Center 0 2,500 2,500 2,500<br />
105 Lifting Equipment & Systems Replacement Facilities 225 Papadopoulos, E. Operations Facilities <strong>Management</strong> operating 10 5035100 750 91 4654 00000 Hoists - Omer Lift Pin Parts - Merlo 0 2,500 2,500 2,500<br />
106 Lifting Equipment & Systems Replacement Facilities 225 Papadopoulos, E. Operations Facilities <strong>Management</strong> operating 10 5035100 750 92 4654 00000 Hoists - Omer Lift Pin Parts - Powell 0 2,000 2,000 2,000<br />
107 Lifting Equipment & Systems Replacement Facilities 225 Papadopoulos, E. Operations Facilities <strong>Management</strong> operating 10 5035100 750 92 4654 00000 Hoists - In-ground Cylinder Rechroming - Powell 0 24,000 24,000 24,000<br />
108 Lloyd District Transit Tracker Enhancements Facilities 89 Park, Y. <strong>Capital</strong> Projects Bus Stop Development operating 10 5049162 763 99 5599 00000 Lloyd District Transit Hub 0 0 0 10,000 10,000<br />
109 Mall Shelters Maintenance Facilities 84 Papadopoulos, E. Operations Facilities <strong>Management</strong> operating 10 5049160 750 96 4506 00000 Mall Shelters Maintenance 0 6,250 6,250 6,250<br />
110 Neighborhood Shelters Refurbishment Facilities 83 Park, Y. <strong>Capital</strong> Projects Bus Stop Development operating 10 5049160 763 99 5593 00000 Neighborhood Shelters Refurbishment 0 100,000 100,000 100,000<br />
111 Neighborhood Shelters Replacement Facilities 83 Park, Y. <strong>Capital</strong> Projects Bus Stop Development operating 10 5049160 763 99 5524 00000 Neighborhood Shelters Replacement 0 30,000 30,000 30,000<br />
112 Other Building Systems & Equipment Facilities 229 Papadopoulos, E. Operations Facilities <strong>Management</strong> operating 10 5049151 750 90 4655 00000 Center - Brushes, Metering Guns, Fuel Nozzles, Hose Reels, Pumps, etc. 0 33,900 33,900 33,900<br />
113 Other Building Systems & Equipment Facilities 229 Papadopoulos, E. Operations Facilities <strong>Management</strong> operating 10 5049151 750 91 4655 00000 Merlo - Brushes, Metering Guns, Fuel Nozzles, Hose Reels, Pumps, etc. 0 33,900 33,900 33,900<br />
114 Other Building Systems & Equipment Facilities 229 Papadopoulos, E. Operations Facilities <strong>Management</strong> operating 10 5049151 750 92 4655 00000 Powell - Brushes, Metering Guns, Fuel Nozzles, Hose Reels, Pumps, etc. 0 33,700 33,700 33,700<br />
115 Park & Ride Signage and Shared Use Support Facilities 90 Park, Y. <strong>Capital</strong> Projects Bus Stop Development operating 10 5049167 763 99 5588 00000 Park & Ride Signage and Shared Use Support 0 25,000 25,000 25,000<br />
116 Powell - Blue Flame Building Demolition Facilities 114 Papadopoulos, E. Operations Facilities <strong>Management</strong> operating 10 5035100 750 92 4656 00000 Demolition of Powell Blue Flame Building 0 37,854 37,854 37,854<br />
117 Bldg. Area & Components - Layover Facilities 105 Papadopoulos, E. Operations Facilities <strong>Management</strong> operating 10 5049151 750 96 4657 00000 Refurbish Bus & Rail Operator Layover Facilities 0 40,000 40,000 40,000<br />
118 Renew the Blue Facilities 91 Batty, S. <strong>Capital</strong> Projects Development & Ops Support operating 10 5049162 760 99 4073 00000 Station Improvements (Hollywood to Gresham) 0 2,463,000 2,463,000 2,463,000<br />
119 Respond to ADA Audit Facilities 88 Batty, S. <strong>Capital</strong> Projects Development & Ops Support operating 10 5049164 760 99 5619 00000 Improvements to comply with ADA requirements 0 310,000 310,000 310,000<br />
120 Safety-Hazmat Systems Facilities 225 Papadopoulos, E. Operations Facilities <strong>Management</strong> operating 10 5049170 750 96 4658 00000 Replace CO2 Sensors (Clackamas Town Center) 0 6,193 6,193 6,193<br />
121 Site-Property Systems Facilities 226 Papadopoulos, E. Operations Facilities <strong>Management</strong> operating 10 5035100 750 92 4659 00000 Landscaping - Powell ATP 0 1,000 1,000 1,000<br />
122 Site-Property Systems Facilities 226 Papadopoulos, E. Operations Facilities <strong>Management</strong> operating 10 5035100 750 93 4659 00000 Landscaping - Ruby North 0 2,000 2,000 2,000<br />
123 Site-Property Systems Facilities 226 Papadopoulos, E. Operations Facilities <strong>Management</strong> operating 10 5035100 750 97 4659 00000 Landscaping - VT Barn 0 1,000 1,000 1,000<br />
124 Site-Property Systems Facilities 226 Papadopoulos, E. Operations Facilities <strong>Management</strong> operating 10 5049170 750 96 4659 00000 Lighting Repl. - Park & Rides 0 3,000 3,000 3,000<br />
125 Site-Property Systems Facilities 226 Papadopoulos, E. Operations Facilities <strong>Management</strong> operating 10 5049170 750 96 4659 00000 Lighting Repl. - Parking Lots/Transit Centers 0 6,000 6,000 6,000<br />
126 Site-Property Systems Facilities 226 Papadopoulos, E. Operations Facilities <strong>Management</strong> operating 10 5049170 750 96 4659 00000 Lighting Repl. - Foster Layover 0 500 500 500<br />
127 Site-Property Systems Facilities 226 Papadopoulos, E. Operations Facilities <strong>Management</strong> operating 10 5049170 750 96 4659 00000 Lighting Repl. - MAX Platforms Eastside 0 11,000 11,000 11,000<br />
128 Site-Property Systems Facilities 226 Papadopoulos, E. Operations Facilities <strong>Management</strong> operating 10 5035100 750 91 4659 00000 Lighting Repl. Merlo Employee Parking Lot 0 40,000 40,000 40,000<br />
129 Site-Property Systems Facilities 226 Papadopoulos, E. Operations Facilities <strong>Management</strong> operating 10 5049170 750 96 4659 00000 Fencing Chain Link Add - Willow Creek TC 0 3,000 3,000 3,000<br />
130 Site-Property Systems Facilities 226 Papadopoulos, E. Operations Facilities <strong>Management</strong> operating 10 5035100 750 93 4659 00000 Gate Operator Repl. - Ruby West 0 14,000 14,000 14,000<br />
131 Site-Property Systems Facilities 226 Papadopoulos, E. Operations Facilities <strong>Management</strong> operating 10 5035100 750 92 4659 00000 Paving - Employee Lot - Powell Maint 0 5,000 5,000 5,000<br />
132 Site-Property Systems Facilities 226 Papadopoulos, E. Operations Facilities <strong>Management</strong> operating 10 5049170 750 96 4659 00000 Paving - Park & Rides - 9 locations 0 114,971 114,971 114,971<br />
133 Site-Property Systems Facilities 226 Papadopoulos, E. Operations Facilities <strong>Management</strong> operating 10 5049170 750 93 4659 00000 Paving - Parking Lots - Ruby N, S, W 0 19,398 19,398 19,398<br />
134 Site-Property Systems Facilities 226 Papadopoulos, E. Operations Facilities <strong>Management</strong> operating 10 5049170 750 96 4659 00000 Paving - Substations 0 152 152 152<br />
135 Cable Plant Technology 147 White, R. Information Technology Information Technology operating 10 5049251 330 90 1014 00000 Data Communication Cable Plant 0 80,000 80,000 80,000<br />
136 Communication Environment Replacement - Operating Technology 150 White, R. Information Technology Information Technology operating 10 5049251 330 90 1095 00000 Communications Environment Total 0 14,250 14,250 14,250<br />
137 Data Communication Systems Replacement - Operating Technology 147, 236 White, R. Information Technology Information Technology operating 10 5049251 330 90 1095 00000 Switches & Routers, Remote Access, Wireless Network, Mgmt Tools 0 197,000 197,000 197,000<br />
138 Desktop Computing Replacement Technology 145 Fouts, M. Information Technology Information Technology operating 10 5049251 330 90 1091 00000 Desktop Computing Replacement 0 566,600 566,600 566,600<br />
139 IT Security Systems Replacement (operating) Technology 149 White, R. Information Technology Information Technology operating 10 5049251 330 90 1094 00000 IT Security Systems Replacement 0 4,000 4,000 4,000<br />
140 MAX Validators Replacement Technology 136 Tucker, C. Finance & Administration Fare Revenue operating 10 5049150 370 90 7574 00000 MAX Validators Replacement 0 60,000 60,000 60,000<br />
141 Fare Equipment Technology 139 Tucker, C. Finance & Administration Fare Revenue operating 10 5049151 370 90 7561 00000 Fare Equipment Replacement 0 5,200 5,200 5,200<br />
142 Servers Replacement Technology 146, 230 Fouts, M. Information Technology Information Technology operating 10 5049251 330 90 1070 00000 Servers Replacement 0 2,000 2,000 2,000<br />
143 TRACS - Door & Gate Readers Technology 142 Saporta Safety & Security Safety, Security & Environmental operating 10 5037025 712 90 7578 00000 TRACS - Door & Gate TRACS Readers 0 20,000 20,000 20,000<br />
144 Transit Tracker Displays (Blue & Red Lines) Technology 152 Frane, J. Public Affairs Customer Information Services operating 10 5049152 270 90 6021 00000 Transit Tracker Display (Blue & Red Lines) 0 235,000 235,000 235,000<br />
145 Customer Support Facilities & Equipment Technology 85 Vitko, I. Public Affairs Customer Information Services operating 10 5049152 270 90 2009 00000 Customer Info Equipment Replacement 0 25,000 25,000 25,000<br />
146 Customer Support Facilities & Equipment Technology 85 Vitko, I. Public Affairs Customer Information Services operating 10 5049152 270 90 2009 00000 Customer Info Modernization 0 5,000 5,000 5,000<br />
147 Willamette Shore Trolley Program New-Improved Svc 167 Batty, S. <strong>Capital</strong> Projects Development & Ops Support operating 10 5033081 760 99 5581 00000 Willamette Shore Trolley Program 0 125,000 125,000 200,000 325,000<br />
148<br />
149 Total $100,000 $141,773 $0 $5,150,000 $5,391,773 $45,723,518 $45,723,518 $210,000 $11,486,688 $62,811,979<br />
150 Total <strong>Capital</strong> Projects 50,409,536<br />
151 Total Operating Projects EXCLUDES Fixed Routes Bus Components & LRV Components 7,983,918<br />
Grand Total 58,393,454
ADOPTED <strong>FY</strong>13-14 <strong>Capital</strong> & Operating Project Budget by Division-Forecast - Carryovers<br />
Budget<br />
6/19/2013<br />
A B C D E F G H I J K L M N<br />
Requirements<br />
CFDA<br />
Detailed Project Description/ <strong>Asset</strong> Category Project Budgeted Budgeted Operating Cost Project Grant Total<br />
Detailed Project Name Manager Division Department <strong>Capital</strong> Fund Expense Center Section Number Extension<br />
1 On-Board Energy Storage Units Vehicles Grohs, J. <strong>Capital</strong> Projects Development & Ops Support capital 10 1052870 000 00 7570 18201 350,000 20.523<br />
2 Positive Train Control Vehicles Heilig, T. <strong>Capital</strong> Projects Development & Ops Support capital 10 1052870 000 00 7563 00000 3,836,156<br />
3 Vehicles - 60 (of 70 - <strong>FY</strong>13 Bus Order) Replacement Low-Floor 40' Buses Vehicles Haley, G. Operations Bus Maintenance capital 10 1052870 000 00 4058 20801 26,968,380 20.526<br />
4 Vehicles - ATP - Replacement 27 Buses + BDS Equipment (CO) Vehicles Elmore, P. Operations ATP-LIFT capital 10 1052870 000 00 4049 00000 2,273,259<br />
5 Electrification MOW Kindig, R. Operations Rail MOW capital 10 1052870 000 00 7535 00000 50,000<br />
6 Light Rail Track and Structures MOW Kindig, R. Operations Rail MOW capital 10 1052870 000 00 7559 00000 125,000<br />
7 Rail Pedestrian Safety Enhancements Facilities Saporta, H. Safety & Security Safety, Security, Environmental capital 10 1052870 000 00 5606 00000 275,000<br />
8 Bus Shelter Replacement Facilities Park, Y. <strong>Capital</strong> Projects Bus Stop Development capital 10 1052870 000 00 5508 00000 155,000<br />
9 Facilities - Barbur Transit Center Roof Facilities Papadopoulos, E. Operations Facilities <strong>Management</strong> capital 10 1052870 000 00 4507 00000 177,109109<br />
10 Facilities - Compressor Systems Energy Upgrades (CO) Facilities Papadopoulos, E. Operations Facilities <strong>Management</strong> capital 10 1052870 000 00 4546 00000 52,500<br />
11 Facilities - Concession Services Development - Beaverton TC (CO) Facilities Cook Operations Facilities <strong>Management</strong> capital 10 1052870 000 00 4580 00000 32,000<br />
12 Facilities - Gresham Center/Art Work Surrounding Area Renovation (CO) Facilities Papadopoulos, E. Operations Facilities <strong>Management</strong> capital 10 1052870 000 00 4627 00000 57,000<br />
13 Facilities - Hoist Equipment Replacement Facilities Papadopoulos, E. Operations Facilities <strong>Management</strong> capital 10 1052870 000 00 4547 00000 481,121<br />
14 Facilities - Permanent Operator Restrooms at Priority End-of-Route Locations (CO) Facilities Scott, R. Operations Facilities <strong>Management</strong> capital 10 1052870 000 00 5614 00000 193,420<br />
15 Facilities - Powell Maint Fire Alarm System Upgrade (CO) Facilities Papadopoulos, E. Operations Facilities <strong>Management</strong> capital 10 1052870 000 00 4631 00000 20,000<br />
16 Facilities - Powell Maint Mezzanine for Storage (CO) Facilities Papadopoulos, E. Operations Facilities <strong>Management</strong> capital 10 1052870 000 00 4632 00000 69,755<br />
17 Facilities - Ruby/Elmonica Type 4 LRV Fall Protection Retrofit - Safety Modification (CO) Vehicles Grove, Mark Operations Rail Equip Maintenance capital 10 1052870 000 00 7571 00000 487,000<br />
18 Pier Park Bus Layover/Operator Restroom Facility Facilities Stewart, N. <strong>Capital</strong> Projects Development & Ops Support capital 10 1052870 000 00 5512 00000 120,000<br />
19 Rail MOW Central Shop co-location Facilities Munro <strong>Capital</strong> Projects Development & Ops Support capital 10 1052870 000 00 5507 00000 2,996,150<br />
20 Storm Water UIC Permit Facilities Preston Safety & Security Environmental services capital 10 1052870 000 00 7568 00000 150,000<br />
21 Bus Dispatch Replacement Project (Fixed Route) Technology O'Connor, A.J. Information Technology Information Technology capital 10 1052870 000 00 1054 00000 11,235,348<br />
22 ATP Information System (BDS) Technology Maercklein, D. Information Technology Information Technology capital 10 1052870 000 00 1081 00000 1,973,083<br />
23 Finance & Admin Sys/ACCPAC Accounts Rec Upgrade Technology Baker, L. Finance and Admin Financial Services capital 10 1052870 000 00 1021 00000 40,000<br />
24 Finance & Admin Sys/Agency Copier <strong>Capital</strong> Lease Technology Baker, L. Finance and Admin Financial Services capital 10 1111060 000 00 2028 00000 30,000<br />
25 IPC System Replacement Technology Isbell, F. Information Technology Information Technology capital 10 1052870 000 00 1104 00000 100,000<br />
26 Ticket Vending Machine System Technology Baker, L. Finance and Admin Financial Services capital 10 1052870 000 00 1100 00000 115,000<br />
27 Non-Revenue Vehicles