Graphing Guide - Nielsen
Graphing Guide - Nielsen
Graphing Guide - Nielsen

Create successful ePaper yourself
Turn your PDF publications into a flip-book with our unique Google optimized e-Paper software.
<strong>Guide</strong><br />
<strong>Graphing</strong><br />
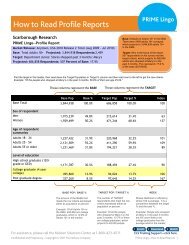
PRIME Lingo<br />
The <strong>Graphing</strong> feature is available within the Report Builder screen.<br />
After building your report, click the graph icon to launch the Graph Builder.<br />
The default graph will include the first column (target) of data and first subcategory<br />
of rows graphed on Target %. You can modify these elements as well as edit the type<br />
and color of graph, data labels, and more. If you want to change the type of graph or<br />
format display elements, click Options at the top of the screen.<br />
For assistance, please call the <strong>Nielsen</strong> Solutions Center at 1-800-423-4511.<br />
Confidential and Proprietary—Copyright © 2011 The <strong>Nielsen</strong> Company<br />
1 Enroll 2 Download 3 Watch<br />
CLS Training Support—click here.<br />
Prime Lingo—<strong>Graphing</strong> 1
<strong>Graphing</strong><br />
PRIME Lingo<br />
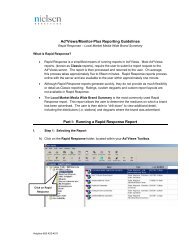
Formatting Options<br />
General tab<br />
Show or add a title<br />
to your graph or<br />
change graph type.<br />
Display tab<br />
Modify display options such<br />
as font, legend, and labels.<br />
Note: It’s suggested that you<br />
uncheck “Show Sub Category<br />
Labels” and save as default at<br />
the bottom of the screen to<br />
keep your data labels concise.<br />
Axis Labels tab<br />
Include, exclude<br />
and/or customize<br />
Axis Labels.<br />
Color Themes tab<br />
Change the color theme<br />
of your graph.<br />
Data Labels tab<br />
Edit Data Labels<br />
by double-clicking<br />
within the label<br />
you wish to change.<br />
When you have finished changing the options on your graph,<br />
you can check the Save as Default Options box and the selections<br />
you made will be reflected in all subsequent graphs you create.<br />
Click OK to update your graph.<br />
Here is the modified graph:<br />
For assistance, please call the <strong>Nielsen</strong> Solutions Center at 1-800-423-4511.<br />
Confidential and Proprietary—Copyright © 2011 The <strong>Nielsen</strong> Company<br />
1 Enroll 2 Download 3 Watch<br />
CLS Training Support—click here.<br />
Prime Lingo—<strong>Graphing</strong> 2
<strong>Graphing</strong><br />
PRIME Lingo<br />
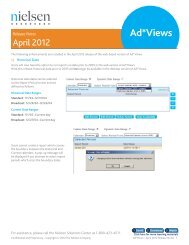
Modifying Graph Elements<br />
You can change any or all of the data elements and measures of your graph by<br />
using the drop-down menus and selecting the targets and rows to be included.<br />
These are the options for changing an existing graph:<br />
1.) Select Base from the drop-down menu.<br />
2.) Select the Measure from the drop-down menu.<br />
3.) Highlight the Series (Column/Target).<br />
4.) Highlight the Range (Rows). Use the CTRL or Shift key to select multiple rows.<br />
Click Refresh.<br />
1<br />
2<br />
3<br />
To create an additional graph with the different elements, click the New Graph<br />
tab first and then follow the steps outlined above.<br />
4<br />
For assistance, please call the <strong>Nielsen</strong> Solutions Center at 1-800-423-4511.<br />
Confidential and Proprietary—Copyright © 2011 The <strong>Nielsen</strong> Company<br />
1 Enroll 2 Download 3 Watch<br />
CLS Training Support—click here.<br />
Prime Lingo—<strong>Graphing</strong> 3
<strong>Graphing</strong><br />
PRIME Lingo<br />
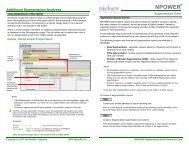
Creating Graphs for Multiple Targets<br />
When you are working with multiple targets, you may want to create different graphs for both or compare the data side-by-side.<br />
To create the same graph for multiple targets:<br />
• Highlight the data you’d like to graph,<br />
holding the CTRL key to select multiple<br />
targets or rows.<br />
• Click the green plus sign next to<br />
Series (Columns).<br />
• Additional graphs will be created<br />
for every item you’ve highlighted<br />
on separate tabs.<br />
To create a graph comparing multiple Targets<br />
side-by-side:<br />
• Highlight the selections to be graphed,<br />
holding the CTRL key to select multiple Targets.<br />
• Click Refresh.<br />
To see the data behind each individual graph,<br />
click Data at the top of the screen.<br />
For assistance, please call the <strong>Nielsen</strong> Solutions Center at 1-800-423-4511.<br />
Confidential and Proprietary—Copyright © 2011 The <strong>Nielsen</strong> Company<br />
1 Enroll 2 Download 3 Watch<br />
CLS Training Support—click here.<br />
Prime Lingo—<strong>Graphing</strong> 4
<strong>Graphing</strong><br />
PRIME Lingo<br />
Using Graphs<br />
You can either download graphs as PDF files, or copy and paste them into other documents.<br />
To create a PDF file, click Download as Adobe PDF at the top of the screen.<br />
To use your graph(s) in another document, such as PowerPoint, Word or email,<br />
right-click over the graph, click Copy, and paste into your document.<br />
When finished graphing, click the X in the top right corner to return to the Report Builder.<br />
Note: Closing the Graph Builder will clear any graphs you have built, so download, or<br />
copy and paste any graphs you want prior to closing the graph window.<br />
For assistance, please call the <strong>Nielsen</strong> Solutions Center at 1-800-423-4511.<br />
Confidential and Proprietary—Copyright © 2011 The <strong>Nielsen</strong> Company<br />
1 Enroll 2 Download 3 Watch<br />
CLS Training Support—click here.<br />
Prime Lingo—<strong>Graphing</strong> 5