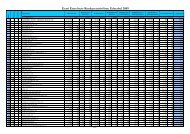
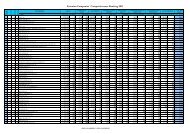
Photo: Toomas Tuul Business Service and Real Estate Enterprises Place Sales Change Net profit Change Return Labour costs Efficiency per Investments % Enterprise in sales in net profit on equity per employee employee of the first *group th. EEK place % place th. EEK place % place % place EEK/month place th. EEK place th. EEK place (0...100) 1 EKE INVEST AS* 286,713 2 128.0 12 303,625 1 186.4 5 43.3 13 19,207 14 1,274 13 64,547 4 100.0% 2 MAINOR AS* 325,447 1 123.4 14 117,958 2 55.7 18 13.3 20 18,882 16 1,017 16 143,918 2 82.8% 3 ÜLEMISTE CITY AS 98,187 6 180.4 6 112,430 3 141.8 8 14.8 19 31,833 5 4,269 4 123,993 3 79.8% 4 ÜLIKOOLILINNA ÄRIKESKUS AS 23,393 12 1,124.1 1 -399 29 -0.5 28 2,979 28 5,848 3 275,312 1 77.4% 5 AIR MAINTENANCE ESTONIA AS 198,331 3 119.0 17 29,824 4 307.9 2 96.0 4 32,003 4 1,280 12 5,275 6 75.5% 6 BLOOM OÜ 1,584 29 3,088.9 2 77 25 227.5 3 200.0 2 10,056 24 792 19 326 19 66.6% 7 ADVISIO OÜ* 10,393 22 272.7 3 3,436 11 532.9 1 119.3 3 21,082 13 799 18 200 21 64.5% 8 UTILEEK OÜ 20,649 13 208.6 4 1,992 13 64.1 16 510.7 1 15,530 19 2,950 8 3,300 7 58.3% 9 CORPORE AS* 24,902 10 132.2 10 3,531 10 225.2 4 63.6 7 43,355 1 1,660 11 88 22 57.6% 10 ITELLA INFORMATION AS 171,161 5 118.0 20 11,199 5 131.0 10 55.9 9 22,972 11 3,423 6 2,400 8 53.5% 11 KPMG BALTICS AS* 175,740 4 118.0 19 5,052 9 99.1 15 44.9 12 28,595 8 751 20 1,012 13 50.6% 12 RIMESS OÜ 54,644 9 118.5 18 9,160 7 114.5 12 72.1 5 29,418 7 658 21 1,400 12 42.2% 13 AF-ESTIVO AS 73,705 7 110.9 24 585 19 19.6 22 13.1 21 32,229 3 3,879 5 6 26 40.6% 14 NELI TUBA OÜ 20,449 14 123.7 13 1,132 14 18.6 24 16.8 18 1,995 29 20,449 1 1,611 11 38.8% 15 BDA CONSULTING OÜ 18,772 15 130.6 11 998 15 35.1 21 50.0 11 35,476 2 1,707 10 415 15 38.2% 16 CENTRALPHARMA COMMUNICATIONS OÜ 24,668 11 119.8 16 783 17 61.9 17 22.7 16 31,625 6 1,121 14 403 16 34.4% 17 IN NOMINE OÜ 4,400 24 183.3 5 219 24 100 14 67.8 6 24,361 10 880 17 28 33.6% 18 ESMA VARA AS 17,928 16 152.5 7 9,407 6 148.4 7 10.8 22 6,946 25 8,964 2 18 24 33.5% 19 RIIGIRESSURSSIDE KESKUS OÜ* 66,080 8 106.6 25 651 18 1.6 27 0.1 27 11,556 22 3,304 7 62,531 5 28.1% 20 RUUT DISAIN OÜ* 11,402 21 111.5 23 573 20 154.5 6 58.3 8 15,193 20 600 22 622 14 27.0% 21 FINANCE MANAGEMENT OÜ 3,483 26 133.8 9 227 23 100 13 55.1 10 19,142 15 435 28 272 20 26.2% 22 OSAÜHING EVENTUS EA 12,095 19 114.9 21 31 26 7.0 25 2.8 25 28,044 9 465 27 57 23 24.5% 23 KOOPIA NIINI & RAUAM OÜ 16,304 17 121.2 15 2,807 12 120.3 11 38.9 14 13,793 21 543 23 1,682 10 23.7% 24 AMC AMARIS AS 2,071 27 135.8 8 874 16 138.4 9 25.2 15 11,394 23 518 25 29 20.7% 25 <strong>TOP</strong> GRAPHIC OÜ 7,591 23 79.5 29 287 21 37.4 20 3.8 23 21,683 12 1,084 15 27 20.7% 26 A.KANGUST & PARTNERID OÜ 4,019 25 112.7 22 234 22 19.1 23 21.4 17 17,720 17 502 26 344 18 17.5% 27 MR STUUDIO OÜ 11,408 20 99.7 26 -348 28 -10.6 29 16,223 18 519 24 2,335 9 13.8% 28 EMAJÕE ÄRIKESKUS AS 15,904 18 86.6 28 5,209 8 53.0 19 3.1 24 6,107 26 2,272 9 386 17 13.0% 29 SALESFORCE OÜ 1,754 28 94.0 27 4 27 3.1 26 2.7 26 5,563 27 92 29 6 25 4.3% www.konkurents.ee 1 EUR = 15.6466 EEK; 1 EEK = 0.0639 EUR; based on 2008 data 60
Swedbank AS The Most Competitive Financial Brokerage Enterprise 2009 Photo: Toomas Tuul PRIIT PERENS An organisation capable of change SWEDBANK AS 2008: Priit Perens, the manager of Swedbank in Estonia, says that he has never knowingly imagined himself as a bank manager, but rather considers himself to be a financial and enterprise banking specialist. Retail banking was a new and interesting world for him to thoroughly dive in. If we look at the previous year, a memorable and very visible change took place in the Estonian banking world – while the year began as Hansapank, by the turn of the year the bank carried the name Swedbank. Sales (th EEK) 15,553,500 Change in sales 103.3 % Net profit (th EEK) 6,109,100 Change in net profit 82.9 % Number of employees 8,326 Investments (th EEK) 886,200 Return on equity 18.8 % 61