TOP ESTONIAN ENTERPRISES
TOP ESTONIAN ENTERPRISES
TOP ESTONIAN ENTERPRISES

You also want an ePaper? Increase the reach of your titles
YUMPU automatically turns print PDFs into web optimized ePapers that Google loves.
EESTI TELEKOM AS 2008:<br />
Sales (th EEK) 6,189,597<br />
Change in sales 98.9 %<br />
Net profit (th EEK) 1,438,265<br />
Change in net profit 95.2 %<br />
Number of employees 2,341<br />
Investments (th EEK) 754,782<br />
Return on equity 33.4 %<br />
Photo: Toomas Tuul<br />
VALDO KALM<br />
100,000 people unemployed and this will have a<br />
significant effect on consumption. The way to<br />
think is that things will be good but to be ready<br />
for the situation turning bad. There is little reason<br />
for great optimism this year.”<br />
In spite of difficult times, product development<br />
has continued at the enterprise and in connection<br />
with that, investments have not been significantly<br />
reduced either. The key words of product<br />
development and innovation in 2008 have<br />
been internet calls, the e-health project, 3.5 G<br />
network and the development of digital TV.<br />
Finally, one would assume that a director of a<br />
telecommunications enterprise replaces his<br />
phone every six months. It appears that this is<br />
currently not the case. Kalm has conducted his<br />
business with one phone for the last three<br />
years. He has probably used the same phone to<br />
make the calls that improve the information society.<br />
“We can see that our country is operating<br />
in a manner that is too costly. We must simply<br />
find other possibilities and information technology<br />
will surely help make society less expensive,”<br />
he throws ideas in the air with a sparkle in<br />
his eyes. •<br />
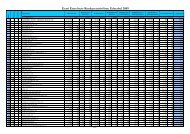
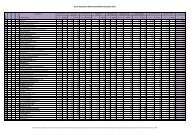
Communication and IT-services Enterprises<br />
Place<br />
Sales Change Net profit Change Return Labour costs Efficiency per Investments %<br />
Enterprise in sales in net profit on equity per employee employee of the first<br />
*group<br />
th. EEK place % place th. EEK place % place % place EEK/month place th. EEK place th. EEK place (0...100)<br />
1 EESTI TELEKOM AS* 6,189,597 1 98.9 17 1,438,265 1 95.2 16 33.4 10 31,512 9 2,644 6 754,782 1 100.0%<br />
2 EMT AS* 3,682,000 2 94.3 19 965,000 2 103.2 10 57.8 3 33,988 7 6,731 2 297,000 4 87.9%<br />
3 TELE2 EESTI AS 1,753,903 4 92.4 20 534,665 3 101.6 11 19.7 15 28,209 12 8,392 1 315,509 3 71.3%<br />
4 ELION ETTEVÕTTED AS* 3,293,383 3 106.7 14 488,441 4 82.4 17 23.8 14 26,672 14 2,200 7 428,000 2 63.3%<br />
5 LINXTELECOM ESTONIA OÜ 93,858 8 137.0 5 10,189 8 411.0 2 36.9 7 41,525 1 3,129 5 7,691 5 61.7%<br />
6 TELEGRUPP AS 148,429 7 129.3 9 14,215 7 127.4 8 62.1 2 32,924 8 3,227 4 1,174 13 49.5%<br />
7 SONA SYSTEMS OÜ 5,476 21 133.6 7 2,888 11 162.3 6 82.8 1 11,222 21 5,476 3 779 16 47.4%<br />
8 HELMES AS* 212,681 5 130.6 8 19,521 6 116.3 9 34.6 8 41,017 2 2,085 8 3,994 8 46.9%<br />
9 REAALSÜSTEEMID AS 12,184 17 92.3 21 2,025 12 525.2 1 13.1 17 21,099 16 1,108 10 98 20 44.0%<br />
10 MOBI SOLUTIONS OÜ* 23,686 13 128.5 10 2,894 10 343.0 3 53.5 5 19,988 17 987 13 89 22 43.8%<br />
11 REGIO AS 71,687 9 136.6 6 5,889 9 166.5 5 33.1 11 35,214 5 919 14 3,489 9 42.4%<br />
12 WEBMEDIA AS 169,151 6 125.8 11 29,696 5 134.4 7 43.6 6 34,851 6 842 15 4,088 7 42.4%<br />
13 NOW! INNOVATIONS OÜ 8,047 19 443.7 1 183 19 54.2 19 30.8 12 12,875 20 1,006 12 21 41.4%<br />
14 USESOFT AS 25,375 12 98.8 18 738 16 215.8 4 34.5 9 25,998 15 1,336 9 300 19 38.4%<br />
15 EKTACO AS 27,599 11 116.2 12 1,729 13 81.3 18 25.3 13 28,138 13 1,022 11 1,148 15 33.0%<br />
16 ADM INTERACTIVE OÜ 17,830 15 101.0 16 410 18 16.5 20 13.8 16 35,249 4 615 19 23 30.7%<br />
17 ITVILLA OÜ 320 24 193.2 4 26 20 100 15 53.6 4 3,575 24 320 21 24 27.0%<br />
18 AQRIS SOFTWARE AS 16,000 16 78.5 23 -789 22 -5.1 19 35,860 3 571 20 1,161 14 26.9%<br />
19 NETLEAD OÜ 10,083 18 203.4 3 1,317 14 100 12 28,828 11 672 16 477 18 26.0%<br />
20 SQA PARTNERS OÜ 23,440 14 115.6 13 753 15 100 13 10.9 18 15,761 18 297 22 4,554 6 23.3%<br />
21 ANDMEVARA AS 42,198 10 85.1 22 -5,548 24 -36.3 21 30,524 10 659 17 2,597 10 20.1%<br />
22 TRACKING CENTER OÜ 7,590 20 293.9 2 522 17 100 14 7,687 23 632 18 2,209 12 19.4%<br />
23 NUTITEQ OÜ 954 23 105.4 15 -107 21 -28.2 20 9,407 22 238 23 691 17 10.0%<br />
24 MODESAT COMMUNICATIONS OÜ 1,360 22 54.0 24 -2,412 23 -53.8 22 12,879 19 113 24 2,249 11 5.1%<br />
www.konkurents.ee<br />
1 EUR = 15.6466 EEK; 1 EEK = 0.0639 EUR; based on 2008 data<br />
57