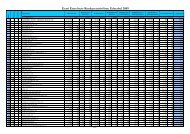
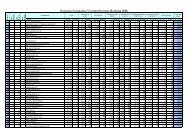
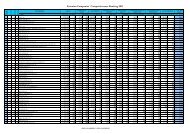
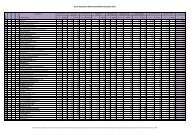
Industrial and Energy Enterprises Place Sales Change Net profit Change Return Labour costs Efficiency per Investments % Enterprise in sales in net profit on equity per employee employee of the first *group th. EEK place % place th. EEK place % place % place EEK/month place th. EEK place th. EEK place (0...100) 57 METOS AS 157,306 33 100.2 79 13,263 33 94.5 63 28.4 35 19,865 56 1,808 37 673 74 34.7% 58 ROOTSI MÖÖBEL AS 92,979 47 110.7 51 10,204 37 81.0 71 19.7 60 19,053 61 2,113 28 1,639 67 34.3% 59 VÄO PAAS OÜ* 84,213 52 80.5 106 10,640 36 62.0 77 19.6 61 28,424 16 1,477 48 10,965 24 34.3% 60 SVARMIL AS 93,623 46 103.1 72 2,262 73 333.9 4 11.8 80 12,943 92 426 101 2,830 56 34.2% 61 UPM-KYMMENE OTEPÄÄ AS 244,986 26 79.9 108 41,763 20 46.4 91 17.0 67 19,487 58 1,591 44 110,693 5 33.7% 62 FEIN-ELAST ESTONIA OÜ 74,193 54 100.3 78 9,696 39 120.5 40 18.4 63 20,052 54 1,405 51 6,240 34 33.5% 63 PAEKIVITOODETE TEHASE OÜ 129,205 39 91.9 95 19,019 28 82.3 70 22.5 50 22,320 41 916 77 37,655 10 33.2% 64 AS SUWEM 45,181 67 106.7 64 5,177 58 166.0 23 34.3 25 15,247 75 922 76 314 85 33.2% 65 WELLSPA OÜ* 56,065 61 87.0 100 11,857 34 88.4 65 44.0 14 16,673 72 1,933 32 476 80 33.1% 66 NUIA PMT AS 69,076 57 107.9 60 6,238 51 80.5 72 20.0 59 22,583 36 959 71 5,291 41 33.0% 67 WIGEN SINDI OÜ 11,526 99 109.0 57 1,381 84 221.1 12 43.8 15 12,525 94 226 108 79 98 32.9% 68 ESRO AS* 87,249 50 109.1 55 2,530 71 31.3 95 3.3 102 21,955 43 1,781 39 55,591 8 32.8% 69 NURME TURVAS AS 12,160 98 149.0 12 2,079 76 124.6 37 22.7 49 13,859 82 553 96 3,207 53 32.7% 70 CIPAX EESTI AS 87,574 49 116.3 40 3,217 65 27.9 96 5.4 98 20,946 52 1,751 41 34,614 13 32.4% 71 MERINVEST OÜ 152,468 35 112.1 48 5,578 55 143.6 30 24.9 44 15,808 74 649 89 2,926 55 32.2% 72 CLYDE BERGEMANN EESTI AS 88,842 48 101.3 77 203 99 100 57 6.3 96 23,954 27 846 80 1,860 64 32.0% 73 EVO DESIGN OÜ 19,046 88 175.3 4 165 102 100 58 12.9 78 11,036 101 595 92 1,809 65 32.0% 74 TIPTIPTAP OÜ 24,275 84 123.7 30 1,070 90 38.8 92 31.1 31 18,241 66 1,055 64 245 90 31.7% 75 CARAMEL MODA OÜ 11,469 100 135.2 18 1,582 82 155.0 27 17.8 65 11,503 96 882 79 106 31.6% 76 INTERCONNECT PRODUCT ASSEMBLY AS 128,385 40 138.4 16 8,551 43 100 53 24.2 45 12,785 93 669 88 777 72 31.5% 77 ENERPOINT SAARE OÜ 151,989 36 110.9 50 5,985 52 134.2 32 21.9 51 13,956 81 993 67 939 68 31.4% 78 DALE LD AS 50,104 63 93.7 89 4,987 59 58.5 79 18.1 64 22,489 37 1,023 66 17,044 18 31.2% 79 TECHNOMAR & ADREM AS 501,005 13 87.2 97 129,002 6 82.8 69 17.5 66 10,778 102 842 82 107 30.9% 80 MEENED OÜ* 3,437 110 126.7 28 398 97 223.9 11 27.4 38 7,900 107 181 111 111 30.6% 81 TARKON AS 691,441 10 99.0 82 17,732 29 51.7 87 15.0 73 13,398 88 1,297 55 4,600 44 30.2% 82 KALTSIIT AS 40,927 71 82.3 105 7,308 45 58.3 80 16.3 69 23,537 30 974 70 4,081 45 30.2% 83 LASERSTUUDIO OÜ 5,070 107 108.1 59 -54 108 -11.9 106 28,304 17 845 81 883 70 29.7% 84 TERASVARA OÜ 12,966 94 105.1 68 477 93 55.8 84 8.2 91 21,889 44 648 90 410 82 29.4% 85 STRUCTO INDUSTRY OÜ 30,911 80 102.3 74 400 96 18.2 102 9.3 85 20,725 53 1,288 56 261 89 29.0% 86 ESTIKO-PLASTAR AS 280,931 21 95.8 85 1,923 78 12.7 104 2.6 103 18,224 68 1,778 40 7,098 31 28.8% 87 MS BALTI TRAFO OÜ 48,165 65 116.9 38 5,948 53 128.1 35 18.6 62 12,200 95 288 104 8,662 28 28.8% 88 ESFIL TEHNO AS 15,260 92 114.0 44 3,985 62 112.2 46 63.0 8 6,367 108 203 110 44 100 28.7% 89 VOKA MASIN AS 22,904 85 114.1 43 680 91 56.9 82 21.0 56 15,167 76 587 93 514 78 28.1% 90 KRISLING AS 26,310 83 93.7 90 456 94 19.3 100 9.1 87 22,410 39 797 85 108 96 27.9% 91 RAPALA EESTI AS* 136,883 38 94.5 88 51,689 12 101.0 52 26.1 41 10,001 104 563 94 920 69 27.9% 92 M JA P NURST AS 120,837 42 106.3 66 4,575 60 56.3 83 13.4 76 13,827 83 982 69 5,700 39 27.6% 93 AUGLI METALL OÜ 7,364 106 132.8 20 114 103 18.7 101 16.8 68 11,190 99 736 86 721 73 26.4% 94 STANDARD AS* 249,088 25 91.9 94 5,689 54 34.8 93 7.9 93 14,454 77 1,038 65 14,072 21 26.4% 95 MISTRA-AUTEX AS 188,000 29 87.0 99 2,592 70 32.3 94 5.4 97 17,513 70 954 72 3,900 48 26.3% 96 REWOOL OÜ 3,847 109 142.2 14 55 105 100 60 4.7 99 8,385 106 214 109 200 91 26.2% 97 UNIPLAST OÜ 42,274 70 93.4 91 1,510 83 87.1 67 9.2 86 13,176 90 939 75 455 81 26.2% 98 DELUX DOMOTEX OÜ 123,977 41 80.3 107 11,014 35 62.7 76 20.1 57 13,133 91 992 68 3,900 47 26.1% 99 EKSAMO AS 17,202 91 87.2 98 113 104 100 59 11.0 81 14,317 79 491 98 3,507 51 25.7% 100 VELMA MÖÖBEL OÜ 12,883 95 115.6 42 177 100 21.1 99 8.1 92 13,813 84 716 87 830 71 25.5% 101 ENICS EESTI AS* 990,722 7 113.5 45 39,167 22 181.1 17 14,207 80 1,869 35 16,198 19 24.9% 102 AUDES LLC OÜ 37,776 75 110.6 52 2,361 72 49.7 88 8.9 88 11,244 98 461 100 2,984 54 24.5% 103 MIVAR AS* 180,338 31 94.6 86 6,499 49 53.8 85 9.4 84 11,267 97 562 95 11,150 23 24.5% 104 SUN TIMBER OÜ 12,186 97 90.1 96 1,290 87 109.3 49 41.4 19 4,518 111 358 103 290 86 24.0% 105 HOLZ PROF OÜ 1,495 111 117.6 37 -97 109 -25.3 108 18,230 67 498 97 109 23.7% 106 LEKU METALL AS 8,085 103 83.8 104 209 98 48.5 90 6.3 95 14,404 78 622 91 180 92 23.5% 107 PRO FIKSUM OÜ 7,900 105 85.9 101 172 101 6.7 106 4.4 100 5,206 110 2,633 17 273 87 22.5% 108 ESTRE AS 34,210 79 92.1 93 -3,178 111 -19.5 107 13,201 89 475 99 1,667 66 19.7% 109 RONI REM AS* 17,523 90 73.0 110 -48 107 -0.7 105 8,409 105 237 107 110 17.0% 110 PINUS ABJA OÜ 8,030 104 75.6 109 30 106 8.7 105 0.6 104 6,012 109 268 106 572 76 16.3% 111 PLASTSYS OÜ 10,333 101 97.9 84 -297 110 -147.0 109 24,667 24 939 74 120 95 15.1% www.konkurents.ee 1 EUR = 15.6466 EEK; 1 EEK = 0.0639 EUR; based on 2008 data 50
A. Le Coq AS The Most Competitive Food Industry Enterprise 2009 Photo: Toomas Tuul TARMO NOOP By surprising the consumers The team of A. Le Coq has proven that when the idea is good, then it is possible to win the market fast. Surely many are reminded here how this summer the market of drinks were in good sense overflood with Estonian own fermented kvass. Some things can be especially fast and wittily done: thus the drink producer decided not to do anything at first glance – the old beer “Alexander“ with the trademark with traditions was taken and bottled into the can of a pint for a change. The company’s manager Tarmo Noop confirms that this beer has had phenomenal success in the recent times and it is fast rising brand, whereby without advertising costs. People need something special. It was the same when some years ago the folium cover was put back on the beer can – only this fact increased the sale of can beer by 60%. But the below interview is not only about the victories. A. LE COQ AS 2008: Sales (th EEK) 1,126,485 Change in sales 97.4 % Net profit (th EEK) 186,371 Change in net profit 110.9 % Number of employees 396 Investments (th EEK) 52,594 Return on equity 21.1 % 51