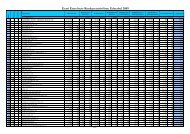
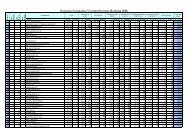
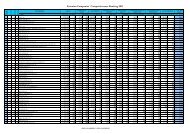
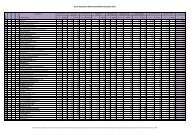
Small and Medium-sized Enterprises Place Sales Change Net profit Change Return Labour costs Efficiency per Investments % Enterprise in sales in net profit on equity per employee employee of the first *group th. EEK place % place th. EEK place % place % place EEK/month place th. EEK place th. EEK place (0...100) 131 KINDLUSTUSEST KINDLUSTUSMAAKLER OÜ 15,384 117 108.9 96 532 115 30.0 137 19.2 99 21,542 72 440 170 99 125 22.5% 132 SAMESTI METALL OÜ 3,280 173 122.1 63 45 160 88.4 87 9.1 133 24,156 53 656 144 44 143 22.4% 133 GVANDRON OÜ 2,228 179 144.0 30 525 116 154.0 37 64.6 17 13,370 145 557 157 1,316 46 22.3% 134 FINANCE MANAGEMENT OÜ 3,483 169 133.8 39 227 136 100 69 55.1 25 19,142 94 435 171 272 102 22.3% 135 EMAJÕE ÄRIKESKUS AS 15,904 114 86.6 156 5,209 24 53.0 122 3.1 149 6,107 177 2,272 53 386 85 22.3% 136 PAG AS 28,607 74 39.5 186 -459 179 -4.9 168 16,879 116 4,087 27 460 77 22.3% 137 V.V.TRAVEL AGENCY OÜ 9,608 137 106.0 106 447 125 167.0 31 43.1 42 3,503 184 4,804 19 161 22.2% 138 SIRKEL & MALL OÜ 14,245 119 127.3 53 457 122 39.0 129 22.1 91 19,140 95 396 172 662 66 22.1% 139 BEAM BALTIC OÜ* 2,959 176 110.8 89 321 131 77.7 100 52.6 29 16,720 119 2,959 38 163 22.1% 140 AP TRADING AS 12,259 124 113.5 80 -145 173 -7.4 171 22,978 60 2,043 61 166 21.7% 141 ASPER BIOTECH AS 17,725 108 112.2 84 95 154 13.8 154 1.0 160 20,432 80 443 168 624 68 21.4% 142 EKSAMO AS 17,202 110 87.2 154 113 151 100 73 11.0 125 14,317 138 491 164 3,507 20 21.2% 143 LASERSTUUDIO OÜ 5,070 159 108.1 99 -54 169 -11.9 174 28,304 35 845 125 883 56 21.1% 144 MEGARAM OÜ 2,969 175 129.7 48 38 161 100 75 63.8 19 16,748 118 371 174 184 21.1% 145 ESTNOR OÜ 22,088 93 91.4 147 4 166 4.2 163 0.1 164 18,955 97 818 130 178 21.0% 146 MAVAM OÜ 2,501 178 101.1 122 356 130 86.1 91 21.7 92 20,427 81 834 127 176 20.8% 147 Ü&A AS 19,206 102 79.6 169 -319 175 -3.3 167 18,680 101 2,134 57 534 74 20.6% 148 SUJA EHITUS OÜ 33,569 64 94.9 137 -1,818 184 -43.8 180 17,299 112 1,119 101 2,209 33 20.5% 149 MEENED OÜ* 3,437 171 126.7 54 398 128 223.9 21 27.4 78 7,900 172 181 184 186 20.5% 150 <strong>TOP</strong> GRAPHIC OÜ 7,591 148 79.5 170 287 132 37.4 131 3.8 147 21,683 71 1,084 104 172 20.1% 151 AMC AMARIS AS 2,071 180 135.8 34 874 103 138.4 42 25.2 84 11,394 156 518 161 182 20.1% 152 KEMEHH OÜ 5,455 156 103.4 118 1,098 94 119.0 50 29.6 72 10,835 162 364 175 1,023 54 19.4% 153 TRACKING CENTER OÜ 7,590 149 293.9 7 522 117 100 68 7,687 173 632 146 2,209 34 19.1% 154 SWEDEST MOTEL GROUP AS 15,451 116 100.3 124 140 147 81.9 95 0.7 161 11,114 159 483 165 422 79 18.9% 155 ELEKTRIMEES OÜ 15,196 118 67.8 179 96 153 4.3 161 2.8 151 17,611 111 1,169 98 171 18.8% 156 VELMA MÖÖBEL OÜ 12,883 122 115.6 77 177 142 21.1 144 8.1 138 13,813 141 716 143 830 58 18.6% 157 SILVA-AGRO AS 27,042 78 104.5 113 9 165 4.3 162 0.2 163 8,394 170 901 119 388 84 18.5% 158 REALISTER OÜ* 9,470 138 135.6 36 -415 178 -42.6 179 19,371 92 947 115 338 91 18.4% 159 TVS PARTNERID AS 20,471 97 83.8 161 -555 180 -33.8 178 16,401 121 1,077 105 63 136 18.3% 160 A.KANGUST & PARTNERID OÜ 4,019 166 112.7 83 234 135 19.1 146 21.4 93 17,720 110 502 162 344 89 18.2% 161 SUN TIMBER OÜ 12,186 125 90.1 151 1,290 87 109.3 59 41.4 44 4,518 182 358 176 290 98 18.1% 162 MAASIKAS & KO OÜ 19,319 101 111.2 88 250 133 32.1 135 7.4 141 7,654 174 878 122 1,192 48 18.0% 163 HAUGER OÜ 5,454 157 146.3 28 138 148 85.8 93 43.2 41 5,995 179 1,364 91 170 18.0% 164 LRF PRIVATE OÜ 9,726 136 78.1 172 70 158 6.2 159 2.0 156 15,959 125 1,945 66 22 151 17.9% 165 DEMJANOV AS 21,758 95 94.7 138 -572 181 -10.3 172 13,476 143 473 166 197 115 17.8% 166 LEKU METALL AS 8,085 141 83.8 162 209 139 48.5 125 6.3 143 14,404 136 622 148 180 116 17.5% 167 ET TOREL OÜ* 16,212 112 73.3 177 160 145 3.6 164 1.9 157 14,361 137 600 151 223 109 17.5% 168 B.I.A. OÜ 3,045 174 205.1 14 211 138 100 71 14,164 139 338 177 249 105 17.3% 169 LÄÄNE AGROVARU OÜ 4,354 165 99.6 127 -73 170 -7.3 170 17,897 109 1,451 86 22 152 17.3% 170 MR STUUDIO OÜ 11,408 131 99.7 126 -348 176 -10.6 173 16,223 122 519 160 2,335 30 17.2% 171 BORTER TRADE OÜ 7,987 144 113.0 81 4 167 1.5 168 2.9 150 14,508 135 1,141 99 141 119 17.2% 172 PLASTSYS OÜ 10,333 134 97.9 135 -297 174 -147.0 183 24,667 48 939 116 120 121 17.0% 173 AUGLI METALL OÜ 7,364 150 132.8 41 114 150 18.7 148 16.8 103 11,190 158 736 141 721 61 17.0% 174 ITVILLA OÜ 320 186 193.2 15 26 164 100 76 53.6 26 3,575 183 320 178 185 17.0% 175 REWOOL OÜ 3,847 168 142.2 31 55 159 100 74 4.7 145 8,385 171 214 183 200 112 16.9% 176 EDELSTEIN OÜ 3,418 172 77.7 173 107 152 14.9 153 7.1 142 17,119 113 854 124 108 124 16.5% 177 JÕGEVA VESI OÜ* 5,756 153 129.2 50 90 155 27.2 140 8.2 137 10,953 161 303 179 73 133 16.0% 178 HOLZ PROF OÜ 1,495 183 117.6 74 -97 171 -25.3 176 18,230 108 498 163 183 16.0% 179 ANDEVIS AS* 7,946 145 74.5 176 128 149 21.3 143 2.5 155 11,939 151 441 169 1,169 49 15.2% 180 PRO FIKSUM OÜ 7,900 146 85.9 158 172 143 6.7 158 4.4 146 5,206 181 2,633 42 273 100 14.4% 181 PINUS ABJA OÜ 8,030 143 75.6 175 30 163 8.7 156 0.6 162 6,012 178 268 181 572 70 12.3% 182 PERFETTO STUUDIO OÜ 7,356 151 64.4 182 -879 183 -24.7 175 9,498 167 1,051 107 58 139 12.1% 183 ABSINT OÜ* 15,633 115 43.0 185 -4,202 186 -56.1 182 16,097 123 869 123 3,000 23 12.0% 184 NUTITEQ OÜ 954 185 105.4 110 -107 172 -28.2 177 9,407 168 238 182 691 62 11.9% 185 SALESFORCE OÜ 1,754 181 94.0 139 4 168 3.1 165 2.7 153 5,563 180 92 186 6 159 11.0% 186 MODESAT COMMUNICATIONS OÜ 1,360 184 54.0 183 -2,412 185 -53.8 181 12,879 148 113 185 2,249 32 9.1% www.konkurents.ee 1 EUR = 15.6466 EEK; 1 EEK = 0.0639 EUR; based on 2008 data 46
BLRT GRUPP AS The Most Competitive Industrial and Energy Enterprise 2009 Photo: Toomas Tuul FJODOR BERMAN BLRT – surviving and building during hard times In case of some company it might seem that nothing changes, everything is in place and sure. Though, at the closer inspection and as a result of discussions the facts can become clear that everything is not as it seems. For the larger companies the changes and the keeping pace with time are the bases for success, but also a big challenge. This also applies to BLRT. The ship repair yard at the edge of Kopli in Tallinn stands firmly, Klaipeda plant works actively and Turku Repair Yard in Finland also stays firmly. Fjodor Berman, the chairman of the management board of the company, still talks about big changes and about that one has to keep updated to compete with the European top players. The state has to provide its contribution to be successful. BLRT GRUPP AS 2008: Sales (th EEK) 5,990,127 Change in sales 129.7 % Net profit (th EEK) 762,070 Change in net profit 150.2 % Number of employees 3,247 Investments (th EEK) 487,433 Return on equity 23.7 % 47