TOP ESTONIAN ENTERPRISES
TOP ESTONIAN ENTERPRISES
TOP ESTONIAN ENTERPRISES

You also want an ePaper? Increase the reach of your titles
YUMPU automatically turns print PDFs into web optimized ePapers that Google loves.
<strong>TOP</strong> <strong>ESTONIAN</strong><br />
<strong>ENTERPRISES</strong><br />
2009<br />
ENTREPRENEURSHIP AWARD 2009<br />
COMPETITIVENESS RANKING 2009<br />
Estonian Chamber of<br />
Commerce and Industry<br />
November 2009
Contents<br />
Entrepreneurship Award 2009 — summary 7<br />
Estonian Companies’ Competitiveness Ranking 2009 — summary 7<br />
Entrepreneurship Award 2009 — winners 8<br />
Estonian Companies’ Competitiveness Ranking 2009 — winners 9<br />
Entrepreneurship Award 2009 — methodology 11<br />
Entrepreneurship Award 2009 — nominees and winners 12<br />
The History of the Entrepreneurship Award 27<br />
Estonian Companies’ Competitiveness Ranking 2009 — main chart 29<br />
Estonian Companies’ Competitiveness Ranking 2009 — categories and winners 36<br />
The History of the Estonian Companies’ Competitiveness Ranking 70<br />
European Enterprise Awards — “Acknowledge the promoter of entrepreneurship 2009” 72<br />
Swedbank special award to the Best Adjuster 2009 74<br />
Best Student Company 2009 76<br />
Review of the entrepreneurship contests’ ceremonial award-gala 2009 78<br />
Enterprise Estonia 80<br />
Estonian Chamber of Commerce and Industry 82<br />
Estonian Employers’ Confederation 84<br />
2008 — (the first) year of crisis — Leev Kuum, Estonian Institute of Economic Research 86<br />
2
In 2008 almost 45 000 companies which declared the total sales of 863 billion<br />
kroons operated actively in Estonia. This is some tens of billion less than at the<br />
top period of economic growth in 2007. The end of the local economic cycle in<br />
autumn 2008 matched very uncomfortably with the global financial crisis and the<br />
success opportunities of the Estonian companies and the competitiveness were<br />
put to test.<br />
Now, at the beginning of autumn 2009 by making the summaries and comparing<br />
the companies, we are more convinced than before that the state’s recognition<br />
to the entrepreneurs as well as the contest between the competitors is<br />
extremely necessary. The companies have taken the bold and in places urgent<br />
steps in the last and this year to retain their competitiveness and adjust to the<br />
changed conditions. Competition – economic contest has become even more<br />
intense. The lack of demand and financing difficulties have forced to review the<br />
business plans, change the teams and think seriously about the innovations.<br />
Fortunately there was no shortage of participants in issuing the Entrepreneurship<br />
Award for the fourteenth time and preparing the seventh Competitiveness<br />
Ranking. Again we have a chance to assess the performance of hundreds of companies<br />
and thus provide an assessment to the events in the Estonian economy.<br />
Thank you to all participants and success in business! •<br />
Estonian Chamber of<br />
Commerce and Industry<br />
Ülari Alamets<br />
Chairman of the Board<br />
Enterprise Estonia<br />
Toomas Luman<br />
President<br />
Estonian Chamber of<br />
Commerce and Industry<br />
Enn Veskimägi<br />
President<br />
Estonian Employers´<br />
Confederation<br />
3
President<br />
of the Republic<br />
of Estonia<br />
at the Entrepreneurship<br />
Award Gala<br />
in the Concert Hall of<br />
Estonia on September 15,<br />
2009 in Tallinn<br />
Even in the difficult times of the present day we<br />
most certainly need some celebration as well.<br />
Also, we all need optimism and especially faith<br />
in the future right now. In spite of everything,<br />
this faith has been preserved in us. We just need<br />
to know how to see it. Let the presentation of<br />
the entrepreneurship awards today inspire hope<br />
in us. There are enterprises and entrepreneurs<br />
in Estonia who manage well in spite of everything<br />
even in the times most difficult for the<br />
economy.<br />
In comparison with a time one year ago, we are<br />
already wiser today. New winds have started to<br />
blow in the world economy. It is entirely possible<br />
that global economy has reached the turning<br />
point right now, or is just about to get there.<br />
that the national economic policy has also covered<br />
one half of the journey, if we are to consider<br />
the efforts made so far to balance the<br />
state budget.<br />
But the other half will not be easier to navigate.<br />
The role of the budget for 2010 is critical in<br />
many aspects – both for the fiscal sustainability<br />
and the coming of the euro.<br />
There is still one more topic I want to touch<br />
upon. This topic was on my desk already on the<br />
very first day I took office, and it will remain<br />
there for yet some time to come. It is the topic<br />
of the productivity of the Estonian economy,<br />
which still lags far behind in comparison with<br />
the developed European countries.<br />
TOOMAS HENDRIK ILVES<br />
The President of the<br />
Republic of Estonia<br />
In that sense there is less uncertainty than a<br />
year ago. And there is all the more reason to<br />
look forward, as the economic recession in<br />
Estonia will not go on for ever.<br />
The great global crises changes the economies,<br />
the former relations of power, as well as people.<br />
Most certainly, the Estonian economy today<br />
is not the same “bubble economy” we experienced<br />
only recently. In that sense the changes<br />
have been more substantial than the ones<br />
demonstrated by the statistics only.<br />
Probably the difficult times have also changed<br />
the people present here today. You are certainly<br />
more realistic. But I hope that also more inventive<br />
and innovative.<br />
The world economy is emerging from the crisis<br />
and may well have walked half of the road on its<br />
way to a new rise. It is quite possible that the<br />
Estonian economy has also covered half of the<br />
road or will have, very soon. Should this be so, we<br />
have also covered half of the journey on our way<br />
to becoming adjusted to the new situation. That<br />
said, however, we still have another half to go.<br />
It has been said that the fastest to react to the<br />
recession and to adjust to the changed circumstances<br />
were the simple Estonian people. They<br />
have done so by limiting their consumption and<br />
costs. Including those, whose salary has not<br />
significantly decreased. And those, who do not<br />
have to fear for losing their jobs.<br />
It is quite obvious that there was little or no<br />
need to change anything during the good times,<br />
as we were doing fairly well, anyway. This<br />
means that changes are urgently needed today,<br />
as the new rise can be hardly expected to follow<br />
the old trail. The flood of cheap money, experienced<br />
some years ago, will never come in the<br />
same form again. The development acceleration,<br />
which automatically accompanied European<br />
Union Member State status, is today in the<br />
past.<br />
Although we do not know yet what the new rise<br />
will be like and which sectors will be in the lead,<br />
it is clear, that it will be different from the previous<br />
one. And let us be ready for that also in<br />
our spirit, as without new solutions and values<br />
there is a risk that we will not notice that rise.<br />
I do not want to repeat my words about investing<br />
into education, science and development, as<br />
they have begun to sound like a mantra already.<br />
This should go without saying. For it is not<br />
possible to image the economy of a successful<br />
Estonia without those three keywords.<br />
That is why I will only repeat one sentence from<br />
my speech from the last year, which went like<br />
this, and I quote: “I hope that the main prizes<br />
will go to innovative enterprises”. The productivity<br />
of the economy cannot be expected to increase<br />
without innovative solutions, and the<br />
legendary industriousness (or laboriousness?)<br />
of the Estonians alone will not be enough.<br />
I am sure that also a large part of the businesses<br />
have undergone an adjustment. We<br />
know that those, who cannot adapt to the<br />
changed world, will simply soon cease to exist<br />
according to the logic of economy.<br />
For the closing I wish the entrepreneurs<br />
strength to manage well today and to have good<br />
ideas in the future. It all depends on you, what<br />
the Estonian economy will look like tomorrow,<br />
in a year and in ten years.<br />
The economic policy of the state has also<br />
changed over the past year. It is quite possible<br />
I wish everyone hope in the future! •<br />
5
ENTREPRENEUR-<br />
SHIP AWARD<br />
2009<br />
Entrepreneurship Award is the entrepreneurship<br />
competition with the longest history in Estonia<br />
which dates back to the year 1996. Just in this<br />
year the competition was organised under the<br />
leadership of the President Lennart Meri for the<br />
issue of the title “Foreign Investor 1995”. The<br />
competition has changed and expanded with<br />
time and since 2000 Enterprise Estonia organises<br />
the choosing and recognition of the best<br />
companies under the name of “Entrepreneurship<br />
Award”. The primary objective of the competition<br />
is to recognise the successful and<br />
perspective Estonian companies and set them as<br />
the examples for others. The wider aim is to contribute<br />
to the promotion of entrepreneurship,<br />
growth of the international competitiveness of<br />
the Estonian companies and therewith to the<br />
faster economic development.<br />
Each year the number and name of categories<br />
are slightly updated to guarantee the valuation<br />
of the companies in the more important sectors<br />
from the viewpoint of the state economy. This<br />
year the categories were the Developer, Innovator,<br />
Exporter, Foreign Investor and Tourism Innovator<br />
of the Year.<br />
The basis of choice is the questionnaires sent<br />
by the companies. In cooperation with the<br />
Estonian Institute of Economic Research the<br />
ranking of each category is specified, of which<br />
Enterprise Estonia with experts choose the<br />
three nominees and the winner company per<br />
each category. The main winner of the Entrepreneurship<br />
Award is chosen among the category<br />
winners by the representative jury, the<br />
members of which are the representatives of<br />
the universities, key ministries and circles of<br />
entrepreneurship.<br />
The participation in the competition has increased<br />
from year to year, good companies<br />
worthy of recognition exist in all categories and<br />
therefore the making of choices is complicated.<br />
In several cases the discussions lasted for<br />
hours, but finally the results were also<br />
achieved.<br />
The competition “Enterprise Award 2009” culminated<br />
with the festive gala night in the concert<br />
hall of Estonia, where the winners will be<br />
announced and the deserved awards will be<br />
given to the best. •<br />
PARTICIPANTS<br />
As many as 378 Estonian companies participated<br />
in the compilation of the Estonian Companies’<br />
Competitiveness Ranking 2009 and 354<br />
of them qualified for the final countdown according<br />
to the methodology. The main reason<br />
for not qualifying was the insufficient number<br />
of full financial years for participation, negative<br />
net gain in 2008 or incomplete submission of<br />
data.<br />
As last year, the participants could choose between<br />
12 fields of activity in order to benchmark<br />
themselves against their competitors. Though,<br />
9 fields of activities remained at the final countdown<br />
of the results in which the most competitive<br />
companies were specified. The number of<br />
competitors in the sector of tourism, agriculture<br />
and forestry was too low, thus this year the<br />
best were not chosen in these sectors. All companies<br />
applying for in these sectors are surely<br />
recorded in the general ranking table and also<br />
in the most competitive small and mediumsized<br />
companies ranking depending on their<br />
size. Also, the sectors of retail and wholesale<br />
were merged into the joint sector of trade, as<br />
the activities of many companies having applied<br />
for involve both retail and wholesale and the line<br />
between these two was hard to be drawn.<br />
In addition to the general winner, for the third<br />
time this year the Most Competitive Small and<br />
Medium-Sized Enterprise were established.<br />
We are glad to note that 186 companies wished<br />
to be compared to other companies in this category.<br />
As in previous years, the largest number<br />
of companies in the Competitiveness<br />
Ranking was among industrial or energy related<br />
(111, last year 101) enterprises. The least<br />
number of companies came from food industry<br />
(9). 43 construction companies competed in<br />
the ranking instead of the last year’s 55.<br />
29 companies from the sector of business<br />
services and real estate ran for as the candidates<br />
instead of the last year’s 11.<br />
Estonian Companies’<br />
Competitiveness<br />
Ranking 2009<br />
WINNERS<br />
Three of the last year’s winners were able to<br />
maintain their position and also remain highly<br />
competitive – BLRT Grupp AS already for the<br />
sixth and Mažeikiu Nafta Trading OÜ for the<br />
fourth year in a row. All winners are well-known<br />
players in their sector and are worth of their<br />
title without doubt. This year Mažeikiu Nafta<br />
Trading OÜ received the title of the Most Competitive<br />
Enterprise which also proved to be the<br />
Most Competitive among trading companies<br />
and has born the title of the Most Competitive<br />
Wholesale Company for already three years.<br />
The winner of The Most Competitive Small and<br />
Medium-Sized Enterprise is Riverside OÜ,<br />
which was established in 2003 and which<br />
gained a high third place among the companies<br />
of its sector (construction) and the fourth place<br />
in the general ranking table.<br />
The companies who have won titles in the Competitiveness<br />
Ranking have the average history<br />
of 16.5 years, unless we consider A. Le Coq<br />
which was established in 1800 and has been already<br />
operating for 208 years. The youngest<br />
winners were Riverside OÜ and Mažeikiu Nafta<br />
Trading OÜ (established in 2003). If we look at<br />
the equity capital of the best companies in the<br />
Ranking, then 4 companies are based 100% on<br />
the Estonian private capital, 3 companies belong<br />
100%-ly to the foreign capital and the equity<br />
capital of the rest of the winners is divided<br />
between the Estonian and foreign owners.<br />
We are also very proud that almost all the winners<br />
are the members of the Estonian Chamber<br />
of Commerce and Industry. •<br />
The charts, methodology and any<br />
information regarding the competition<br />
is also available at the competition-related<br />
portal: www.konkurents.ee ><br />
7
Photo: Zentilia<br />
Entrepreneurship Award 2009<br />
Entrepreneurship Award 2009<br />
Exporter 2009<br />
VKG Oil AS 12<br />
Year of foundation: 1999<br />
Chairman of the Board: Nikolai Petrovitš<br />
Field of activity: shale oil processing<br />
Tourism Innovator 2009<br />
Narva Muuseum 15<br />
Year of foundation: 1865<br />
Chairman of the Board: Andres Toode<br />
Field of activity: organisation of museum work,<br />
servicing the tourists<br />
Innovator 2009<br />
Modesat Communications OÜ 18<br />
Year of foundation: 2005<br />
Chairman of the Board: Tarmo Pihl, Peep Põldsamm<br />
Field of activity: development<br />
of telecommunication technology<br />
Developer of the year 2009<br />
Flow Service OÜ 21<br />
Year of foundation: 2005<br />
Chairman of the Board: Ants Hauvmann, Liis Laanet<br />
Field of activity: designing, installation<br />
and maintenance of industrial equipment<br />
Foreign investor 2009<br />
ABB AS 24<br />
Year of foundation: 1991<br />
Chairman of the Board: Bo Roger Vilhelm Henriksson<br />
Field of activity: production and installation<br />
of automation and electrotechnics systems<br />
8
Photo: Tallink<br />
Estonian Companies’ Competitiveness Ranking 2009<br />
The Most Competitive Enterprise 2009<br />
The Most Competitive Trading Enterprise 2009<br />
Mazeikiu Nafta Trading House OÜ 36<br />
Year of foundation: 2003<br />
Chairman of the Board: Tõnu Ääro<br />
Field of activity: wholesale<br />
The Most Competitive Small<br />
and Medium-sized Enterprise 2009<br />
Riverside OÜ 41<br />
Year of foundation: 2003<br />
Chairman of the Board: Aivar Nõu<br />
Field of activity: construction<br />
The Most Competitive Industrial<br />
and Energy Enterprise 2009<br />
BLRT Grupp AS (group) 47<br />
Year of foundation: 1996<br />
Chairman of the Board: Fjodor Berman<br />
Field of activity: ship construction and repairs<br />
The Most Competitive<br />
Food Industry Enterprise 2009<br />
A. Le Coq AS 51<br />
Year of foundation: 1800<br />
Chairman of the Board: Tarmo Noop<br />
Field of activity: production and sale of beer,<br />
soft drinks and light alcoholic drinks<br />
The Most Competitive<br />
Construction Enterprise 2009<br />
Merko Ehitus AS (group) 53<br />
Year of foundation: 1990<br />
Chairman of the Board: Tiit Roben<br />
Field of activity: construction<br />
The Most Competitive Communication<br />
and IT-service Enterprise 2009<br />
Eesti Telekom AS (group) 56<br />
Year of foundation: 1991<br />
Chairman of the Board: Valdo Kalm<br />
Field of activity: telecommunication,<br />
activity of holding companies<br />
The Most Competitive Business Service<br />
and Real Estate Enterprise 2009<br />
EKE Invest AS (group) 58<br />
Year of foundation: 1993<br />
Chairman of the Board: Rein Tiik<br />
Field of activity: real estate development<br />
and financial investments<br />
The Most Competitive Financial<br />
Brokerage Enterprise 2009<br />
Swedbank AS (group) 61<br />
Year of foundation: 1991<br />
Chairman of the Board: Priit Perens<br />
(Director General in Estonia)<br />
Field of activity: banking<br />
The Most Competitive Service Company 2009<br />
Tallinna Vesi AS 64<br />
Year of foundation: 1967<br />
Chairman of the Board: Ian John Alexander Plenderleith<br />
Field of activity: water and sewerage services<br />
The Most Competitive Transportation<br />
and Logistics Enterprise 2009<br />
Tallinnk Grupp AS (group) 68<br />
Year of foundation: 1997<br />
Chairman of the Board: Enn Pant<br />
Field of activity: sea transport<br />
9
Entrepreneurship<br />
Award 2009<br />
At the national entrepreneurship<br />
com petition “Entrepreneurship Award<br />
2009” with the longest history the<br />
companies who are most worthy of<br />
recognition from the viewpoint of the<br />
state and exemplary will be traditionally<br />
chosen. This year the best were<br />
chosen in five categories: Developer<br />
of the Year 2009, Tourism Innovator<br />
2009, Exporter 2009, Foreign Investor<br />
2009 and Innovator 2009.<br />
THE JURY:<br />
The jury included the Minister of Economic<br />
Affairs and Communications<br />
Juhan Parts, Foreign Minister Urmas<br />
Paet, Rector of Tallinn University of<br />
Technology Peep Sürje, President of<br />
the Bank of Estonia Andres Lipstok,<br />
Chairman of the Supervisory Board of<br />
Enterprise Estonia Mart Einasto,<br />
Chairman of the Management Board<br />
of ABB AS Bo Henriksson.<br />
Compared to the earlier years there were consider<br />
ably more candidates in the category of innovator<br />
which indicates that during hard times<br />
the companies struggle even more in developing<br />
new technologies and applications than in<br />
the years of economic prosperity.<br />
Each award category has its own criteria in<br />
choosing the best, at the same time several nationally<br />
important aspects cross the years as<br />
red line: export capability, high productivity, innovativeness.<br />
This year the real achievements,<br />
not so much enthusiastic future visions, were<br />
assessed. The methodology of the competition<br />
has been developed by the specialists of Enterprise<br />
Estonia, the years-long experience and<br />
the opinions of several independent experts<br />
have been taken into account.<br />
In order to apply as the candidate the company<br />
had to fill in the online questionnaire by answering<br />
the questions regarding the different<br />
economic indicators, products, services and<br />
several other figures. The questionnaires were<br />
prepared and the first information processing<br />
was carried out by the Estonian Institute of Economic<br />
Research.<br />
The obtained information was analysed by the<br />
divisions of Enterprise Estonia, by involving the<br />
professional experts from outside. As a result<br />
of the analysis three best were specified in all<br />
categories, the nomination of which was submitted<br />
to the jury of the competition for making<br />
the final choice. At the end of August the gathered<br />
jury chose the winner of each category out<br />
of the three submitted nominees at the meeting<br />
and the winner of the main prize from among<br />
the winners of the categories.<br />
“Entrepreneurship Award” has traditionally been<br />
a competition, in case of which the subjective assessment<br />
of the state’s representatives in addition<br />
to the real economic results is considered.<br />
The decision was adopted by the jury based on<br />
the valuation criteria of each specific category<br />
and the achievements and perspective of the<br />
companies applying for as candidates. •<br />
11
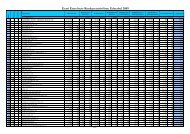
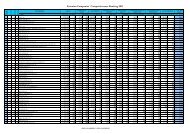
Nominees for the Entrepreneurship Award 2009<br />
Enterprise Established Private capital Private capital Owners' equity Sales Change in sales Net profit Investment to Employees Sales per<br />
Estonia (%) foreign (%) 2008 (EEK) 2008 (EEK) 2008 compared 2008 (EEK) fixed assets 2008 employee<br />
to 2007 (%) 2008 (EEK) 2008 (EEK)<br />
FLOW SERVICE OÜ 2005 100 0 4,355,896 18,443,773 11.6 1,112,920 0 19 970,725<br />
NARVA MUUSEUM 1865 0 0 n/a 2,045,746 n/a n/a n/a n/a<br />
VKG OIL AS 1999 100 0 1,324,923,000 1,492,343,000 2 573,136,000 994,186,000 604 2,470,767<br />
ABB AS 1996 0 100 506,000,000 2,570,000,000 51 147,000,000 260,000,000 1,069 2,404,116<br />
MODESAT COMMUNICATIONS OÜ 2005 51 49 3,615,203 1,359,842 -49 -2,411,710 2,248,517 604 2,251<br />
www.konkurents.ee<br />
1 EUR = 15.6466 EEK; 1 EEK = 0.0639 EUR; based on 2008 data<br />
Entrepreneurship Award 2009 – Main Prize<br />
VKG OIL AS<br />
Exporter<br />
2009<br />
The billion<br />
plant of VKG<br />
Oil allows<br />
the higher<br />
valuation<br />
of oil shale<br />
In these days Kohtla-Järve is in anticipation –<br />
VKG Oil soon launches the brand new shale oil<br />
plant with the cost of 1.1 billion kroons.<br />
In autumn 2008 when the economic crisis already<br />
ravaged the Estonian companies, Jaanus<br />
Purga, the development director of Viru Keemia<br />
Grupp, stated in the same yearbook that crisis<br />
has not yet reached Kohtla-Järve. He talked<br />
about several new ideas, e.g. the production of<br />
cement and diesel fuel.<br />
Now, a year later, the situation has changed.<br />
Some plans have been temporarily frozen, so<br />
that the subsidiary VKG Oil could terminate the<br />
construction of the oil plant started at the top<br />
of the economic boom by the deadline. In a couple<br />
of months the latter works on mine waste<br />
for testing, thereafter on oil shale.<br />
“You can stop the repairs at home. You postpone<br />
it, no problem. But such construction as oil<br />
plant cannot just be stopped,” Nikolai Petrovitš,<br />
the chairman of the management board of VKG<br />
Oil, says.<br />
The macroproject involves approximately hundred<br />
companies and half a thousand persons<br />
from several different countries – from Finland,<br />
Germany, Russia, Switzerland etc besides Estonia.<br />
Petrovitš: “Imagine that this mechanism<br />
will stop even for a week .. the restoring of the<br />
working pace would be practically impossible!”<br />
According to him the launching of the plant<br />
should surely take place in autumn, not during<br />
winter frost.<br />
Last year VKG Oil had several problems. “It was<br />
really difficult from last autumn up to this<br />
12
Photo: Toomas Tuul<br />
NIKOLAI PETROVITŠ<br />
spring – we yielded the net loss of about 28 million<br />
kroons within five months,” Petrovitš admits.<br />
The main concern is the low price of<br />
petroleum which fell from the level of 140 dollars<br />
per barrel as the starting level of the last<br />
year to 40 dollars at one time this year and then<br />
slightly increased. The latter has a direct impact<br />
on how much the company can ask for its shale<br />
oil which will be mixed with black oil and is used<br />
as the ship fuel.<br />
Also, there have been major problems with raw<br />
material. Eesti Energia decided to temporarily<br />
close Narva Power Station and related to that the<br />
supply of oil shale to VKG decreased. “We had<br />
nothing to make oil of and the plant practically<br />
was at a stop for half a month,” Petrovitš says.<br />
The situation where practically the competitor<br />
Eesti Energia supplies raw material to VKG<br />
should end according to Petrovitš. The company<br />
should launch its mine in 2012. Otherwise the<br />
supply of the new fancy oil plant would be seriously<br />
disturbed. The purchase of the oil shale<br />
from Russia is complicated due to its logistics<br />
and the relations between two countries.<br />
And this is not all – the markets of coke, bitumen<br />
and pitch have also not offered anything<br />
pleasant to VKG. The consumption of coke fell<br />
for example in Ukraine and Russia and related<br />
to the latter also the price decreased ten times<br />
last year. It was so bad that at some time there<br />
was no sense to produce coke. True, in the last<br />
months the metallurgy industry of the neighbouring<br />
countries have started to recover.<br />
For already several years the company also contributes<br />
to the future – production of expensive oil<br />
shale phenols (oil shale is though “Estonian<br />
Nokia”). One of the phenols- honeyol looks like<br />
honey. The other – 2 and 5 methyl resorcin is like<br />
sugar. These have been sold by couple of tons to<br />
the car producers of Japan and Germany, such<br />
as to the noise suppressor mats of Lexus, also to<br />
hair dye producers of India and other countries.<br />
The last exciting news is that with high probability<br />
one well-known giant of chemical industry will<br />
start to buy 2-methyl resorcin from Kohtla-Järve.<br />
Tens of millions of kroons can be strongly invest -<br />
ed to the business of phenols, as the usage area of<br />
these chemicals is expanding. But now there is no<br />
money for everything. VKG employees have major<br />
faith in the future of the new oil plant, as the best<br />
possible team has been involved in the project.<br />
Petrovitš says that if the price of petroleum remains<br />
at the level of 50 dollars per barrel, the oil<br />
plant will be profitable. “We get the bread, butter<br />
and very thin slice of sausage”, he smiles. If<br />
the price is lower, it would be difficult.<br />
If it occurs that world economy recovers and the<br />
price of oil rises, half a million ton of oil can be<br />
produced in Kohtla-Järve in the future instead<br />
of the current approximate 240 000 tons.<br />
There is no wonder that VKG Oil became the<br />
winner of the Entrepreneurship Award through<br />
the title of Exporter. Estonia has no many companies<br />
which can annually export for 1.1 billion<br />
kroons and increase by 48% in sales. •<br />
Photo: Toomas Tuul<br />
13
Photo: Morkeman<br />
Nominees for the<br />
Exporter 2009<br />
We acknowledge the companies which export<br />
sales, growth in export sales and added value per<br />
one employee in 2008 was the highest, which have<br />
contributed to the product development and uses<br />
the recognised quality management system.<br />
AEROC AS<br />
Aeroc AS has developed out of the group of<br />
companies based on the Estonian private capital<br />
having started in 1991 which has successfully<br />
operated in several sectors of construction<br />
material industry within more than 11 years –<br />
design of equipment and technology, production<br />
of lime and intermediation sale of pore concrete<br />
products.<br />
In 1995 the import of Siporex- pore concrete<br />
products made in Finland was started together<br />
with Kivilõvi Engineering Agency in Estonia and<br />
since 1997 the company has been in parallel<br />
also the exclusive representative of the plant of<br />
pore concrete products working on the German<br />
Hebel- technology in the vicinity of St. Petersburg.<br />
During these years more than 150 private<br />
houses have been established in Estonia, in<br />
constructing of which the uptodate complex<br />
system of the house box of pore concrete products<br />
has been used. Siporex-blocks and partition<br />
boards have also been used in the walls of<br />
several representative buildings in Tallinn.<br />
In summer 2000 the establishing of the new upto-date<br />
plant of pore concrete products near<br />
Kunda was started. The investment of about 100<br />
million kroons was completed at the end of 2001<br />
and since spring-summer of 2002 AEROC products<br />
are available in all major Estonian stores<br />
of construction materials. Besides Estonia,<br />
AEROC blocks, partition boards and glue mixtures<br />
are also sold at the markets of Sweden,<br />
Denmark, Norway, Finland, Latvia and Lithuania,<br />
the export sales will be about 84 percent.<br />
The news introduced at the market of 2009 is<br />
the ceiling panel of Aeroc pore concrete, with<br />
the help of which the whole stone house can be<br />
built by using the local Aeroc materials.<br />
The main quality indicators of AEROC products<br />
– volume weight, compressive strength and<br />
measuring preciseness – comply with the highest<br />
requirements of the European standards.<br />
DEMIDOV INDUTSTRIES AS<br />
Demidov Industries is the unique metallurgy<br />
company in the Estonian conditions, being specialised<br />
in the production and export of aluminium<br />
and ferroalloys. The company’s<br />
production is used by the industrial companies<br />
as alloying accessories in the aluminium industry,<br />
ferroalloys in steel cast industry, the potential<br />
clients are any companies of these sectors.<br />
The company uses the most uptodate high technological<br />
equipment in the plant located in<br />
Ülemiste City. The continuous contributions are<br />
made to the product development and completion<br />
of technology. The advantage for that is provided<br />
by the high qualification and long-term<br />
experience of the personnel and valuable feedback<br />
from the foreign markets. The sales of the<br />
company in 2008 was 352 million kroons, 99<br />
percent of which was export. Demidov Industries<br />
AS provides work for more than 60 employees.<br />
•<br />
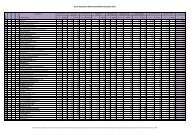
Nominees for the Exporter 2009<br />
Enterprise Main activity Sales 2008 Export sales Change in Net profit Added value Employees<br />
(th EEK) 2008 export sales 2008 per employee<br />
(th EEK) 2008/2007 (%) (th EEK) 2008 (th EEK)<br />
VKG OIL AS Shale oil processing 1,492,343 1,126,073 48 573,176 1,396 604<br />
AEROC AS Production of pore concrete products 249,660 208,883 64 22,685 648 115<br />
DEMIDOV INDUSTRIES AS Production of metal alloys 352,166 352,164 56 43,013 1,169 64<br />
www.konkurents.ee<br />
1 EUR = 15.6466 EEK; 1 EEK = 0.0639 EUR; based on 2008 data<br />
14
NARVA MUUSEUM<br />
Tourism Innovator<br />
2009<br />
Photo: Toomas Tuul<br />
ANDRES TOODE<br />
The living conditions<br />
of the 17th century<br />
will be restored<br />
Narva Museum has major plans to<br />
make history live. Among other<br />
things, the ancient ship will be built<br />
with stone axes and the printing press<br />
of Gutenberg will be established.<br />
Andres Toode, the director of Narva<br />
Museum, talks about the exciting undertakings<br />
between the castle walls.<br />
Photo: Toomas Tuul<br />
15
What is Narva Museum?<br />
We are the city museum, institution of memory<br />
which deals with preservation of culture and<br />
history of Narva and the surroundings. The exposition<br />
is more-or-less the same in all city museums,<br />
as the Estonian history has developed<br />
the same way. But we have a slightly more extensive<br />
meaning, as the castle attracts tourists<br />
for us. We are in a very good location, as the<br />
tourism transit between Tallinn and St. Petersburg<br />
passes the front of our door. Therefore we<br />
started to develop the historical experimental<br />
centre. The objective is to revive the 17th century<br />
– the Golden Time of Narva.<br />
What does the restoration<br />
of history lie in?<br />
We are not going to make moulages – to bring a<br />
pile of boards from the sawmill, attach these<br />
with wooden screws and say that this is the centuries-old<br />
shed. All should be prepared manually<br />
and of quality. In the course of the last 60<br />
years the three u-shaped wings – southern,<br />
western and northern wing - of the convention<br />
building have been restored in Narva castle. In<br />
order to be successful today and get money<br />
from EU, the wish to restore something is not<br />
enough. The question: “What is the new quality<br />
that you would like to achieve?” We searched for<br />
ideas in the Scandinavian countries. The Danes<br />
are the revolutionaries in the field of historical<br />
centres in Europe. The outcome of their purposeful<br />
work having started in 1960s provides<br />
us even farther aim. For example, at the archaeological<br />
excavations the Danes found the<br />
carbonized pieces of board of the then building<br />
from the ground. They built different houses and<br />
huts, covered with different roof material, set<br />
them on fire and covered with earth. 20 years<br />
later they excavated and made chemical analyses<br />
which is most close to what was found by<br />
the archaeologists. Also, the arrow wounds<br />
have been also examined in the near history.<br />
The half of swine was hung up and dressed with<br />
chain armour and different arrows were shot<br />
thereto to see the holes made by different<br />
weapons. The idea of the historical centre is<br />
though the playing-through of history, making<br />
the experiments, discovering some new or forgotten<br />
old knowledge.<br />
Which experiments have<br />
been made in Narva?<br />
We prepare the experiments. We have an environment<br />
where these can be conducted. The<br />
aim is to move closer to the era. The time machine<br />
could be created: you step in and understand<br />
how the things looked like at that time.<br />
This provides, for example, a good alternative of<br />
the academic education for the schoolchildren.<br />
This year we have been building the ancient<br />
ship. We pursue to make the even earlier form<br />
of boat – dugout – with stone axes which would<br />
be enormous work. Also, we have the distillation<br />
project. The local people have been excited<br />
that the museum will start to produce vodka.<br />
No, we do not start vodka production. I do not<br />
know how the ovens of that time functioned and<br />
which receipies were used. But in the 17th century<br />
the basis for the current strong alcohol culture<br />
was established.<br />
Also we would like to make the printing press.<br />
Gutenberg lived considerably earlier than in the<br />
17th century, but the books became more available<br />
just then. The result of all experiments<br />
should remain at the disposal of the tourists.<br />
Is the objective to sell all this<br />
to the tourists?<br />
Surely. But we also need to acquire new knowledge<br />
and skills. The seminars and research<br />
publications should follow the projects. We just<br />
do not want the simple tivoli and circus, we want<br />
to go deeper.<br />
Who are the visitors of Narva Museum?<br />
This year the percentage of domestic tourism<br />
increased. But generally large tourism groups<br />
visit us who travel between Tallinn and St. Petersburg.<br />
We have a lot of Asian tourists, especially<br />
Japanese. We sell approximately 30 000<br />
tickets a year. 85% of the sale is made in summer.<br />
Our budget is 12 million kroons, of which<br />
about two million is earned by ourselves. The<br />
museum is foremost the institution of memory<br />
and we do not have to make the ends meet. But<br />
if we are lucky to gain more money through the<br />
visitors, this is just outstanding.<br />
What are you offering to the tourists now?<br />
This year we set the herb garden in order,<br />
rather the garden of the Swedish botanist Carl<br />
Linne. He promoted in the 18th century the idea<br />
to value the manors and castle ruins with beautiful<br />
plants. The garden is used in the educational<br />
programmes, also the tourists can do<br />
some sightseeing here. In the northern yard the<br />
apothecary of the 17th century works in summers<br />
where the herbs, infusions and extracts<br />
are sold. They can also use the garden. This<br />
summer we hade a thematic event practically<br />
on each weekend. There is the area of handicraft<br />
with five workshops. We have prohibited to<br />
sell the plastic and other accessories. All that<br />
is sold should comply with the era. The souvenirs<br />
are here unique, not like the ones which<br />
are sold on Tallinn Town Hall Square. The<br />
tourist gets the coin with the ticket, one side of<br />
which depicts the coin engraved in Narva in the<br />
17th century and the other side the coat of arms<br />
of the northern yard. The coin can be exchanged<br />
in any of our workshop against the souvenir or<br />
service. We always recommend the service –<br />
there is a blacksmith, potter, chemist, fretworker<br />
and pillow lace. As to us it is special that<br />
we do not pay salary to the craftsmen and they<br />
are not paying the lease to us. They are at us as<br />
the entrepreneurs, but not only the sale of souvenirs<br />
can be dealt with, but they should provide<br />
also services to the tourists. The coins will be<br />
repurchased by the museum at the end of the<br />
month. The sum paid for the coin is practically<br />
divided into halves – half remains for the museum,<br />
half for the craftsmen. We collect money<br />
to the common cash for these coins which will<br />
be lost with tourists. The premium will be paid<br />
from there to the best workshops each month.<br />
This is extraordinarily motivating cooperation<br />
model.<br />
How do you choose the master<br />
craftsmen to the northern yard?<br />
At the beginning we had no choice, as the local<br />
entrepreneurship activity is low. The blacksmith<br />
is up to now employed from Southern Estonia.<br />
The ceramist was also from the south, next year<br />
comes from Tallinn. No one has left. Only one<br />
had to be replaced as he started to sell some<br />
Lithuanian and Polish bauble.<br />
Do you have also crazy ideas?<br />
One idea is considered quite crazy by the heritage<br />
conservation. In our opinion the northern<br />
yard should become the quarter of craftsmen of<br />
the 17th century. This would also mean the<br />
buildings of that time. Heritage conservation interprets<br />
the plans as house construction. In our<br />
opinion this would be the exposition which will<br />
be taken down when the northern yard would<br />
terminate its activities. The old buildings will<br />
preserve only when they have any function. If no<br />
people would visit the castle, no one would dare<br />
to put money to its preservation.<br />
Which historical centres in Denmark<br />
are the examples for Narva Museum?<br />
Foremost Lejre, where the Stone Age, Bronze<br />
Age and Iron Age have been restored. One target<br />
group of visitors are the schoolchildren, as<br />
the Danish Ministry of Education supports the<br />
active studies. The children study among other<br />
things how to make porridge of the milled flour.<br />
But they are not used to it, as they eat only hamburgers<br />
and French fries at home which were<br />
not existing during the Stone Age. When they go<br />
home, they demand porridge from the parents<br />
and the parents are really worried – the children<br />
start to eat normally. Also, the chickens are<br />
slaughtered in the Danish historical centres.<br />
I do not know how this is possible in the European<br />
Union and the tourists make big eyes, but<br />
it has no negative impacts. The Danes make the<br />
history live. This is also our aim in Narva. •<br />
16
Nominees for<br />
the Tourism<br />
Innovator 2009<br />
We acknowledge the capable companies<br />
which have developed innovative<br />
and quality tourist products and which<br />
are competitive among both the foreign<br />
tourists visiting Estonia and domestic<br />
tourists.<br />
EESTI KONVERENTSIBÜROO MTÜ<br />
(ECB – <strong>ESTONIAN</strong> CONVENTION BUREAU)<br />
MTÜ Eesti Konverentsibüroo (ECB – Estonian<br />
Convention Bureau) established in 2008 is the<br />
roof organisation of the conference tourism, the<br />
aim of which is to introduce Estonia at the foreign<br />
markets as the international destination of<br />
conference and increase the number of conferences<br />
held in Estonia, by contributing to the decrease<br />
in seasonality of tourism demand and<br />
growth in the number of foreign tourists. The<br />
task of the Estonian Convention Bureau is the<br />
promoting and creating of the image of Estonia<br />
as the conference country, advising the clients<br />
and assisting in planning of the events and international<br />
cooperation. ECB is the neutral Estonian-side<br />
partner for the international<br />
associations, possessing the role of advisor and<br />
information mediator. ECB is the first instance<br />
to where the conference organiser, company,<br />
association, travel agent or event marketing<br />
company located in the foreign country turns to<br />
get the objective overview of the Estonian conference<br />
opportunities.<br />
ECB represents the companies directly or indirectly<br />
related to the organisation of the conferences<br />
and the state and local governments.<br />
Today the organisation has 25 members. For the<br />
first time in Estonia the public and private sector<br />
have gathered their resources: local governments<br />
of the largest conference cities (Tallinn,<br />
Tartu and Pärnu) and the private entrepreneurs<br />
with different interests (hotels, travel agents,<br />
event organisers, airline company Estonian Air,<br />
leisure centre Solaris) to jointly actively market<br />
the possibilities of Estonia as the conference<br />
country at the foreign markets. Also, the Estonian<br />
Convention Bureau has cooperation with the<br />
state, local government and research establishments,<br />
non-profit organisations and movements.<br />
The result is a very good sample of the cooperation<br />
of the private and public sector which has<br />
a considerable impact on the development of<br />
the Estonian tourism.<br />
Prior to the foundation of the Estonian Convention<br />
Bureau in Estonia there has not been joint<br />
active marketing activities of the conference opportunities<br />
and attracting the new conference<br />
clients to Estonia.<br />
Conference tourism is considered the tourism<br />
sector with internationally very high potential<br />
which in addition to the increase of export also<br />
contributes to the creating of the image of the<br />
state. Approximately 14 000 regular conferences<br />
of international associations are held in the<br />
world which constantly search for new destinations.<br />
Many of these conferences could be also<br />
organised in Estonia. In addition to the novelty<br />
as the conference destination Estonia has conference<br />
places required for organising, hotels<br />
and the advanced technological equipment.<br />
The development of conference tourism is important<br />
for Estonia to decrease the seasonality<br />
of tourism and increase the export of tourism<br />
products. According to the recent statistics the<br />
conference tourist spends in average 565 USD<br />
a day and 2568 USD per conference (ICCA data<br />
for 2008).<br />
The Estonian Convention Bureau is the member<br />
of the international roof organisation ICCA<br />
(International Congress & Convention Association)<br />
since 2008.<br />
TORI KURADID<br />
The entrepreneurs from Tori created the voluntary<br />
cooperation network “Tori Kuradid“ (Tori<br />
Devils) for providing the tourism services with<br />
the following members: KlaaraManni Holiday<br />
House (Klaara Manni), Tori Hiking Centre (Santon<br />
OÜ), Tori Hobusekasvandus OÜ, Tori handicraft<br />
chamber (Arteljee OÜ), Sookolli Diner (FIE<br />
Maigi Loite), Matogard OÜ, FIE Anne Borkvel,<br />
Rahnoja Hunting Association (Aadi Saar), Madi<br />
farmhouse (FIE Ülle Parm). The initiator of the<br />
association is KlaaraManni Holiday House. In<br />
cooperation with 4-7 entrepreneurs the integral<br />
moments of experience through the local heritage,<br />
nature and cultural story are offered to<br />
the visitors through the activities.<br />
The joint activity is the outstanding sample of<br />
the local cooperation where the entrepreneurs<br />
cross market each other’s products to win the<br />
clients and offer them the best service with the<br />
diverse choice of services. By combining the different<br />
services (accommodation, active holiday,<br />
different activities, catering etc.) the original and<br />
varied product package is offered to the clients,<br />
being flexible at the same time and by making<br />
maximum use of the strengths of the district.<br />
The cooperation network is a voluntary self-initiative<br />
association. The precondition of influential<br />
functioning of the network is the fact that all<br />
participants are equally strong partners who<br />
have clearly developed differentiated services<br />
and who are interested in strengthening of the<br />
sustainability of the district through the joint activities.<br />
There is cooperation with the local government<br />
to make Tori rural municipality and<br />
Soomaa district more attractive.<br />
4 different main packages are offered which<br />
can be always also recombined by considering<br />
the clients’ wishes, weather, client’s profile<br />
etc. The packages have been built based on the<br />
topic (go rather to hell, spa of country woman,<br />
hunter’s stories in Tori bog, master class of<br />
handicraftsmen at the edge of hell) and involve<br />
the important sightseeing and natural resources<br />
of the district. The events and activities<br />
are carried out with the local guide sharing<br />
information and stories regarding the district.<br />
The guests are actively involved in all activities<br />
by enabling them to get closer familiar with the<br />
peculiarity of Tori district and at the same time<br />
experience the joy of joint activities through<br />
personal direct experience.<br />
Different services have been connected with<br />
each other: canoe trips on Soomaa rivers<br />
(Navesti–Pärnu River), horse riding, trips with<br />
horse carriage, sauna pleasures (terrestrial or<br />
ferry sauna), development of needlework skills<br />
in handicraft chamber with instructor, hunter’s<br />
stories near Tori bog with picnic from the local<br />
caterer etc. The local raw materials are used in<br />
the food list, the providers of services are all<br />
local entrepreneurs.<br />
The cooperation network functions proceeding<br />
from the principles of saving tourism and practices<br />
green way of thinking (sorting of garbage,<br />
notifying the guests of the principles and rules<br />
of saving use of nature, taking care of the cleanliness<br />
of the surrounding, organising the events<br />
without so-called traces).<br />
The sale through cooperation network improves<br />
the quality of providing the service and the route<br />
of the client as the client can comfortably book<br />
all services from one service provider, regardless<br />
of the service provider the client first contacts.<br />
The feedback system has been used in<br />
client service, on the basis of which the development<br />
activities of products and services and<br />
the improvement of service quality take place.<br />
Most of the clients are the Estonian citizens,<br />
the percentage of foreign tourists is lower as<br />
there are less of them in the rural districts. In<br />
order to increase the percentage of foreign<br />
tourists there is cooperation with the accommodation<br />
establishment of the City of Pärnu to<br />
provide the products of nature tourism to the<br />
city and spa tourist. •<br />
17
MODESAT<br />
COMMUNICATIONs OÜ<br />
Innovator<br />
2009<br />
Modesat offers Internet for the<br />
military aircrafts or express train<br />
The title of the Innovator of the Year<br />
goes to Modesat deservedly. As the<br />
first in the world, the company solved<br />
the technological challenge to forward<br />
the broadband internet for the<br />
plane moving 1200 km in an hour.<br />
Modesat is one of the most ambitious<br />
technology companies in Estonia<br />
which patented the efficient modem<br />
technology for radio and telecommunication<br />
solutions and breaks through<br />
to the foreign markets now with it.<br />
Peep Põldsamm, the chairman of the<br />
management board of the company<br />
and the business manager Tarmo Pihl<br />
call the company the typical development<br />
company which has dealt with<br />
the scientific and applied research<br />
and as a result found the technological<br />
solution which is to be marketed<br />
now.<br />
There is nothing typical in the radio communication<br />
solution called PilotSync. This is both<br />
simple and ingenious at the same time. Its authors<br />
are the Byelorussian radio communication<br />
researchers and engineers of Modesat who<br />
developed the radar and rocket systems during<br />
the Soviet times. The Estonians took the patents<br />
necessary for the technology and entered the<br />
world market with this.<br />
PilotSync is the solution of synchronising the<br />
revolutionary radio channel which makes the<br />
communication channel much more effective<br />
and resistant for use. It allows the higher data<br />
speed and reliability and is also much cheaper.<br />
Rain, snow and leaves’ fall could have an impact<br />
on the mobile range in Estonia, as the signals<br />
could disperse, reflect, be disturbed in some<br />
other way. Though these are not influencing the<br />
communication based on Modesat technology.<br />
“During the period when the people become<br />
more and more mobile and wish to be online<br />
everywhere at any time, the data-handling capacity<br />
of the communication channel and reliability<br />
become increasingly important,“ Põldsamm<br />
states.<br />
The market required by Modesat can be divided<br />
into three. The main market is telecommunication.<br />
1.9 million radio links were sold in the<br />
world in 2008 and this number can increase by<br />
estimates in the pace of 20-30 percent a year.<br />
The lion’s share of 3G and 4G mobile operators<br />
should thoroughly update their networks within<br />
2-3 years to be able to offer mobile broadband<br />
internet. E.g. Estonian mobile operators set the<br />
restrictions of mobile internet data volume for<br />
the clients so that the overload would not incur<br />
in the network.<br />
The trend where mobile becomes the main<br />
means of mulitmedium before the computer<br />
and the domestic internet online connections<br />
are exchanged for mobile internet can be estimated<br />
everywhere. This though presumes the<br />
increase in reliability and data-handling capacity<br />
of networks.<br />
The second segment is satellite communication,<br />
more exactly broadband internet to the<br />
fast-moving objects such as airplanes, ferries<br />
etc.<br />
The third market focus is the military sector including<br />
the demand for the technologies func-<br />
18
Photo: Toomas Tuul<br />
TARMO PIHL<br />
tioning in the difficult conditions. Here the interesting<br />
topic is the confidential communication.<br />
Modesat offers here also good alternative<br />
for the current complicated radio communication<br />
encryption solution – the technology of frequency<br />
hopping enables to change the carrier<br />
frequency 10 000 times a second so that the listener<br />
is not able to establish any communication.<br />
In the fields where many have failed with tests,<br />
the employees of Modesat can confirm: they<br />
have the technological solution how to forward<br />
the broadband television signal to the very fast<br />
moving terminal, e.g. for the passenger plane<br />
moving 1200 km/h, let alone the express train<br />
racing 300 km/h.<br />
A number of different modems can be found in<br />
the product portfolio of Modesat, beginning<br />
from the radio communication modems and finishing<br />
with the satellite communication, cable<br />
and Ethernet modems. The company established<br />
itself at the market last autumn. The current<br />
development has been as planned<br />
according to Põldsamm. The understanding of<br />
the need and requirements of the market and<br />
clients has considerably improved.<br />
The negotiations are held with the tens of companies<br />
all over the world – from Italy, China,<br />
USA, Great Britain, Germany, Canada, India, Israel<br />
and elsewhere. Many of these are major<br />
publicly traded companies. Modesat has no<br />
need to actively sell already since spring, as the<br />
negotiation partners possess 85 percent of the<br />
market as a whole.<br />
The company is searching the clients neither<br />
from Estonia nor the region, as these are nonexistent<br />
here. The largest possible players are<br />
at sight, mainly the producers of cable modems<br />
and radio links, e.g. Huawei, Ericsson, Nokia<br />
Siemens Networks, Alcatel-Lucent and other<br />
major producers of network equipment. In the<br />
satellite and mobile communication side for example<br />
ViaSat, iDirect and the plane producers<br />
Boeing and Saab. But these are only part of the<br />
potential clientele.<br />
The last major milestone for the company was<br />
the establishing of the representation in Israel<br />
through the partner. Thanks to the latter the<br />
cooperation is developed with one Israel’s military<br />
industrial company in the sector of satellite<br />
communication. The new technological<br />
solution and another patent application of<br />
Modesat have been already created according<br />
to Põldsamm.<br />
Many well-known companies have shown their<br />
interest towards the Estonian company. Boeing<br />
was attracted by getting live-television to the<br />
board of the plane in the air over the Internet,<br />
then Saab was interested how to decrease the<br />
number of cables in the plane with more efficient<br />
wireless communication. The weight of the<br />
aircraft would fall with it, but the efficiency<br />
would improve.<br />
The breakthroughs though require effort and<br />
patience. It is not easy to get to the “portfolio“ of<br />
some major producer of equipment. Põldsamm<br />
says that in this business the purchases and<br />
supply chains have been created so that the replacing<br />
of one technology supplier in the whole<br />
chain should be well justified and takes years.<br />
Thus the real development leap for Modesat is<br />
still ahead.<br />
In addition to Estonia the company has the representations<br />
in Byelorussia, Russia, Israel and<br />
Silicon Valley in USA. The main research-development<br />
work will be carried out in Tomsk, Russia<br />
and in Gomel, Byelorussia. •<br />
19
Photo: Toomas Tuul<br />
Nominees for the<br />
Innovator 2009<br />
These companies which have achiev ed economic success with<br />
the help of the outstanding innovations to thereby motivate the<br />
Estonian entrepreneurs in their companies to start, support and<br />
carry out the innovative activities are recognised.<br />
EMT AS<br />
EMT is the subsidiary of AS Eesti Telekom which<br />
started its activities in the year 1991. The sector<br />
of activities of EMT is the establishing and management<br />
of the mobile communication networks<br />
and systems and the production,<br />
distribution and sale of the related services. In<br />
2008 AS EMT redeveloped 3G network which enables<br />
the fast review of the data communication,<br />
videocall and teleclips and live shows in the mobile.<br />
The number of contractual clients as at the<br />
end of 2008 was 487 thousand, the calling cards<br />
with prepayment made total of 292 thousand.<br />
EMT submitted the innovative service of EMT –<br />
internet calls of EMT to the competition of innovator.<br />
The internet calls of EMT are the uptodate<br />
communication environment offered by EMT<br />
(such as Skype or MSN) which enables to use<br />
several services such as call, videocall, express<br />
messages and status information regardless of<br />
the geographical location over the public internet<br />
and save the expenses. The solution is<br />
based on EMT mobile number and also Elion’s<br />
phone number can be connected with the solution<br />
which enables to optimise the expenses.<br />
In the viewpoint of innovation this is an essential<br />
step where the provider of communication service<br />
goes beyond the frames of classical business<br />
model and makes the first step towards<br />
the multifunctional solution where the use of<br />
the service is not dependent on the equipment<br />
with which it is turned to the service, as both the<br />
mobile, desk phone and computer can be used<br />
on the same bases and with the same price:<br />
• The system always looks for the cheapest<br />
tariff for the client using the service (e.g.<br />
when calling from abroad from mobile to<br />
mobile the call is with the cost of local call of<br />
the package of short numbers inside the<br />
company; when calling from mobile to desk<br />
phone with the cost of local call between the<br />
desk phones);<br />
• The business clients having joined the system<br />
communicate with each other free of<br />
charge (the monthly fee of 99 kroons is paid<br />
for the service).<br />
In the viewpoint of EMT the service has the impact<br />
of improving the clients’ loyalty. The service<br />
is useful for EMT clients and foremost abroad<br />
where it is possible to call and receive calls free<br />
of charge or with the local price of using WiFi<br />
(WiFi is often chargeable abroad, but still<br />
cheaper than the mobile call).<br />
NOW! INNOVATIONS OÜ<br />
The company was established in 2003, the activities<br />
were started in 2006. The main activity of<br />
the company is the development of the management<br />
systems of digital permits and selling<br />
of licences in different countries. Foremost this<br />
means the development and sale of digital<br />
parking organisation systems. The sales of the<br />
company was 4 million kroons in 2008, 5 persons<br />
were employed.<br />
In 2008 the Belgian holding company Mobilefor<br />
was sold to the Belgian largest telecom operator<br />
Belgacom Group. 10% of the local<br />
operator company MobileNOW! LLC was acquired<br />
in USA.<br />
The company submitted the parking system<br />
ParkNOW! ParkNOW! to the innovator competition<br />
which is the diverse digital system enabling<br />
both mobile parking and other digital solutions<br />
of payment for parking, incl RFID, NFD, Internet:<br />
• RFID (Radio Frequency Identification): by<br />
using RFID-stickers on the car, the entering<br />
and exiting of the car from the parking area is<br />
automatically fixed and the payment for parking<br />
is made automatically from the account of<br />
the mobile phone;<br />
• NFD (Near Field Detection) system: RFID receiver<br />
in the mobile is directed to NFD-sticker<br />
by fixing the beginning and end of parking in<br />
the given parking area, the payment of invoice<br />
is made automatically from the account of the<br />
mobile phone.<br />
The system has been created by considering<br />
both the administration, reporting and analysing<br />
needs of the parking operator (e.g. city) as well<br />
as the comfortable use by the end users. Major<br />
focus has been placed on the flexibility of the<br />
system, i.e. this can be relatively easily, fast and<br />
cheap implemented in any business, legal or<br />
technical environment. E.g. the physical activities<br />
(installation of parking automats, collection<br />
of coins etc.) will be changed digital, at the<br />
same time in the poorer countries the parking<br />
regulation can be started without major investments.<br />
This is the main product of the company<br />
and provides 99% of the company’s sales. At the<br />
moment there is business in already 7 countries<br />
and the negotiations are held in 20 countries. As<br />
to the number of users ParkNOW! has risen<br />
among 5 world leading mobile parking systems<br />
within three years. In addition to the increase in<br />
the satisfaction of the consumers ParkNOW!<br />
contributes to the environmental thriftiness (the<br />
providers of parking service require no expensive<br />
additional investments for the acquisition<br />
of parking systems or additional human resources<br />
for the service control). •<br />
20
Flow Service OÜ<br />
Developer of the Year<br />
2009<br />
Photo: Toomas Tuul<br />
LIISI LAANET<br />
Boom company which<br />
did not get greedy<br />
Flow Service rendering services to the<br />
food industries sailed along with the<br />
success of its clients during the boom,<br />
but did not get greedy. Differently<br />
from many other Estonian companies<br />
having developed very fast during the<br />
economic boom and which have taken<br />
too many risks, over-invested and are<br />
today in difficulties, Flow Service<br />
could stay cool, heading now more<br />
vigorously to the Latvian market.<br />
The company, established just a couple of years<br />
ago, deals with the production, installation and<br />
maintenance of the equipment for the Estonian,<br />
Latvian and Finnish food industries. It also<br />
deals with the moving of such equipment. The<br />
loyal customers of Flow are major players,<br />
mainly the milk and beer industries - for example,<br />
Olvi group companies A. Le Coq Tartu<br />
Brewery and Latvian Cesu Alus, also Coca-Cola<br />
HBC and the companies of Tere group. One of<br />
the major clients of the recent times is Maag<br />
Piimatööstus.<br />
Liisi Laanet, the managing director of Flow Service,<br />
says that the company carries out the “all-in”<br />
works. The company organises everything from<br />
the design of the equipment or solution up to the<br />
automation works, launching and maintenance.<br />
If someone needs the connecting of the equipment<br />
of the filling workshop, cabling of ventilation,<br />
mounting of the equipment of the yeast<br />
preservation and growing room, exchange of the<br />
pumps of the washing line, replacement of the<br />
covers of the cheese tubs or reconstruction of<br />
the meat loading line, Flow is the right place to<br />
21
Photo: Toomas Tuul<br />
turn to. Flow also helps to organise everything if<br />
the bottle washing machine needs to be demounted<br />
in Holland and moved to Estonia as was<br />
required by Coca-Cola. For example, the brewer<br />
has been moved from Latvia Cesis to Germany.<br />
The latter was taken into parts, put on the truck,<br />
taken to Germany and there also mounted.<br />
“We pursue to provide quality and as integral solutions<br />
as possible,“ Laanet says. Different solutions<br />
– more expensive and cheaper, more<br />
effective and less effective – are offered to the<br />
client. There is quite a pile of different product<br />
catalogues on the office desk of Flow. “The client<br />
says what it wants. We find the solution, offer the<br />
variants and complete these,“ Laanet says.<br />
The main cooperation partner is one of the<br />
world’s leading providers of special solution of<br />
food industries - the Swedish major group Alfa<br />
Laval which has representations in Estonia and<br />
Latvia. Flow also deals slightly with production,<br />
by making the pipe collectors, smaller containers<br />
etc in Tallinn.<br />
What is most important in this business? “Reliability,“<br />
Laanet says. If you prepare an unreasonably<br />
big invoice for the client, it would search<br />
someone else as a partner next time. Also, all<br />
equipment should be faultlessly functioning so<br />
that the producer would not lose money. But the<br />
highest risk? As the works are project-based,<br />
the next project might not come.“ The projects<br />
planned long in advance could be unexpectedly<br />
changed or cancelled, depending on whether<br />
the plans of the industries are successful. Up to<br />
now the company has been operating only in the<br />
period of economic growth. Now one should adjust<br />
to the new situation.<br />
“Our growth is partly due to the success of our<br />
clients. They have been able to invest a lot. If<br />
they are doing well, so are we and vice versa,“<br />
she says. The company has not experienced<br />
considerable fall in work volume. In the opinion<br />
of Laanet the reason is that no one leaves the<br />
food products non-purchased, whatever the circumstances<br />
might be.<br />
One of the most recent plans of Flow is to enter<br />
more powerfully to the Latvian market. The Latvian<br />
economy is still in deep crisis, but this is<br />
just the best time according to Laanet. No major<br />
risks will be though taken in the south.<br />
Flow Service has twenty employees, the majority<br />
of whom are the locksmiths and welders. All<br />
employees are the specialists of their field who<br />
often participate in the trainings and visit international<br />
fairs to be well aware of the most recent<br />
solutions.<br />
WORKS PERFORMED BY FLOW SERVICE<br />
• Norfolier AS – cabling of oxidizer and ventilation<br />
• Värska Vesi AS – connecting the equipment<br />
of the new filling workshop, construction of<br />
water treatment systems and tube plates,<br />
installation of mixers<br />
• Cesu Alus – matrix for 8 measure tanks, reconstruction<br />
of mixer of soft drinks, distribution<br />
knot of syrup, construction of the new<br />
CIP line and reconstruction of the old ones,<br />
expansion of brewing cellar – 8 new brewing<br />
tanks including the reconstruction of the old<br />
part, installation of GEA beer separator, installation<br />
of the new labeller for PET line,<br />
changes of conveyors and installation of roll<br />
tracks in bottling line of the glass bottle, installation<br />
of the equipment of the yeast<br />
preservation and growing room.<br />
• A.Le Coq Tartu Õlletehas AS – moving and<br />
installation of the mixer, installation of the<br />
new PET line, mounting of the transporter<br />
tracks, reconstruction of mixture.<br />
• Kalev Paide Production Unit – construction<br />
of CIP line.<br />
• Coca-Cola HBC AS – exchange of the pumps<br />
of the washing line of the glass bottle.<br />
• Delimeat OÜ – reconstruction of meat loading<br />
line, platforms.<br />
• Steelmans OY – replacement of the covers of<br />
the cheese tubs of Valio Lapinlahti.<br />
• Pärnu Õlu AS – reconstruction of the water<br />
collector and brewing tank cooling system<br />
• IMCO – moving of Idealplast from Sweden to<br />
Tallinn including installation.<br />
• Põltsamaa Felix – installation of pasteurization<br />
and washing centre.<br />
• Põlva Piim – pasteurization connection<br />
pipes, connection pipes of mixer, connection<br />
of containers.<br />
• Saarek AS – connection of the filling equipment<br />
of kettle and containers, pipelines of<br />
the washing centre.<br />
• A Le Coq Tartu Õlletehas – fittings of the new<br />
logistics centre.<br />
• Coca-Cola HBC Eesti AS – dismantling of the<br />
bottle washing machine and transport from<br />
Holland; construction of the new CIP centre.<br />
• Cesu Alus – installation of the new brewer.<br />
• Bayerische Löwenbrauerei Passau – moving<br />
of brewer from Cesis to Passau.<br />
• Maag Piimatööstus AS – construction of CIP<br />
centre and installation and launching of the<br />
production line of cottage cheese. •<br />
22
Photo: Rauno Volmar<br />
Nominees for the Developer<br />
of the Year 2009<br />
This category pays recognition to the<br />
lately started and well-developed<br />
companies which are sustainable with<br />
fast growth and deal actively with<br />
product development. The third year<br />
of operations is often the critical period<br />
in the company’s development<br />
and the operations of more than three<br />
years have mostly longer term success.<br />
Therefore the state and business<br />
organisations require to present the<br />
companies which have appeared to be<br />
fast –growing and developing within<br />
the first three years of operations and<br />
which can be considered sustainable.<br />
The specification of the winner helps<br />
to bring the new small company having<br />
entered the market most successfully<br />
to the fore.<br />
GSM VALVE OÜ<br />
GSM Valve OÜ provides wireless home and car<br />
alarm systems which notify the client and the<br />
persons appointed by it of the emergency situations<br />
by mobile communication. The GPSbased<br />
logistics services are provided as the<br />
second business branch.<br />
In case of emergency the security system calls<br />
to the contact numbers set by the client to<br />
arouse interest and the SMS arriving to the mobile<br />
phone includes the exact information from<br />
which sensor the signal came from. Thus the<br />
client knows exactly what kind of room and<br />
emergency (movement, smoke or other sensor)<br />
is dealt with in his house and also knows how to<br />
respond.<br />
The company operates since 2005, having indicated<br />
considerable growth each year. The competitive<br />
advantage of GSM Valve OÜ is the good<br />
product, right timing and intensive sales policy<br />
which has made the company well-known with<br />
short time and it is taken as the experienced<br />
partner at the market. GSM Valve OÜ provides<br />
services all over Estonia, also it has subsidiaries<br />
in Latvia and Lithuania where the<br />
leader position will be achieved with a couple of<br />
years. In Estonia and Latvia GSM Valve has over<br />
4500 private clients and over 300 business companies<br />
using GPS-logistics service. GSM Valve<br />
OÜ used the grants offered by Enterprise Estonia<br />
in its development – consultation grant,<br />
start-up company grant, export marketing<br />
grant and the development personnel secondment<br />
grant.<br />
KUUSK OÜ<br />
Kuusk OÜ was established in 2005 as the company<br />
providing the event marketing services.<br />
Aivar Kuusk, the founder, manager and visionary<br />
of the company, had operated in the sector<br />
already for more than 10 years by that time.<br />
Kuusk OÜ has developed stable, having preserved<br />
the loyal clients and by establishing the<br />
dignified moments for the prosperity of their<br />
business. The secret of the company’s success<br />
could be the good knowledge and perceiving of<br />
one’s clients, also devotion and conviction that<br />
just that work should be done that you love.<br />
The sales of Kuusk OÜ reached 12.7 million<br />
kroons in 2008 and gained the profit of approximately<br />
0.5 million kroons. The company provided<br />
work for three employees. •<br />
Nominees for the Developer of the Year 2009<br />
Enterprise Main activity Estbalished Sales 2008 Sales 2007 Change in Net profit 2008 Net profit 2007 Cange in Employees<br />
(th EEK) (th EEK) sales (%) (th EEK) (th EEK) net profit (%)<br />
FLOW SERVICE OÜ Design and installation of the food industry equipment 2005 18,844.8 16,151.9 14.3 1,112.9 638.7 42.6 19<br />
GSM VALVE OÜ Operating of security systems 2005 22,970.1 13,361.7 41.8 1,731.0 1,050.8 39.3 20<br />
KUUSK OÜ Marketing agency 2005 12,767.1 11,318.0 11.4 467.7 332.8 28.8 3<br />
www.konkurents.ee<br />
1 EUR = 15.6466 EEK; 1 EEK = 0.0639 EUR; based on 2008 data<br />
23
ABB AS<br />
Foreign Investor<br />
2009<br />
Bo Henriksson:<br />
“Estonia is still<br />
an attractive<br />
economic<br />
environment”<br />
Bo Henriksson, the managing director<br />
of ABB Baltikum, believes that in spite<br />
of everything Estonia is continuously<br />
an attractive economic environment.<br />
Though, even more should be contributed<br />
to the innovation and education<br />
and the relations with Russia<br />
should be improved.<br />
ABB takes the titles of the competition<br />
of Entrepreneurship Award every year.<br />
What do these titles tell you?<br />
The company’s owners and managers continuously<br />
believe in investing to Estonia and we have<br />
good employees – nice skilled workers, capable<br />
specialists, engineers and capable managers<br />
who create sufficient added value. ABB has invested<br />
to Estonia more than a billion kroons<br />
within 17 years, the major part of it within the<br />
last seven years. We produce in four plants in<br />
Estonia which employs the total of thousand<br />
people.<br />
In annual FT Global 500 ranking list of the business<br />
newspaper Financial Times which lists the<br />
companies according to the market value, ABB<br />
group is located on the 123rd place with the<br />
market value of 32 billion dollars and leads in<br />
the sector of industrial technology. No one<br />
among 122 companies in the table above have<br />
comparable production or development activities<br />
at the Estonian market.<br />
How have the economic crisis and<br />
the abrupt amendments of law in Toompea<br />
influenced the activities of ABB?<br />
We are mostly influenced by the processes at<br />
the world market –approximately 70 percent of<br />
the sales is related to export. The investments<br />
of our private clients are to a large extent dependent<br />
on the balance of the money market.<br />
Some of them have postponed their investments.<br />
The situation is much more stable in the<br />
business sector related to the establishing of<br />
the transfer and distribution network. This year<br />
we somewhat decreased the production. The<br />
record result of 2008 (the sale of 2.6 billion<br />
kroons) will not be repeated this year or also<br />
next year. But since 2010 the situation should<br />
become stable. This year our investments<br />
would obviously remain smaller than last year<br />
which reached 260 million kroons. I do not believe<br />
that the processes in Toompea could damage<br />
the economic environment so that this<br />
would have an impact on our activities. Only political<br />
earthquake, replacement of democracy<br />
with totalitarism would make ABB to terminate<br />
the activities of its plants here. The situation<br />
where the state would decide to nationalise<br />
ABB. But maybe not, as the group functions<br />
successfully in the conditions of different<br />
regimes and economic models.<br />
If you could be the Estonian prime<br />
minister now, which five decisions<br />
were the first to be made by you ?<br />
In order to change the economic environment<br />
I would warm up the relations with Russia. This<br />
would provide many new opportunities. I would<br />
also review the current policy of education, by<br />
contributing more to the engineer-technical<br />
specialties. I would support more innovation<br />
and export, by offering export benefits. Export<br />
is one of the main economic engines of Estonia.<br />
Also, I would search more compromises which<br />
would create higher political stability.<br />
24
Photo: Toomas Tuul<br />
BO HENRIKSSON<br />
Do you believe that Estonia is<br />
continuously an attractive economic<br />
environment in the future?<br />
Surely at least as attractive as up to now and<br />
this thanks to the flexible economic policy and<br />
open business climate. The government sector<br />
has not hindered the development of economy,<br />
the indicators of freedom of economy stay<br />
high. The favourable economic geographical<br />
location and closeness with the key markets is<br />
also important for us. The Estonian labour<br />
market offers many choices today, by enabling<br />
to respond operatively to the changes. The Estonian<br />
employees have a good qualification and<br />
knowhow, also the specific cost advantage in<br />
the region of the Baltic Sea. The high taxation<br />
of labour – one of the highest in Europe – is a<br />
serious risk. The government should deal with<br />
the latter, otherwise Estonia soon becomes the<br />
country with high price level which is not able<br />
to compete.<br />
ABB is a mammoth group.<br />
What is the role and importance<br />
of the Estonian unit in its hierarchy?<br />
ABB operates in approximately hundred countries,<br />
i.e. practically in half of the world’s countries.<br />
120 000 people have been employed in the<br />
group. Estonia makes a small part of it. But we<br />
have fulfilled the objective of ABB, according to<br />
which it is essential to achieve the strong position<br />
at all markets where we operate. Thanks to<br />
our high percentage of export we are in the<br />
stronger position in the group. I would bring the<br />
plant of electrical machinery and industrial<br />
electronics to the fore where the considerable<br />
part of the wind generators and frequency<br />
transformers for the world’s leading windmill<br />
producers and developers of windparks is produced.<br />
What is the starting point of<br />
ABB’s more forceful direction<br />
towards the renewable energy?<br />
Our vision is to be the world’s leading energy<br />
companies and help the clients to use the electricity<br />
in a more efficient and sustainable way.<br />
According to the estimates the electricity consumption<br />
increases by 2030 from the current<br />
level by about 100 percent. At the same time the<br />
potential of energy saving is enormous. The<br />
losses could reach up to 80 percent. ABB’s<br />
technologies decrease the losses up to 30 percent.<br />
The greenest energy is the saved energy.<br />
As to renewable energy ABB is represented both<br />
in hydro, wind, sun and wave energy. For example<br />
in China, in the project of the Three Gorges<br />
Dam, ABB built the network connection, supplied<br />
transformers to the US wind energy company,<br />
provided the launch-ready solutions for<br />
the sun energy station in Spain and the specially<br />
adjusted generators for the Portuguese wave<br />
energy company. The potential of renewable energy<br />
is immense and there could be no losers<br />
wide-scale in the process of increasing its percentage.<br />
What else is important for ABB?<br />
Our main competitive advantage is innovativeness.<br />
ABB group has in the recent years invested<br />
to the research and development activities more<br />
than a billion dollars a year. Approximately 6000<br />
researchers and engineers work with the new<br />
products and solutions in cooperation with 70<br />
universities. For example, ABB invented in China<br />
how to transmit the hydro energy to the distance<br />
of 2000 kilometres. In India, where the reliability<br />
of electricity network with 53 million consumers<br />
was to be improved, ABB built so-called smart<br />
network which regulates the load in real time.<br />
ABB has created several revolutionary technologies<br />
which shift the current understandings beyond<br />
the limits of technologies. Lately the<br />
switchgear which allows more than million volt<br />
electricity was completed. This is the new record<br />
of voltage level. The importance of our products<br />
is hard to be explained to the regular consumer.<br />
The definition frequency transformer says obviously<br />
a little. But if we compare the car’s gear<br />
shift system - if the gears cannot be changed<br />
and the driver would push the gas constantly to<br />
the full, it would end bad. The same applies to<br />
the electric engines. The regular engines without<br />
additional equipment work always on full capacity,<br />
but up to 70 percent of the energy of the<br />
engines can be saved by varying the speed of the<br />
engine proceeding from the actual need of energy.<br />
Today only 5 percent of the engines have<br />
been equipped with the energy-saving frequency<br />
transformers. •<br />
25
Photo: Toomas Tuul<br />
Nominees<br />
for the Foreign<br />
Investor 2009<br />
We pay recognition to the companies<br />
which have specially outstood with the<br />
volume of direct foreign investments<br />
made to Estonia and the contribution<br />
to the Estonian life of economy<br />
through the involvement of new technologies<br />
and creating of jobs with high<br />
qualification.<br />
WENDRE AS<br />
AS Wendre was established in 1996. The owner<br />
of the company is Peter Hunt, the foreign Estonian<br />
residing in Sweden, through Wendre<br />
Scandinavia AB.<br />
AS Wendre produces the blankets, porolone<br />
products, pillows and mattresses. The company’s<br />
production units are located in Pärnu<br />
and Vändra, also the plant in Poland and sales<br />
representation in Germany belong to Wendre.<br />
Several development projects are in operation,<br />
by which the production will be changed more<br />
complicated and the choice will be expanded.<br />
The company has constant active product development,<br />
many components are purchased<br />
from other Estonian producers, by providing<br />
thus work to them. About 96% of the production<br />
is export.<br />
Wendre is well-managed and balanced developing<br />
company which is not fulfilling only procurement<br />
works, but deals with the independent<br />
product development and sales work and<br />
new development projects – in 2008 more than<br />
5 million kroons were invested to the new products<br />
and technologies. Also, the company proceeds<br />
from the environment-saving production<br />
(waste management project is planned). It is<br />
also important that Wendre would provide work<br />
for approximately 700 employees.<br />
JELD-WEN EESTI AS<br />
JELD-WEN Eesti AS is the part of JELD-WEN<br />
Door Solutions which in its turn is the part of<br />
the world’s largest door and window producer<br />
AS JELD-WEN.<br />
JELD-WEN was established in 1960 with 15<br />
employees as the small company in Klamath<br />
Falls in Oregon State in the western coast of<br />
USA. Today JELD-WEN produces both windows<br />
and doors and the company has production<br />
units in 22 countries by employing more than<br />
20 000 employees. The main products of the<br />
plant located in Rakvere are the inner and outer<br />
doors and doorhandles. More than 700 persons<br />
are employed in total of three shifts in the plant.<br />
The company located in Rakvere was established<br />
in 1997 by the Danish company Vest<br />
Wood AS. In 2006 the American door and window<br />
producer JELD-WEN Inc. purchased Vest-<br />
Wood AS and in October 2007 Vest-Wood got the<br />
new name of JELD-WEN Door Solutions.<br />
The sales office of the Baltic countries is also<br />
located in Rakvere which markets the products<br />
of JELD-WEN AS under the trademarks SWE-<br />
DOOR and JELD-WEN. The sales of the company<br />
reached approximately 650 million kroons<br />
in 2008 and the profit 53 million kroons. The<br />
work is provided to more than 700 persons by<br />
being one of the major employers in Lääne-<br />
Virumaa. •<br />
Nominees for the Foreign Investor 2009<br />
Enterprise Main activity Sales 2008 Total amount of Share of export Net profit Added value Employees<br />
(th EEK) investment in in sales 2008 per employee<br />
Estonia (th EEK) 2008 (%) (th EEK) 2008 (th EEK)<br />
ABB AS Design, preparation, sale and maintenance of the energy and automation products and systems 2,570,000 1,107,423 70 147,000 563.4 1,069<br />
WENDRE AS Production of textile products 1,017,834 494,000 96 11,216 380.5 670<br />
JELD-WEN EESTI AS Production of textile products 648,718 250,119 88 53,685 356.9 715<br />
www.konkurents.ee<br />
1 EUR = 15.6466 EEK; 1 EEK = 0.0639 EUR; based on 2008 data<br />
26
The History of the Entrepreneurship Award<br />
Contest of<br />
Foreign Investor<br />
1995<br />
Main prize: AS Eesti Telefon<br />
1996<br />
Main prize: AS Elcoteq Tallinn<br />
Foreign Investor Who Has Introduced Estonia:<br />
Tolaram Grupp<br />
Export Developer:<br />
AS Kunda Nordic Tsement<br />
Jobs Creator:<br />
AS Loksa Laevaremonditehas<br />
Launcher Of Modern Environmentally<br />
Friendly Technology: Ragn-Sells AS<br />
1997<br />
Main prize: Tolaram Grupp<br />
Export Developer:<br />
Kreenholmi Valduse AS<br />
Jobs Creator: AS Järvakandi Klaas<br />
Products Quality Developer:<br />
AS Elcoteq Tallinn<br />
Largest Investment:<br />
AS Eesti Merelaevandus<br />
1998<br />
Main prize: AS Hansapank<br />
Export Developer: Tolaram Grupp<br />
Jobs Creator: AS Britannic Eesti AS<br />
Products Quality Developer: AS Elcoteq Tallinn<br />
Largest Foreign Investment: AS Hansapank<br />
1999<br />
Main prize: AS Kunda Nordic Tsement<br />
Export Developer: OÜ HTM Sport Eesti<br />
Jobs Creator: Lindegaard Eesti AS<br />
Largest Investment: AS Eesti Telekom<br />
Innovator: OÜ JOT Eesti<br />
Export Forum<br />
1997<br />
Main prize: AS Norma<br />
Small and Medium-Sized Exporter:<br />
AS Viljandi Aken ja Uks<br />
Exporter With Rapid Development:<br />
AS Balteco<br />
Jobs Creator: AS Elcoteq Tallinn<br />
User Of Domestic Raw Materials: AS Viisnurk<br />
1998<br />
Main prize: Kreenholmi Valduse AS<br />
Small and Medium-Sized Exporter:<br />
AS Rõngu Tehas<br />
Exporter With Rapid Development: AS Tarkon<br />
Jobs Creator: AS Toom Tekstiil<br />
User Of Domestic Raw Materials:<br />
AS Repo Vabrikud<br />
1999<br />
Main prize: Viisnurk AS<br />
Small and Medium-Sized Exporter: AS<br />
Hansa Candle<br />
Exporter With Rapid Development:<br />
AS Wendre<br />
Jobs Creator: AS Repo Vabrikud<br />
Entrepreneurship<br />
Award<br />
2000<br />
Main prize: AS Viisnurk<br />
Small and Medium-Sized Company:<br />
AS Mikskaar<br />
Exporter: AS Silmet<br />
Foreign investor: OÜ JOT Eesti<br />
Technology Developer: OÜ JOT Eesti<br />
Tourism Innovator: Reval Hotelligrupi AS<br />
Area Developer: AS Viisnurk<br />
2001<br />
Main prize: AS Silmet<br />
Small and Medium-Sized Company:<br />
AS Viljandi Liimpuit<br />
Exporter: AS Silmet<br />
Foreign investor:<br />
„Horizon” Tselluloosi ja Paberi AS<br />
Technology Developer: AS Silmet<br />
Tourism Innovator:<br />
Ammende Villa Catering OÜ<br />
Area Developer: AS Silmet<br />
2003 *<br />
Main prize: BLRT Grupp AS<br />
Small and Medium-Sized Company: Viking<br />
Window AS<br />
Exporter: BLRT Grupp AS<br />
Foreign investor: Velsicol Eesti AS<br />
Technology Developer: OÜ Curonia Research<br />
Tourism Innovator: AS Tallink Grupp<br />
Area Developer: Velsicol Eesti AS<br />
2004<br />
Main prize: AS Viljandi Metall<br />
Suurexporter: OÜ Krimelte<br />
Small and Medium-Sized Exporter:<br />
Mountain Loghome OÜ<br />
Foreign investor: AS Imavere Saeveski<br />
Technology Developer: Aqris Software AS<br />
Tourism Innovator (large company):<br />
AS Estonian Air<br />
Tourism Innovator (small company):<br />
OÜ Pintmann Grupp<br />
Area Developer: AS Viljandi Metall<br />
2005<br />
Main prize: Regio AS<br />
Exporter: Polimoon AS<br />
Foreign investor: Elcoteq Tallinn AS<br />
Tourism Innovator: Estravel AS<br />
Area Developer:<br />
Pühajärve Puhkekodu AS<br />
Innovator: Regio AS<br />
2006<br />
Main prize: Vertex Estonia AS<br />
Internationalizer: Regio AS<br />
Foreign investor: Enics Eesti AS<br />
Area Developer: Põltsamaa Felix AS<br />
Tourism Innovator: Otepää Seikluspark OÜ<br />
Developer of the Year: Haka Plast OÜ<br />
Innovator: Vertex Estonia AS<br />
2007<br />
Main prize: Tallink Grupp AS<br />
Tourism Innovator: Tallink Grupp AS<br />
Innovator: Elion Ettevõtted AS<br />
Exporter: Krimelte OÜ<br />
Foreign investor: ABB AS<br />
Area Developer:<br />
Viking Windows AS<br />
Tööstusettevõte: VKG Oil AS<br />
Developer of the Year:<br />
Nova Haus Element AS<br />
2008<br />
Main prize: ABB AS<br />
Foreign investor: ABB AS<br />
Tourism Innovator:<br />
Emajõe Lodjaselts MTÜ<br />
Innovator: VKG Oil AS<br />
Exporter: Ecometal AS<br />
Manufacturing Enterprise: Favor AS<br />
Developer of the Year: Tiptiptap OÜ<br />
* Since 2003, the contest has been named after the year when the prize is announced, not after one from which the operating results are evaluated.<br />
27
Estonian Companies’ Competitiveness Ranking 2009<br />
Place<br />
2008<br />
2007<br />
2006<br />
Sales Change Net profit Change Return Labour costs Efficiency per Investments %<br />
Enterprise in sales in net profit on equity per employee employee of the first<br />
*group<br />
th. EEK place % place th. EEK place % place % place EEK/month place th. EEK place th. EEK place (0...100)<br />
1 2 2 MAZEIKIU NAFTA TRADING HOUSE OÜ 7,911,943 3 136.3 54 35,389 55 101.8 138 63.1 32 104,352 1 879,105 1 309 243 100.0%<br />
2 1 1 SWEDBANK AS* 15,553,500 1 103.3 218 6,109,100 1 82.9 194 18.8 195 29,579 70 1,868 146 886,200 4 95.5%<br />
3 1 TALLINK GRUPP AS* 12,310,015 2 103.4 216 317,976 9 30.3 284 3.1 306 32,549 48 1,875 144 4,240,289 1 81.9%<br />
4 RIVERSIDE OÜ 131,003 107 506.7 4 11,081 92 100 142 1385.1 1 24,124 133 5,240 40 211 261 62.7%<br />
5 BLOOM OÜ 1,584 350 3,088.9 1 77 316 227.5 33 200.0 5 10,056 327 792 276 326 240 55.4%<br />
6 POLVEN OÜ* 69,383 159 107.2 187 1,570 229 1,984.9 1 14.2 227 38,622 23 2,478 103 2,061 158 54.7%<br />
7 365 386 SEMETRON AS* 154,950 98 173.3 22 15,649 78 930.5 3 40.5 85 28,322 87 3,297 72 1,294 178 52.2%<br />
8 FIBROTX OÜ 7,621 312 1,251.0 2 1,173 240 90.9 171 60.0 38 18,600 222 586 307 28 306 49.3%<br />
9 3 3 EESTI TELEKOM AS* 6,189,597 5 98.9 257 1,438,265 2 95.2 162 33.4 110 31,512 60 2,644 92 754,782 5 49.1%<br />
10 ROMEC METALL OÜ 18,656 264 210.0 13 2,621 195 771.0 4 124.6 6 22,981 147 1,333 194 571 213 48.3%<br />
11 PULEIUM OÜ 4,360 330 172.5 24 876 252 931.0 2 96.2 10 9,151 334 1,090 222 553 215 47.0%<br />
12 NORPE EESTI OSAÜHING* 66,780 162 171.4 26 3,252 183 282.3 20 48.8 55 74,846 3 33,390 4 16 313 46.6%<br />
13 CLAIRE FOODS OÜ 87,434 134 140.5 48 4,154 162 709.6 5 67.3 23 33,650 45 21,858 5 35 303 46.6%<br />
14 91 16 KAVIAL OÜ 29,345 227 103.9 212 6,125 128 89.9 173 1208.0 2 15,317 262 1,630 167 159 270 44.8%<br />
15 17 5 11 BLRT GRUPP AS* 5,990,127 6 129.7 73 762,070 4 150.2 71 23.7 157 23,222 142 1,845 148 487,433 8 42.6%<br />
16 ÜLIKOOLILINNA ÄRIKESKUS AS 23,393 247 1,124.1 3 -399 338 -0.5 324 2,979 353 5,848 32 275,312 15 41.7%<br />
17 ADVISIO OÜ* 10,393 296 272.7 9 3,436 177 532.9 7 119.3 7 21,082 178 799 271 200 265 41.5%<br />
18 HALJAS AS 249,401 69 122.8 98 10,683 95 660.3 6 42.1 77 26,695 107 4,890 44 5,285 102 40.9%<br />
19 36 73 119 NORDECON EHITUS AS 659,782 38 100.7 238 75,080 29 100.7 141 40.3 88 79,524 2 9,425 18 320 40.0%<br />
20 6 5 EMT AS* 3,682,000 10 94.3 274 965,000 3 103.2 136 57.8 40 33,988 41 6,731 29 297,000 14 39.0%<br />
21 237 LINXTELECOM ESTONIA OÜ 93,858 124 137.0 52 10,189 99 411.0 12 36.9 97 41,525 16 3,129 78 7,691 85 37.3%<br />
22 18 7 25 TALLINNA KAUBAMAJA AS* 6,531,420 4 110.8 162 83,129 27 20.2 296 4.5 296 15,063 267 1,764 158 1,120,517 2 36.7%<br />
23 SMS LAEN AS* 90,415 129 125.4 89 25,186 65 236.2 30 64.0 27 52,377 6 4,305 54 1,429 174 35.4%<br />
24 136 69 FILTER AS* 605,212 42 169.7 29 80,260 28 273.3 21 68.6 21 37,291 30 3,759 65 9,308 78 34.8%<br />
25 39 61 103 VKG OIL AS* 1,492,343 19 102.1 227 573,136 5 174.0 53 37.6 96 18,130 232 2,471 104 994,186 3 34.3%<br />
26 107 K-PROJEKT AS 79,845 146 244.7 10 11,915 87 226.8 34 55.3 45 38,524 25 868 259 2,034 160 34.2%<br />
27 MERKO EHITUS AS* 4,653,933 7 84.5 311 299,140 11 54.9 245 14.4 223 38,570 24 4,466 50 66,452 30 33.7%<br />
28 290 AIK-PROJEKT OÜ 3,868 333 83.3 317 793 255 422.4 11 70.2 19 33,103 46 774 277 26 308 33.6%<br />
29 166 OILSEEDS TRADE AS* 278,372 64 170.7 28 8,921 106 435.0 10 100.3 8 15,341 261 13,256 12 8,959 80 33.2%<br />
30 UTILEEK OÜ 20,649 255 208.6 14 1,992 215 64.1 223 510.7 3 15,530 259 2,950 86 3,300 127 33.1%<br />
31 DEMIDOV INDUSTRIES AS 352,166 57 137.1 51 43,014 47 383.5 13 56.9 41 27,501 95 5,503 36 5,455 99 33.1%<br />
32 OÜ ADEPTE* 21,891 252 286.1 8 14,745 80 91.9 169 31.0 122 45,742 12 2,189 118 32,558 45 32.9%<br />
33 91 52 197 ABB AS* 2,570,000 14 151.2 37 147,000 17 165.2 64 34.0 107 27,518 94 2,404 107 260,000 16 32.8%<br />
34 21 6 12 ELION ETTEVÕTTED AS* 3,293,383 12 106.7 189 488,441 7 82.4 198 23.8 156 26,672 108 2,200 117 428,000 9 32.7%<br />
35 35 31 18 KEMIRA GROWHOW AS 1,622,858 18 140.5 47 30,293 59 78.5 206 18.2 200 46,823 10 50,714 3 327 239 32.5%<br />
36 130 AIR MAINTENANCE ESTONIA AS 198,331 84 119.0 111 29,824 60 307.9 18 96.0 11 32,003 53 1,280 201 5,275 103 31.9%<br />
37 CORPORE AS* 24,902 240 132.2 67 3,531 176 225.2 36 63.6 29 43,355 14 1,660 166 88 285 31.8%<br />
38 541 REAALSÜSTEEMID AS 12,184 288 92.3 283 2,025 213 525.2 8 13.1 240 21,099 177 1,108 220 98 280 31.7%<br />
39 15 33 21 NORDIC CONTRACTORS AS* 3,972,037 8 105.1 205 53,556 39 13.6 309 4.8 292 35,107 36 3,110 79 417,094 11 31.5%<br />
40 23 GILD PARTNERS AS* 156,108 97 116.5 128 67,534 34 83.9 192 63.4 31 56,408 5 2,439 105 3,688 122 31.5%<br />
41 22 15 31 NORDECON INTERNATIONAL AS* 3,867,917 9 103.1 220 171,316 14 59.1 231 20.5 183 33,714 43 3,140 77 150,294 19 31.3%<br />
42 239 FIXTEC AS 8,303 305 106.4 193 521 272 291.9 19 42.6 75 39,432 21 2,768 89 326 31.3%<br />
43 258 335 FORTUM TARTU AS* 237,649 73 122.4 100 40,005 51 246.4 27 15.5 215 24,309 129 2,502 98 737,182 6 31.1%<br />
44 523 GALVI-LINDA AS 46,154 190 160.6 32 9,867 101 474.3 9 64.5 26 11,093 319 375 334 2,080 156 30.7%<br />
45 88 HEKOTEK AS* 425,945 50 129.6 75 36,518 54 156.1 67 63.6 30 42,925 15 4,217 59 4,002 115 30.4%<br />
46 37 3 TALLINNA SADAM AS* 1,168,968 24 100.6 239 416,644 8 124.1 99 9.0 272 29,573 72 2,352 110 560,000 7 30.4%<br />
47 PROFOOD INVEST OÜ 5,065 325 152.6 35 381 286 241.8 29 382.0 4 6,271 344 2,533 96 736 201 30.2%<br />
48 38 TELE2 EESTI AS 1,753,903 17 92.4 282 534,665 6 101.6 139 19.7 190 28,209 89 8,392 24 315,509 12 29.4%<br />
49 30 REMEI BALTICA OÜ 22,885 250 98.3 263 2,864 191 68.4 219 31.2 118 56,704 4 3,814 64 29 305 28.8%<br />
50 77 104 79 LENNULIIKLUSTEENINDUSE AS 244,472 72 105.9 198 72,322 31 87.9 180 30.3 125 50,118 9 1,798 151 53,326 36 28.8%<br />
51 NYCOMED SEFA AS 342,371 59 107.0 188 59,890 37 216.0 43 23.9 154 37,704 28 4,280 56 3,227 129 28.7%<br />
52 174 115 PLANSERK AS 32,748 219 122.6 99 3,783 172 166.9 61 40.4 87 40,002 20 1,926 139 2,113 155 27.7%<br />
53 326 SÖDERHAMN ERIKSSON EESTI AS* 21,012 254 109.2 172 1,975 217 327.7 17 16.3 212 27,054 100 3,002 82 32 304 27.7%<br />
54 352 462 70 MOBI SOLUTIONS OÜ* 23,686 245 128.5 81 2,894 188 343.0 14 53.5 49 19,988 193 987 238 89 282 27.6%<br />
55 42 WIRTGEN EESTI OÜ* 115,803 116 112.8 144 3,357 181 51.1 253 20.8 182 51,202 8 14,475 11 6,599 89 27.3%<br />
56 81 79 314 MERKO TARTU AS 327,335 60 91.9 285 11,250 90 49.2 259 22.9 162 51,796 7 16,367 8 423 225 27.3%<br />
57 ÜLEMISTE CITY AS 98,187 122 180.4 20 112,430 24 141.8 78 14.8 218 31,833 55 4,269 57 123,993 23 27.2%<br />
58 251 TERASMAN OÜ 113,742 118 170.9 27 3,789 171 218.9 41 23.8 155 28,608 82 1,149 213 5,147 104 27.1%<br />
59 80 HELMES AS* 212,681 79 130.6 69 19,521 72 116.3 112 34.6 103 41,017 18 2,085 124 3,994 116 26.9%<br />
www.konkurents.ee<br />
1 EUR = 15.6466 EEK; 1 EEK = 0.0639 EUR; based on 2008 data<br />
29
Estonian Companies’ Competitiveness Ranking 2009<br />
Place<br />
2008<br />
2007<br />
2006<br />
Sales Change Net profit Change Return Labour costs Efficiency per Investments %<br />
Enterprise in sales in net profit on equity per employee employee of the first<br />
*group<br />
th. EEK place % place th. EEK place % place % place EEK/month place th. EEK place th. EEK place (0...100)<br />
60 FACIO EHITUSE AS 1,041,904 26 110.8 163 63,469 36 82.7 196 34.8 102 38,752 22 8,540 22 20,889 53 26.8%<br />
61 MAGNUM AS* 3,205,515 13 117.9 122 119,992 22 90.3 172 24.0 153 18,058 233 2,987 83 241,870 17 26.7%<br />
62 362 VIRU ELEKTRIK AS 41,668 199 237.1 11 2,442 202 201.7 47 55.7 43 19,738 200 1,984 132 77 287 26.6%<br />
63 40 190 77 3 STEP IT OÜ 212,103 80 99.5 250 4,242 159 88.1 179 29.5 129 46,055 11 9,222 19 321 26.6%<br />
64 181 90 419 REGIO AS 71,687 156 136.6 53 5,889 133 166.5 62 33.1 111 35,214 35 919 251 3,489 125 26.5%<br />
65 TERRAT AS 234,786 75 154.6 34 32,849 57 144.8 75 66.8 24 30,714 62 2,498 99 7,441 86 26.5%<br />
66 K.M.T. MAJATEHAS OÜ 38,633 208 132.6 65 4,083 163 243.2 28 26.7 140 27,469 97 1,431 183 670 207 26.1%<br />
67 218 174 212 ADDINOL MINERALÖL MARKETING OÜ 197,985 85 110.9 158 10,351 97 115.2 116 21.2 175 41,371 17 5,657 35 790 198 26.0%<br />
68 NOW! INNOVATIONS OÜ 8,047 307 443.7 5 183 299 54.2 246 30.8 123 12,875 300 1,006 235 337 25.7%<br />
69 106 194 36 WEBMEDIA AS 169,151 94 125.8 88 29,696 61 134.4 85 43.6 67 34,851 38 842 263 4,088 112 25.5%<br />
70 381 354 TARFURGO OÜ 43,877 193 150.4 38 2,675 194 247.6 25 50.5 53 21,201 173 1,994 131 96 281 25.5%<br />
71 152 59 360 HENKEL MAKROFLEX AS* 946,619 31 105.4 202 130,681 19 124.0 100 28.2 135 31,025 61 11,007 14 5,734 96 25.4%<br />
72 65 237 TELEGRUPP AS 148,429 102 129.3 77 14,215 81 127.4 96 62.1 35 32,924 47 3,227 75 1,174 181 25.2%<br />
73 190 YIT EMICO AS 91,817 128 173.2 23 5,720 136 143.0 77 69.9 20 26,450 110 2,700 90 229 259 25.2%<br />
74 158 142 211 TATOLI AS 435,054 49 164.9 30 21,942 70 135.5 83 32.1 115 27,693 93 10,849 15 10,709 72 25.2%<br />
75 112 E-PROFIIL AS 181,128 89 112.7 145 8,849 108 172.0 56 62.4 34 29,791 68 1,132 215 8,571 82 25.2%<br />
76 216 168 248 TEEDE TEHNOKESKUS AS 69,999 157 133.9 60 5,498 140 168.0 58 20.8 181 32,483 49 1,014 233 3,555 123 25.1%<br />
77 TEA KIRJASTUS AS* 73,094 154 143.0 43 5,778 135 223.6 39 42.0 78 23,855 137 1,160 212 1,945 162 25.1%<br />
78 83 40 56 TALLINNA VESI AS 719,923 35 111.0 156 295,968 12 106.5 130 23.5 158 23,245 140 2,271 115 306,257 13 24.7%<br />
79 167 44 ASPERAAMUS OÜ 58,717 172 85.8 308 3,966 169 329.5 16 91.7 12 12,847 301 8,388 25 341 237 24.7%<br />
80 P.P.EHITUS OÜ* 5,240 323 111.6 152 2,685 193 273.1 22 28.1 137 22,805 151 749 281 345 24.7%<br />
81 49 KAAMOS EHITUS OÜ 235,732 74 141.6 45 13,153 85 109.6 123 55.5 44 29,943 66 18,133 7 101 278 24.6%<br />
82 58 GSMVALVE OÜ 22,970 248 171.9 25 2,372 203 225.8 35 87.6 14 15,041 268 792 275 1,660 168 24.5%<br />
83 27 EKE INVEST AS* 286,713 62 128.0 82 303,625 10 186.4 50 43.3 69 19,207 208 1,274 202 64,547 31 24.4%<br />
84 248 SYSTEMTEST OÜ* 27,437 234 135.7 56 4,238 160 140.7 80 35.7 101 31,979 54 1,372 191 89 283 24.4%<br />
85 METAL EXPRESS OÜ 29,229 228 186.1 18 938 249 70.4 216 29.4 131 32,029 52 9,743 17 687 205 23.9%<br />
86 165 SPACECOM AS* 449,013 48 74.4 336 149,005 16 109.7 122 25.2 148 34,804 39 6,803 28 4,488 110 23.8%<br />
87 54 274 39 TELORA-E AS 47,808 188 92.6 281 5,361 143 39.4 269 32.4 113 44,964 13 1,328 195 311 242 23.7%<br />
88 26 29 20 SILBERAUTO AS* 3,342,088 11 68.2 342 26,111 64 11.3 314 3.5 302 26,862 103 4,795 46 149,795 20 23.7%<br />
89 USESOFT AS 25,375 238 98.8 258 738 260 215.8 44 34.5 104 25,998 112 1,336 193 300 246 23.6%<br />
90 LAJOS AS* 108,008 120 118.2 118 6,221 126 246.5 26 38.6 93 18,371 227 1,964 134 20,772 54 23.3%<br />
91 68 RIMESS OÜ 54,644 176 118.5 116 9,160 105 114.5 119 72.1 18 29,418 74 658 292 1,400 175 23.2%<br />
92 307 153 284 SAINT-GOBAIN SEKURIT EESTI AS 399,574 53 132.8 63 48,832 46 163.2 65 25.7 143 23,196 143 1,686 164 24,862 49 23.1%<br />
93 150 12 15 BALTIC PULP AND PAPER OÜ 478,275 46 77.1 332 50,296 41 260.4 24 51.4 52 9,928 330 59,784 2 2,066 157 23.1%<br />
94 IN NOMINE OÜ 4,400 329 183.3 19 219 294 100 151 67.8 22 24,361 127 880 256 339 23.0%<br />
95 FAABULA AS 35,640 213 131.1 68 1,781 222 230.2 31 40.6 84 18,460 225 2,228 116 2,719 137 23.0%<br />
96 375 84 SVARMIL AS 93,623 125 103.1 221 2,262 206 333.9 15 11.8 250 12,943 298 426 331 2,830 135 22.9%<br />
97 INVARU OÜ 30,200 224 132.6 66 2,087 211 224.8 37 41.2 81 18,505 224 795 274 200 264 22.8%<br />
98 107 AKTSIASELTS VABA MAA 36,000 212 117.9 123 2,010 214 212.8 46 9.5 265 23,921 136 947 245 4,837 106 22.8%<br />
99 496 FOLIE MP AS 60,956 170 227.4 12 4,628 156 94.5 164 9.2 269 23,300 139 4,354 53 25,233 48 22.8%<br />
100 127 287 460 FORANKRA BALTIC OÜ 28,720 230 80.6 322 5,135 150 80.3 205 31.9 116 38,346 26 2,393 108 22 311 22.5%<br />
101 98 47 A. LE COQ AS 1,126,485 25 97.4 265 186,371 13 110.9 121 21.1 178 22,796 152 2,845 88 52,594 37 22.5%<br />
102 343 ESTKO AS* 72,880 155 122.9 97 6,856 120 181.1 52 21.1 177 23,926 135 1,584 172 3,700 121 22.4%<br />
103 174 LUISA TÕLKEBÜROO OÜ 25,610 237 107.9 183 412 282 167.5 59 2.6 312 29,106 77 582 308 300 245 22.3%<br />
104 388 VIIMSI KEEVITUS AS 201,971 83 104.8 208 34,483 56 134.1 87 60.9 36 25,017 117 5,771 33 2,630 139 22.3%<br />
105 199 125 NORMA AS* 1,382,140 20 109.4 169 137,218 18 129.5 92 14.6 220 18,947 214 1,426 184 50,896 38 22.2%<br />
106 156 BENEFIT AS 50,848 182 109.3 171 3,414 178 63.6 225 23.1 161 36,885 31 2,421 106 2,900 134 22.2%<br />
107 19 BDA CONSULTING OÜ 18,772 263 130.6 70 998 247 35.1 276 50.0 54 35,476 33 1,707 163 415 227 22.2%<br />
108 175 219 312 FRIENDS TEXTILE OÜ* 44,628 192 102.1 229 8,090 110 107.0 129 36.1 100 31,642 56 2,349 111 872 196 22.1%<br />
109 288 EA RENG AS* 85,500 136 101.7 232 5,440 141 132.7 88 42.2 76 28,411 85 743 282 2,043 159 22.1%<br />
110 81 159 ELKE GRUPI AS* 1,850,182 16 89.3 297 41,668 50 49.8 257 11.9 248 24,981 119 4,303 55 110,579 25 21.8%<br />
111 187 22 KPMG BALTICS AS* 175,740 91 118.0 120 5,052 151 99.1 161 44.9 61 28,595 83 751 280 1,012 189 21.8%<br />
112 MAKRON ESTONIA OÜ 83,395 141 129.9 72 7,160 117 104.8 133 33.9 108 27,952 92 2,085 125 350 235 21.7%<br />
113 171 206 232 VALOOR AS 142,172 105 86.9 302 14,077 82 141.2 79 38.4 94 27,077 99 3,306 70 21,939 51 21.7%<br />
114 GEVATEX OÜ 12,367 285 155.1 33 1,332 234 213.2 45 85.8 15 10,229 326 275 344 272 250 21.7%<br />
115 231 74 580 TERG OÜ 61,687 168 108.1 180 1,695 226 116.5 111 13.3 237 30,575 63 5,141 41 43 301 21.7%<br />
116 354 368 407 SAAREMAA TARBIJATE ÜHISTU TUÜ 629,371 41 101.6 233 6,914 119 267.8 23 10.1 259 12,533 303 1,457 179 3,240 128 21.7%<br />
117 HIIU TEED OÜ 88,833 131 100.3 241 12,571 86 77.2 209 48.0 58 31,574 58 2,066 126 10,363 73 21.5%<br />
118 ITELLA INFORMATION AS 171,161 93 118.0 121 11,199 91 131.0 90 55.9 42 22,972 149 3,423 68 2,400 143 21.5%<br />
www.konkurents.ee<br />
1 EUR = 15.6466 EEK; 1 EEK = 0.0639 EUR; based on 2008 data<br />
30
Estonian Companies’ Competitiveness Ranking 2009<br />
Place<br />
2008<br />
2007<br />
2006<br />
Sales Change Net profit Change Return Labour costs Efficiency per Investments %<br />
Enterprise in sales in net profit on equity per employee employee of the first<br />
*group<br />
th. EEK place % place th. EEK place % place % place EEK/month place th. EEK place th. EEK place (0...100)<br />
119 236 153 PINTAVÄRI EESTI OÜ 23,985 243 125.9 87 1,971 218 92.3 168 28.5 132 29,574 71 3,426 67 307 244 21.4%<br />
120 63 439 EVERDEAL EESTI AS 79,733 147 102.2 226 7,353 113 109.3 126 37.6 95 28,727 80 4,430 52 203 262 21.4%<br />
121 185 58 113 RAKVERE LIHAKOMBINAAT AS* 2,151,822 15 114.0 137 72,438 30 58.1 236 6.8 285 16,439 249 1,597 170 190,100 18 21.4%<br />
122 249 254 320 KOMPRESSORIKESKUS OÜ* 55,294 175 118.1 119 2,574 198 92.5 167 25.3 145 30,198 65 1,907 140 688 204 21.3%<br />
123 NORDCESTER ENGINEERING AS* 63,749 164 104.3 210 451 280 15.1 306 7.7 282 40,211 19 5,312 38 17,835 55 21.3%<br />
124 129 227 97 HARJU ELEKTER AS* 871,610 33 119.1 110 42,061 48 48.9 260 8.7 275 28,636 81 1,740 160 37,209 41 21.1%<br />
125 INTERNATIONAL ALUMINIUM CASTING TARTU AS 69,657 158 124.8 90 7,831 112 144.9 74 28.4 133 22,778 153 1,583 173 9,961 75 21.1%<br />
126 ÖSEL CONSULTING OÜ 3,469 336 117.5 125 1,072 245 129.1 93 60.8 37 22,672 154 771 279 27 307 20.9%<br />
127 LINDREM AS 55,328 174 53.0 350 7,230 115 148.6 72 87.7 13 24,507 125 1,383 189 229 258 20.9%<br />
128 E-ARSENAL AS 36,089 211 161.5 31 3,026 187 100 145 39.9 89 22,274 161 3,609 66 324 20.9%<br />
129 171 TNT EXPRESS WORLDWIDE EESTI AS 101,522 121 86.4 305 22,451 69 50.2 255 9.6 264 37,296 29 1,781 153 1,452 172 20.9%<br />
130 AD REM TÕLKEBÜROO OÜ 4,636 328 99.2 254 73 317 127.9 95 10.5 257 28,891 78 773 278 344 20.8%<br />
131 511 VILJANDI METLL AS* 454,444 47 129.3 76 49,395 44 117.6 109 28.1 136 20,957 179 1,551 175 14,164 63 20.8%<br />
132 173 53 FRELOK AS 564,820 43 83.0 318 31,911 58 105.8 131 19.5 192 26,832 104 6,973 27 3,858 119 20.7%<br />
133 172 476 NTN EST AS 4,820 327 99.8 247 184 298 217.3 42 4.1 298 19,704 202 689 287 346 20.6%<br />
134 168 120 EESTI KREDIIDIPANK AS 358,390 56 111.0 157 71,421 32 86.4 187 20.5 184 26,640 109 1,765 156 7,883 84 20.6%<br />
135 64 315 CENTRALPHARMA COMMUNICATIONS OÜ 24,668 241 119.8 106 783 256 61.9 229 22.7 164 31,625 57 1,121 217 403 230 20.6%<br />
136 46 102 PALMSE MEHAANIKAKODA OÜ 153,041 99 94.5 272 17,673 76 75.6 210 45.1 60 29,247 76 4,783 47 2,328 149 20.6%<br />
137 252 161 194 KRIMELTE OÜ* 1,013,447 28 116.5 127 50,051 43 87.8 182 20.1 186 19,460 205 4,223 58 88,766 27 20.5%<br />
138 263 ISIS MEDICAL OÜ* 34,001 217 123.5 94 1,980 216 116.1 113 47.2 59 22,878 150 3,091 80 15 314 20.5%<br />
139 235 ERGO KINDLUSTUSE AS* 924,357 32 99.2 253 124,615 21 117.2 110 17.3 204 19,997 192 1,675 165 10,049 74 20.5%<br />
140 339 ENGLO OÜ 4,912 326 119.0 112 1,244 238 168.9 57 43.4 68 18,703 218 819 268 342 20.5%<br />
141 70 469 TAVID AS* 122,173 113 113.3 141 65,710 35 102.1 137 41.5 79 24,360 128 1,164 211 1,332 176 20.5%<br />
142 224 PALKTARE OÜ 53,249 180 109.0 175 1,777 223 172.9 54 12.3 245 21,513 171 1,238 207 2,561 142 20.4%<br />
143 215 DPD EESTI AS 121,561 114 124.1 91 4,691 155 87.3 184 31.0 121 25,669 115 1,764 157 3,399 126 20.2%<br />
144 125 97 133 MAXIT ESTONIA AS 369,659 55 52.9 351 48,866 45 26.0 291 3.7 301 37,917 27 3,271 74 57,497 34 20.1%<br />
145 128 454 76 ESTANC AS* 84,865 137 146.2 41 6,539 122 115.0 118 43.7 65 19,368 207 1,886 142 3,704 120 20.1%<br />
146 PRINTALL AS 422,997 52 109.6 168 50,187 42 118.1 108 21.9 170 21,803 166 2,005 130 6,628 88 20.1%<br />
147 207 341 EKTACO AS 27,599 233 116.2 130 1,729 225 81.3 202 25.3 144 28,138 90 1,022 231 1,148 186 20.1%<br />
148 143 RAUAMEISTER AS* 108,374 119 115.6 131 19,644 71 120.5 103 44.1 62 21,419 172 1,246 206 6,018 95 20.0%<br />
149 48 ROVICO BÜROO OÜ 11,544 291 98.6 261 1,846 221 59.5 230 48.4 57 29,923 67 2,272 113 9 317 20.0%<br />
150 REHVIMEISTER AS 39,094 206 83.9 313 2,108 210 53.7 249 8.6 276 35,104 37 2,606 94 328 19.9%<br />
151 204 ESTEVE TERMINAL AS 145,179 103 109.8 167 10,945 94 87.9 181 23.4 160 25,690 113 925 249 47,557 39 19.9%<br />
152 WIGEN SINDI OÜ 11,526 292 109.0 177 1,381 232 221.1 40 43.8 64 12,525 304 226 348 79 286 19.9%<br />
153 296 VÄRSKA VESI AS 82,426 143 118.6 115 5,356 144 172.4 55 42.9 74 15,711 257 1,717 162 5,341 100 19.8%<br />
154 GVANDRON OÜ 2,228 347 144.0 42 525 270 154.0 70 64.6 25 13,370 292 557 312 1,316 177 19.7%<br />
155 329 309 195 NEFAB EESTI AS 166,182 95 100.0 246 8,870 107 131.3 89 15.8 214 23,241 141 1,319 196 6,355 90 19.7%<br />
156 5 VARMAPARTNER OÜ 23,909 244 105.6 199 578 265 17.9 304 18.4 197 33,657 44 11,955 13 12,450 68 19.7%<br />
157 222 509 CHEMI-PHARM AS* 39,924 204 129.3 78 5,400 142 126.8 97 33.5 109 19,897 195 1,248 205 2,791 136 19.6%<br />
158 51 195 SONA SYSTEMS OÜ 5,476 320 133.6 62 2,888 189 162.3 66 82.8 16 11,222 316 5,476 37 779 199 19.6%<br />
159 Q-HAUS BALTIC OÜ 62,644 167 342.4 6 6,243 124 100 144 15,984 253 2,983 84 377 233 19.6%<br />
160 314 376 AURE OÜ* 9,746 299 93.9 276 2,475 201 187.6 49 40.8 82 16,929 243 1,949 135 36 302 19.6%<br />
161 344 INLOOK COLOR OÜ 30,883 221 104.2 211 3,410 179 109.5 125 11.0 253 26,430 111 1,287 200 170 269 19.6%<br />
162 250 112 NORES PLASTIC OÜ 76,613 149 90.1 292 1,182 239 41.2 265 13.6 233 32,263 50 15,323 10 245 256 19.5%<br />
163 117 127 191 ELKE AUTO AS 657,168 39 72.7 340 27,529 63 47.8 262 21.2 174 29,400 75 6,200 30 4,602 107 19.4%<br />
164 142 441 HAMMER SERVICE OÜ 6,611 317 103.5 215 891 251 135.4 84 43.3 70 20,288 188 1,469 177 368 234 19.3%<br />
165 137 GLAMOX HE AS 270,637 66 102.0 230 37,124 53 99.6 159 31.8 117 22,343 159 2,483 102 13,177 66 19.3%<br />
166 ADM INTERACTIVE OÜ 17,830 267 101.0 237 410 283 16.5 305 13.8 231 35,249 34 615 300 347 19.3%<br />
167 257 137 KAESER KOMPRESSORIT OY EESTI FILIAAL 40,702 202 104.9 207 3,128 185 92.5 166 23.5 159 25,394 116 4,522 49 57 296 19.2%<br />
168 SAARTE LIINID AS 53,588 179 111.1 155 10,024 100 121.2 102 6.5 286 20,401 187 670 289 127,935 22 19.2%<br />
169 136 262 GRUNDFOS PUMPS EESTI OÜ* 63,178 166 100.2 245 722 261 18.9 300 14.3 225 33,867 42 5,265 39 276 248 19.2%<br />
170 HUMANA SORTEERIMISKESKUS OÜ 83,508 140 114.9 134 493 274 228.5 32 12.1 247 11,428 312 506 317 349 19.2%<br />
171 69 OSAÜHING GEOMETRIA 8,814 304 119.4 107 576 266 197.1 48 9.9 262 14,780 270 383 333 269 252 19.1%<br />
172 126 197 KENTEK EESTI OÜ* 19,647 259 103.7 213 919 250 87.5 183 14.6 219 26,944 101 1,965 133 131 272 19.1%<br />
173 FINANCE MANAGEMENT OÜ 3,483 335 133.8 61 227 293 100 150 55.1 46 19,142 209 435 330 272 251 19.1%<br />
174 20 39 ECOMETAL AS 271,661 65 85.3 309 71,328 33 58.2 235 82.0 17 21,707 167 5,126 42 35,103 43 19.1%<br />
175 RUUT DISAIN OÜ* 11,402 295 111.5 153 573 267 154.5 69 58.3 39 15,193 264 600 303 622 211 19.0%<br />
176 7 AF-ESTIVO AS 73,705 153 110.9 161 585 264 19.6 297 13.1 238 32,229 51 3,879 63 6 319 19.0%<br />
177 82 KULBERT AS* 76,000 151 109.4 170 2,520 200 87.3 185 16.3 211 24,778 122 5,067 43 322 18.9%<br />
www.konkurents.ee<br />
1 EUR = 15.6466 EEK; 1 EEK = 0.0639 EUR; based on 2008 data<br />
31
Estonian Companies’ Competitiveness Ranking 2009<br />
Place<br />
2008<br />
2007<br />
2006<br />
Sales Change Net profit Change Return Labour costs Efficiency per Investments %<br />
Enterprise in sales in net profit on equity per employee employee of the first<br />
*group<br />
th. EEK place % place th. EEK place % place % place EEK/month place th. EEK place th. EEK place (0...100)<br />
178 266 373 HOTRONIC AS 76,412 150 110.9 160 1,932 219 103.6 135 16.1 213 23,100 144 1,442 181 6,254 91 18.9%<br />
179 NETLEAD OÜ 10,083 298 203.4 16 1,317 236 100 146 28,828 79 672 288 477 220 18.8%<br />
180 KRAVER AS 13,335 282 141.2 46 1,130 242 100 147 97.7 9 13,448 290 833 267 2,352 146 18.8%<br />
181 60 AEK OÜ* 61,125 169 79.9 326 6,641 121 68.2 220 43.7 66 27,161 98 3,217 76 68 290 18.7%<br />
182 337 AS SUWEM 45,181 191 106.7 191 5,177 149 166.0 63 34.3 106 15,247 263 922 250 314 241 18.6%<br />
183 176 358 481 EXCELLENT GRUPP AS 46,615 189 98.7 259 11,555 89 75.2 211 24.6 151 24,409 126 15,538 9 1,161 185 18.6%<br />
184 169 257 250 CATWEES OÜ* 494,056 45 84.0 312 15,276 79 30.2 285 10.0 261 29,633 69 5,745 34 14,623 61 18.6%<br />
185 219 SAMESTI METALL OÜ 3,280 339 122.1 101 45 320 88.4 177 9.1 270 24,156 132 656 293 44 300 18.6%<br />
186 100 66 TAMREX OHUTUSE OÜ 82,961 142 107.2 186 4,900 154 71.0 215 36.6 98 24,246 131 1,383 190 878 195 18.6%<br />
187 228 369 550 PÕLVAMAA HOIU-LAENUÜHISTU TUÜ 2,460 346 111.8 151 122 309 50.0 256 4.5 295 29,430 73 615 301 9 316 18.6%<br />
188 280 298 255 JELD-WEN EESTI AS 648,718 40 102.3 224 53,685 38 140.5 81 25.2 146 13,580 287 907 253 22,333 50 18.6%<br />
189 MEENED OÜ* 3,437 337 126.7 84 398 285 223.9 38 27.4 138 7,900 338 181 352 354 18.5%<br />
190 180 TALLINNA ÄRIPANGA AS* 129,700 109 99.1 255 -7,500 353 -2.2 327 34,766 40 2,027 129 21,900 52 18.5%<br />
191 98 123 VEHO EESTI AS 1,000,958 29 83.6 316 5,193 148 12.7 312 3.8 299 26,750 105 7,000 26 80,410 28 18.5%<br />
192 NORDIUM OÜ* 2,680 344 119.4 108 482 275 115.1 117 39.8 90 18,362 228 2,680 91 2 327 18.5%<br />
193 EESTI TURBATOOTED AS 43,371 194 107.6 185 5,339 145 109.5 124 39.6 91 19,854 198 1,807 150 2,141 154 18.5%<br />
194 44 286 MAINOR AS* 325,447 61 123.4 95 117,958 23 55.7 243 13.3 236 18,882 215 1,017 232 143,918 21 18.4%<br />
195 MEGARAM OÜ 2,969 342 129.7 74 38 321 100 157 63.8 28 16,748 246 371 335 351 18.4%<br />
196 93 188 166 VÄO PAAS OÜ* 84,213 139 80.5 323 10,640 96 62.0 228 19.6 191 28,424 84 1,477 176 10,965 71 18.3%<br />
197 CLYDE BERGEMANN EESTI AS 88,842 130 101.3 234 203 297 100 153 6.3 288 23,954 134 846 261 1,860 164 18.3%<br />
198 279 228 37 PROMENS AS 202,904 81 112.5 147 25,031 66 118.9 107 29.7 126 17,343 239 1,268 203 6,087 94 18.3%<br />
199 364 BALTI VESKI AS 50,653 183 120.9 104 2,247 207 108.3 128 14.5 221 20,254 189 2,533 95 264 253 18.3%<br />
200 346 402 217 MERINVEST OÜ 152,468 100 112.1 149 5,578 139 143.6 76 24.9 149 15,808 255 649 294 2,926 133 18.2%<br />
201 313 333 395 FEIN-ELAST ESTONIA OÜ 74,193 152 100.3 242 9,696 102 120.5 104 18.4 198 20,052 190 1,405 187 6,240 92 18.1%<br />
202 241 PROFLINE AS* 28,259 232 111.9 150 1,354 233 63.8 224 21.1 176 24,882 120 2,174 119 59 293 18.1%<br />
203 NOVATERRA TRADE AS 80,425 145 118.9 113 1,324 235 36.9 274 24.8 150 25,689 114 6,187 31 502 218 18.1%<br />
204 183 AEROC AS 249,660 68 123.2 96 22,685 68 59.0 232 15.3 216 22,473 157 2,171 120 7,927 83 18.1%<br />
205 265 235 424 TAASTAVA KIRURGIA KLIINIK AS 49,383 185 109.1 174 3,297 182 69.8 218 19.2 194 24,276 130 610 302 2,629 140 18.0%<br />
206 189 WENDRE AS* 1,017,834 27 103.5 214 86,489 26 99.5 160 21.3 173 13,559 288 1,389 188 9,356 77 18.0%<br />
207 238 234 NUIA PMT AS 69,076 160 107.9 182 6,238 125 80.5 204 20.0 187 22,583 155 959 242 5,291 101 17.9%<br />
208 178 212 399 PAEKIVITOODETE TEHASE OÜ 129,205 110 91.9 287 19,019 74 82.3 199 22.5 165 22,320 160 916 252 37,655 40 17.8%<br />
209 NURME TURVAS AS 12,160 289 149.0 39 2,079 212 124.6 98 22.7 163 13,859 282 553 313 3,207 130 17.8%<br />
210 357 121 SEVE EHITUSE AS 54,106 177 90.8 291 4,228 161 74.6 212 29.7 127 14,105 279 796 273 419,000 10 17.8%<br />
211 123 <strong>TOP</strong>AUTO RAKVERE OÜ 29,401 226 89.7 296 778 257 84.7 191 53.6 48 21,108 174 2,940 87 58 294 17.8%<br />
212 RESPO HAAGISED AS 143,161 104 92.6 280 16,151 77 83.4 193 40.8 83 21,108 175 1,884 143 499 219 17.8%<br />
213 308 316 RAGN-SELLS AS 346,750 58 106.1 196 27,971 62 62.2 227 16.4 209 19,872 196 1,011 234 106,852 26 17.7%<br />
214 METOS AS 157,306 96 100.2 244 13,263 84 94.5 163 28.4 134 19,865 197 1,808 149 673 206 17.7%<br />
215 STOCKMANN AS 1,363,771 21 98.3 262 97,849 25 55.4 244 20.9 180 15,118 266 2,066 127 9,480 76 17.6%<br />
216 109 222 127 NORDECON INFRA AS* 1,233,025 23 100.4 240 -29,892 354 -12.2 337 24,818 121 1,787 152 74,986 29 17.6%<br />
217 153 347 AQRIS SOFTWARE AS 16,000 274 78.5 329 -789 343 -5.1 331 35,860 32 571 309 1,161 183 17.6%<br />
218 224 134 TALTER AS 782,173 34 105.5 200 -2,915 348 -1.4 326 26,696 106 2,307 112 31,168 47 17.6%<br />
219 188 310 VÄRVALTRANS OÜ* 34,051 216 105.5 201 5,197 147 94.2 165 36.3 99 18,593 223 973 241 32,038 46 17.5%<br />
220 243 165 429 TRETIMBER OÜ* 97,096 123 99.4 252 9,674 103 105.2 132 26.3 141 18,742 217 2,490 100 6,100 93 17.5%<br />
221 226 CARAMEL MODA OÜ 11,469 293 135.2 58 1,582 228 155.0 68 17.8 202 11,503 310 882 255 338 17.4%<br />
222 289 150 307 INFOTARK AS 258,257 67 95.8 268 13,323 83 74.3 213 11.1 251 21,674 169 2,369 109 14,449 62 17.3%<br />
223 61 156 90 OLYMPIC CASINO EESTI AS 689,655 37 86.8 303 156,327 15 50.6 254 13.8 230 18,604 221 1,023 230 61,133 33 17.3%<br />
224 KOOPIA NIINI & RAUAM OÜ 16,304 272 121.2 103 2,807 192 120.3 105 38.9 92 13,793 285 543 314 1,682 166 17.2%<br />
225 327 ENERPOINT SAARE OÜ 151,989 101 110.9 159 5,985 129 134.2 86 21.9 169 13,956 280 993 236 939 192 17.1%<br />
226 EMI EWT IDA-LÄÄNE KOOLITUSE AS 5,701 319 91.0 290 148 305 29.4 287 13.1 239 28,366 86 1,425 185 73 288 17.1%<br />
227 354 418 NÕO LIHATÖÖSTUS AS 191,318 86 138.2 50 5,901 132 115.3 115 9.9 263 13,086 297 1,417 186 16,950 57 17.0%<br />
228 499 445 AMC AMARIS AS 2,071 348 135.8 55 874 253 138.4 82 25.2 147 11,394 313 518 316 348 17.0%<br />
229 MAVAM OÜ 2,501 345 101.1 236 356 287 86.1 188 21.7 171 20,427 185 834 266 341 16.9%<br />
230 300 391 253 ROOTSI MÖÖBEL AS 92,979 126 110.7 165 10,204 98 81.0 203 19.7 189 19,053 212 2,113 123 1,639 169 16.9%<br />
231 312 SALVEST AS 182,639 88 107.8 184 19,374 73 123.4 101 18.4 199 13,882 281 1,210 208 13,809 65 16.8%<br />
232 BEAM BALTIC OÜ* 2,959 343 110.8 164 321 288 77.7 208 52.6 50 16,720 247 2,959 85 325 16.8%<br />
233 OSAÜHING EVENTUS EA 12,095 290 114.9 135 31 322 7.0 317 2.8 309 28,044 91 465 324 57 297 16.7%<br />
234 EVO DESIGN OÜ 19,046 262 175.3 21 165 303 100 154 12.9 242 11,036 320 595 305 1,809 165 16.7%<br />
235 JÄRVA TEED AS 92,700 127 130.2 71 2,200 208 40.0 266 13.3 235 21,104 176 1,204 209 4,200 111 16.6%<br />
236 115 LUKU SERVICE OÜ 17,474 270 67.0 345 995 248 35.1 277 34.4 105 26,881 102 1,942 137 330 16.6%<br />
www.konkurents.ee<br />
1 EUR = 15.6466 EEK; 1 EEK = 0.0639 EUR; based on 2008 data<br />
32
Estonian Companies’ Competitiveness Ranking 2009<br />
Place<br />
2008<br />
2007<br />
2006<br />
Sales Change Net profit Change Return Labour costs Efficiency per Investments %<br />
Enterprise in sales in net profit on equity per employee employee of the first<br />
*group<br />
th. EEK place % place th. EEK place % place % place EEK/month place th. EEK place th. EEK place (0...100)<br />
237 288 VIPEX AS 88,535 132 96.4 266 8,082 111 81.5 201 14.0 228 20,037 191 3,279 73 2,323 150 16.6%<br />
238 101 NURMIKO HULGI OÜ 81,425 144 101.2 235 3,033 186 86.0 189 40.5 86 17,041 242 1,894 141 331 16.6%<br />
239 227 DALE LD AS 50,104 184 93.7 277 4,987 153 58.5 233 18.1 201 22,489 156 1,023 229 17,044 56 16.6%<br />
240 486 ELECTRUM AS 79,403 148 119.3 109 3,375 180 57.6 237 22.5 166 19,639 203 1,073 225 2,385 144 16.6%<br />
241 110 INTERCONNECT PRODUCT ASSEMBLY AS 128,385 111 138.4 49 8,551 109 100 143 24.2 152 12,785 302 669 290 777 200 16.6%<br />
242 244 AIRWAVE OÜ 53,637 178 118.9 114 5,662 138 89.1 175 30.6 124 15,559 258 3,352 69 1,267 179 16.5%<br />
243 SILBERAUTO EESTI AS 1,281,849 22 67.9 343 -6,086 352 -4.0 329 25,011 118 3,944 62 1,879 163 16.5%<br />
244 195 266 275 SKS VÕRU OÜ 67,151 161 72.8 339 181 300 4.8 320 1.4 316 31,551 59 4,197 60 49 298 16.5%<br />
245 265 TREF AS* 424,831 51 103.0 222 22,861 67 32.4 280 8.9 274 21,807 165 2,484 101 14,696 59 16.5%<br />
246 ESMA VARA AS 17,928 266 152.5 36 9,407 104 148.4 73 10.8 255 6,946 342 8,964 21 18 312 16.4%<br />
247 TIMMERMANN AS 9,395 303 126.6 86 2,877 190 115.6 114 48.8 56 10,737 324 626 298 970 191 16.4%<br />
248 IDEAB PROJECT EESTI AS 20,385 258 120.2 105 1,516 230 129.6 91 26.9 139 11,667 307 1,853 147 13 315 16.4%<br />
249 135 FINNLAMELLI EESTI OÜ 41,700 198 81.9 320 2,355 205 52.8 251 29.4 130 23,084 145 1,604 169 1,458 171 16.4%<br />
250 194 303 291 KALTSIIT AS 40,927 201 82.3 319 7,308 114 58.3 234 16.3 210 23,537 138 974 240 4,081 113 16.4%<br />
251 TESA LOGISTICS OÜ 63,203 165 86.4 306 3,737 173 56.8 240 31.1 120 20,865 181 9,029 20 5,071 105 16.3%<br />
252 AESTON OÜ 48,686 186 106.7 190 2,150 209 22.0 293 13.9 229 24,599 124 3,043 81 173 268 16.3%<br />
253 359 372 MS BALTI TRAFO OÜ 48,165 187 116.9 126 5,948 131 128.1 94 18.6 196 12,200 305 288 343 8,662 81 16.3%<br />
254 321 151 SIGARI MAJA OÜ* 30,065 225 105.4 203 3,614 175 91.9 170 22.4 167 16,865 245 1,582 174 108 275 16.2%<br />
255 193 204 WELLSPA OÜ* 56,065 173 87.0 301 11,857 88 88.4 176 44.0 63 16,673 248 1,933 138 476 221 16.2%<br />
256 69 475 489 TERASVARA OÜ 12,966 283 105.1 206 477 277 55.8 242 8.2 277 21,889 164 648 295 410 228 16.1%<br />
257 SQA PARTNERS OÜ 23,440 246 115.6 132 753 259 100 148 10.9 254 15,761 256 297 342 4,554 109 16.1%<br />
258 ENICS EESTI AS* 990,722 30 113.5 139 39,167 52 181.1 51 14,207 277 1,869 145 16,198 58 16.1%<br />
259 116 335 258 UPM-KYMMENE OTEPÄÄ AS 244,986 71 79.9 325 41,763 49 46.4 263 17.0 205 19,487 204 1,591 171 110,693 24 16.1%<br />
260 421 LUKU-EXPERT OÜ, ENDINE ARAFEA GRUPP OÜ 39,634 205 89.8 295 3,914 170 65.5 222 33.0 112 19,721 201 1,468 178 332 16.1%<br />
261 318 370 50 ESRO AS* 87,249 135 109.1 173 2,530 199 31.3 283 3.3 303 21,955 163 1,781 154 55,591 35 16.0%<br />
262 ITVILLA OÜ 320 354 193.2 17 26 324 100 158 53.6 47 3,575 351 320 340 352 15.9%<br />
263 50 LASERSTUUDIO OÜ 5,070 324 108.1 181 -54 330 -11.9 336 28,304 88 845 262 883 194 15.9%<br />
264 SIRKEL & MALL OÜ 14,245 281 127.3 83 457 278 39.0 270 22.1 168 19,140 210 396 332 662 208 15.8%<br />
265 86 TIPTIPTAP OÜ 24,275 242 123.7 92 1,070 246 38.8 271 31.1 119 18,241 229 1,055 226 245 257 15.7%<br />
266 182 RAPLA TEED OÜ 225,330 77 99.4 251 6,216 127 39.9 267 14.4 224 19,785 199 1,435 182 37,162 42 15.7%<br />
267 301 230 CIPAX EESTI AS 87,574 133 116.3 129 3,217 184 27.9 289 5.4 291 20,946 180 1,751 159 34,614 44 15.7%<br />
268 PLANTEX AS 30,706 222 118.3 117 5,966 130 103.7 134 32.1 114 11,641 308 439 329 1,983 161 15.6%<br />
269 242 349 160 KINDLUSTUSEST KINDLUSTUSMAAKLER OÜ 15,384 278 108.9 178 532 269 30.0 286 19.2 193 21,542 170 440 328 99 279 15.6%<br />
270 406 MOKTER AS 202,579 82 122.0 102 772 258 82.7 197 3.1 305 13,717 286 8,441 23 1,007 190 15.5%<br />
271 45 41 412 MAPRI PROJEKT OÜ* 227,928 76 57.6 348 4,078 164 12.9 310 11.8 249 27,485 96 1,266 204 107 277 15.5%<br />
272 EESTI-AMEERIKA ÄRIAKADEEMIA AS 18,296 265 113.3 142 1,662 227 88.2 178 16.8 208 14,545 271 321 339 427 224 15.3%<br />
273 119 149 ANDMEVARA AS 42,198 197 85.1 310 -5,548 351 -36.3 344 30,524 64 659 291 2,597 141 15.2%<br />
274 292 464 KEMEHH OÜ 5,455 321 103.4 217 1,098 244 119.0 106 29.6 128 10,835 322 364 336 1,023 188 15.2%<br />
275 334 296 ARHDISAIN OÜ 41,557 200 81.8 321 861 254 70.0 217 14.3 226 18,778 216 4,617 48 68 291 15.2%<br />
276 207 REPAL-E OÜ 40,032 203 91.6 288 1,112 243 43.6 264 12.4 244 20,413 186 4,448 51 559 214 15.1%<br />
277 331 129 457 V.V.TRAVEL AGENCY OÜ 9,608 301 106.0 197 447 281 167.0 60 43.1 73 3,503 352 4,804 45 323 15.0%<br />
278 409 PAIDE MEK AS 172,035 92 102.1 228 7,169 116 39.4 268 12.2 246 18,634 220 1,313 197 2,345 147 14.9%<br />
279 TRACKING CENTER OÜ 7,590 314 293.9 7 522 271 100 149 7,687 339 632 296 2,209 153 14.9%<br />
280 156 ESFIL TEHNO AS 15,260 279 114.0 138 3,985 168 112.2 120 63.0 33 6,367 343 203 350 44 299 14.8%<br />
281 212 223 361 TARKON AS 691,441 36 99.0 256 17,732 75 51.7 252 15.0 217 13,398 291 1,297 198 4,600 108 14.8%<br />
282 197 TECHNOMAR & ADREM AS 501,005 44 87.2 298 129,002 20 82.8 195 17.5 203 10,778 323 842 264 340 14.8%<br />
283 10 K GRUPP TURVATEENUSED OÜ 34,466 214 102.0 231 4,059 165 89.7 174 51.9 51 10,594 325 191 351 88 284 14.8%<br />
284 172 EUREX CAPITAL OÜ* 28,822 229 98.6 260 4,038 166 33.6 279 14.4 222 19,901 194 721 284 2,381 145 14.7%<br />
285 KRISLING AS 26,310 236 93.7 278 456 279 19.3 298 9.1 271 22,410 158 797 272 108 274 14.7%<br />
286 338 313 241 MELECO AS 115,435 117 103.2 219 5,032 152 71.9 214 13.7 232 14,877 269 1,132 216 1,114 187 14.7%<br />
287 VOKA MASIN AS 22,904 249 114.1 136 680 262 56.9 239 21.0 179 15,167 265 587 306 514 217 14.6%<br />
288 145 EKSAMO AS 17,202 271 87.2 299 113 311 100 155 11.0 252 14,317 276 491 320 3,507 124 14.6%<br />
289 78 247 DENEESTI OÜ* 43,007 195 134.9 59 495 273 65.9 221 19.8 188 11,436 311 2,530 97 1,161 184 14.5%<br />
290 578 AP TRADING AS 12,259 286 113.5 140 -145 334 -7.4 333 22,978 148 2,043 128 329 14.5%<br />
291 STRUCTO INDUSTRY OÜ 30,911 220 102.3 225 400 284 18.2 303 9.3 267 20,725 182 1,288 199 261 254 14.5%<br />
292 325 140 44 RAPALA EESTI AS* 136,883 106 94.5 273 51,689 40 101.0 140 26.1 142 10,001 329 563 310 920 193 14.4%<br />
293 134 <strong>TOP</strong> GRAPHIC OÜ 7,591 313 79.5 328 287 289 37.4 272 3.8 300 21,683 168 1,084 223 336 14.4%<br />
294 HAUGER OÜ 5,454 322 146.3 40 138 307 85.8 190 43.2 72 5,995 347 1,364 192 333 14.3%<br />
295 57 149 KRAPESK AS 39,072 207 109.0 176 482 276 2.1 326 1.2 317 22,053 162 814 270 1,437 173 14.3%<br />
www.konkurents.ee<br />
1 EUR = 15.6466 EEK; 1 EEK = 0.0639 EUR; based on 2008 data<br />
33
Estonian Companies’ Competitiveness Ranking 2009<br />
Place<br />
2008<br />
2007<br />
2006<br />
Sales Change Net profit Change Return Labour costs Efficiency per Investments %<br />
Enterprise in sales in net profit on equity per employee employee of the first<br />
*group<br />
th. EEK place % place th. EEK place % place % place EEK/month place th. EEK place th. EEK place (0...100)<br />
296 REWOOL OÜ 3,847 334 142.2 44 55 319 100 156 4.7 294 8,385 337 214 349 200 263 14.3%<br />
297 272 404 371 ORGITA PÕLD OÜ 25,056 239 108.8 179 3,994 167 53.9 247 13.0 241 15,371 260 835 265 9,114 79 14.3%<br />
298 ASPER BIOTECH AS 17,725 268 112.2 148 95 314 13.8 308 1.0 318 20,432 184 443 326 624 210 14.2%<br />
299 52 A.KANGUST & PARTNERID OÜ 4,019 332 112.7 146 234 292 19.1 299 21.4 172 17,720 236 502 318 344 236 14.1%<br />
300 CARRING AS 52,925 181 75.8 333 242 291 12.9 311 4.8 293 23,067 146 2,117 122 406 229 14.1%<br />
301 501 510 UNIPLAST OÜ 42,274 196 93.4 279 1,510 231 87.1 186 9.2 268 13,176 294 939 248 455 223 14.0%<br />
302 246 387 M JA P NURST AS 120,837 115 106.3 194 4,575 157 56.3 241 13.4 234 13,827 283 982 239 5,700 97 14.0%<br />
303 B.I.A. OÜ 3,045 341 205.1 15 211 295 100 152 14,164 278 338 338 249 255 13.9%<br />
304 282 247 425 ESTIKO-PLASTAR AS 280,931 63 95.8 267 1,923 220 12.7 313 2.6 311 18,224 231 1,778 155 7,098 87 13.6%<br />
305 392 MISTRA-AUTEX AS 188,000 87 87.0 300 2,592 197 32.3 281 5.4 290 17,513 238 954 244 3,900 118 13.6%<br />
306 146 86 IKODOR AS 37,160 210 65.4 346 4,479 158 24.5 292 10.5 258 20,663 183 1,616 168 5,535 98 13.5%<br />
307 345 319 RAJA K.T. OÜ 60,627 171 128.6 80 2,612 196 57.5 238 12.8 243 10,045 328 1,732 161 14,649 60 13.5%<br />
308 299 111 MATEK AS* 130,180 108 71.2 341 5,885 134 37.3 273 10.6 256 17,896 235 1,113 219 2,700 138 13.4%<br />
309 268 251 DELUX DOMOTEX OÜ 123,977 112 80.3 324 11,014 93 62.7 226 20.1 185 13,133 295 992 237 3,900 117 13.3%<br />
310 93 STANDARD AS* 249,088 70 91.9 286 5,689 137 34.8 278 7.9 281 14,454 273 1,038 228 14,072 64 13.1%<br />
311 IIZI KINDLUSTUSMAAKLER AS* 84,613 138 126.6 85 -2,911 347 -30.5 342 19,075 211 631 297 4,064 114 13.1%<br />
312 330 278 200 SWIPE EESTI OÜ* 3,272 340 102.7 223 552 268 78.2 207 43.2 71 7,542 341 1,091 221 335 13.1%<br />
313 SWEDEST MOTEL GROUP AS 15,451 277 100.3 243 140 306 81.9 200 0.7 319 11,114 318 483 321 422 226 13.0%<br />
314 133 REALISTER OÜ* 9,470 302 135.6 57 -415 339 -42.6 345 19,371 206 947 246 338 238 13.0%<br />
315 ESTNOR OÜ 22,088 251 91.4 289 4 326 4.2 323 0.1 322 18,955 213 818 269 343 12.7%<br />
316 308 484 537 MIVAR AS* 180,338 90 94.6 271 6,499 123 53.8 248 9.4 266 11,267 314 562 311 11,150 70 12.7%<br />
317 AUDES LLC OÜ 37,776 209 110.6 166 2,361 204 49.7 258 8.9 273 11,244 315 461 325 2,984 132 12.7%<br />
318 VELMA MÖÖBEL OÜ 12,883 284 115.6 133 177 301 21.1 295 8.1 279 13,813 284 716 285 830 197 12.6%<br />
319 94 478 SUN TIMBER OÜ 12,186 287 90.1 294 1,290 237 109.3 127 41.4 80 4,518 350 358 337 290 247 12.6%<br />
320 348 215 LEKU METALL AS 8,085 306 83.8 315 209 296 48.5 261 6.3 287 14,404 274 622 299 180 267 12.6%<br />
321 AUGLI METALL OÜ 7,364 315 132.8 64 114 310 18.7 301 16.8 206 11,190 317 736 283 721 202 12.5%<br />
322 HOLZ PROF OÜ 1,495 351 117.6 124 -97 332 -25.3 340 18,230 230 498 319 350 12.4%<br />
323 491 R KIOSK EESTI AS 392,387 54 106.1 195 3,647 174 35.4 275 10.1 260 9,727 331 703 286 12,056 69 12.4%<br />
324 JÕGEVA VESI OÜ* 5,756 318 129.2 79 90 315 27.2 290 8.2 278 10,953 321 303 341 73 289 12.3%<br />
325 444 LÄÄNE AGROVARU OÜ 4,354 331 99.6 249 -73 331 -7.3 332 17,897 234 1,451 180 22 310 12.3%<br />
326 184 EDELSTEIN OÜ 3,418 338 77.7 331 107 312 14.9 307 7.1 284 17,119 241 854 260 108 276 12.1%<br />
327 346 Ü&A AS 19,206 261 79.6 327 -319 336 -3.3 328 18,680 219 2,134 121 534 216 12.0%<br />
328 27 311 533 BORTER TRADE OÜ 7,987 309 113.0 143 4 327 1.5 328 2.9 307 14,508 272 1,141 214 141 271 11.9%<br />
329 351 445 204 PEETRI PUIT OÜ 30,611 223 90.1 293 1,758 224 28.5 288 7.9 280 13,111 296 957 243 641 209 11.8%<br />
330 328 MR STUUDIO OÜ 11,408 294 99.7 248 -348 337 -10.6 335 16,223 251 519 315 2,335 148 11.6%<br />
331 AGROCHEMA EESTI OÜ 225,282 78 27.4 354 6,969 118 9.4 315 5.5 289 18,402 226 9,795 16 12,913 67 11.5%<br />
332 160 107 ELEKTRIMEES OÜ 15,196 280 67.8 344 96 313 4.3 321 2.8 308 17,611 237 1,169 210 334 11.5%<br />
333 368 217 162 RIIGIRESSURSSIDE KESKUS OÜ* 66,080 163 106.6 192 651 263 1.6 327 0.1 323 11,556 309 3,304 71 62,531 32 11.3%<br />
334 25 263 LRF PRIVATE OÜ 9,726 300 78.1 330 70 318 6.2 319 2.0 314 15,959 254 1,945 136 22 309 11.3%<br />
335 213 67 500 SUJA EHITUS OÜ 33,569 218 94.9 269 -1,818 345 -43.8 346 17,299 240 1,119 218 2,209 152 10.9%<br />
336 MAASIKAS & KO OÜ 19,319 260 111.2 154 250 290 32.1 282 7.4 283 7,654 340 878 257 1,192 180 10.8%<br />
337 485 501 DEMJANOV AS 21,758 253 94.7 270 -572 342 -10.3 334 13,476 289 473 323 197 266 10.5%<br />
338 191 187 ET TOREL OÜ* 16,212 273 73.3 337 160 304 3.6 324 1.9 315 14,361 275 600 304 223 260 10.5%<br />
339 24 TVS PARTNERID AS 20,471 256 83.8 314 -555 341 -33.8 343 16,401 250 1,077 224 63 292 10.5%<br />
340 461 ANDEVIS AS* 7,946 310 74.5 335 128 308 21.3 294 2.5 313 11,939 306 441 327 1,169 182 10.4%<br />
341 PLASTSYS OÜ 10,333 297 97.9 264 -297 335 -147.0 349 24,667 123 939 247 120 273 10.3%<br />
342 301 ESTRE AS 34,210 215 92.1 284 -3,178 349 -19.5 338 13,201 293 475 322 1,667 167 10.1%<br />
343 31 216 PAG AS 28,607 231 39.5 353 -459 340 -4.9 330 16,879 244 4,087 61 460 222 10.1%<br />
344 EMAJÕE ÄRIKESKUS AS 15,904 275 86.6 304 5,209 146 53.0 250 3.1 304 6,107 345 2,272 114 386 232 10.0%<br />
345 NELI TUBA OÜ 20,449 257 123.7 93 1,132 241 18.6 302 16.8 207 1,995 354 20,449 6 1,611 170 9.9%<br />
346 365 504 SILVA-AGRO AS 27,042 235 104.5 209 9 325 4.3 322 0.2 321 8,394 336 901 254 388 231 9.6%<br />
347 NUTITEQ OÜ 954 353 105.4 204 -107 333 -28.2 341 9,407 333 238 346 691 203 9.0%<br />
348 186 555 RONI REM AS* 17,523 269 73.0 338 -48 329 -0.7 325 8,409 335 237 347 353 8.3%<br />
349 SALESFORCE OÜ 1,754 349 94.0 275 4 328 3.1 325 2.7 310 5,563 348 92 354 6 318 8.2%<br />
350 96 ABSINT OÜ* 15,633 276 43.0 352 -4,202 350 -56.1 348 16,097 252 869 258 3,000 131 8.2%<br />
351 151 PRO FIKSUM OÜ 7,900 311 85.9 307 172 302 6.7 318 4.4 297 5,206 349 2,633 93 273 249 8.1%<br />
352 294 366 PINUS ABJA OÜ 8,030 308 75.6 334 30 323 8.7 316 0.6 320 6,012 346 268 345 572 212 7.9%<br />
353 273 508 444 PERFETTO STUUDIO OÜ 7,356 316 64.4 347 -879 344 -24.7 339 9,498 332 1,051 227 58 295 7.7%<br />
354 MODESAT COMMUNICATIONS OÜ 1,360 352 54.0 349 -2,412 346 -53.8 347 12,879 299 113 353 2,249 151 7.5%<br />
www.konkurents.ee<br />
1 EUR = 15.6466 EEK; 1 EEK = 0.0639 EUR; based on 2008 data<br />
34
The Most Competitive Enterprise 2009<br />
Mazeikiu Nafta<br />
Trading House OÜ<br />
The Most Competitive<br />
Trading Enterprise<br />
2009<br />
Fighting<br />
against<br />
value-added<br />
tax frauds<br />
At first glance it could seem that the<br />
annual sales of one company reaches<br />
almost 8 billion kroons. But while facing<br />
the facts this is the company selling<br />
the fuel. Estonia has enough cars<br />
and last year economic recession had<br />
no such impact – the sale of billions<br />
seems like a logical continuation.<br />
Tõnu Ääro, the manager of Mazeikiu<br />
Nafta Trading House, states that in<br />
addition to the record sales the numbers<br />
of volume were also the largest<br />
in the history of MNTH.<br />
The numbers are only one, but certainly the important<br />
side of the business activities. In addition<br />
to that the fighting against the tax frauds at<br />
the fuel market and supporting the youth sport<br />
from the social side is today important, as Tõnu<br />
Ääro talks about in the following interview.<br />
To sum up, the company’s manager assesses<br />
the last year as very good. The people spent<br />
more, the transport companies worked well and<br />
also the general economic situation was good<br />
for the most of the year. The impact of economic<br />
recession could be perceived with the fall in<br />
consumption for MNTH in the last months of<br />
the year, but the major event of the year was<br />
though the abrupt fall in the prices of the world<br />
market which started in the second half of July<br />
and continued up to the end of the year. The fall<br />
in price rather increased temporarily the consumption<br />
in the face of the braking economic<br />
growth. “To sum up, this was our record year!<br />
This year we got no such good sales numbers<br />
and we do not view our activities from the position<br />
of sales. Last year the sales reached<br />
though 8 billion kroons, but this year the total<br />
sales will be maybe 3-4 billion. We view the volume<br />
in tons, not in cash numbers. The ton of<br />
petrol cost earlier for example considerably<br />
more than 1000 dollars, today though 500-600<br />
dollars. The prices have fallen by a half, the sale<br />
also decreases, but the margins remained last<br />
year still good. In the current conditions we are<br />
forced to change our strategies to remain<br />
somehow in the competition in the face of the<br />
decreasing consumption and spoilt fuel market,”Ääro<br />
states.<br />
There is a special situation with the sales in<br />
Estonia. But this year the rise in value-added<br />
tax was established with the super short time,<br />
the state has not been able to stop the VAT<br />
frauds at the fuel market existent for already<br />
long time. The Oil Association connecting the<br />
major fuel companies has pursued to draw the<br />
attention of different state instances to this<br />
problem to finally liquidate the economically<br />
damaging situation for both the state and honest<br />
entrepreneurs and adopt the amendments<br />
of law regarding the changing of the taxation of<br />
selling in the excise warehouses of liquid fuels.<br />
Ääro thinks that no one seems to be interested<br />
in this.<br />
36
Photo: Toomas Tuul<br />
TÕNU ÄÄRO<br />
“The question is in that the tax money of tens<br />
of millions of kroons goes today to someone<br />
else’s pocket, at the same time the state<br />
makes major cuts in the budget. These are<br />
very high sums which will not be received by<br />
the state. At the same time such illegal activities<br />
cannot be directly called the fraud. The<br />
taxes will be rather unpaid as planned. The<br />
state still expects the payment of taxes from<br />
each company, but here it has been pre-programmed<br />
that no payments will be made. This<br />
strongly changes the market and today the<br />
market of liquid fuels has been totally spoilt,”<br />
the company’s manager is seriously worried.<br />
Probably the state will not receive at least<br />
twenty million kroons a month in the face of<br />
the value-added tax.<br />
Tõnu Ääro is sure that he made a very right<br />
decision six years ago when coming to MNTH<br />
from the major corporation Gillette group, the<br />
business of essential commodities, as the<br />
work provides sufficient challenges. At first<br />
the fact that fuel is a stock exchange commodity<br />
which is daily influenced by the world<br />
market seemed most different from the previous<br />
experience for him. “If you have operated<br />
in the field of essential commodities before<br />
then the situation there is different: you create<br />
the price at the beginning of the year and<br />
if no major changes take place, then you work<br />
with this price list up to the end of the year.<br />
But here the price changes every morning –<br />
always new numbers. Most of the marketing<br />
methods are also not usable in the wholesale<br />
of fuel, the main sales argument is price, the<br />
remaining values such as additional services<br />
have a minor impact. Though I just see the improvement<br />
of the quality of services involved<br />
with the sale of products the main objective of<br />
MNTH in the future to make the cooperation<br />
as comfortable and effective as possible for<br />
our partners.<br />
Ääro also explains the often incomprehensible<br />
logics for the regular consumer – the price of<br />
oil can fluctuate, but the fuel prices might not<br />
follow its trends short-term. One thing is the<br />
price of the crude oil at the world market and<br />
the other is the price of the world market of oil<br />
products which has been influenced by the limited<br />
production volumes, which in the long run<br />
still follow the price trend of the raw material.<br />
The wholesale prices of fuels in Estonia are established<br />
according to the prices of the world<br />
market and the fuel inventories are for up to few<br />
weeks for the local sellers. Provided these have<br />
been acquired with higher price, the retailer of<br />
fuel has no reason to sell the goods acquired<br />
with higher price with cheaper price at the<br />
abrupt decrease in world market price. The<br />
other matter is competition which has become<br />
tougher at the Estonian retail market. “Here the<br />
retail price is decreased also when the market<br />
price increases. Meanwhile the competition was<br />
quieter and the margins were good, but today<br />
the non-existent margins are played with.”<br />
By joking the manager of the company states<br />
that he himself has not watched the oil near the<br />
derrick. And though, should he? The main principles<br />
of production technology have been specified<br />
in the trainings in the refinement plant, but<br />
something new could be found all the time, for<br />
example today the new subject is the bio fuels.<br />
The main task of MNTH is still the sale and the<br />
different parameters need to be known for the<br />
good sales. “We have four main products and it<br />
could seem that this work is very simple, but actually<br />
this is big work with high volume and liability,”<br />
Ääro summarizes.<br />
In summer the company’s manager rides the<br />
bicycle and skies in winter. For the last two<br />
years he has been related to the one of the most<br />
successful Estonian sports club CFC, being the<br />
president of the latter, More than hundred<br />
young people train under the guidance of the<br />
good trainers in the bicycle school of Jaan Kirsipuu<br />
and ski school of Jaak Mae, but all new<br />
students are welcome. Pirita where the club operates<br />
has the excellent opportunities for bicycle<br />
sport and there are the best ski tracks of<br />
Tallinn and soon the branch of the sports club<br />
will be opened by Viimsi Secondary School. Ääro<br />
is really pleased that several companies find resources<br />
regardless of the difficult times to support<br />
the youth sport. Although one should admit<br />
that this year the support of sponsors has considerably<br />
decreased and as the situation of the<br />
club is not easy, people act based on the real<br />
saving regime. Ääro calls for the companies to<br />
support just the sports clubs where the children<br />
and young people train, this especially in the situation<br />
where several local governments have<br />
considerably decreased their support and many<br />
sports clubs are forced to close their doors.<br />
“Our children have to go in for sport regardless<br />
of the situation in economy, they are the future<br />
players of our country!” •<br />
MAZEIKIU NAFTA<br />
TRADING HOUSE OÜ 2008:<br />
Sales (th EEK) 7,911,943<br />
Change in sales 136.3 %<br />
Net profit (th EEK) 35,389<br />
Change in net profit 101.8 %<br />
Number of employees 9<br />
Investments (th EEK) 309<br />
Return on equity 63.1 %<br />
37
Photo: Toomas Tuul<br />
Retail and Wholesale Enterprises<br />
Place<br />
Sales Change Net profit Change Return Labour costs Efficiency per Investments %<br />
Enterprise in sales in net profit on equity per employee employee of the first<br />
*group<br />
th. EEK place % place th. EEK place % place % place EEK/month place th. EEK place th. EEK place (0...100)<br />
1 MAZEIKIU NAFTA TRADING HOUSE OÜ 7,911,943 1 136.3 9 35,389 6 101.8 21 63.1 4 104,352 1 879,105 1 309 42 100.0%<br />
2 TALLINNA KAUBAMAJA AS* 6,531,420 2 110.8 26 83,129 3 20.2 59 4.5 62 15,063 62 1,764 58 1,120,517 1 76.0%<br />
3 MAGNUM AS* 3,205,515 4 117.9 19 119,992 1 90.3 26 24.0 34 18,058 51 2,987 39 241,870 2 58.4%<br />
4 SEMETRON AS* 154,950 23 173.3 2 15,649 12 930.5 1 40.5 17 28,322 21 3,297 35 1,294 24 57.2%<br />
5 NORPE EESTI OSAÜHING* 66,780 36 171.4 3 3,252 36 282.3 6 48.8 8 74,846 2 33,390 4 16 62 49.9%<br />
6 CLAIRE FOODS OÜ 87,434 27 140.5 8 4,154 30 709.6 2 67.3 3 33,650 10 21,858 5 35 57 46.6%<br />
7 KEMIRA GROWHOW AS 1,622,858 6 140.5 7 30,293 8 78.5 37 18.2 44 46,823 4 50,714 3 327 41 42.8%<br />
8 KAVIAL OÜ 29,345 51 103.9 37 6,125 25 89.9 27 1208.0 1 15,317 60 1,630 59 159 47 42.1%<br />
9 OILSEEDS TRADE AS* 278,372 17 170.7 4 8,921 19 435.0 4 100.3 2 15,341 59 13,256 9 8,959 14 41.9%<br />
10 HALJAS AS 249,401 19 122.8 13 10,683 17 660.3 3 42.1 15 26,695 30 4,890 23 5,285 16 41.8%<br />
11 STOCKMANN AS 1,363,771 7 98.3 49 97,849 2 55.4 48 20.9 40 15,118 61 2,066 50 9,480 13 39.2%<br />
12 TATOLI AS 435,054 15 164.9 5 21,942 11 135.5 12 32.1 26 27,693 22 10,849 11 10,709 12 37.7%<br />
13 METAL EXPRESS OÜ 29,229 52 186.1 1 938 51 70.4 43 29.4 29 32,029 12 9,743 13 687 34 34.7%<br />
14 ELKE GRUPI AS* 1,850,182 5 89.3 57 41,668 5 49.8 50 11.9 54 24,981 34 4,303 29 110,579 4 32.9%<br />
15 SILBERAUTO AS* 3,342,088 3 68.2 70 26,111 10 11.3 64 3.5 64 26,862 27 4,795 24 149,795 3 31.4%<br />
16 BALTIC PULP AND PAPER OÜ 478,275 14 77.1 66 50,296 4 260.4 8 51.4 7 9,928 68 59,784 2 2,066 22 30.5%<br />
17 ADDINOL MINERALÖL MARKETING OÜ 197,985 22 110.9 25 10,351 18 115.2 16 21.2 39 41,371 5 5,657 20 790 32 28.9%<br />
18 WIRTGEN EESTI OÜ* 115,803 25 112.8 23 3,357 35 51.1 49 20.8 41 51,202 3 14,475 8 6,599 15 28.7%<br />
19 SÖDERHAMN ERIKSSON EESTI AS* 21,012 57 109.2 30 1,975 44 327.7 5 16.3 46 27,054 24 3,002 38 32 58 28.3%<br />
20 FRELOK AS 564,820 12 83.0 61 31,911 7 105.8 20 19.5 42 26,832 28 6,973 16 3,858 18 26.2%<br />
21 PINTAVÄRI EESTI OÜ 23,985 55 125.9 11 1,971 45 92.3 24 28.5 30 29,574 18 3,426 32 307 43 25.7%<br />
22 KOMPRESSORIKESKUS OÜ* 55,294 38 118.1 18 2,574 40 92.5 23 25.3 31 30,198 15 1,907 56 688 33 24.8%<br />
23 ISIS MEDICAL OÜ* 34,001 48 123.5 12 1,980 43 116.1 14 47.2 11 22,878 40 3,091 37 15 63 24.7%<br />
24 SAAREMAA TARBIJATE ÜHISTU TUÜ 629,371 11 101.6 43 6,914 24 267.8 7 10.1 56 12,533 65 1,457 63 3,240 19 24.7%<br />
25 BENEFIT AS 50,848 41 109.3 29 3,414 34 63.6 46 23.1 36 36,885 7 2,421 43 2,900 20 24.5%<br />
26 FRIENDS TEXTILE OÜ* 44,628 43 102.1 42 8,090 20 107.0 19 36.1 23 31,642 13 2,349 46 872 31 24.3%<br />
27 VALOOR AS 142,172 24 86.9 58 14,077 14 141.2 11 38.4 20 27,077 23 3,306 34 21,939 6 23.8%<br />
28 EVERDEAL EESTI AS 79,733 32 102.2 41 7,353 22 109.3 18 37.6 21 28,727 20 4,430 28 203 46 23.8%<br />
29 ELKE AUTO AS 657,168 10 72.7 69 27,529 9 47.8 51 21.2 38 29,400 19 6,200 17 4,602 17 23.2%<br />
30 HAUGER OÜ 5,454 70 146.3 6 138 66 85.8 32 43.2 14 5,995 74 1,364 66 72 22.7%<br />
31 HUMANA SORTEERIMISKESKUS OÜ 83,508 28 114.9 20 493 60 228.5 9 12.1 53 11,428 66 506 74 74 22.6%<br />
32 NORDIUM OÜ* 2,680 74 119.4 15 482 61 115.1 17 39.8 19 18,362 50 2,680 42 2 67 22.5%<br />
33 TIMMERMANN AS 9,395 66 126.6 10 2,877 39 115.6 15 48.8 9 10,737 67 626 73 970 29 22.4%<br />
34 NOVATERRA TRADE AS 80,425 31 118.9 16 1,324 47 36.9 54 24.8 32 25,689 31 6,187 18 502 37 22.3%<br />
35 EXCELLENT GRUPP AS 46,615 42 98.7 47 11,555 16 75.2 40 24.6 33 24,409 36 15,538 6 1,161 27 22.0%<br />
36 AIRWAVE OÜ 53,637 39 118.9 17 5,662 26 89.1 28 30.6 28 15,559 58 3,352 33 1,267 25 22.0%<br />
37 KULBERT AS* 76,000 34 109.4 28 2,520 41 87.3 30 16.3 45 24,778 35 5,067 22 65 21.9%<br />
www.konkurents.ee<br />
1 EUR = 15.6466 EEK; 1 EEK = 0.0639 EUR; based on 2008 data<br />
38
Photo: Txpeter<br />
Retail and Wholesale Enterprises<br />
Place<br />
Sales Change Net profit Change Return Labour costs Efficiency per Investments %<br />
Enterprise in sales in net profit on equity per employee employee of the first<br />
*group<br />
th. EEK place % place th. EEK place % place % place EEK/month place th. EEK place th. EEK place (0...100)<br />
38 TAMREX OHUTUSE OÜ 82,961 29 107.2 31 4,900 29 71.0 42 36.6 22 24,246 37 1,383 65 878 30 21.9%<br />
39 VARMAPARTNER OÜ 23,909 56 105.6 33 578 58 17.9 61 18.4 43 33,657 9 11,955 10 12,450 10 21.7%<br />
40 KAESER KOMPRESSORIT OY EESTI FILIAAL 40,702 45 104.9 35 3,128 37 92.5 22 23.5 35 25,394 32 4,522 26 57 54 21.7%<br />
41 CATWEES OÜ* 494,056 13 84.0 59 15,276 13 30.2 58 10.0 58 29,633 17 5,745 19 14,623 7 21.7%<br />
42 INFOTARK AS 258,257 18 95.8 51 13,323 15 74.3 41 11.1 55 21,674 41 2,369 45 14,449 8 21.5%<br />
43 VEHO EESTI AS 1,000,958 9 83.6 60 5,193 27 12.7 63 3.8 63 26,750 29 7,000 15 80,410 5 21.4%<br />
44 FORANKRA BALTIC OÜ 28,720 53 80.6 63 5,135 28 80.3 36 31.9 27 38,346 6 2,393 44 22 61 21.3%<br />
45 HAMMER SERVICE OÜ 6,611 69 103.5 39 891 53 135.4 13 43.3 12 20,288 44 1,469 61 368 40 21.2%<br />
46 ROVICO BÜROO OÜ 11,544 63 98.6 48 1,846 46 59.5 47 48.4 10 29,923 16 2,272 47 9 64 21.2%<br />
47 KENTEK EESTI OÜ* 19,647 58 103.7 38 919 52 87.5 29 14.6 47 26,944 25 1,965 52 131 49 21.0%<br />
48 MOKTER AS 202,579 21 122.0 14 772 56 82.7 34 3.1 65 13,717 64 8,441 14 1,007 28 20.9%<br />
49 GRUNDFOS PUMPS EESTI OÜ* 63,178 37 100.2 45 722 57 18.9 60 14.3 48 33,867 8 5,265 21 276 44 20.6%<br />
50 AURE OÜ* 9,746 64 93.9 52 2,475 42 187.6 10 40.8 16 16,929 54 1,949 53 36 56 20.5%<br />
51 BEAM BALTIC OÜ* 2,959 73 110.8 27 321 62 77.7 39 52.6 6 16,720 56 2,959 40 66 20.1%<br />
52 VIPEX AS 88,535 26 96.4 50 8,082 21 81.5 35 14.0 50 20,037 45 3,279 36 2,323 21 19.7%<br />
53 SIGARI MAJA OÜ* 30,065 49 105.4 34 3,614 33 91.9 25 22.4 37 16,865 55 1,582 60 108 50 19.6%<br />
54 NORES PLASTIC OÜ 76,613 33 90.1 54 1,182 48 41.2 53 13.6 51 32,263 11 15,323 7 245 45 19.6%<br />
55 NURMIKO HULGI OÜ 81,425 30 101.2 44 3,033 38 86.0 31 40.5 18 17,041 53 1,894 57 70 19.4%<br />
56 AP TRADING AS 12,259 62 113.5 21 -145 71 -7.4 73 22,978 39 2,043 51 68 18.6%<br />
57 <strong>TOP</strong>AUTO RAKVERE OÜ 29,401 50 89.7 56 778 55 84.7 33 53.6 5 21,108 42 2,940 41 58 52 18.4%<br />
58 LUKU-EXPERT OÜ, ENDINE ARAFEA GRUPP OÜ 39,634 47 89.8 55 3,914 31 65.5 45 33.0 25 19,721 46 1,468 62 71 17.7%<br />
59 R KIOSK EESTI AS 392,387 16 106.1 32 3,647 32 35.4 55 10.1 57 9,727 69 703 72 12,056 11 17.6%<br />
60 BORTER TRADE OÜ 7,987 67 113.0 22 4 69 1.5 69 2.9 66 14,508 63 1,141 67 141 48 16.7%<br />
61 REPAL-E OÜ 40,032 46 91.6 53 1,112 49 43.6 52 12.4 52 20,413 43 4,448 27 559 35 16.6%<br />
62 SWIPE EESTI OÜ* 3,272 72 102.7 40 552 59 78.2 38 43.2 13 7,542 73 1,091 68 73 16.5%<br />
63 MAASIKAS & KO OÜ 19,319 59 111.2 24 250 63 32.1 57 7.4 59 7,654 72 878 71 1,192 26 15.8%<br />
64 ARHDISAIN OÜ 41,557 44 81.8 62 861 54 70.0 44 14.3 49 18,778 47 4,617 25 68 51 15.4%<br />
65 LÄÄNE AGROVARU OÜ 4,354 71 99.6 46 -73 70 -7.3 72 17,897 52 1,451 64 22 60 15.2%<br />
66 SKS VÕRU OÜ 67,151 35 72.8 68 181 65 4.8 67 1.4 68 31,551 14 4,197 30 49 55 15.1%<br />
67 SILBERAUTO EESTI AS 1,281,849 8 67.9 71 -6,086 74 -4.0 71 25,011 33 3,944 31 1,879 23 15.1%<br />
68 LUKU SERVICE OÜ 17,474 61 67.0 72 995 50 35.1 56 34.4 24 26,881 26 1,942 55 69 14.6%<br />
69 SILVA-AGRO AS 27,042 54 104.5 36 9 68 4.3 68 0.2 69 8,394 71 901 70 388 39 14.0%<br />
70 CARRING AS 52,925 40 75.8 67 242 64 12.9 62 4.8 61 23,067 38 2,117 49 406 38 13.7%<br />
71 Ü&A AS 19,206 60 79.6 64 -319 72 -3.3 70 18,680 48 2,134 48 534 36 12.6%<br />
72 LRF PRIVATE OÜ 9,726 65 78.1 65 70 67 6.2 66 2.0 67 15,959 57 1,945 54 22 59 12.0%<br />
73 AGROCHEMA EESTI OÜ 225,282 20 27.4 74 6,969 23 9.4 65 5.5 60 18,402 49 9,795 12 12,913 9 7.6%<br />
74 PERFETTO STUUDIO OÜ 7,356 68 64.4 73 -879 73 -24.7 74 9,498 70 1,051 69 58 53 7.4%<br />
www.konkurents.ee<br />
1 EUR = 15.6466 EEK; 1 EEK = 0.0639 EUR; based on 2008 data<br />
39
RIVERSIDE OÜ<br />
The Most Competitive<br />
Small and Medium-sized<br />
Enterprise<br />
2009<br />
Photo: Toomas Tuul<br />
JÜRI PÕLD<br />
On the way<br />
to the new markets<br />
Riverside started from the countryside,<br />
Pala from Jõgeva area, the place<br />
where one of the managers of the construction<br />
company Jüri Põld originates<br />
from. At the better times 60-70 people<br />
were employed in the company, today<br />
the market situation is slightly more<br />
complicated and the fact has become<br />
clear that there is no sense to do<br />
everything with own forces. One fact<br />
among others is interesting: how often<br />
have you heard of the company that<br />
takes time to train its employees,<br />
knowing that therefore the sales decreases<br />
anyway? Such decision was<br />
though made in Riverside in 2007. In a<br />
year’s time the construction market<br />
collapsed, today in 2009 the situation is<br />
even more complicated. The same construction<br />
company works and stays at<br />
the market quite successfully regardless<br />
of everything.<br />
We meet the manager of the company<br />
one morning when he has quite<br />
little time. After the interview he<br />
rushes to the airport with the car<br />
to fly fast to Ukraine. Also several<br />
other construction companies look<br />
into this country and many others do<br />
not dare to enter the Ukrainian market.<br />
But at the beginning we start<br />
from the reasons of establishing the<br />
company.<br />
41
Photo: Toomas Tuul<br />
RIVERSIDE’S HISTORY:<br />
The company was established in 2003<br />
and is based on the Estonian capital.<br />
Last year 25 persons worked in the<br />
company. In addition to regular general<br />
construction works also the services<br />
of construction management and<br />
design are provided to its clients.<br />
Among other things, it is also interesting<br />
that the permit for the conservation<br />
and restoration of architectural<br />
monuments has been issued by the<br />
Heritage Protection Board to the company.<br />
Also, Riverside carries out the<br />
research works through different architectural<br />
monuments.<br />
All started from the fact that there was no serious<br />
construction company in Pala rural municipality<br />
which would fulfil the major orders. “As at<br />
that moment the money of the state and the European<br />
Union was directed thereto, the thought<br />
came from there. This is actually the outskirts<br />
and Pala area was like in the role of orphan for<br />
a long time. We had the idea to operate in this<br />
area quietly and provide the competitive construction<br />
service to the local people. Then, for<br />
the best or for the worst, the slightly larger organisations<br />
incurred the competition with which<br />
was already difficult and then we started to look<br />
for the way to Tallinn. Finally we moved to Tallinn<br />
and here really everything grows and develops<br />
constantly,” Põld explains the background.<br />
Põld is the man who, if needed, also takes the<br />
trowel into hand, piles up the wall and carries<br />
the heavy blocks at the construction site. In any<br />
case – one thing is clear that the managers of<br />
the company are not afraid of the work or major<br />
challenges: slightly after when it clarified that<br />
the construction market in Estonia falls, the<br />
company decided to expand to Ukraine. “Currently<br />
I do not deal directly with management in<br />
Estonia, as the expansion to the Ukrainian market<br />
is quite labour intensive. The representation<br />
has been established there and the first works<br />
are under process. In July this year we started<br />
with works there. The objects to be built there<br />
are currently still a secret – when completed,<br />
we talk about it,” Põld says modestly.<br />
The choice was made for the benefit of Ukraine<br />
due to the fact that this country has not yet<br />
reached so high in its development than the<br />
vicinity of Russia and its major cities. Riverside<br />
has understood that the construction boom in<br />
Ukraine just started and there are relatively few<br />
companies with good structure and experience.<br />
Ukraine has surely major companies, but these<br />
are not so flexible.<br />
As no construction orders come from the private<br />
sector, Riverside keeps itself in process<br />
such as many other Estonian construction companies<br />
with the public procurements at the local<br />
market. They participate actively where possible<br />
and the statistics indicates that in average<br />
of 10% of the tenders are won. Põld tells that<br />
the market is adjusting - small Estonia has very<br />
many construction companies established during<br />
the boom which have no work and now<br />
these companies with 2-6 men disappear with<br />
high probability. “Our problem is that when<br />
there were good times, then every employee<br />
having been a specialist for a couple of years,<br />
decided to establish own company and thus very<br />
many valued and good people were lost and<br />
several nothing-telling companies were received<br />
without correct administration and management<br />
of the company. The Estonian is also<br />
very tough, even if it can be seen that the situation<br />
is bad and there is no sense in continuation,<br />
he still continues. We have lost the tenders to<br />
relatively unknown companies and if their annual<br />
report is reviewed there is nothing, a long<br />
column of tax debts can be seen and just the<br />
moment before making the tender everything<br />
will be arranged. I do not know how they are<br />
able to fulfil the order and the quality is questionable,”<br />
Põld thinks. There is one more thing<br />
that disturbs the company’s manager. Namely<br />
that the documentation of the procurements<br />
has been poorly prepared. “I do not know<br />
whether people could not deal with this documentation<br />
or why is this like that, but the requirements<br />
are thus absurd.“<br />
The year 2006 was an excellent year for the<br />
company and then the problem of training the<br />
personnel arose. Thus it was decided not to expand<br />
in 2007, but to contribute to one’s employees,<br />
this in its turn naturally decreased the<br />
sales and results. In 2008 Riverside had the next<br />
year of rise, but as Põld says – maybe at the<br />
wrong time, as the market started to fall. Anyway,<br />
several big and small projects were completed<br />
in 2008.<br />
“The office tower, i.e. Audi house was built in<br />
2008 by the centre of Rocca al Mare – this was<br />
our major contract last year which also reached<br />
the year 2009, as my aim was the expansion towards<br />
Ukraine. One object should be immediately<br />
completed in Konguta – renovation of one<br />
kindergarten and school, one shed-drier is in<br />
progress which is under heritage protection and<br />
therefore the construction works require high<br />
skills. One object is also in Võru City Government<br />
which will be completed in March 2010<br />
and many small objects are also in Tallinn,”<br />
Põld views the long list of works.<br />
To sum up Põld says that the men will always<br />
remain children. When in the childhood the children<br />
play with small blocks, then now the<br />
blocks are slightly bigger. “Construction is actually<br />
very interesting, you build something and<br />
this will remain for the tens of years. It feels extraordinarily<br />
good when something especially<br />
interesting could be set up!“ •<br />
RIVERSIDE OÜ 2008:<br />
Sales (th EEK) 131,003<br />
Change in sales 506.7 %<br />
Net profit (th EEK) 11,081<br />
Change in net profit 100 %<br />
Number of employees 25<br />
Investments (th EEK) 211<br />
Return on equity 1385.1 %<br />
42
Small and Medium-sized Enterprises<br />
Place<br />
Sales Change Net profit Change Return Labour costs Efficiency per Investments %<br />
Enterprise in sales in net profit on equity per employee employee of the first<br />
*group<br />
th. EEK place % place th. EEK place % place % place EEK/month place th. EEK place th. EEK place (0...100)<br />
1 RIVERSIDE OÜ 131,003 1 506.7 4 11,081 5 100 64 1385.1 1 24,124 54 5,240 16 211 110 100.0%<br />
2 NORPE EESTI OSAÜHING* 66,780 19 171.4 21 3,252 46 282.3 10 48.8 32 74,846 1 33,390 1 16 155 94.0%<br />
3 CLAIRE FOODS OÜ 87,434 7 140.5 33 4,154 32 709.6 4 67.3 16 33,650 19 21,858 2 35 146 85.3%<br />
4 SMS LAEN AS* 90,415 5 125.4 57 25,186 1 236.2 15 64.0 18 52,377 3 4,305 25 1,429 45 84.8%<br />
5 ÜLIKOOLILINNA ÄRIKESKUS AS 23,393 89 1,124.1 1 -399 177 -0.5 166 2,979 185 5,848 12 275,312 1 73.5%<br />
6 WIRTGEN EESTI OÜ* 115,803 2 112.8 82 3,357 45 51.1 124 20.8 96 51,202 4 14,475 6 6,599 13 71.4%<br />
7 POLVEN OÜ* 69,383 17 107.2 102 1,570 82 1,984.9 1 14.2 112 38,622 10 2,478 48 2,061 37 70.6%<br />
8 OÜ ADEPTE* 21,891 94 286.1 8 14,745 2 91.9 82 31.0 69 45,742 5 2,189 55 32,558 4 58.7%<br />
9 EXCELLENT GRUPP AS 46,615 41 98.7 131 11,555 4 75.2 101 24.6 85 24,409 51 15,538 4 1,161 52 54.7%<br />
10 ROMEC METALL OÜ 18,656 105 210.0 12 2,621 57 771.0 3 124.6 5 22,981 59 1,333 93 571 71 52.9%<br />
11 NORES PLASTIC OÜ 76,613 14 90.1 149 1,182 89 41.2 127 13.6 116 32,263 21 15,323 5 245 106 52.6%<br />
12 TRETIMBER OÜ* 97,096 3 99.4 128 9,674 7 105.2 62 26.3 81 18,742 99 2,490 47 6,100 14 52.0%<br />
13 EVERDEAL EESTI AS 79,733 13 102.2 119 7,353 12 109.3 58 37.6 54 28,727 33 4,430 23 203 111 51.4%<br />
14 BLOOM OÜ 1,584 182 3,088.9 3 77 156 227.5 17 200.0 4 10,056 165 792 136 326 92 51.0%<br />
15 ROOTSI MÖÖBEL AS 92,979 4 110.7 90 10,204 6 81.0 98 19.7 98 19,053 96 2,113 59 1,639 41 50.5%<br />
16 MAKRON ESTONIA OÜ 83,395 10 129.9 47 7,160 15 104.8 63 33.9 61 27,952 38 2,085 60 350 88 50.4%<br />
17 FIBROTX OÜ 7,621 147 1,251.0 2 1,173 90 90.9 84 60.0 22 18,600 102 586 154 28 148 49.1%<br />
18 VIPEX AS 88,535 6 96.4 136 8,082 10 81.5 96 14.0 113 20,037 85 3,279 33 2,323 31 48.4%<br />
19 ESTANC AS* 84,865 9 146.2 29 6,539 17 115.0 55 43.7 37 19,368 93 1,886 72 3,704 19 48.0%<br />
20 ASPERAAMUS OÜ 58,717 29 85.8 159 3,966 36 329.5 9 91.7 9 12,847 150 8,388 11 341 90 47.9%<br />
21 FOLIE MP AS 60,956 27 227.4 11 4,628 29 94.5 77 9.2 132 23,300 56 4,354 24 25,233 6 47.7%<br />
22 INTERNATIONAL ALUMINIUM CASTING TARTU AS 69,657 16 124.8 58 7,831 11 144.9 40 28.4 76 22,778 63 1,583 82 9,961 11 47.5%<br />
23 ESRO AS* 87,249 8 109.1 93 2,530 60 31.3 136 3.3 148 21,955 69 1,781 75 55,591 3 46.4%<br />
24 VÄRSKA VESI AS 82,426 11 118.6 72 5,356 22 172.4 28 42.9 43 15,711 126 1,717 77 5,341 16 45.7%<br />
25 ADVISIO OÜ* 10,393 133 272.7 9 3,436 42 532.9 5 119.3 6 21,082 77 799 132 200 114 45.7%<br />
26 PULEIUM OÜ 4,360 164 172.5 19 876 102 931.0 2 96.2 8 9,151 169 1,090 103 553 73 45.3%<br />
27 NORDCESTER ENGINEERING AS* 63,749 21 104.3 114 451 124 15.1 152 7.7 140 40,211 8 5,312 14 17,835 7 45.1%<br />
28 KULBERT AS* 76,000 15 109.4 91 2,520 61 87.3 89 16.3 106 24,778 47 5,067 18 160 44.1%<br />
29 CORPORE AS* 24,902 83 132.2 44 3,531 41 225.2 19 63.6 20 43,355 7 1,660 79 88 130 44.1%<br />
30 TELORA-E AS 47,808 40 92.6 144 5,361 21 39.4 128 32.4 64 44,964 6 1,328 94 311 94 43.9%<br />
31 FRIENDS TEXTILE OÜ* 44,628 43 102.1 120 8,090 9 107.0 61 36.1 56 31,642 24 2,349 51 872 57 43.9%<br />
32 REMEI BALTICA OÜ 22,885 92 98.3 134 2,864 53 68.4 104 31.2 66 56,704 2 3,814 28 29 147 43.8%<br />
33 TESA LOGISTICS OÜ 63,203 22 86.4 157 3,737 39 56.8 117 31.1 68 20,865 78 9,029 9 5,071 17 43.7%<br />
34 AEK OÜ* 61,125 26 79.9 168 6,641 16 68.2 105 43.7 38 27,161 40 3,217 34 68 134 43.5%<br />
35 TERG OÜ 61,687 25 108.1 98 1,695 80 116.5 51 13.3 117 30,575 27 5,141 17 43 144 43.2%<br />
36 WELLSPA OÜ* 56,065 30 87.0 155 11,857 3 88.4 86 44.0 36 16,673 120 1,933 68 476 76 43.1%<br />
37 Q-HAUS BALTIC OÜ 62,644 24 342.4 6 6,243 18 100 65 15,984 124 2,983 37 377 86 42.8%<br />
38 LINDREM AS 55,328 31 53.0 184 7,230 14 148.6 38 87.7 10 24,507 50 1,383 89 229 108 42.8%<br />
39 PLANSERK AS 32,748 65 122.6 62 3,783 38 166.9 32 40.4 49 40,002 9 1,926 69 2,113 36 42.6%<br />
40 BENEFIT AS 50,848 36 109.3 92 3,414 43 63.6 110 23.1 87 36,885 12 2,421 49 2,900 24 41.8%<br />
41 METAL EXPRESS OÜ 29,229 71 186.1 16 938 99 70.4 102 29.4 74 32,029 22 9,743 8 687 64 41.4%<br />
42 GRUNDFOS PUMPS EESTI OÜ* 63,178 23 100.2 125 722 109 18.9 147 14.3 110 33,867 17 5,265 15 276 99 41.1%<br />
43 UTILEEK OÜ 20,649 96 208.6 13 1,992 72 64.1 108 510.7 2 15,530 128 2,950 39 3,300 21 41.0%<br />
44 K.M.T. MAJATEHAS OÜ 38,633 58 132.6 42 4,083 33 243.2 13 26.7 80 27,469 39 1,431 87 670 65 40.9%<br />
45 NURMIKO HULGI OÜ 81,425 12 101.2 121 3,033 48 86.0 92 40.5 48 17,041 114 1,894 71 168 40.4%<br />
46 VIRU ELEKTRIK AS 41,668 49 237.1 10 2,442 63 201.7 24 55.7 24 19,738 90 1,984 63 77 131 40.0%<br />
47 TARFURGO OÜ 43,877 44 150.4 26 2,675 56 247.6 12 50.5 30 21,201 74 1,994 62 96 127 39.9%<br />
48 KOMPRESSORIKESKUS OÜ* 55,294 32 118.1 73 2,574 59 92.5 80 25.3 83 30,198 28 1,907 70 688 63 39.8%<br />
49 VARMAPARTNER OÜ 23,909 87 105.6 107 578 112 17.9 150 18.4 100 33,657 18 11,955 7 12,450 10 39.5%<br />
50 FORANKRA BALTIC OÜ 28,720 73 80.6 167 5,135 27 80.3 99 31.9 65 38,346 11 2,393 50 22 153 38.7%<br />
51 AIRWAVE OÜ 53,637 33 118.9 71 5,662 19 89.1 85 30.6 71 15,559 127 3,352 31 1,267 47 38.1%<br />
52 SKS VÕRU OÜ 67,151 18 72.8 178 181 141 4.8 160 1.4 158 31,551 26 4,197 26 49 142 38.1%<br />
53 SYSTEMTEST OÜ* 27,437 77 135.7 35 4,238 31 140.7 41 35.7 57 31,979 23 1,372 90 89 129 37.7%<br />
54 ESMA VARA AS 17,928 106 152.5 25 9,407 8 148.4 39 10.8 127 6,946 175 8,964 10 18 154 37.4%<br />
55 DALE LD AS 50,104 38 93.7 141 4,987 28 58.5 113 18.1 101 22,489 65 1,023 108 17,044 8 37.1%<br />
56 RIIGIRESSURSSIDE KESKUS OÜ* 66,080 20 106.6 105 651 111 1.6 167 0.1 165 11,556 153 3,304 32 62,531 2 37.1%<br />
www.konkurents.ee<br />
1 EUR = 15.6466 EEK; 1 EEK = 0.0639 EUR; based on 2008 data<br />
43
Photo: Toomas Tuul<br />
Small and Medium-sized Enterprises<br />
Place<br />
Sales Change Net profit Change Return Labour costs Efficiency per Investments %<br />
Enterprise in sales in net profit on equity per employee employee of the first<br />
*group<br />
th. EEK place % place th. EEK place % place % place EEK/month place th. EEK place th. EEK place (0...100)<br />
57 KAESER KOMPRESSORIT OY EESTI FILIAAL 40,702 52 104.9 112 3,128 47 92.5 79 23.5 86 25,394 45 4,522 21 57 140 37.1%<br />
58 REAALSÜSTEEMID AS 12,184 126 92.3 145 2,025 71 525.2 6 13.1 119 21,099 76 1,108 102 98 126 36.9%<br />
59 MOBI SOLUTIONS OÜ* 23,686 88 128.5 52 2,894 50 343.0 8 53.5 28 19,988 86 987 111 89 128 36.6%<br />
60 PALKTARE OÜ 53,249 34 109.0 94 1,777 77 172.9 27 12.3 124 21,513 73 1,238 97 2,561 27 36.6%<br />
61 AIK-PROJEKT OÜ 3,868 167 83.3 163 793 105 422.4 7 70.2 14 33,103 20 774 137 26 150 36.5%<br />
62 EESTI TURBATOOTED AS 43,371 45 107.6 101 5,339 23 109.5 56 39.6 52 19,854 89 1,807 74 2,141 35 36.5%<br />
63 CHEMI-PHARM AS* 39,924 54 129.3 49 5,400 20 126.8 47 33.5 62 19,897 88 1,248 96 2,791 25 36.4%<br />
64 E-ARSENAL AS 36,089 60 161.5 22 3,026 49 100 66 39.9 50 22,274 67 3,609 29 162 36.3%<br />
65 KALTSIIT AS 40,927 51 82.3 164 7,308 13 58.3 114 16.3 105 23,537 55 974 112 4,081 18 36.0%<br />
66 REHVIMEISTER AS 39,094 56 83.9 160 2,108 68 53.7 121 8.6 135 35,104 16 2,606 43 165 35.8%<br />
67 VÄRVALTRANS OÜ* 34,051 62 105.5 108 5,197 25 94.2 78 36.3 55 18,593 103 973 113 32,038 5 35.6%<br />
68 AS SUWEM 45,181 42 106.7 104 5,177 26 166.0 33 34.3 60 15,247 130 922 118 314 93 35.4%<br />
69 BALTI VESKI AS 50,653 37 120.9 65 2,247 66 108.3 60 14.5 108 20,254 84 2,533 44 264 104 35.4%<br />
70 FAABULA AS 35,640 61 131.1 45 1,781 76 230.2 16 40.6 47 18,460 105 2,228 54 2,719 26 35.4%<br />
71 AESTON OÜ 48,686 39 106.7 103 2,150 67 22.0 142 13.9 114 24,599 49 3,043 36 173 117 34.1%<br />
72 ISIS MEDICAL OÜ* 34,001 63 123.5 61 1,980 73 116.1 52 47.2 35 22,878 61 3,091 35 15 156 34.1%<br />
73 PINTAVÄRI EESTI OÜ 23,985 86 125.9 56 1,971 74 92.3 81 28.5 75 29,574 30 3,426 30 307 95 33.8%<br />
74 NELI TUBA OÜ 20,449 98 123.7 60 1,132 91 18.6 149 16.8 104 1,995 186 20,449 3 1,611 42 33.7%<br />
75 RAJA K.T. OÜ 60,627 28 128.6 51 2,612 58 57.5 115 12.8 122 10,045 166 1,732 76 14,649 9 33.5%<br />
76 INLOOK COLOR OÜ 30,883 66 104.2 115 3,410 44 109.5 57 11.0 126 26,430 43 1,287 95 170 118 33.1%<br />
77 INVARU OÜ 30,200 68 132.6 43 2,087 69 224.8 20 41.2 45 18,505 104 795 134 200 113 33.0%<br />
78 GSMVALVE OÜ 22,970 90 171.9 20 2,372 64 225.8 18 87.6 11 15,041 133 792 135 1,660 40 32.8%<br />
79 USESOFT AS 25,375 81 98.8 130 738 108 215.8 22 34.5 58 25,998 44 1,336 92 300 97 32.6%<br />
80 PROFOOD INVEST OÜ 5,065 160 152.6 24 381 129 241.8 14 382.0 3 6,271 176 2,533 45 736 60 32.2%<br />
81 LUKU-EXPERT OÜ, ENDINE ARAFEA GRUPP OÜ 39,634 55 89.8 152 3,914 37 65.5 107 33.0 63 19,721 91 1,468 85 169 31.8%<br />
82 FINNLAMELLI EESTI OÜ 41,700 48 81.9 165 2,355 65 52.8 123 29.4 73 23,084 57 1,604 81 1,458 43 31.7%<br />
83 BDA CONSULTING OÜ 18,772 104 130.6 46 998 97 35.1 132 50.0 31 35,476 14 1,707 78 415 80 31.6%<br />
84 EKTACO AS 27,599 76 116.2 76 1,729 79 81.3 97 25.3 82 28,138 36 1,022 109 1,148 53 31.2%<br />
85 ARHDISAIN OÜ 41,557 50 81.8 166 861 104 70.0 103 14.3 111 18,778 98 4,617 20 68 135 31.1%<br />
86 LUISA TÕLKEBÜROO OÜ 25,610 80 107.9 100 412 126 167.5 30 2.6 154 29,106 31 582 155 300 96 31.0%<br />
87 REPAL-E OÜ 40,032 53 91.6 146 1,112 93 43.6 126 12.4 123 20,413 82 4,448 22 559 72 31.0%<br />
88 CENTRALPHARMA COMMUNICATIONS OÜ 24,668 84 119.8 67 783 106 61.9 111 22.7 89 31,625 25 1,121 100 403 83 30.5%<br />
89 CARRING AS 52,925 35 75.8 174 242 134 12.9 155 4.8 144 23,067 58 2,117 58 406 82 30.5%<br />
90 IKODOR AS 37,160 59 65.4 181 4,479 30 24.5 141 10.5 129 20,663 79 1,616 80 5,535 15 30.5%<br />
91 P.P.EHITUS OÜ* 5,240 158 111.6 86 2,685 55 273.1 11 28.1 77 22,805 62 749 140 180 30.2%<br />
92 PROFLINE AS* 28,259 75 111.9 85 1,354 85 63.8 109 21.1 94 24,882 46 2,174 56 59 137 29.9%<br />
93 <strong>TOP</strong>AUTO RAKVERE OÜ 29,401 70 89.7 153 778 107 84.7 94 53.6 27 21,108 75 2,940 40 58 138 29.5%<br />
www.konkurents.ee<br />
1 EUR = 15.6466 EEK; 1 EEK = 0.0639 EUR; based on 2008 data<br />
44
Photo: Toomas Tuul<br />
Small and Medium-sized Enterprises<br />
Place<br />
Sales Change Net profit Change Return Labour costs Efficiency per Investments %<br />
Enterprise in sales in net profit on equity per employee employee of the first<br />
*group<br />
th. EEK place % place th. EEK place % place % place EEK/month place th. EEK place th. EEK place (0...100)<br />
94 SIGARI MAJA OÜ* 30,065 69 105.4 109 3,614 40 91.9 83 22.4 90 16,865 117 1,582 83 108 123 29.4%<br />
95 SONA SYSTEMS OÜ 5,476 155 133.6 40 2,888 51 162.3 34 82.8 13 11,222 157 5,476 13 779 59 28.9%<br />
96 ROVICO BÜROO OÜ 11,544 129 98.6 133 1,846 75 59.5 112 48.4 34 29,923 29 2,272 52 9 158 28.9%<br />
97 KENTEK EESTI OÜ* 19,647 100 103.7 116 919 100 87.5 88 14.6 107 26,944 41 1,965 64 131 120 28.5%<br />
98 NOW! INNOVATIONS OÜ 8,047 142 443.7 5 183 140 54.2 119 30.8 70 12,875 149 1,006 110 173 28.4%<br />
99 EUREX CAPITAL OÜ* 28,822 72 98.6 132 4,038 34 33.6 134 14.4 109 19,901 87 721 142 2,381 28 28.2%<br />
100 DENEESTI OÜ* 43,007 46 134.9 38 495 118 65.9 106 19.8 97 11,436 155 2,530 46 1,161 51 28.1%<br />
101 ADM INTERACTIVE OÜ 17,830 107 101.0 123 410 127 16.5 151 13.8 115 35,249 15 615 149 181 27.6%<br />
102 UNIPLAST OÜ 42,274 47 93.4 143 1,510 84 87.1 90 9.2 131 13,176 146 939 117 455 78 27.3%<br />
103 ORGITA PÕLD OÜ 25,056 82 108.8 97 3,994 35 53.9 120 13.0 120 15,371 129 835 126 9,114 12 27.3%<br />
104 AURE OÜ* 9,746 135 93.9 140 2,475 62 187.6 26 40.8 46 16,929 115 1,949 65 36 145 27.1%<br />
105 KRAPESK AS 39,072 57 109.0 95 482 120 2.1 166 1.2 159 22,053 68 814 131 1,437 44 26.9%<br />
106 IN NOMINE OÜ 4,400 163 183.3 17 219 137 100 70 67.8 15 24,361 52 880 121 175 26.6%<br />
107 GEVATEX OÜ 12,367 123 155.1 23 1,332 86 213.2 23 85.8 12 10,229 164 275 180 272 101 26.2%<br />
108 LUKU SERVICE OÜ 17,474 109 67.0 180 995 98 35.1 133 34.4 59 26,881 42 1,942 67 167 26.0%<br />
109 KOOPIA NIINI & RAUAM OÜ 16,304 111 121.2 64 2,807 54 120.3 49 38.9 53 13,793 142 543 159 1,682 39 25.5%<br />
110 ÖSEL CONSULTING OÜ 3,469 170 117.5 75 1,072 95 129.1 45 60.8 21 22,672 64 771 139 27 149 25.2%<br />
111 IDEAB PROJECT EESTI AS 20,385 99 120.2 66 1,516 83 129.6 44 26.9 79 11,667 152 1,853 73 13 157 25.2%<br />
112 TIPTIPTAP OÜ 24,275 85 123.7 59 1,070 96 38.8 130 31.1 67 18,241 107 1,055 106 245 107 25.1%<br />
113 AD REM TÕLKEBÜROO OÜ 4,636 162 99.2 129 73 157 127.9 46 10.5 128 28,891 32 773 138 179 25.1%<br />
114 ENGLO OÜ 4,912 161 119.0 70 1,244 88 168.9 29 43.4 39 18,703 100 819 129 177 24.9%<br />
115 KRAVER AS 13,335 120 141.2 32 1,130 92 100 67 97.7 7 13,448 144 833 128 2,352 29 24.9%<br />
116 AQRIS SOFTWARE AS 16,000 113 78.5 171 -789 182 -5.1 169 35,860 13 571 156 1,161 50 24.8%<br />
117 HAMMER SERVICE OÜ 6,611 152 103.5 117 891 101 135.4 43 43.3 40 20,288 83 1,469 84 368 87 24.7%<br />
118 NURME TURVAS AS 12,160 127 149.0 27 2,079 70 124.6 48 22.7 88 13,859 140 553 158 3,207 22 24.6%<br />
119 KRISLING AS 26,310 79 93.7 142 456 123 19.3 145 9.1 134 22,410 66 797 133 108 122 24.4%<br />
120 RUUT DISAIN OÜ* 11,402 132 111.5 87 573 114 154.5 36 58.3 23 15,193 131 600 150 622 69 23.9%<br />
121 NORDIUM OÜ* 2,680 177 119.4 69 482 119 115.1 54 39.8 51 18,362 106 2,680 41 2 164 23.6%<br />
122 CARAMEL MODA OÜ 11,469 130 135.2 37 1,582 81 155.0 35 17.8 102 11,503 154 882 120 174 23.4%<br />
123 PEETRI PUIT OÜ 30,611 67 90.1 150 1,758 78 28.5 139 7.9 139 13,111 147 957 114 641 67 23.3%<br />
124 OSAÜHING GEOMETRIA 8,814 140 119.4 68 576 113 197.1 25 9.9 130 14,780 134 383 173 269 103 23.2%<br />
125 TIMMERMANN AS 9,395 139 126.6 55 2,877 52 115.6 53 48.8 33 10,737 163 626 147 970 55 23.2%<br />
126 OSAÜHING EVENTUS EA 12,095 128 114.9 78 31 162 7.0 157 2.8 152 28,044 37 465 167 57 141 22.9%<br />
127 EVO DESIGN OÜ 19,046 103 175.3 18 165 144 100 72 12.9 121 11,036 160 595 152 1,809 38 22.9%<br />
128 VOKA MASIN AS 22,904 91 114.1 79 680 110 56.9 116 21.0 95 15,167 132 587 153 514 75 22.9%<br />
129 EMI EWT IDA-LÄÄNE KOOLITUSE AS 5,701 154 91.0 148 148 146 29.4 138 13.1 118 28,366 34 1,425 88 73 132 22.8%<br />
130 TERASVARA OÜ 12,966 121 105.1 111 477 121 55.8 118 8.2 136 21,889 70 648 145 410 81 22.6%<br />
www.konkurents.ee<br />
1 EUR = 15.6466 EEK; 1 EEK = 0.0639 EUR; based on 2008 data<br />
45
Small and Medium-sized Enterprises<br />
Place<br />
Sales Change Net profit Change Return Labour costs Efficiency per Investments %<br />
Enterprise in sales in net profit on equity per employee employee of the first<br />
*group<br />
th. EEK place % place th. EEK place % place % place EEK/month place th. EEK place th. EEK place (0...100)<br />
131 KINDLUSTUSEST KINDLUSTUSMAAKLER OÜ 15,384 117 108.9 96 532 115 30.0 137 19.2 99 21,542 72 440 170 99 125 22.5%<br />
132 SAMESTI METALL OÜ 3,280 173 122.1 63 45 160 88.4 87 9.1 133 24,156 53 656 144 44 143 22.4%<br />
133 GVANDRON OÜ 2,228 179 144.0 30 525 116 154.0 37 64.6 17 13,370 145 557 157 1,316 46 22.3%<br />
134 FINANCE MANAGEMENT OÜ 3,483 169 133.8 39 227 136 100 69 55.1 25 19,142 94 435 171 272 102 22.3%<br />
135 EMAJÕE ÄRIKESKUS AS 15,904 114 86.6 156 5,209 24 53.0 122 3.1 149 6,107 177 2,272 53 386 85 22.3%<br />
136 PAG AS 28,607 74 39.5 186 -459 179 -4.9 168 16,879 116 4,087 27 460 77 22.3%<br />
137 V.V.TRAVEL AGENCY OÜ 9,608 137 106.0 106 447 125 167.0 31 43.1 42 3,503 184 4,804 19 161 22.2%<br />
138 SIRKEL & MALL OÜ 14,245 119 127.3 53 457 122 39.0 129 22.1 91 19,140 95 396 172 662 66 22.1%<br />
139 BEAM BALTIC OÜ* 2,959 176 110.8 89 321 131 77.7 100 52.6 29 16,720 119 2,959 38 163 22.1%<br />
140 AP TRADING AS 12,259 124 113.5 80 -145 173 -7.4 171 22,978 60 2,043 61 166 21.7%<br />
141 ASPER BIOTECH AS 17,725 108 112.2 84 95 154 13.8 154 1.0 160 20,432 80 443 168 624 68 21.4%<br />
142 EKSAMO AS 17,202 110 87.2 154 113 151 100 73 11.0 125 14,317 138 491 164 3,507 20 21.2%<br />
143 LASERSTUUDIO OÜ 5,070 159 108.1 99 -54 169 -11.9 174 28,304 35 845 125 883 56 21.1%<br />
144 MEGARAM OÜ 2,969 175 129.7 48 38 161 100 75 63.8 19 16,748 118 371 174 184 21.1%<br />
145 ESTNOR OÜ 22,088 93 91.4 147 4 166 4.2 163 0.1 164 18,955 97 818 130 178 21.0%<br />
146 MAVAM OÜ 2,501 178 101.1 122 356 130 86.1 91 21.7 92 20,427 81 834 127 176 20.8%<br />
147 Ü&A AS 19,206 102 79.6 169 -319 175 -3.3 167 18,680 101 2,134 57 534 74 20.6%<br />
148 SUJA EHITUS OÜ 33,569 64 94.9 137 -1,818 184 -43.8 180 17,299 112 1,119 101 2,209 33 20.5%<br />
149 MEENED OÜ* 3,437 171 126.7 54 398 128 223.9 21 27.4 78 7,900 172 181 184 186 20.5%<br />
150 <strong>TOP</strong> GRAPHIC OÜ 7,591 148 79.5 170 287 132 37.4 131 3.8 147 21,683 71 1,084 104 172 20.1%<br />
151 AMC AMARIS AS 2,071 180 135.8 34 874 103 138.4 42 25.2 84 11,394 156 518 161 182 20.1%<br />
152 KEMEHH OÜ 5,455 156 103.4 118 1,098 94 119.0 50 29.6 72 10,835 162 364 175 1,023 54 19.4%<br />
153 TRACKING CENTER OÜ 7,590 149 293.9 7 522 117 100 68 7,687 173 632 146 2,209 34 19.1%<br />
154 SWEDEST MOTEL GROUP AS 15,451 116 100.3 124 140 147 81.9 95 0.7 161 11,114 159 483 165 422 79 18.9%<br />
155 ELEKTRIMEES OÜ 15,196 118 67.8 179 96 153 4.3 161 2.8 151 17,611 111 1,169 98 171 18.8%<br />
156 VELMA MÖÖBEL OÜ 12,883 122 115.6 77 177 142 21.1 144 8.1 138 13,813 141 716 143 830 58 18.6%<br />
157 SILVA-AGRO AS 27,042 78 104.5 113 9 165 4.3 162 0.2 163 8,394 170 901 119 388 84 18.5%<br />
158 REALISTER OÜ* 9,470 138 135.6 36 -415 178 -42.6 179 19,371 92 947 115 338 91 18.4%<br />
159 TVS PARTNERID AS 20,471 97 83.8 161 -555 180 -33.8 178 16,401 121 1,077 105 63 136 18.3%<br />
160 A.KANGUST & PARTNERID OÜ 4,019 166 112.7 83 234 135 19.1 146 21.4 93 17,720 110 502 162 344 89 18.2%<br />
161 SUN TIMBER OÜ 12,186 125 90.1 151 1,290 87 109.3 59 41.4 44 4,518 182 358 176 290 98 18.1%<br />
162 MAASIKAS & KO OÜ 19,319 101 111.2 88 250 133 32.1 135 7.4 141 7,654 174 878 122 1,192 48 18.0%<br />
163 HAUGER OÜ 5,454 157 146.3 28 138 148 85.8 93 43.2 41 5,995 179 1,364 91 170 18.0%<br />
164 LRF PRIVATE OÜ 9,726 136 78.1 172 70 158 6.2 159 2.0 156 15,959 125 1,945 66 22 151 17.9%<br />
165 DEMJANOV AS 21,758 95 94.7 138 -572 181 -10.3 172 13,476 143 473 166 197 115 17.8%<br />
166 LEKU METALL AS 8,085 141 83.8 162 209 139 48.5 125 6.3 143 14,404 136 622 148 180 116 17.5%<br />
167 ET TOREL OÜ* 16,212 112 73.3 177 160 145 3.6 164 1.9 157 14,361 137 600 151 223 109 17.5%<br />
168 B.I.A. OÜ 3,045 174 205.1 14 211 138 100 71 14,164 139 338 177 249 105 17.3%<br />
169 LÄÄNE AGROVARU OÜ 4,354 165 99.6 127 -73 170 -7.3 170 17,897 109 1,451 86 22 152 17.3%<br />
170 MR STUUDIO OÜ 11,408 131 99.7 126 -348 176 -10.6 173 16,223 122 519 160 2,335 30 17.2%<br />
171 BORTER TRADE OÜ 7,987 144 113.0 81 4 167 1.5 168 2.9 150 14,508 135 1,141 99 141 119 17.2%<br />
172 PLASTSYS OÜ 10,333 134 97.9 135 -297 174 -147.0 183 24,667 48 939 116 120 121 17.0%<br />
173 AUGLI METALL OÜ 7,364 150 132.8 41 114 150 18.7 148 16.8 103 11,190 158 736 141 721 61 17.0%<br />
174 ITVILLA OÜ 320 186 193.2 15 26 164 100 76 53.6 26 3,575 183 320 178 185 17.0%<br />
175 REWOOL OÜ 3,847 168 142.2 31 55 159 100 74 4.7 145 8,385 171 214 183 200 112 16.9%<br />
176 EDELSTEIN OÜ 3,418 172 77.7 173 107 152 14.9 153 7.1 142 17,119 113 854 124 108 124 16.5%<br />
177 JÕGEVA VESI OÜ* 5,756 153 129.2 50 90 155 27.2 140 8.2 137 10,953 161 303 179 73 133 16.0%<br />
178 HOLZ PROF OÜ 1,495 183 117.6 74 -97 171 -25.3 176 18,230 108 498 163 183 16.0%<br />
179 ANDEVIS AS* 7,946 145 74.5 176 128 149 21.3 143 2.5 155 11,939 151 441 169 1,169 49 15.2%<br />
180 PRO FIKSUM OÜ 7,900 146 85.9 158 172 143 6.7 158 4.4 146 5,206 181 2,633 42 273 100 14.4%<br />
181 PINUS ABJA OÜ 8,030 143 75.6 175 30 163 8.7 156 0.6 162 6,012 178 268 181 572 70 12.3%<br />
182 PERFETTO STUUDIO OÜ 7,356 151 64.4 182 -879 183 -24.7 175 9,498 167 1,051 107 58 139 12.1%<br />
183 ABSINT OÜ* 15,633 115 43.0 185 -4,202 186 -56.1 182 16,097 123 869 123 3,000 23 12.0%<br />
184 NUTITEQ OÜ 954 185 105.4 110 -107 172 -28.2 177 9,407 168 238 182 691 62 11.9%<br />
185 SALESFORCE OÜ 1,754 181 94.0 139 4 168 3.1 165 2.7 153 5,563 180 92 186 6 159 11.0%<br />
186 MODESAT COMMUNICATIONS OÜ 1,360 184 54.0 183 -2,412 185 -53.8 181 12,879 148 113 185 2,249 32 9.1%<br />
www.konkurents.ee<br />
1 EUR = 15.6466 EEK; 1 EEK = 0.0639 EUR; based on 2008 data<br />
46
BLRT GRUPP AS<br />
The Most Competitive<br />
Industrial and Energy<br />
Enterprise<br />
2009<br />
Photo: Toomas Tuul<br />
FJODOR BERMAN<br />
BLRT – surviving and building<br />
during hard times<br />
In case of some company it might<br />
seem that nothing changes, everything<br />
is in place and sure. Though, at<br />
the closer inspection and as a result<br />
of discussions the facts can become<br />
clear that everything is not as it<br />
seems. For the larger companies the<br />
changes and the keeping pace with<br />
time are the bases for success, but<br />
also a big challenge. This also applies<br />
to BLRT. The ship repair yard at<br />
the edge of Kopli in Tallinn stands<br />
firmly, Klaipeda plant works actively<br />
and Turku Repair Yard in Finland<br />
also stays firmly. Fjodor Berman, the<br />
chairman of the management board<br />
of the company, still talks about big<br />
changes and about that one has to<br />
keep updated to compete with the<br />
European top players. The state has<br />
to provide its contribution to be successful.<br />
BLRT GRUPP AS 2008:<br />
Sales (th EEK) 5,990,127<br />
Change in sales 129.7 %<br />
Net profit (th EEK) 762,070<br />
Change in net profit 150.2 %<br />
Number of employees 3,247<br />
Investments (th EEK) 487,433<br />
Return on equity 23.7 %<br />
47
The year 2008 was the best year of history for<br />
BLRT. The company has been able to preserve<br />
good tradition to move each year towards increasingly<br />
high economic indicators. Still at the<br />
end of 2008 the first sure signs of the fall in the<br />
world’s ship construction market could be detected<br />
and therefore the major fall of the current<br />
year was not a surprise for Fjodor Berman.<br />
Then it was clearly seen that several clients and<br />
contracts remain without financing. The surprise<br />
or not, the general situation in ship construction<br />
is quite poor at the world market.<br />
Especially high quality and flexibility is required<br />
from the company. According to Berman he<br />
can’t remember as hard time as now.<br />
“The situation in economy is really bad. Currently<br />
one could say that now this is the time of<br />
stabilization, but there are no signs of the improvement,<br />
let alone the new rise. At the beginning<br />
of the year there was abrupt fall, 30% of the<br />
fleet of many countries are also now unused, as<br />
there is nothing to transport. If there are no<br />
goods and the ships are so to say put aside, we<br />
have also nothing to repair. The banks relate to<br />
the ship construction projects extremely repellingly<br />
– no ship construction contract was<br />
concluded in May in the world, I do not remember<br />
this kind of situation.”<br />
Regardless of the current market situation no<br />
one has put the tools aside in BLRT. Vice versa<br />
– BLRT continues construction. The very important<br />
moment by the activities is also that<br />
BLRT is not focused only on ship construction<br />
and the sustainability is guaranteed by different<br />
market niches where one has settled down. At<br />
the beginning of the year the market of purchase<br />
of scrap metal decreased and as the<br />
company sells in the Baltic countries quite a lot,<br />
the sale of BLRT dropped by half. According to<br />
Berman the situation would be very sad, if the<br />
company would operate only in one field of activity.<br />
Luckily this is not the situation.<br />
“We have contracts concluded for long term and<br />
we get the orders also now, we try to operate<br />
strongly in the niches – we construct the ferries,<br />
special vessels for the projects of sea wind<br />
parks. For example the sea wind park is under<br />
construction at the open sea, 80 kilometres<br />
from the coast of Germany. We are connected<br />
with this project for several reasons. The special<br />
ship with the value of 1.5 billion kroons for<br />
the construction of wind park, floating transformer<br />
platform and 70 tripod foundations of<br />
seamills have been completed. The market demand<br />
in this part increases almost everywhere,<br />
even in Estonia. The negotiations are currently<br />
held also for the construction of the new similar<br />
products for Norway,” Berman states by<br />
adding that the renewable energy is one strategically<br />
important trends of BLRT Group to be<br />
developed.<br />
THE FLOW OF LABOUR HAS IMPROVED<br />
A couple of years ago, when economy was still<br />
on the rise the companies found it hard to have<br />
access to skilled labour. BLRT suffered quite<br />
much due to the lack of labour and then the decision<br />
to purchase subcontracting from the Chinese<br />
companies to Klaipeda plant was born.<br />
The hiring of foreign labour has been profitable<br />
– the Chinese are very decent and there are<br />
practically no problems with them. The Chinese<br />
are not cheap labour, as they have worked in<br />
USA and Europe and they are internally higher<br />
disciplined than the people coming from the European<br />
Union with the same qualification.<br />
Since September this year the Chinese companies<br />
are also in Tallinn plant of BLRT by subcontracting,<br />
as regardless of the improvement<br />
of the labour market there are still not enough<br />
specialists of adequate qualification and experience<br />
who would be able to participate in the international<br />
infraprojects. Thus BLRT has<br />
cooperation with the Chinese in the projects of<br />
ship repair, renewable energy and stainless<br />
steel processing.<br />
“The government and parliament has made the<br />
steps for accelerating the process of importing<br />
the term foreign labour from the third countries.<br />
This is the policy of many countries – Germany,<br />
Poland, Sweden. Another question is that life<br />
changes – yesterday we had also higher salary<br />
level in Estonia, today the salary level has fallen,<br />
but according to law we should keep the average<br />
salary level of the last year by paying salary<br />
to the foreign labour – this is absurd. World has<br />
changed, but we are inflexible, we still live as<br />
before. This though means that we lose so competitiveness,“<br />
Berman is worried.<br />
The company’s manager is pleased that the situation<br />
has still generally improved. These professionals<br />
who went to work aboard once are<br />
employed in Marketex belonging to BLRT<br />
Grupp. Now these approximately 40 persons are<br />
back and their work is satisfactory. “These are<br />
the specialists at high level who are satisfied<br />
both with the attitude of BLRT and the salary<br />
level,“ Berman says.<br />
THE ORDERS FROM THE FOREIGN<br />
COUNTRIES BRING SUCCESS<br />
When Europe encountered economic recession,<br />
most of the governments started to take steps<br />
by supporting the purposeful investment to the<br />
infrastructure objects and export. BLRT has got<br />
quite major projects for itself – for example,<br />
currently the order for the construction of the<br />
metro tunnel to Stockholm is being fulfilled,<br />
1000 tons of ready products have already been<br />
sent there and soon the same quantity will follow.<br />
In Denmark BLRT won the national competition<br />
of bridge construction – for that<br />
purpose the metal parts of the bridge will be<br />
made. According to Berman the key question of<br />
the whole Estonia is how to improve the capability<br />
and competitiveness of the companies.<br />
“We adjust the state budget for already third<br />
time, as not enough cash is collected, but I say<br />
that by increasing just the taxes and excises this<br />
would be received even less. The question lies in<br />
raising the competitiveness!“<br />
Due to the market situation BLRT will not plan to<br />
expand this year, it will rather focus on keeping<br />
stability, competitiveness and effectiveness. •<br />
Photo: BLRT<br />
48
Industrial and Energy Enterprises<br />
Place<br />
Sales Change Net profit Change Return Labour costs Efficiency per Investments %<br />
Enterprise in sales in net profit on equity per employee employee of the first<br />
*group<br />
th. EEK place % place th. EEK place % place % place EEK/month place th. EEK place th. EEK place (0...100)<br />
1 BLRT GRUPP AS* 5,990,127 1 129.7 24 762,070 1 150.2 28 23.7 48 23,222 32 1,845 36 487,433 3 100.0%<br />
2 VKG OIL AS* 1,492,343 3 102.1 75 573,136 2 174.0 19 37.6 24 18,130 69 2,471 22 994,186 1 86.8%<br />
3 ROMEC METALL OÜ 18,656 89 210.0 3 2,621 69 771.0 1 124.6 1 22,981 34 1,333 53 571 77 73.8%<br />
4 HENKEL MAKROFLEX AS* 946,619 8 105.4 67 130,681 5 124.0 38 28.2 36 31,025 10 11,007 1 5,734 38 69.2%<br />
5 ABB AS* 2,570,000 2 151.2 10 147,000 3 165.2 24 34.0 26 27,518 19 2,404 23 260,000 4 67.2%<br />
6 FILTER AS* 605,212 12 169.7 6 80,260 8 273.3 6 68.6 5 37,291 8 3,759 11 9,308 27 66.7%<br />
7 OÜ ADEPTE* 21,891 87 286.1 2 14,745 32 91.9 64 31.0 32 45,742 2 2,189 25 32,558 14 63.8%<br />
8 DEMIDOV INDUSTRIES AS 352,166 19 137.1 17 43,014 18 383.5 3 56.9 10 27,501 20 5,503 2 5,455 40 63.4%<br />
9 FORTUM TARTU AS* 237,649 27 122.4 33 40,005 21 246.4 8 15.5 71 24,309 26 2,502 19 737,182 2 63.3%<br />
10 HEKOTEK AS* 425,945 15 129.6 25 36,518 24 156.1 26 63.6 7 42,925 3 4,217 9 4,002 46 60.5%<br />
11 NYCOMED SEFA AS 342,371 20 107.0 62 59,890 10 216.0 14 23.9 46 37,704 7 4,280 7 3,227 52 55.0%<br />
12 REMEI BALTICA OÜ 22,885 86 98.3 83 2,864 67 68.4 74 31.2 30 56,704 1 3,814 10 29 102 54.9%<br />
13 FIXTEC AS 8,303 102 106.4 65 521 92 291.9 5 42.6 18 39,432 5 2,768 16 104 53.1%<br />
14 ECOMETAL AS 271,661 22 85.3 102 71,328 9 58.2 81 82.0 4 21,707 46 5,126 5 35,103 12 48.6%<br />
15 NORDCESTER ENGINEERING AS* 63,749 58 104.3 69 451 95 15.1 103 7.7 94 40,211 4 5,312 3 17,835 17 47.7%<br />
16 GALVI-LINDA AS 46,154 66 160.6 8 9,867 38 474.3 2 64.5 6 11,093 100 375 102 2,080 63 47.3%<br />
17 KRIMELTE OÜ* 1,013,447 6 116.5 39 50,051 14 87.8 66 20.1 58 19,460 59 4,223 8 88,766 6 47.2%<br />
18 TERG OÜ 61,687 60 108.1 58 1,695 81 116.5 44 13.3 77 30,575 11 5,141 4 43 101 46.5%<br />
19 TERASMAN OÜ 113,742 43 170.9 5 3,789 63 218.9 13 23.8 47 28,608 15 1,149 62 5,147 42 46.5%<br />
20 PALMSE MEHAANIKAKODA OÜ 153,041 34 94.5 87 17,673 30 75.6 73 45.1 12 29,247 13 4,783 6 2,328 61 46.4%<br />
21 TARFURGO OÜ 43,877 68 150.4 11 2,675 68 247.6 7 50.5 11 21,201 49 1,994 31 96 97 46.1%<br />
22 E-ARSENAL AS 36,089 76 161.5 7 3,026 66 100 55 39.9 22 22,274 42 3,609 12 103 45.5%<br />
23 E-PROFIIL AS 181,128 30 112.7 46 8,849 42 172.0 21 62.4 9 29,791 12 1,132 63 8,571 29 44.6%<br />
24 NORMA AS* 1,382,140 4 109.4 54 137,218 4 129.5 34 14.6 74 18,947 62 1,426 50 50,896 9 44.3%<br />
25 K.M.T. MAJATEHAS OÜ 38,633 74 132.6 21 4,083 61 243.2 9 26.7 39 27,469 21 1,431 49 670 75 44.0%<br />
26 SAINT-GOBAIN SEKURIT EESTI AS 399,574 17 132.8 19 48,832 17 163.2 25 25.7 42 23,196 33 1,686 43 24,862 15 43.4%<br />
27 FAABULA AS 35,640 78 131.1 22 1,781 79 230.2 10 40.6 21 18,460 65 2,228 24 2,719 58 42.2%<br />
28 MAKRON ESTONIA OÜ 83,395 53 129.9 23 7,160 46 104.8 51 33.9 27 27,952 18 2,085 29 350 84 41.9%<br />
29 HARJU ELEKTER AS* 871,610 9 119.1 34 42,061 19 48.9 89 8.7 89 28,636 14 1,740 42 37,209 11 41.8%<br />
30 MAXIT ESTONIA AS 369,659 18 52.9 111 48,866 16 26.0 97 3.7 101 37,917 6 3,271 13 57,497 7 41.5%<br />
31 VILJANDI METLL AS* 454,444 14 129.3 26 49,395 15 117.6 43 28.1 37 20,957 51 1,551 47 14,164 20 40.5%<br />
32 ESTANC AS* 84,865 51 146.2 13 6,539 48 115.0 45 43.7 16 19,368 60 1,886 33 3,704 49 40.1%<br />
33 Q-HAUS BALTIC OÜ 62,644 59 342.4 1 6,243 50 100 54 15,984 73 2,983 15 377 83 39.8%<br />
34 ESTKO AS* 72,880 55 122.9 32 6,856 47 181.1 18 21.1 55 23,926 28 1,584 45 3,700 50 39.6%<br />
35 GLAMOX HE AS 270,637 23 102.0 76 37,124 23 99.6 61 31.8 29 22,343 40 2,483 21 13,177 22 39.5%<br />
36 PRINTALL AS 422,997 16 109.6 53 50,187 13 118.1 42 21.9 52 21,803 45 2,005 30 6,628 32 39.4%<br />
37 GEVATEX OÜ 12,367 96 155.1 9 1,332 86 213.2 15 85.8 3 10,229 103 275 105 272 88 39.3%<br />
38 INTERNATIONAL ALUMINIUM CASTING TARTU AS 69,657 56 124.8 29 7,831 44 144.9 29 28.4 34 22,778 35 1,583 46 9,961 25 38.9%<br />
39 KRAVER AS 13,335 93 141.2 15 1,130 89 100 56 97.7 2 13,448 87 833 83 2,352 60 38.4%<br />
40 REHVIMEISTER AS 39,094 73 83.9 103 2,108 75 53.7 86 8.6 90 35,104 9 2,606 18 105 38.3%<br />
41 RAUAMEISTER AS* 108,374 44 115.6 41 19,644 27 120.5 39 44.1 13 21,419 48 1,246 60 6,018 37 37.8%<br />
42 AKTSIASELTS VABA MAA 36,000 77 117.9 36 2,010 77 212.8 16 9.5 83 23,921 29 947 73 4,837 43 37.5%<br />
43 AEROC AS 249,660 24 123.2 31 22,685 26 59.0 78 15.3 72 22,473 38 2,171 27 7,927 30 37.2%<br />
44 CHEMI-PHARM AS* 39,924 72 129.3 27 5,400 56 126.8 36 33.5 28 19,897 55 1,248 59 2,791 57 36.7%<br />
45 WENDRE AS* 1,017,834 5 103.5 71 86,489 7 99.5 62 21.3 53 13,559 86 1,389 52 9,356 26 36.7%<br />
46 PROFLINE AS* 28,259 82 111.9 49 1,354 85 63.8 75 21.1 54 24,882 23 2,174 26 59 99 36.3%<br />
47 ENGLO OÜ 4,912 108 119.0 35 1,244 88 168.9 22 43.4 17 18,703 64 819 84 108 36.2%<br />
48 EESTI TURBATOOTED AS 43,371 69 107.6 61 5,339 57 109.5 47 39.6 23 19,854 57 1,807 38 2,141 62 36.1%<br />
49 AESTON OÜ 48,686 64 106.7 63 2,150 74 22.0 98 13.9 75 24,599 25 3,043 14 173 93 35.8%<br />
50 RESPO HAAGISED AS 143,161 37 92.6 92 16,151 31 83.4 68 40.8 20 21,108 50 1,884 34 499 79 35.6%<br />
51 TRETIMBER OÜ* 97,096 45 99.4 81 9,674 40 105.2 50 26.3 40 18,742 63 2,490 20 6,100 35 35.6%<br />
52 PALKTARE OÜ 53,249 62 109.0 56 1,777 80 172.9 20 12.3 79 21,513 47 1,238 61 2,561 59 35.2%<br />
53 NEFAB EESTI AS 166,182 32 100.0 80 8,870 41 131.3 33 15.8 70 23,241 31 1,319 54 6,355 33 35.2%<br />
54 INLOOK COLOR OÜ 30,883 81 104.2 70 3,410 64 109.5 48 11.0 82 26,430 22 1,287 57 170 94 35.0%<br />
55 PROMENS AS 202,904 28 112.5 47 25,031 25 118.9 41 29.7 33 17,343 71 1,268 58 6,087 36 34.9%<br />
56 JELD-WEN EESTI AS 648,718 11 102.3 73 53,685 11 140.5 31 25.2 43 13,580 85 907 78 22,333 16 34.9%<br />
www.konkurents.ee<br />
1 EUR = 15.6466 EEK; 1 EEK = 0.0639 EUR; based on 2008 data<br />
49
Industrial and Energy Enterprises<br />
Place<br />
Sales Change Net profit Change Return Labour costs Efficiency per Investments %<br />
Enterprise in sales in net profit on equity per employee employee of the first<br />
*group<br />
th. EEK place % place th. EEK place % place % place EEK/month place th. EEK place th. EEK place (0...100)<br />
57 METOS AS 157,306 33 100.2 79 13,263 33 94.5 63 28.4 35 19,865 56 1,808 37 673 74 34.7%<br />
58 ROOTSI MÖÖBEL AS 92,979 47 110.7 51 10,204 37 81.0 71 19.7 60 19,053 61 2,113 28 1,639 67 34.3%<br />
59 VÄO PAAS OÜ* 84,213 52 80.5 106 10,640 36 62.0 77 19.6 61 28,424 16 1,477 48 10,965 24 34.3%<br />
60 SVARMIL AS 93,623 46 103.1 72 2,262 73 333.9 4 11.8 80 12,943 92 426 101 2,830 56 34.2%<br />
61 UPM-KYMMENE OTEPÄÄ AS 244,986 26 79.9 108 41,763 20 46.4 91 17.0 67 19,487 58 1,591 44 110,693 5 33.7%<br />
62 FEIN-ELAST ESTONIA OÜ 74,193 54 100.3 78 9,696 39 120.5 40 18.4 63 20,052 54 1,405 51 6,240 34 33.5%<br />
63 PAEKIVITOODETE TEHASE OÜ 129,205 39 91.9 95 19,019 28 82.3 70 22.5 50 22,320 41 916 77 37,655 10 33.2%<br />
64 AS SUWEM 45,181 67 106.7 64 5,177 58 166.0 23 34.3 25 15,247 75 922 76 314 85 33.2%<br />
65 WELLSPA OÜ* 56,065 61 87.0 100 11,857 34 88.4 65 44.0 14 16,673 72 1,933 32 476 80 33.1%<br />
66 NUIA PMT AS 69,076 57 107.9 60 6,238 51 80.5 72 20.0 59 22,583 36 959 71 5,291 41 33.0%<br />
67 WIGEN SINDI OÜ 11,526 99 109.0 57 1,381 84 221.1 12 43.8 15 12,525 94 226 108 79 98 32.9%<br />
68 ESRO AS* 87,249 50 109.1 55 2,530 71 31.3 95 3.3 102 21,955 43 1,781 39 55,591 8 32.8%<br />
69 NURME TURVAS AS 12,160 98 149.0 12 2,079 76 124.6 37 22.7 49 13,859 82 553 96 3,207 53 32.7%<br />
70 CIPAX EESTI AS 87,574 49 116.3 40 3,217 65 27.9 96 5.4 98 20,946 52 1,751 41 34,614 13 32.4%<br />
71 MERINVEST OÜ 152,468 35 112.1 48 5,578 55 143.6 30 24.9 44 15,808 74 649 89 2,926 55 32.2%<br />
72 CLYDE BERGEMANN EESTI AS 88,842 48 101.3 77 203 99 100 57 6.3 96 23,954 27 846 80 1,860 64 32.0%<br />
73 EVO DESIGN OÜ 19,046 88 175.3 4 165 102 100 58 12.9 78 11,036 101 595 92 1,809 65 32.0%<br />
74 TIPTIPTAP OÜ 24,275 84 123.7 30 1,070 90 38.8 92 31.1 31 18,241 66 1,055 64 245 90 31.7%<br />
75 CARAMEL MODA OÜ 11,469 100 135.2 18 1,582 82 155.0 27 17.8 65 11,503 96 882 79 106 31.6%<br />
76 INTERCONNECT PRODUCT ASSEMBLY AS 128,385 40 138.4 16 8,551 43 100 53 24.2 45 12,785 93 669 88 777 72 31.5%<br />
77 ENERPOINT SAARE OÜ 151,989 36 110.9 50 5,985 52 134.2 32 21.9 51 13,956 81 993 67 939 68 31.4%<br />
78 DALE LD AS 50,104 63 93.7 89 4,987 59 58.5 79 18.1 64 22,489 37 1,023 66 17,044 18 31.2%<br />
79 TECHNOMAR & ADREM AS 501,005 13 87.2 97 129,002 6 82.8 69 17.5 66 10,778 102 842 82 107 30.9%<br />
80 MEENED OÜ* 3,437 110 126.7 28 398 97 223.9 11 27.4 38 7,900 107 181 111 111 30.6%<br />
81 TARKON AS 691,441 10 99.0 82 17,732 29 51.7 87 15.0 73 13,398 88 1,297 55 4,600 44 30.2%<br />
82 KALTSIIT AS 40,927 71 82.3 105 7,308 45 58.3 80 16.3 69 23,537 30 974 70 4,081 45 30.2%<br />
83 LASERSTUUDIO OÜ 5,070 107 108.1 59 -54 108 -11.9 106 28,304 17 845 81 883 70 29.7%<br />
84 TERASVARA OÜ 12,966 94 105.1 68 477 93 55.8 84 8.2 91 21,889 44 648 90 410 82 29.4%<br />
85 STRUCTO INDUSTRY OÜ 30,911 80 102.3 74 400 96 18.2 102 9.3 85 20,725 53 1,288 56 261 89 29.0%<br />
86 ESTIKO-PLASTAR AS 280,931 21 95.8 85 1,923 78 12.7 104 2.6 103 18,224 68 1,778 40 7,098 31 28.8%<br />
87 MS BALTI TRAFO OÜ 48,165 65 116.9 38 5,948 53 128.1 35 18.6 62 12,200 95 288 104 8,662 28 28.8%<br />
88 ESFIL TEHNO AS 15,260 92 114.0 44 3,985 62 112.2 46 63.0 8 6,367 108 203 110 44 100 28.7%<br />
89 VOKA MASIN AS 22,904 85 114.1 43 680 91 56.9 82 21.0 56 15,167 76 587 93 514 78 28.1%<br />
90 KRISLING AS 26,310 83 93.7 90 456 94 19.3 100 9.1 87 22,410 39 797 85 108 96 27.9%<br />
91 RAPALA EESTI AS* 136,883 38 94.5 88 51,689 12 101.0 52 26.1 41 10,001 104 563 94 920 69 27.9%<br />
92 M JA P NURST AS 120,837 42 106.3 66 4,575 60 56.3 83 13.4 76 13,827 83 982 69 5,700 39 27.6%<br />
93 AUGLI METALL OÜ 7,364 106 132.8 20 114 103 18.7 101 16.8 68 11,190 99 736 86 721 73 26.4%<br />
94 STANDARD AS* 249,088 25 91.9 94 5,689 54 34.8 93 7.9 93 14,454 77 1,038 65 14,072 21 26.4%<br />
95 MISTRA-AUTEX AS 188,000 29 87.0 99 2,592 70 32.3 94 5.4 97 17,513 70 954 72 3,900 48 26.3%<br />
96 REWOOL OÜ 3,847 109 142.2 14 55 105 100 60 4.7 99 8,385 106 214 109 200 91 26.2%<br />
97 UNIPLAST OÜ 42,274 70 93.4 91 1,510 83 87.1 67 9.2 86 13,176 90 939 75 455 81 26.2%<br />
98 DELUX DOMOTEX OÜ 123,977 41 80.3 107 11,014 35 62.7 76 20.1 57 13,133 91 992 68 3,900 47 26.1%<br />
99 EKSAMO AS 17,202 91 87.2 98 113 104 100 59 11.0 81 14,317 79 491 98 3,507 51 25.7%<br />
100 VELMA MÖÖBEL OÜ 12,883 95 115.6 42 177 100 21.1 99 8.1 92 13,813 84 716 87 830 71 25.5%<br />
101 ENICS EESTI AS* 990,722 7 113.5 45 39,167 22 181.1 17 14,207 80 1,869 35 16,198 19 24.9%<br />
102 AUDES LLC OÜ 37,776 75 110.6 52 2,361 72 49.7 88 8.9 88 11,244 98 461 100 2,984 54 24.5%<br />
103 MIVAR AS* 180,338 31 94.6 86 6,499 49 53.8 85 9.4 84 11,267 97 562 95 11,150 23 24.5%<br />
104 SUN TIMBER OÜ 12,186 97 90.1 96 1,290 87 109.3 49 41.4 19 4,518 111 358 103 290 86 24.0%<br />
105 HOLZ PROF OÜ 1,495 111 117.6 37 -97 109 -25.3 108 18,230 67 498 97 109 23.7%<br />
106 LEKU METALL AS 8,085 103 83.8 104 209 98 48.5 90 6.3 95 14,404 78 622 91 180 92 23.5%<br />
107 PRO FIKSUM OÜ 7,900 105 85.9 101 172 101 6.7 106 4.4 100 5,206 110 2,633 17 273 87 22.5%<br />
108 ESTRE AS 34,210 79 92.1 93 -3,178 111 -19.5 107 13,201 89 475 99 1,667 66 19.7%<br />
109 RONI REM AS* 17,523 90 73.0 110 -48 107 -0.7 105 8,409 105 237 107 110 17.0%<br />
110 PINUS ABJA OÜ 8,030 104 75.6 109 30 106 8.7 105 0.6 104 6,012 109 268 106 572 76 16.3%<br />
111 PLASTSYS OÜ 10,333 101 97.9 84 -297 110 -147.0 109 24,667 24 939 74 120 95 15.1%<br />
www.konkurents.ee<br />
1 EUR = 15.6466 EEK; 1 EEK = 0.0639 EUR; based on 2008 data<br />
50
A. Le Coq AS<br />
The Most Competitive<br />
Food Industry Enterprise<br />
2009<br />
Photo: Toomas Tuul<br />
TARMO NOOP<br />
By surprising the consumers<br />
The team of A. Le Coq has proven<br />
that when the idea is good, then it is<br />
possible to win the market fast.<br />
Surely many are reminded here how<br />
this summer the market of drinks<br />
were in good sense overflood with<br />
Estonian own fermented kvass.<br />
Some things can be especially fast<br />
and wittily done: thus the drink producer<br />
decided not to do anything at<br />
first glance – the old beer “Alexander“<br />
with the trademark with traditions<br />
was taken and bottled into the<br />
can of a pint for a change. The company’s<br />
manager Tarmo Noop confirms<br />
that this beer has had<br />
phenomenal success in the recent<br />
times and it is fast rising brand,<br />
whereby without advertising costs.<br />
People need something special. It<br />
was the same when some years ago<br />
the folium cover was put back on the<br />
beer can – only this fact increased<br />
the sale of can beer by 60%. But the<br />
below interview is not only about the<br />
victories.<br />
A. LE COQ AS 2008:<br />
Sales (th EEK) 1,126,485<br />
Change in sales 97.4 %<br />
Net profit (th EEK) 186,371<br />
Change in net profit 110.9 %<br />
Number of employees 396<br />
Investments (th EEK) 52,594<br />
Return on equity 21.1 %<br />
51
How good was the year 2008 for A. Le Coq?<br />
The last year was not a good year for the beer<br />
producer, the beer market has had the falling<br />
trend since 2006. People purchase less, but at the<br />
same time the percentage of strong beers has not<br />
increased which is a good sign. Already 8 years<br />
ago the Estonian beer producers decided that<br />
strong beer is not advertised. The beer drinking of<br />
the Estonians is not like the beer drinking of Irish<br />
and English who go to the pub after work, take<br />
one or a couple of beers, chat a little bit and go<br />
home. The percentage of restaurant beer in England<br />
is 70% and upto 80% in Ireland. An Estonian<br />
is different and we drink beer on grilling evenings<br />
and this year it can be felt that less is grilled. Regardless<br />
of the latter beer is number one drink in<br />
Estonia as to the consumption.<br />
How has the competition changed –<br />
have there been any special changes?<br />
This year 3-4 months ago we were ahead of<br />
Saku Brewery by a percent or two and now we<br />
are slightly behind – there will be such game of<br />
Westmann and Piibeleht (the Estonian competing<br />
literary figures). When compared to the year<br />
1998 when we started, our market share today<br />
is at 40%, i.e. we have raised our market share<br />
by about 4 times. When considering the private<br />
beers, we have passed Saku beer already from<br />
the middle of the last year. The markets have<br />
still falling trend and this not very pleasing. I am<br />
also the member of the supervisory board of the<br />
pawn package and all producers declare their<br />
sales. Today it is seen that the sale of pawn<br />
units is upto 20% smaller than last year but this<br />
means surely the total market of drinks.<br />
There is nothing to do when tap water is drunk<br />
instead of bottled water, energy drinks and<br />
sports drinks are less purchased. I also cannot<br />
agree with that we had nice summer this year. It<br />
was 20-22 degrees above zero in some period,<br />
but did not exceed 25 degrees. This was an average<br />
Estonian summer which also influences<br />
the human behaviour.<br />
How do you plan to expand<br />
at the market hereinafter?<br />
We have expanded ourselves, this year we entered<br />
the Estonian kvass market, our kvass was<br />
even the weekly news in media which was discussed.<br />
Before our arrival the Estonian kvass<br />
market was three times smaller than now, we<br />
increased it strongly.<br />
We search constantly new possibilities, at the<br />
beginning there was beer and long drink and<br />
soft drink – now the spectre is much wider, this<br />
year we made tests also for the wine market<br />
with 3-litre cardboard boxes and we started to<br />
import these. We are volume sellers and no one<br />
in Estonia monitors the wine market, therefore<br />
I do not know exactly how it went, but what we<br />
can’t sell much, we will not sell. We are too big<br />
for starting to work in the niches, we have to win<br />
in major matters. And really, if you have 10% of<br />
the market, one can take more from there, but<br />
if you are first at the market, then it is already<br />
complicated to exceed 40-50%. If the market is<br />
not increasing, you will make new choices and<br />
create new opportunities how to guarantee the<br />
company’s development further on. And one<br />
should develop.<br />
Which are the tips for planning<br />
your new products?<br />
We should always answer the question why<br />
and why with this price someone should want<br />
this product. Or example, if we can’t tell why<br />
just our water should be better than any other<br />
water, then the uniqueness is missing in case<br />
of water. Actually the only Estonian producer<br />
who can boast with the uniqueness is Värska<br />
which has also preserved its market share. We<br />
have our thoughts with new products, but we<br />
do not have to launch these now, if the market<br />
is in decline and it is cold outside. All main<br />
products should develop, should not bring new<br />
tastes, much can be done with the package,<br />
slightly also with the content, playing with<br />
added values. Here there are choices, but each<br />
product should provide a surprise for the person.<br />
Compared to the old countries of Central<br />
Europe there are many surprises in Estonia<br />
and success is achieved by the ones who are<br />
innovative. When introducing the new thing and<br />
not advertising it and this is not reaching the<br />
consumer, there is no sense to introduce<br />
something at the market. In A. Le Coq we sit<br />
together twice a month and develop products.<br />
Each company should have some message on<br />
each product and one’s company – this should<br />
also be proven to the consumer and if these<br />
arguments exist, these should be somehow<br />
taken to the consumers. And marketing exists<br />
for that purpose.<br />
How have you planned<br />
the teamwork?<br />
Teamwork is one of the most effective methods,<br />
whereby this has been quite little handled in Estonia.<br />
We started all that when I as a young man<br />
started to manage the brewery and the initial<br />
understanding was such that the marketing<br />
deals with marketing and production with production<br />
etc. Further on: if marketing created an<br />
idea and needed money for that purpose, I told:<br />
“No, I do not believe in it, reconsider it!“ Then<br />
people discussed again and then I sent them<br />
often back and this repeated many times.<br />
Finally there was confrontation that what do you<br />
want from us. Today’s teamwork is seen so that<br />
there is a manager and his team. In good case<br />
this could be called management team, but this<br />
has nothing to do with teamwork. But then we<br />
understood that something should be changed.<br />
Together with the management of that time we<br />
purchased 11 books from Amazon and read<br />
these through. Finally we sat at the round table<br />
and made summaries and agreed finally in the<br />
principles. These are valid up to today. Shortly,<br />
the aim of teamwork is to arouse creativity in<br />
people and all are equal in the team, there are<br />
no chiefs or subordinates. 9 teams work by us in<br />
different sectors. •<br />
Food Industry Enterprises<br />
Place<br />
Sales Change Net profit Change Return Labour costs Efficiency per Investments %<br />
Enterprise in sales in net profit on equity per employee employee of the first<br />
*group<br />
th. EEK place % place th. EEK place % place % place EEK/month place th. EEK place th. EEK place (0...100)<br />
1 A. LE COQ AS 1,126,485 2 97.4 9 186,371 1 110.9 5 21.1 2 22,796 2 2,845 1 52,594 2 100.0%<br />
2 RAKVERE LIHAKOMBINAAT AS* 2,151,822 1 114.0 4 72,438 2 58.1 8 6.8 8 16,439 5 1,597 5 190,100 1 93.2%<br />
3 POLVEN OÜ* 69,383 7 107.2 7 1,570 8 1,984.9 1 14.2 5 38,622 1 2,478 3 2,061 6 90.5%<br />
4 VÄRSKA VESI AS 82,426 6 118.6 3 5,356 5 172.4 2 42.9 1 15,711 6 1,717 4 5,341 5 61.5%<br />
5 BALTI VESKI AS 50,653 8 120.9 2 2,247 7 108.3 6 14.5 4 20,254 4 2,533 2 264 9 57.1%<br />
6 NÕO LIHATÖÖSTUS AS 191,318 3 138.2 1 5,901 4 115.3 4 9.9 7 13,086 9 1,417 6 16,950 3 48.1%<br />
7 SALVEST AS 182,639 4 107.8 6 19,374 3 123.4 3 18.4 3 13,882 8 1,210 7 13,809 4 33.4%<br />
8 MELECO AS 115,435 5 103.2 8 5,032 6 71.9 7 13.7 6 14,877 7 1,132 8 1,114 8 21.4%<br />
9 KRAPESK AS 39,072 9 109.0 5 482 9 2.1 9 1.2 9 22,053 3 814 9 1,437 7 17.1%<br />
www.konkurents.ee<br />
1 EUR = 15.6466 EEK; 1 EEK = 0.0639 EUR; based on 2008 data<br />
52
MERKO EHITUS AS<br />
The Most Competitive<br />
Construction Enterprise<br />
2009<br />
Photo: Toomas Tuul<br />
TIIT ROBEN<br />
Contributing<br />
to the future<br />
Tiit Roben, the manager of Merko,<br />
has a command of figurative language.<br />
He describes his being at the<br />
construction market today as the<br />
swimming of a whale in the ocean –<br />
you guttle the plankton and then let<br />
water out between the teeth. What<br />
does he mean by it? It means that<br />
there are practically no major public<br />
procurements at the market and<br />
many small ones are pursued to be<br />
guttled. Still the company is going<br />
concern and plans to expand. Much<br />
is going on currently in the road construction.<br />
Last year was very successful<br />
for the company – the largest<br />
object was finished which has ever<br />
been built by Merko in Estonia and<br />
some larger objects were also set up<br />
at the neighbouring markets.<br />
MERKO EHITUS AS 2008:<br />
Sales (th EEK) 4,653,933<br />
Change in sales 84.5 %<br />
Net profit (th EEK) 299,140<br />
Change in net profit 54.9 %<br />
Number of employees 1,042<br />
Investments (th EEK) 66,452<br />
Return on equity 14.4 %<br />
53
Photo: Rene Suurkaev<br />
How is Merko seeing the Estonian construction<br />
market? Is it worried or optimistic?<br />
Let’s say that it goes as it goes for the whale in<br />
the ocean – you guttle plankton and let water<br />
out through the teeth. Recently it can be seen<br />
that public procurements are really small. This<br />
is a new situation, as in 2006 and 2007 we did<br />
not manage to participate in small procurements,<br />
then today we congratulate each other<br />
already in case of winning the procurement of<br />
two million kroons. Thus we increase sales object<br />
by object. At the same time the competition<br />
in road construction has become really tough.<br />
This market has been closed for years, part of<br />
the road constructors are used to keep this to<br />
themselves. And think – new others are coming<br />
who would like to do something in road construction.<br />
There is nothing to do – this is almost<br />
an only place where money flows. The road construction<br />
procurement of 100 million kroons is<br />
today a really major thing.<br />
Which were the most outstanding<br />
projects of last year?<br />
Our key object was Viru Prison, I believe this is<br />
our largest object of general construction made<br />
in Estonia. There has not been much talk about<br />
it, but we also finished in Lithuania the largest<br />
object of Merko history which is located in the<br />
city centre of Vilnius and the volume of this contract<br />
was 1.2 billion kroons. Last year we built<br />
Tallink’s offices, the office building Delta Plaza<br />
is also the “child“ of our last year. In Pärnu we<br />
fulfilled network procurements for 170 million<br />
kroons – thus the sales has been created. The<br />
major procurements received last year feed us<br />
also this year: Ämari airport, the centre of Solaris<br />
will be completed by autumn. The problem<br />
is that much work has been done and we see<br />
that we have managed clearly more than we<br />
have won from the new procurements. We<br />
have won relatively many pipe procurements<br />
financed through the Environmental Investment<br />
Centre. We have participated a lot in the procurements<br />
of Eesti Energia and built quite many<br />
substations.<br />
What is the role of the state<br />
in your opinion?<br />
If the state, today as practically the only client,<br />
cuts the expenses there is a risk that companies<br />
are put to the stop. What has remained undone?<br />
For example, there is unused money on<br />
the accounts of the companies and private persons.<br />
This money could be inserted to the entrepreneurship.<br />
Actually the PPP (private public<br />
partnership) projects could be organised or<br />
such procurements where part of the money is<br />
paid to the entrepreneur by instalment. If 85%<br />
of the money is coming from Europe, then the<br />
state could take this remaining 15% from the<br />
employee – provided that the employee gets its<br />
15% for example within ten years and this<br />
money will be calculated into the price of the<br />
procurement. I have presented this idea here<br />
and there, but up to now such procurements<br />
have not yet been organised...<br />
What is the future vision of Merko?<br />
Today we dare not to look at the direction of<br />
Russia, the Estonian-Russian relations and the<br />
surrounding political background is such which<br />
is not supporting it. We would not still go to<br />
Minsk, the situation there is still unstable. It<br />
would be real to have a look in Kiev. The market<br />
of the Baltic countries is clearly too small and<br />
much has been done here with the previous period.<br />
Such rise as we have seen will no more<br />
come. While viewing Estonia it is clear that there<br />
are enough offices, hotels and trade centres. We<br />
clearly miss some prisons and the schoolhouses<br />
could be also repaired. Only dwellings<br />
can be built – these are needed all the time. We<br />
hope that the children of the song revolution will<br />
become adults within the next five years and<br />
want to purchase their own living place. This<br />
could be our life buoy, we see nothing else at<br />
the local market. We plan to build new apartments<br />
already this year. We have made one<br />
strategical decision – we purchase the road<br />
maintenance company Vooremaa teed from the<br />
state. On the basis of Tallinna Teed which is our<br />
subsidiary, we have mainly focused on Northern<br />
Estonia in road construction. Now we try to<br />
develop Vooremaa Teed into a serious infrastructure<br />
company and on the basis of that start<br />
to cover the direction of South Estonia.<br />
But how to survive the current time?<br />
This year the construction volumes fall 30-40%<br />
and when at top times 82000 constructors were<br />
working in Estonia, then now it is calculated that<br />
maybe only 40 000 will remain by the end of the<br />
year. We have more construction capacity and<br />
today we could build much.. If the market rises<br />
at one moment and the resting builders are far<br />
away, having found the new challenges, it is not<br />
possible to respond to the rise and fulfil the<br />
major volumes. We are comfortable with the<br />
current situation and we see many possibilities,<br />
we have different cooperation offers. The current<br />
period is very interesting and we think<br />
about the foreign markets. We have not been<br />
able to try ourselves in civil engineering in Latvia<br />
and Lithuania to a necessary extent and in the<br />
future we take more part in the public procurements<br />
there. The Latvians soon start to build<br />
the prisons and this would suit us very well. This<br />
what we have learned in the construction of Viru<br />
Prison based on the test-mistake method is a<br />
significant know-how base. I remember very<br />
well how the riot police got the task to test how<br />
strong are the doors of the cell. They broke several<br />
of these before we learned about how<br />
strong the door should be. Next time we need<br />
no assistance of the riot policemen. •<br />
54
Construction Enterprises<br />
Place<br />
Sales Change Net profit Change Return Labour costs Efficiency per Investments %<br />
Enterprise in sales in net profit on equity per employee employee of the first<br />
*group<br />
th. EEK place % place th. EEK place % place % place EEK/month place th. EEK place th. EEK place (0...100)<br />
1 MERKO EHITUS AS* 4,653,933 1 84.5 32 299,140 1 54.9 22 14.4 24 38,570 5 4,466 7 66,452 5 100.0%<br />
2 NORDIC CONTRACTORS AS* 3,972,037 2 105.1 17 53,556 5 13.6 33 4.8 34 35,107 6 3,110 11 417,094 2 93.6%<br />
3 RIVERSIDE OÜ 131,003 16 506.7 1 11,081 12 100 14 1385.1 1 24,124 21 5,240 6 211 31 90.7%<br />
4 NORDECON INTERNATIONAL AS* 3,867,917 3 103.1 19 171,316 2 59.1 20 20.5 22 33,714 7 3,140 10 150,294 3 85.0%<br />
5 NORDECON EHITUS AS 659,782 7 100.7 22 75,080 3 100.7 13 40.3 12 79,524 1 9,425 3 39 76.0%<br />
6 MERKO TARTU AS 327,335 9 91.9 28 11,250 11 49.2 24 22.9 19 51,796 2 16,367 2 423 26 64.2%<br />
7 KAAMOS EHITUS OÜ 235,732 10 141.6 6 13,153 9 109.6 11 55.5 9 29,943 12 18,133 1 101 33 63.5%<br />
8 FACIO EHITUSE AS 1,041,904 5 110.8 15 63,469 4 82.7 16 34.8 14 38,752 4 8,540 4 20,889 8 58.2%<br />
9 PULEIUM OÜ 4,360 41 172.5 4 876 33 931.0 1 96.2 2 9,151 43 1,090 32 553 24 51.5%<br />
10 SEVE EHITUSE AS 54,106 26 90.8 30 4,228 23 74.6 18 29.7 16 14,105 41 796 39 419,000 1 48.5%<br />
11 TERRAT AS 234,786 11 154.6 5 32,849 7 144.8 6 66.8 5 30,714 11 2,498 13 7,441 11 39.4%<br />
12 VIIMSI KEEVITUS AS 201,971 14 104.8 18 34,483 6 134.1 9 60.9 6 25,017 17 5,771 5 2,630 18 38.3%<br />
13 VIRU ELEKTRIK AS 41,668 29 237.1 2 2,442 27 201.7 3 55.7 8 19,738 30 1,984 17 77 35 35.8%<br />
14 YIT EMICO AS 91,817 19 173.2 3 5,720 18 143.0 7 69.9 4 26,450 16 2,700 12 229 29 34.8%<br />
15 TEEDE TEHNOKESKUS AS 69,999 23 133.9 8 5,498 19 168.0 4 20.8 21 32,483 8 1,014 35 3,555 15 31.1%<br />
16 SYSTEMTEST OÜ* 27,437 34 135.7 7 4,238 22 140.7 8 35.7 13 31,979 9 1,372 24 89 34 30.4%<br />
17 NORDECON INFRA AS* 1,233,025 4 100.4 23 -29,892 43 -12.2 40 24,818 18 1,787 18 74,986 4 30.0%<br />
18 TELORA-E AS 47,808 27 92.6 27 5,361 20 39.4 28 32.4 15 44,964 3 1,328 25 311 27 30.0%<br />
19 HIIU TEED OÜ 88,833 20 100.3 24 12,571 10 77.2 17 48.0 10 31,574 10 2,066 16 10,363 10 29.3%<br />
20 TALTER AS 782,173 6 105.5 16 -2,915 41 -1.4 38 26,696 15 2,307 15 31,168 7 28.6%<br />
21 P.P.EHITUS OÜ* 5,240 40 111.6 13 2,685 26 273.1 2 28.1 18 22,805 24 749 41 43 27.4%<br />
22 TREF AS* 424,831 8 103.0 20 22,861 8 32.4 30 8.9 32 21,807 26 2,484 14 14,696 9 26.6%<br />
23 AEK OÜ* 61,125 24 79.9 35 6,641 15 68.2 19 43.7 11 27,161 14 3,217 9 68 36 25.8%<br />
24 ÖSEL CONSULTING OÜ 3,469 42 117.5 12 1,072 32 129.1 10 60.8 7 22,672 25 771 40 27 42 23.5%<br />
25 LINDREM AS 55,328 25 53.0 41 7,230 13 148.6 5 87.7 3 24,507 19 1,383 23 229 28 23.5%<br />
26 HOTRONIC AS 76,412 22 110.9 14 1,932 30 103.6 12 16.1 23 23,100 22 1,442 21 6,254 12 23.3%<br />
27 RAPLA TEED OÜ 225,330 13 99.4 25 6,216 16 39.9 26 14.4 25 19,785 29 1,435 22 37,162 6 22.5%<br />
28 SAMESTI METALL OÜ 3,280 43 122.1 10 45 36 88.4 15 9.1 31 24,156 20 656 42 44 38 21.1%<br />
29 JÄRVA TEED AS 92,700 18 130.2 9 2,200 29 40.0 25 13.3 26 21,104 27 1,204 28 4,200 14 20.9%<br />
30 ELECTRUM AS 79,403 21 119.3 11 3,375 25 57.6 21 22.5 20 19,639 31 1,073 34 2,385 19 20.0%<br />
31 FINNLAMELLI EESTI OÜ 41,700 28 81.9 34 2,355 28 52.8 23 29.4 17 23,084 23 1,604 20 1,458 22 19.6%<br />
32 PAIDE MEK AS 172,035 15 102.1 21 7,169 14 39.4 27 12.2 27 18,634 33 1,313 26 2,345 20 18.8%<br />
33 MAPRI PROJEKT OÜ* 227,928 12 57.6 40 4,078 24 12.9 34 11.8 28 27,485 13 1,266 27 107 32 18.7%<br />
34 IKODOR AS 37,160 30 65.4 39 4,479 21 24.5 32 10.5 30 20,663 28 1,616 19 5,535 13 16.2%<br />
35 MATEK AS* 130,180 17 71.2 37 5,885 17 37.3 29 10.6 29 17,896 34 1,113 31 2,700 17 15.4%<br />
36 PAG AS 28,607 33 39.5 43 -459 38 -4.9 39 16,879 37 4,087 8 460 25 15.0%<br />
37 ESTNOR OÜ 22,088 35 91.4 29 4 37 4.2 36 0.1 37 18,955 32 818 38 41 13.7%<br />
38 PEETRI PUIT OÜ 30,611 32 90.1 31 1,758 31 28.5 31 7.9 33 13,111 42 957 36 641 23 12.5%<br />
39 SUJA EHITUS OÜ 33,569 31 94.9 26 -1,818 40 -43.8 42 17,299 36 1,119 30 2,209 21 12.4%<br />
40 ELEKTRIMEES OÜ 15,196 39 67.8 38 96 35 4.3 35 2.8 35 17,611 35 1,169 29 40 12.1%<br />
41 TVS PARTNERID AS 20,471 36 83.8 33 -555 39 -33.8 41 16,401 38 1,077 33 63 37 11.2%<br />
42 ET TOREL OÜ* 16,212 37 73.3 36 160 34 3.6 37 1.9 36 14,361 40 600 43 223 30 9.8%<br />
43 ABSINT OÜ* 15,633 38 43.0 42 -4,202 42 -56.1 43 16,097 39 869 37 3,000 16 6.9%<br />
www.konkurents.ee<br />
1 EUR = 15.6466 EEK; 1 EEK = 0.0639 EUR; based on 2008 data<br />
55
EESTI TELEKOM AS<br />
The Most Competitive<br />
Communication and<br />
IT-services Enterprise<br />
2009<br />
Leaders of the<br />
information<br />
society!<br />
The fact that times have become<br />
tougher is no particular news anymore.<br />
What makes it special in case of<br />
each enterprise is how they manage<br />
to go along with the difficult times.<br />
Looking at numbers, one could say<br />
that there is no reason to be overly optimistic.<br />
The director of Eesti Telekom<br />
Valdo Kalm says that he is generally<br />
an optimistic person, but he cannot<br />
currently foresee a quick improvement<br />
of the economic climate. Last<br />
year, three companies in the group –<br />
EMT, Elion and Microlink – developed<br />
their own common vision, which was<br />
consistently implemented in 2008 and<br />
continues to be implemented. The vision<br />
is simple and striking: “Leaders<br />
of the information society!”<br />
EMT, Elion and MicroLink are now jointly operating<br />
in the name of improving the information<br />
society. Last year, several meetings were held<br />
with the management boards of subsidiaries<br />
and thus the vision was born. At first, the slogan<br />
“Leaders of the information society” might<br />
sound very simple and obvious, but the reality<br />
is quite different. “We see a long tunnel here, in<br />
which there are different strategies. We began<br />
to implement this in 2008 and started with the<br />
project “Come along!”, which means internet<br />
for 100,000 more people. In cooperation with the<br />
“Let’s do it!“ team, we launched the “My Estonia”<br />
project. It started with us thinking how to<br />
use technology to the benefit of Estonia even<br />
more. We could see that some changes were<br />
needed here and this fits in well with the implementation<br />
of our vision,” Kalm is convinced.<br />
The “Come along!” project is in full swing, the internet<br />
bus is driving around in places where it<br />
has not been before. Including people in the internet<br />
world is purely a project of the three subsidiaries<br />
of Eesti Telekom. Telekom itself has<br />
contributed quite a lot and part of the money was<br />
received from the European Union structural<br />
funds. There is also very active involvement in the<br />
“My Estonia” project. According to Kalm, time is<br />
our biggest contribution in the project.<br />
In 2008, two major factors impacted the activity<br />
of Eesti Telekom. Although mobile and broadband<br />
services have been successful, the company<br />
has been influenced by the economic<br />
downturn as well as national and Europeanwide<br />
regulations in the last two quarters. Regulations<br />
generally mean that prices must be<br />
lowered in the mobile sector and EMT is required<br />
to oblige. “The turnover decreased but<br />
we still managed to increase the profit and the<br />
margins of our activity also increased, which in<br />
turn shows sustainability. Increase in the number<br />
of customers in mobile as well as broadband<br />
internet has confirmed the fact that<br />
internet is a human need,” Kalm concludes with<br />
satisfaction.<br />
Kalm recognises that although the cooling off<br />
of the economy already showed serious signs in<br />
2008, the enterprises of Telekom Grupp have<br />
managed to adapt to the changing conditions.<br />
What does this mean? In all three enterprises,<br />
cost-effectiveness programs have been implemented<br />
already since spring 2008 in order to<br />
reconcile the costs with the benefits. In addition,<br />
EMT and Elion have managed to preserve<br />
very secure market shares in their business.<br />
“Preserving the market share has always been<br />
our goal and we have succeeded,” says the director<br />
of the enterprise.<br />
Kalm is looking forward to this autumn. The<br />
man who is always optimistic now has notes of<br />
doubt in his words and thinks that it will be in no<br />
time soon that we will see economic recovery.<br />
“We have definitely not reached bottom yet, the<br />
number of jobs will decrease further and I think<br />
and fear that there will probably really be<br />
56
EESTI TELEKOM AS 2008:<br />
Sales (th EEK) 6,189,597<br />
Change in sales 98.9 %<br />
Net profit (th EEK) 1,438,265<br />
Change in net profit 95.2 %<br />
Number of employees 2,341<br />
Investments (th EEK) 754,782<br />
Return on equity 33.4 %<br />
Photo: Toomas Tuul<br />
VALDO KALM<br />
100,000 people unemployed and this will have a<br />
significant effect on consumption. The way to<br />
think is that things will be good but to be ready<br />
for the situation turning bad. There is little reason<br />
for great optimism this year.”<br />
In spite of difficult times, product development<br />
has continued at the enterprise and in connection<br />
with that, investments have not been significantly<br />
reduced either. The key words of product<br />
development and innovation in 2008 have<br />
been internet calls, the e-health project, 3.5 G<br />
network and the development of digital TV.<br />
Finally, one would assume that a director of a<br />
telecommunications enterprise replaces his<br />
phone every six months. It appears that this is<br />
currently not the case. Kalm has conducted his<br />
business with one phone for the last three<br />
years. He has probably used the same phone to<br />
make the calls that improve the information society.<br />
“We can see that our country is operating<br />
in a manner that is too costly. We must simply<br />
find other possibilities and information technology<br />
will surely help make society less expensive,”<br />
he throws ideas in the air with a sparkle in<br />
his eyes. •<br />
Communication and IT-services Enterprises<br />
Place<br />
Sales Change Net profit Change Return Labour costs Efficiency per Investments %<br />
Enterprise in sales in net profit on equity per employee employee of the first<br />
*group<br />
th. EEK place % place th. EEK place % place % place EEK/month place th. EEK place th. EEK place (0...100)<br />
1 EESTI TELEKOM AS* 6,189,597 1 98.9 17 1,438,265 1 95.2 16 33.4 10 31,512 9 2,644 6 754,782 1 100.0%<br />
2 EMT AS* 3,682,000 2 94.3 19 965,000 2 103.2 10 57.8 3 33,988 7 6,731 2 297,000 4 87.9%<br />
3 TELE2 EESTI AS 1,753,903 4 92.4 20 534,665 3 101.6 11 19.7 15 28,209 12 8,392 1 315,509 3 71.3%<br />
4 ELION ETTEVÕTTED AS* 3,293,383 3 106.7 14 488,441 4 82.4 17 23.8 14 26,672 14 2,200 7 428,000 2 63.3%<br />
5 LINXTELECOM ESTONIA OÜ 93,858 8 137.0 5 10,189 8 411.0 2 36.9 7 41,525 1 3,129 5 7,691 5 61.7%<br />
6 TELEGRUPP AS 148,429 7 129.3 9 14,215 7 127.4 8 62.1 2 32,924 8 3,227 4 1,174 13 49.5%<br />
7 SONA SYSTEMS OÜ 5,476 21 133.6 7 2,888 11 162.3 6 82.8 1 11,222 21 5,476 3 779 16 47.4%<br />
8 HELMES AS* 212,681 5 130.6 8 19,521 6 116.3 9 34.6 8 41,017 2 2,085 8 3,994 8 46.9%<br />
9 REAALSÜSTEEMID AS 12,184 17 92.3 21 2,025 12 525.2 1 13.1 17 21,099 16 1,108 10 98 20 44.0%<br />
10 MOBI SOLUTIONS OÜ* 23,686 13 128.5 10 2,894 10 343.0 3 53.5 5 19,988 17 987 13 89 22 43.8%<br />
11 REGIO AS 71,687 9 136.6 6 5,889 9 166.5 5 33.1 11 35,214 5 919 14 3,489 9 42.4%<br />
12 WEBMEDIA AS 169,151 6 125.8 11 29,696 5 134.4 7 43.6 6 34,851 6 842 15 4,088 7 42.4%<br />
13 NOW! INNOVATIONS OÜ 8,047 19 443.7 1 183 19 54.2 19 30.8 12 12,875 20 1,006 12 21 41.4%<br />
14 USESOFT AS 25,375 12 98.8 18 738 16 215.8 4 34.5 9 25,998 15 1,336 9 300 19 38.4%<br />
15 EKTACO AS 27,599 11 116.2 12 1,729 13 81.3 18 25.3 13 28,138 13 1,022 11 1,148 15 33.0%<br />
16 ADM INTERACTIVE OÜ 17,830 15 101.0 16 410 18 16.5 20 13.8 16 35,249 4 615 19 23 30.7%<br />
17 ITVILLA OÜ 320 24 193.2 4 26 20 100 15 53.6 4 3,575 24 320 21 24 27.0%<br />
18 AQRIS SOFTWARE AS 16,000 16 78.5 23 -789 22 -5.1 19 35,860 3 571 20 1,161 14 26.9%<br />
19 NETLEAD OÜ 10,083 18 203.4 3 1,317 14 100 12 28,828 11 672 16 477 18 26.0%<br />
20 SQA PARTNERS OÜ 23,440 14 115.6 13 753 15 100 13 10.9 18 15,761 18 297 22 4,554 6 23.3%<br />
21 ANDMEVARA AS 42,198 10 85.1 22 -5,548 24 -36.3 21 30,524 10 659 17 2,597 10 20.1%<br />
22 TRACKING CENTER OÜ 7,590 20 293.9 2 522 17 100 14 7,687 23 632 18 2,209 12 19.4%<br />
23 NUTITEQ OÜ 954 23 105.4 15 -107 21 -28.2 20 9,407 22 238 23 691 17 10.0%<br />
24 MODESAT COMMUNICATIONS OÜ 1,360 22 54.0 24 -2,412 23 -53.8 22 12,879 19 113 24 2,249 11 5.1%<br />
www.konkurents.ee<br />
1 EUR = 15.6466 EEK; 1 EEK = 0.0639 EUR; based on 2008 data<br />
57
EKE INVEST AS<br />
The Most Competitive<br />
Business Service and<br />
Real Estate Enterprise<br />
2009<br />
Ready at the<br />
start line<br />
EKE Invest is a very interesting enterprise.<br />
For instance, the building of an<br />
Estonian village on Crete Island was<br />
started a few years ago and quite a<br />
few of our fellow Estonians have<br />
bought summer houses on the island<br />
by now. There are the beginnings of<br />
several projects in the new Europe as<br />
well – in Romania and Moldova. In addition<br />
to real estate and production<br />
projects, EKE Invest has holdings in<br />
three local health centres. The director<br />
of the enterprise Rein Tiik says<br />
that it is now time to reflect. This does<br />
not, however, mean that investments<br />
are stopped – quite the contrary, EKE<br />
Invest has not set any restrictions on<br />
investing money. All this promises interesting<br />
projects. “We make plans,<br />
think about things and see what else<br />
we could do and set ourselves ready<br />
at the start line,” says Tiik.<br />
How did EKE Invest do last year?<br />
We are currently not launching many new projects,<br />
but 2007 as well as 2008 were both relatively<br />
good years. The year 2007 was actually<br />
even better because a number of projects that<br />
were grandly started in economically good years<br />
reached their natural end and were completed.<br />
In good times, both development and business<br />
projects were started in our subsidiaries and<br />
the realisation thereof was focused in 2007 and<br />
2008.<br />
Which project were you most satisfied with?<br />
There have been quite a few. One of the big and<br />
beautiful projects we participated in was the<br />
construction of the Ehituse ABC retail chain.<br />
This came about through our subsidiary and in<br />
turn, through a joint company created by the<br />
latter – the logistic chain often extends far but<br />
this was a really big and good project that was<br />
well played out. We ourselves have been more<br />
involved in completing the double tower for the<br />
people in Tallinn. The smallest project was located<br />
on Magasini Street – the restoration of a<br />
hospital building as a residential home designed<br />
by architect H. Johanson in 1926. This is<br />
located in an area of cultural and residential<br />
value, in a beautiful park environment and is<br />
protected by heritage conservation. The house<br />
almost had to be broken down to pieces and<br />
then restored in previous form as closely as<br />
possible. That was a large and specific project,<br />
for which little gratitude is expressed after the<br />
completion of the building. In addition, it is not<br />
cost effective but sometimes some things need<br />
to be done based on a sense of obligation.<br />
If we talk a little about history,<br />
what have been your most interesting<br />
endeavours in the construction field?<br />
During a good period at the end of the good<br />
times, when all the enterprises who had any resources<br />
looked outside Estonia, so did we and<br />
we launched two projects – one in the new Europe<br />
and the other in the old Europe. In 2006,<br />
we started to build an Estonian village on Crete.<br />
By now, two thirds of the Estonian village has<br />
been completed and Estonians are living there.<br />
Five houses are currently still on sale in the village.<br />
We are not building there at the moment<br />
but we have gained our experience. It is also interesting<br />
to observe that the downturn has not<br />
only affected us – Crete used to be very popular<br />
among the English, whose share has now decreased<br />
– the Greek banks will no longer grant<br />
them loans to buy houses. We financed the<br />
Crete project ourselves from own funds and<br />
purchasers’ advance payments.<br />
Why are you attracted<br />
to investments in health centres?<br />
We have contributed our energy to three Estonian<br />
health centres – Tervis, Tervise Paradiis and<br />
Värska. If an enterprise is old, some projects<br />
within the enterprise are old and long-term.<br />
During the whole independence era, they have<br />
been developed and contributed to. We have no<br />
restrictions regarding where we invest; we put<br />
58
Photo: Toomas Tuul<br />
REIN TIIK<br />
money where it makes sense at the moment. It<br />
is now time to reflect – we do not have to think<br />
about eagerly investing in the next building or<br />
warehouse. You can also think that the next investment<br />
might even be in manufacturing electronics<br />
or anything else we do not want or<br />
cannot think of today, but which is something<br />
new with seeming potential at some point in the<br />
future. Why set restrictions on oneself? In the<br />
years that we invested in health centres, it was<br />
done because it gave a good business result. If<br />
we look around in Estonia now, it is no longer<br />
very original. In the 2000s, they sprang up like<br />
mushrooms after the rain.<br />
Currently, many investments tend to struggle<br />
because there are not enough customers for<br />
this amount. We try to connect old and new<br />
projects. In developing new projects, our role is<br />
to decide whether to implement it ourselves or<br />
try to gather several enterprises behind one.<br />
Is there a way to derive a profit<br />
on a declining market?<br />
This offers many possibilities for brainstorming.<br />
If you are good at it, you can definitely use<br />
the potential hidden in here. You must not be a<br />
stupid optimist but at the same time, it would<br />
be healthier to be an optimist. A certain upturn<br />
occurred at the end of the summer and we now<br />
ask what is going to happen in autumn and at<br />
the beginning of winter. If no brakes are pulled<br />
again, we might hope that the process will more<br />
permanently take a turn upwards. I want to believe<br />
that the worst is over. •<br />
EKE INVEST AS 2008:<br />
Sales (th EEK) 286,713<br />
Change in sales 128 %<br />
Net profit (th EEK) 303,625<br />
Change in net profit 186.4 %<br />
Number of employees 225<br />
Investments (th EEK) 64,547<br />
Return on equity 43.3 %<br />
HISTORY OF EKE:<br />
EKE was already founded in the<br />
1960s. When Estonia regained independence,<br />
EKE’s structure attained an<br />
economically and formally proper<br />
structure, i.e. the previous member<br />
organisations of EKE became the<br />
shareholders of the current central<br />
organisation pursuant to their contribution.<br />
EKE Invest was founded in<br />
1993 to draw long-term financial investments<br />
together in one administrative<br />
enterprise. Several enter -<br />
prises with a foreign holding have also<br />
been founded through EKE, thereby<br />
opening the way to domestic and<br />
neighbouring markets.<br />
Photo: Toomas Tuul<br />
59
Photo: Toomas Tuul<br />
Business Service and Real Estate Enterprises<br />
Place<br />
Sales Change Net profit Change Return Labour costs Efficiency per Investments %<br />
Enterprise in sales in net profit on equity per employee employee of the first<br />
*group<br />
th. EEK place % place th. EEK place % place % place EEK/month place th. EEK place th. EEK place (0...100)<br />
1 EKE INVEST AS* 286,713 2 128.0 12 303,625 1 186.4 5 43.3 13 19,207 14 1,274 13 64,547 4 100.0%<br />
2 MAINOR AS* 325,447 1 123.4 14 117,958 2 55.7 18 13.3 20 18,882 16 1,017 16 143,918 2 82.8%<br />
3 ÜLEMISTE CITY AS 98,187 6 180.4 6 112,430 3 141.8 8 14.8 19 31,833 5 4,269 4 123,993 3 79.8%<br />
4 ÜLIKOOLILINNA ÄRIKESKUS AS 23,393 12 1,124.1 1 -399 29 -0.5 28 2,979 28 5,848 3 275,312 1 77.4%<br />
5 AIR MAINTENANCE ESTONIA AS 198,331 3 119.0 17 29,824 4 307.9 2 96.0 4 32,003 4 1,280 12 5,275 6 75.5%<br />
6 BLOOM OÜ 1,584 29 3,088.9 2 77 25 227.5 3 200.0 2 10,056 24 792 19 326 19 66.6%<br />
7 ADVISIO OÜ* 10,393 22 272.7 3 3,436 11 532.9 1 119.3 3 21,082 13 799 18 200 21 64.5%<br />
8 UTILEEK OÜ 20,649 13 208.6 4 1,992 13 64.1 16 510.7 1 15,530 19 2,950 8 3,300 7 58.3%<br />
9 CORPORE AS* 24,902 10 132.2 10 3,531 10 225.2 4 63.6 7 43,355 1 1,660 11 88 22 57.6%<br />
10 ITELLA INFORMATION AS 171,161 5 118.0 20 11,199 5 131.0 10 55.9 9 22,972 11 3,423 6 2,400 8 53.5%<br />
11 KPMG BALTICS AS* 175,740 4 118.0 19 5,052 9 99.1 15 44.9 12 28,595 8 751 20 1,012 13 50.6%<br />
12 RIMESS OÜ 54,644 9 118.5 18 9,160 7 114.5 12 72.1 5 29,418 7 658 21 1,400 12 42.2%<br />
13 AF-ESTIVO AS 73,705 7 110.9 24 585 19 19.6 22 13.1 21 32,229 3 3,879 5 6 26 40.6%<br />
14 NELI TUBA OÜ 20,449 14 123.7 13 1,132 14 18.6 24 16.8 18 1,995 29 20,449 1 1,611 11 38.8%<br />
15 BDA CONSULTING OÜ 18,772 15 130.6 11 998 15 35.1 21 50.0 11 35,476 2 1,707 10 415 15 38.2%<br />
16 CENTRALPHARMA COMMUNICATIONS OÜ 24,668 11 119.8 16 783 17 61.9 17 22.7 16 31,625 6 1,121 14 403 16 34.4%<br />
17 IN NOMINE OÜ 4,400 24 183.3 5 219 24 100 14 67.8 6 24,361 10 880 17 28 33.6%<br />
18 ESMA VARA AS 17,928 16 152.5 7 9,407 6 148.4 7 10.8 22 6,946 25 8,964 2 18 24 33.5%<br />
19 RIIGIRESSURSSIDE KESKUS OÜ* 66,080 8 106.6 25 651 18 1.6 27 0.1 27 11,556 22 3,304 7 62,531 5 28.1%<br />
20 RUUT DISAIN OÜ* 11,402 21 111.5 23 573 20 154.5 6 58.3 8 15,193 20 600 22 622 14 27.0%<br />
21 FINANCE MANAGEMENT OÜ 3,483 26 133.8 9 227 23 100 13 55.1 10 19,142 15 435 28 272 20 26.2%<br />
22 OSAÜHING EVENTUS EA 12,095 19 114.9 21 31 26 7.0 25 2.8 25 28,044 9 465 27 57 23 24.5%<br />
23 KOOPIA NIINI & RAUAM OÜ 16,304 17 121.2 15 2,807 12 120.3 11 38.9 14 13,793 21 543 23 1,682 10 23.7%<br />
24 AMC AMARIS AS 2,071 27 135.8 8 874 16 138.4 9 25.2 15 11,394 23 518 25 29 20.7%<br />
25 <strong>TOP</strong> GRAPHIC OÜ 7,591 23 79.5 29 287 21 37.4 20 3.8 23 21,683 12 1,084 15 27 20.7%<br />
26 A.KANGUST & PARTNERID OÜ 4,019 25 112.7 22 234 22 19.1 23 21.4 17 17,720 17 502 26 344 18 17.5%<br />
27 MR STUUDIO OÜ 11,408 20 99.7 26 -348 28 -10.6 29 16,223 18 519 24 2,335 9 13.8%<br />
28 EMAJÕE ÄRIKESKUS AS 15,904 18 86.6 28 5,209 8 53.0 19 3.1 24 6,107 26 2,272 9 386 17 13.0%<br />
29 SALESFORCE OÜ 1,754 28 94.0 27 4 27 3.1 26 2.7 26 5,563 27 92 29 6 25 4.3%<br />
www.konkurents.ee<br />
1 EUR = 15.6466 EEK; 1 EEK = 0.0639 EUR; based on 2008 data<br />
60
Swedbank AS<br />
The Most Competitive<br />
Financial Brokerage<br />
Enterprise<br />
2009<br />
Photo: Toomas Tuul<br />
PRIIT PERENS<br />
An organisation<br />
capable of change<br />
SWEDBANK AS 2008:<br />
Priit Perens, the manager of Swedbank<br />
in Estonia, says that he has<br />
never knowingly imagined himself as<br />
a bank manager, but rather considers<br />
himself to be a financial and enterprise<br />
banking specialist. Retail banking<br />
was a new and interesting world<br />
for him to thoroughly dive in. If we<br />
look at the previous year, a memorable<br />
and very visible change took<br />
place in the Estonian banking world –<br />
while the year began as Hansapank,<br />
by the turn of the year the bank carried<br />
the name Swedbank.<br />
Sales (th EEK) 15,553,500<br />
Change in sales 103.3 %<br />
Net profit (th EEK) 6,109,100<br />
Change in net profit 82.9 %<br />
Number of employees 8,326<br />
Investments (th EEK) 886,200<br />
Return on equity 18.8 %<br />
61
What was the year 2008 generally<br />
like for Swedbank?<br />
Actually, the most important thing was that within<br />
a year, we managed to turn an organisation, the<br />
entire culture of which is built on growth, into an<br />
organisation which could adequately correspond<br />
to the needs of a shrinking market demand without<br />
revolutions and excesses, while at the same<br />
time preserving efficiency. Our revenue decreased<br />
by 2% before provisions and the level of expenditure<br />
remained the same. The operating profit only<br />
decreased by 3% before the provisions, and the<br />
revenue and expenditure ratio, which at the best<br />
times has been 38%, was slightly over 39%. We<br />
have also maintained this figure in 2009. Thus,<br />
within 2008 we managed to create a basis to further<br />
operate as efficiently in the banking environment<br />
in 2009 as before.<br />
In which ways have the world’s financial<br />
markets and the poor state of economy<br />
in Estonia influenced Swedbank?<br />
I remember that at the beginning of 2008, we<br />
held an information day for the employees and<br />
after my first presentation as the manager of<br />
the bank, I felt as if a mean Santa Claus had entered<br />
the room and taken away all the presents.<br />
We then talked at length about the negative outlook<br />
on the developments in the economy and it<br />
was certainly similar to shock – on the one<br />
hand, the increasingly worsening foreign economy<br />
and on the other, the economy in Estonia<br />
after the burst of the real estate bubble. All this<br />
was discussed in the first presentation and the<br />
consequence was not a quick mental turnaround<br />
of the organisation – the change in internal<br />
attitudes to match the environment was a<br />
long and time-consuming process.<br />
What are the most important activities<br />
that you paid the most attention to last year?<br />
It is very easy to answer this question. Those<br />
three main activities were: Credit, Costs and Customers<br />
– three capital C-s. We obviously also had<br />
to respond to changes in the credit portfolio quality<br />
and compensate the decrease in revenue by<br />
decreasing expenditure. The growing market,<br />
which was based on providing services and products,<br />
had now become a customer-friendly market<br />
increasingly more complexly focused on the<br />
needs of the customer. For us, since the spring in<br />
2008 inside the organisation this meant a strong<br />
shift towards the customer-friendly management<br />
model. We have also worked very seriously on improving<br />
service.<br />
How should Estonian manufacturing<br />
enterprises be feeling at the moment?<br />
The worst period for Estonian manufacturers<br />
was this spring, when no more orders were<br />
coming in. If you have no orders but there are<br />
employees and a bank loan, what do you do?<br />
This is a situation in which the society should<br />
have some answers in store to the question:<br />
what to do in difficult times? I am generally not<br />
in favour of aid packages but this was a really<br />
extraordinary situation. In the automobile industry,<br />
for instance, if nobody buys cars today, it<br />
is clear that the cars already purchased will<br />
wear off within about five years and people will<br />
start buying again. The question is what is the<br />
manufacturer supposed to do for the following<br />
two years? In several Estonian manufacturing<br />
enterprises, the situation was similar. By now<br />
the exporters I have been in contact with recently<br />
are saying that there is more work than in<br />
spring. It seems that recovery is taking place at<br />
the moment – I dare not predict whether there<br />
will be growth. The recovery of manufacturing<br />
does certainly not necessarily mean that the<br />
level of unemployment will not increase. We<br />
were afraid of July, but July was not actually<br />
that bad. It was probably the influence of the<br />
summer – some people went home to enjoy<br />
their holiday pay, others did seasonal work. We<br />
will now see in autumn whether the fall will be<br />
painful or not.<br />
What would the economic forecast<br />
of the Swedbank manager be?<br />
I think that it is currently most important that the<br />
situation will probably not get any worse. If there<br />
was a relatively sharp increase in the world’s<br />
stock markets in spring and there were no macro<br />
indicators to back it up, by now macro indicators<br />
have started to support the upturn. It is naturally<br />
different by regions. At the same time, the external<br />
environment has improved, capital markets<br />
have recovered and the availability of money is increasingly<br />
on the rise. It is interesting that the situation<br />
on the capital and money market is<br />
improving on a weekly basis and the credit risk<br />
prices keep falling. This means that the external<br />
environment, particularly the mood in the external<br />
environment, is positive.<br />
If we look at the immediate future in Estonia,<br />
the prices of real estate, for instance, have<br />
dropped so much that the average price per<br />
square metre and the average salary are starting<br />
to come close to each other – this is a level<br />
that could be sustainable. I have talked to developers<br />
and according to them, this is the level<br />
at which we could start building again.<br />
But everyone is currently probably waiting to<br />
see what is going to happen and when the economy<br />
in Finland or Sweden, for instance, will recover.<br />
We might be at a breaking point at the<br />
moment, but we will first have to wait for the autumn<br />
to arrive, it is too early to make far-reaching<br />
conclusions yet. I have previously rather<br />
been known as a person with a negative outlook<br />
but at the moment, I am positively minded about<br />
the future. •<br />
Financial Brokerage Enterprises<br />
Place<br />
Sales Change Net profit Change Return Labour costs Efficiency per Investments %<br />
Enterprise in sales in net profit on equity per employee employee of the first<br />
*group<br />
th. EEK place % place th. EEK place % place % place EEK/month place th. EEK place th. EEK place (0...100)<br />
1 SWEDBANK AS* 15,553,500 1 103.3 10 6,109,100 1 82.9 9 18.8 9 29,579 5 1,868 5 886,200 1 100.0%<br />
2 SMS LAEN AS* 90,415 8 125.4 4 25,186 6 236.2 1 64.0 2 52,377 2 4,305 2 1,429 8 89.2%<br />
3 GILD PARTNERS AS* 156,108 5 116.5 5 67,534 4 83.9 8 63.4 4 56,408 1 2,439 3 3,688 6 65.6%<br />
4 3 STEP IT OÜ 212,103 4 99.5 11 4,242 7 88.1 6 29.5 6 46,055 3 9,222 1 12 61.2%<br />
5 GVANDRON OÜ 2,228 14 144.0 1 525 10 154.0 2 64.6 1 13,370 14 557 12 1,316 10 59.3%<br />
6 MEGARAM OÜ 2,969 12 129.7 2 38 12 100 5 63.8 3 16,748 13 371 14 14 47.4%<br />
7 TAVID AS* 122,173 7 113.3 6 65,710 5 102.1 4 41.5 5 24,360 8 1,164 8 1,332 9 40.6%<br />
8 EESTI KREDIIDIPANK AS 358,390 3 111.0 8 71,421 3 86.4 7 20.5 7 26,640 7 1,765 6 7,883 4 36.0%<br />
9 ERGO KINDLUSTUSE AS* 924,357 2 99.2 12 124,615 2 117.2 3 17.3 10 19,997 10 1,675 7 10,049 3 30.1%<br />
10 PÕLVAMAA HOIU-LAENUÜHISTU TUÜ 2,460 13 111.8 7 122 11 50.0 10 4.5 12 29,430 6 615 11 9 13 26.2%<br />
11 TALLINNA ÄRIPANGA AS* 129,700 6 99.1 13 -7,500 14 -2.2 13 34,766 4 2,027 4 21,900 2 23.2%<br />
12 KINDLUSTUSEST KINDLUSTUSMAAKLER OÜ 15,384 11 108.9 9 532 9 30.0 12 19.2 8 21,542 9 440 13 99 11 21.5%<br />
13 IIZI KINDLUSTUSMAAKLER AS* 84,613 9 126.6 3 -2,911 13 -30.5 14 19,075 12 631 10 4,064 5 17.8%<br />
14 EUREX CAPITAL OÜ* 28,822 10 98.6 14 4,038 8 33.6 11 14.4 11 19,901 11 721 9 2,381 7 15.5%<br />
www.konkurents.ee<br />
1 EUR = 15.6466 EEK; 1 EEK = 0.0639 EUR; based on 2008 data<br />
62
TALLINNA VESI AS<br />
The Most Competitive<br />
Service Enterprise<br />
2009<br />
Striving<br />
for cleaner<br />
water<br />
The manager of Talinna Vesi surprises<br />
with that he tells that his passion is<br />
client service. This that he does not<br />
drink bottled water is no more such a<br />
surprise, but the justification is<br />
slightly it – he is sure that the tap<br />
water is of more quality compared to<br />
bottled water. And really, he has a<br />
water jug on the table instead of water<br />
bottle. Everything should be quite well<br />
with the quality of water in Tallinn, as<br />
the data measured and analysed last<br />
year indicate that the resident of<br />
Tallinn has never seen so good water<br />
flowing from the tap – 98% of the<br />
maximum indicators have been<br />
achieved.<br />
The manager of Tallinna Vesi started his career<br />
in the international company United Utilities<br />
where he worked for total of 20 years by travelling<br />
around the world and focusing on the<br />
world’s electricity business. Plenderleith came<br />
to work to Estonia when Tallinna Vesi was privatised<br />
in 2004 and worked in the company for<br />
about three years as the financial manager.<br />
After that he married the Estonian and went<br />
back to England for a year by requiring to develop<br />
its knowledge in business development<br />
and risk management sectors. In October last<br />
year he came back here.<br />
“In 1990s United Utilities expanded to the electricity<br />
and water business and I managed to go<br />
to South America, I stayed four years in Argentina.<br />
Working there gave me an understanding<br />
that the cultures are very different in<br />
different countries – also the business cultures<br />
proceed from that and infrastructures are at<br />
very different levels, let alone the service. The<br />
work in Latin America had excellent results and<br />
I was really pleased with it – I was part of the<br />
international business. When I came to Tallinn..<br />
I almost jumped here.“<br />
One could believe that water management is<br />
boring and especially in the capital city of such<br />
a small country as Estonia. Plenderleith tells<br />
that as it was known that the company is taken<br />
to the stock exchange when he came here and<br />
there will be the first public sale of shares, the<br />
arrival to Estonia was an excellent opportunity<br />
and challenge for him. When arriving to Estonia<br />
there was a surprising situation. Instead of<br />
meeting the typical management of Eastern Europe,<br />
he saw the very well functioning company<br />
with rather Scandinavian attitude ahead of him.<br />
Tallinna Vesi is proud of the last year. First of all,<br />
the water quality reached the highest level in<br />
Tallinn ever – the measurement results reached<br />
98%. “This increases slowly, but imagine how<br />
difficult it is to get this last five percents. This<br />
year we want to reach 98.3% and finally also<br />
99% or even up from there,” the manager says.<br />
Last year the level of leakages also lowered. For<br />
comparison: when Tallinna Vesi was privatised,<br />
the water loss was even 35%. In 2008 17% was<br />
achieved. When saying figuratively, the quantity<br />
of saved water is equal to the daily water production<br />
of Tartu. The other important factor in<br />
water management is the breakdowns. “We had<br />
last year no planned breakdown which would<br />
have lasted more than 12 hours – the coping with<br />
breakdowns is a challenge, as you never know<br />
which are the weather conditions and what is ex-<br />
64
Photo: Toomas Tuul<br />
IAN JOHN ALEXANDER PLENDERLEITH<br />
actly going on underground, we can’t see this<br />
through. Imagine that the earth’s crust is in constant<br />
movement and therefore unstable, everything<br />
is under the ground and no one actually<br />
knows what is going on there. Tallinn has approximately<br />
thousand kilometres of underground<br />
water pipes. Separate leakage inspectors work<br />
in our company who view personally where the<br />
leakages could be,“ Plenderleith tells.<br />
At the end of the last year also the EBRD loan<br />
was refinanced, according to the manager this<br />
was a challenge and not at all an easy undertaking.<br />
For carrying out the network expansions,<br />
the loan of 20 million euros was taken<br />
from the Nordic Investment Bank.<br />
The satisfaction of the employees is also a key<br />
question. When Plenderleith came to the company<br />
to be a financial manager, much was done<br />
here already and no structural changes were<br />
necessary. During the privatisation of the company<br />
650 employees worked there, less than 350,<br />
i.e. less than half had remained when Plenderleith<br />
started to work in the company in 2004.<br />
“Here many difficult decisions were made. When<br />
I came last time, I found the operating team,<br />
everything functioned. Our employees are today<br />
quite satisfied, last year we saw for the first time<br />
that the level of the satisfaction of employees<br />
also clearly increased. Surely, much work was<br />
done in this question and now it could be seen<br />
that it has paid off,“ the manager is satisfied.<br />
The company’s manager tells about his real<br />
passion – client service. I have always been active<br />
in the financial sector, but actually my passion<br />
is client service. I love client service. If we<br />
take the key indicators, such as water quality –<br />
this has improved. But if someone comes and<br />
says that my water smells strange – what to do?<br />
Then I can ask what colour it is and how does it<br />
smell. We can examine, show interest. Always<br />
one can ask whether water pressure is all right,<br />
whether water can freely flow and after having<br />
heard the client feedback I can prepare my own<br />
business plan and all other plans and decide<br />
what to do with the problem of this sector.“<br />
In ideal world Plenderleith does not want that<br />
any of the clients would contact them at all.<br />
Everything should ideally function so that the<br />
people do not even notice the provision of the<br />
service. Tallinna Vesi is inevitably in the privileged<br />
status in Tallinn and the company’s manager<br />
confirms that they understand their<br />
special position. “We try to deal with everyone<br />
the same way. We want to be the best service<br />
provider in the Baltic countries. We work towards<br />
this aim.“ •<br />
TALLINNA VESI AS 2008:<br />
Sales (th EEK) 719,923<br />
Change in sales 111 %<br />
Net profit (th EEK) 295,968<br />
Change in net profit 106.5 %<br />
Number of employees 317<br />
Investments (th EEK) 306,257<br />
Return on equity 23.5 %<br />
Photo: Toomas Tuul<br />
65
Photo: Toomas Tuul<br />
Service Enterprises<br />
Place<br />
Sales Change Net profit Change Return Labour costs Efficiency per Investments %<br />
Enterprise in sales in net profit on equity per employee employee of the first<br />
*group<br />
th. EEK place % place th. EEK place % place % place EEK/month place th. EEK place th. EEK place (0...100)<br />
1 TALLINNA VESI AS 719,923 1 111.0 15 295,968 1 106.5 12 23.5 12 23,245 10 2,271 1 306,257 1 100.0%<br />
2 PLANSERK AS 32,748 10 122.6 10 3,783 9 166.9 8 40.4 9 40,002 1 1,926 2 2,113 6 56.9%<br />
3 AIK-PROJEKT OÜ 3,868 25 83.3 26 793 16 422.4 1 70.2 2 33,103 3 774 15 26 25 56.2%<br />
4 OLYMPIC CASINO EESTI AS 689,655 2 86.8 25 156,327 2 50.6 21 13.8 18 18,604 16 1,023 6 61,133 3 55.6%<br />
5 K-PROJEKT AS 79,845 5 244.7 2 11,915 4 226.8 2 55.3 4 38,524 2 868 10 2,034 8 55.5%<br />
6 FIBROTX OÜ 7,621 21 1,251.0 1 1,173 15 90.9 15 60.0 3 18,600 17 586 19 28 24 47.1%<br />
7 TEA KIRJASTUS AS* 73,094 6 143.0 5 5,778 5 223.6 5 42.0 7 23,855 9 1,160 5 1,945 9 43.8%<br />
8 RAGN-SELLS AS 346,750 3 106.1 18 27,971 3 62.2 20 16.4 17 19,872 13 1,011 7 106,852 2 43.0%<br />
9 GSMVALVE OÜ 22,970 13 171.9 4 2,372 11 225.8 3 87.6 1 15,041 21 792 14 1,660 10 40.5%<br />
10 EA RENG AS* 85,500 4 101.7 21 5,440 6 132.7 9 42.2 6 28,411 6 743 17 2,043 7 38.1%<br />
11 INVARU OÜ 30,200 11 132.6 7 2,087 12 224.8 4 41.2 8 18,505 19 795 13 200 19 35.2%<br />
12 IDEAB PROJECT EESTI AS 20,385 14 120.2 11 1,516 14 129.6 10 26.9 11 11,667 26 1,853 3 13 26 33.3%<br />
13 EMI EWT IDA-LÄÄNE KOOLITUSE AS 5,701 23 91.0 24 148 22 29.4 23 13.1 19 28,366 7 1,425 4 73 22 32.4%<br />
14 VÄRVALTRANS OÜ* 34,051 9 105.5 19 5,197 7 94.2 14 36.3 10 18,593 18 973 8 32,038 4 31.7%<br />
15 AD REM TÕLKEBÜROO OÜ 4,636 24 99.2 23 73 27 127.9 11 10.5 20 28,891 5 773 16 28 31.1%<br />
16 LUISA TÕLKEBÜROO OÜ 25,610 12 107.9 17 412 19 167.5 7 2.6 24 29,106 4 582 20 300 16 31.0%<br />
17 TAASTAVA KIRURGIA KLIINIK AS 49,383 7 109.1 16 3,297 10 69.8 19 19.2 15 24,276 8 610 18 2,629 5 26.9%<br />
18 MAVAM OÜ 2,501 28 101.1 22 356 20 86.1 18 21.7 14 20,427 12 834 12 27 25.9%<br />
19 OSAÜHING GEOMETRIA 8,814 19 119.4 12 576 17 197.1 6 9.9 21 14,780 22 383 24 269 17 22.1%<br />
20 SIRKEL & MALL OÜ 14,245 17 127.3 9 457 18 39.0 22 22.1 13 19,140 15 396 23 662 12 19.7%<br />
21 K GRUPP TURVATEENUSED OÜ 34,466 8 102.0 20 4,059 8 89.7 16 51.9 5 10,594 28 191 28 88 21 19.2%<br />
22 EDELSTEIN OÜ 3,418 26 77.7 27 107 24 14.9 26 7.1 23 17,119 20 854 11 108 20 17.9%<br />
23 EESTI-AMEERIKA ÄRIAKADEEMIA AS 18,296 15 113.3 13 1,662 13 88.2 17 16.8 16 14,545 23 321 26 427 14 17.4%<br />
24 ASPER BIOTECH AS 17,725 16 112.2 14 95 25 13.8 27 1.0 26 20,432 11 443 21 624 13 16.4%<br />
25 REALISTER OÜ* 9,470 18 135.6 6 -415 28 -42.6 27 19,371 14 947 9 338 15 14.2%<br />
26 JÕGEVA VESI OÜ* 5,756 22 129.2 8 90 26 27.2 24 8.2 22 10,953 27 303 27 73 23 10.7%<br />
27 B.I.A. OÜ 3,045 27 205.1 3 211 21 100 13 14,164 24 338 25 249 18 10.5%<br />
28 ANDEVIS AS* 7,946 20 74.5 28 128 23 21.3 25 2.5 25 11,939 25 441 22 1,169 11 10.5%<br />
www.konkurents.ee<br />
1 EUR = 15.6466 EEK; 1 EEK = 0.0639 EUR; based on 2008 data<br />
66
TALLINK GRUPP AS<br />
The Most Competitive<br />
Transportation and Logistics<br />
Enterprise<br />
2009<br />
Photo: Toomas Tuul<br />
ANDRES HUNT<br />
Master course<br />
of optimising<br />
When talking to any manager of the<br />
company, they tend to remember not<br />
the previous, but still relatively stable<br />
year, but this what is going on now.<br />
This is actually right, as the business<br />
often requires the looking into the future<br />
with analysing the present. This is<br />
also the case with the Estonian largest<br />
ship company. Andres Hunt, the member<br />
of the management board of<br />
Tallink, tells that they think about different<br />
variants and plans regarding the<br />
future. What is exactly undertaken at<br />
the falling market is not sure but one<br />
thing is clear: changing of the world<br />
economy, decrease in volume of goods<br />
transport, increase in the number of<br />
passengers on the background of<br />
falling sales – this is the big challenge<br />
for the company’s management.<br />
TALLINK GRUPP AS 2008:<br />
Sales (th EEK) 12,310,015<br />
Change in sales 103.4 %<br />
Net profit (th EEK) 317,976<br />
Change in net profit 30.3 %<br />
Number of employees 6,564<br />
Investments (th EEK) 4,240,289<br />
Return on equity 3.1 %<br />
68
In July this year Tallink sets the record – more<br />
than million people travelled with the company<br />
ships, no one has seen so high number. At the<br />
same time, in the conditions of decreasing competition<br />
and income of people, the company had<br />
to decrease the ticket prices, the large number<br />
of passengers do not always mean higher sums<br />
for the company. Last year was quite a good<br />
year for Tallink. “Last year it was especially<br />
pleasant that two new ships were introduced in<br />
the line at a time: “Superstar“ in spring and<br />
“Baltic Princess“ in summer and this brought<br />
along several changes, “Princess“ came to the<br />
line of Tallinn-Helsinki and “Galaxy“ went to the<br />
line of Turu-Stockholm, from there “Silja Festival“<br />
went to the line of Riga-Stockholm. When<br />
looking back, this was the right moment for<br />
such exchanges and we ourselves would have<br />
liked to do it earlier. The ship plant could not<br />
manage with its questions as expected. It was a<br />
right decision, as the numbers of passengers<br />
increased and the investment was needed,“<br />
Hunt thinks.<br />
The company’s management was not satisfied<br />
with the last year’s financial numbers. The profitability<br />
fell, the sales increased by only 3% and<br />
the number of passengers slightly increased.<br />
The growth in profitability was in its turn cancelled<br />
by the abrupt increase in fuel price.<br />
Tallink has also surely made its activities more<br />
effective. As the fuel prices though raised too<br />
high, effectiveness resulted in no benefit. The<br />
share of goods transport fell by about 30%, but<br />
the ship has to serve also the remaining shipments<br />
and the expenses for the company are<br />
still the same. Andres Hunt thinks that the<br />
client of passenger ships requires further on<br />
more training and being used to it that the travelling<br />
by ship is also the method for spending<br />
leisure time besides travelling from one point to<br />
another.<br />
“We are not only pure transport company, we<br />
have all other services, consumptions on board<br />
which cover the expenses. If we take the income<br />
structure, the percentage of the ticket is 20%,<br />
the consumption makes a half and the percentage<br />
of goods shipments was also about 20%.<br />
The hotels of Tallink and other services to be<br />
provided still add there,” Hunt says.<br />
The economic periods are connected with each<br />
other always in business. Thus Tallink has the<br />
possibility to be satisfied in the current difficult<br />
time that the big investments have been made<br />
and the possibilities for providing better quality<br />
as to the tender have been guaranteed. The<br />
client gets these possibilities today with also<br />
cheaper price than before. Hunt states that the<br />
client’s expectations are different and currently<br />
one’s finances are viewed with more attentive<br />
glance than before.<br />
“We can’t confront the rest of the world, but go<br />
with the flow. You should be attractive and aggressive.<br />
We can’t exclude that bigger changes<br />
should be made. If the line has high loss, then it<br />
needs to be closed. There are different variants<br />
and we have played these scenarios through<br />
and now one should watch what the future<br />
brings. We should also negotiate with the partners<br />
and apply for the more favourable attitude,<br />
make alternative purchases, all that provides<br />
another way of thinking and cooperation between<br />
the partners. If one has to survive together,<br />
the plans should be made together,”<br />
one of the managers of Tallink is sure.<br />
The major activity of Tallink is now the review of<br />
the saving possibilities – on account of which it<br />
is possible to save, on account of which one<br />
could earn more. The extra money of 1 euro<br />
means millions of euros for the company.<br />
Andres Hunt says that this same difficult time<br />
offers him a lot of motivation. There are different<br />
possibilities and the choice of possibilities<br />
and the success is a big challenge. He provides<br />
one simple sample of optimising. When the bottom<br />
of the ship was before cleaned for example<br />
once a year, then now this is done more often,<br />
as the bottom of the ship will be full of algae and<br />
so the ship moves slower and also takes more<br />
fuel. Small matters bring along major changes,<br />
but with one exception: nothing should visibly<br />
become worse for the client.<br />
“We were able to implement the investment<br />
programme at the good times, we find it easier<br />
to go on from here. If we had used the old ships<br />
further on, then I do not know whether we could<br />
have been able to remain in the competition. In<br />
the big picture everything is still well. We know<br />
that this situation is not influenced by us, but<br />
from outside. We are sure that our strategy has<br />
been successful, we have not detected mistakes<br />
there. At the same time one should very seriously<br />
think at the state’s level on that Estonia<br />
would not lose attractiveness and this is greatly<br />
influenced by the state’s coping with economy,“<br />
Hunt adds to sum up. •<br />
Transportation and Logistics Enterprises<br />
Place<br />
Müügitulu Müügitulu Puhaskasum Puhaskasumi Omakapitali Tööjõukulud ühe Tootlikkus ühe Investeeringud %<br />
Ettevõte muutus muutus tootlikkus töötaja kohta töötaja kohta esimesest<br />
*konsolideeritud<br />
tuh kr koht % koht tuh kr koht % koht % koht kr/kuus koht tuh kr koht tuh kr koht (0...100)<br />
1 TALLINK GRUPP AS* 12,310,015 1 103.4 6 317,976 2 30.3 12 3.1 12 32,549 4 1,875 6 4,240,289 1 100.0%<br />
2 ASPERAAMUS OÜ 58,717 10 85.8 11 3,966 10 329.5 1 91.7 1 12,847 12 8,388 2 341 11 78.8%<br />
3 TALLINNA SADAM AS* 1,168,968 2 100.6 7 416,644 1 124.1 4 9.0 9 29,573 5 2,352 4 560,000 2 69.3%<br />
4 LENNULIIKLUSTEENINDUSE AS 244,472 4 105.9 5 72,322 4 87.9 7 30.3 5 50,118 1 1,798 7 53,326 4 61.5%<br />
5 LAJOS AS* 108,008 7 118.2 2 6,221 8 246.5 2 38.6 2 18,371 11 1,964 5 20,772 6 58.1%<br />
6 SPACECOM AS* 449,013 3 74.4 12 149,005 3 109.7 6 25.2 6 34,804 3 6,803 3 4,488 8 55.5%<br />
7 DPD EESTI AS 121,561 6 124.1 1 4,691 9 87.3 9 31.0 4 25,669 7 1,764 9 3,399 9 49.8%<br />
8 TESA LOGISTICS OÜ 63,203 9 86.4 10 3,737 11 56.8 10 31.1 3 20,865 8 9,029 1 5,071 7 46.7%<br />
9 ESTEVE TERMINAL AS 145,179 5 109.8 4 10,945 6 87.9 8 23.4 7 25,690 6 925 10 47,557 5 38.7%<br />
10 SAARTE LIINID AS 53,588 11 111.1 3 10,024 7 121.2 5 6.5 10 20,401 9 670 12 127,935 3 33.4%<br />
11 NTN EST AS 4,820 12 99.8 8 184 12 217.3 3 4.1 11 19,704 10 689 11 12 33.2%<br />
12 TNT EXPRESS WORLDWIDE EESTI AS 101,522 8 86.4 9 22,451 5 50.2 11 9.6 8 37,296 2 1,781 8 1,452 10 30.6%<br />
www.konkurents.ee<br />
1 EUR = 15.6466 EEK; 1 EEK = 0.0639 EUR; based on 2008 data<br />
69
The History of the Estonian Companies’<br />
Competitiveness Ranking<br />
2003<br />
The Most Competitive Enterprise:<br />
Eesti Energia AS<br />
The Most Competitive Small Enterprise:<br />
Tallinna Laevatehas OÜ<br />
The Most Competitive<br />
Large Trading Enterprise:<br />
Kesko Food AS<br />
The Most Competitive<br />
Small Trading Enterprise:<br />
Baltic Pulp & Paper OÜ<br />
The Most Competitive<br />
Large Industrial and Energy Enterprise:<br />
Eesti Energia AS<br />
The Most Competitive<br />
Small Industrial and Energy Enterprise:<br />
Krimelte OÜ<br />
The Most Competitive<br />
Construction Enterprise:<br />
Merko Ehitus AS<br />
The Most Competitive Transportation<br />
and Communication Enterprise:<br />
Russian Estonian Rail Services AS<br />
The Most Competitive<br />
Forestry and Agriculture Enterprise:<br />
Imavere Saeveski AS<br />
The Most Competitive<br />
Large Service Enterprise:<br />
Hansapank AS<br />
The Most Competitive<br />
Small Service Enterprise:<br />
Nordea Finance Estonia AS<br />
2004<br />
The Most Competitive Enterprise:<br />
Hansapank AS<br />
The Most Competitive<br />
Trading Enterprise:<br />
Silberauto AS<br />
The Most Competitive<br />
Medium-size Trading Enterprise:<br />
Kolomna Energy Service OÜ<br />
The Most Competitive<br />
Small Trading Enterprise:<br />
Agris Software AS<br />
The Most Competitive<br />
Large Industrial and Energy Enterprise:<br />
BLRT Grupp AS<br />
The Most Competitive<br />
Medium-sized Industrial and<br />
Energy Enterprise:<br />
maxit Estonia AS<br />
The Most Competitive<br />
Small Industrial and Energy Enterprise:<br />
Örnplast Eesti AS<br />
The Most Competitive Large and<br />
Medium-sized Construction Enterprise:<br />
Merko Ehitus AS<br />
The Most Competitive<br />
Small Construction Enterprise:<br />
Peri AS<br />
The Most Competitive Transportation,<br />
Logistics and Communication Enterprise:<br />
Russian Estonian Rail Services AS<br />
The Most Competitive<br />
Forestry and Agriculture Enterprise:<br />
Ekseko AS<br />
The Most Competitive<br />
Large and Medium-sized<br />
Service Enterprise:<br />
Hansapank AS<br />
The Most Competitive<br />
Small Service Enterprise:<br />
Riigiressursside Keskus OÜ<br />
2005<br />
The Most Competitive Enterprise:<br />
Hansapank AS<br />
The Most Competitive<br />
Financial Brokerage Enterprise<br />
Hansapank AS<br />
The Most Competitive<br />
Retail Enterprise:<br />
Tallinna Kaubamaja AS<br />
The Most Competitive<br />
Wholesale Enterprise:<br />
Silberauto AS<br />
The Most Competitive<br />
Industrial and Energy Enterprise:<br />
BLRT Grupp AS<br />
The Most Competitive<br />
Food Industry Enterprise:<br />
A. Le Coq Tartu Õlletehas AS<br />
The Most Competitive<br />
Construction Enterprise:<br />
Merko Ehitus AS<br />
The Most Competitive<br />
Communication, Transportation<br />
and Logistics Enterprise:<br />
EMT AS<br />
The Most Competitive<br />
Forestry and Agriculture Enterprise:<br />
Ekseko AS<br />
The Most Competitive<br />
Hotel and Restaurant Enterprise:<br />
Delegatsioon OÜ<br />
The Most Competitive<br />
Business Service and<br />
Real Estate Enterprise:<br />
Kodumajagrupi AS<br />
The Most Competitive<br />
Service Enterprise:<br />
Kuusakoski AS<br />
70
The History of the Estonian Companies’<br />
Competitiveness Ranking<br />
2006<br />
The Most Competitive Enterprise:<br />
Hansapank AS<br />
The Most Competitive<br />
Financial Brokerage Enterprise<br />
Hansapank AS<br />
The Most Competitive<br />
Retail Enterprise:<br />
Tallinna Kaubamaja AS<br />
The Most Competitive<br />
Wholesale Enterprise:<br />
Mažeikiu Nafta Trading House OÜ<br />
Konkurentsivõimelisim<br />
tööstus- ja energeetikaettevõte:<br />
BLRT Grupp AS<br />
The Most Competitive<br />
Food Industry Enterprise:<br />
A. Le Coq Tartu Õlletehas AS<br />
The Most Competitive<br />
Construction Enterprise:<br />
Merko Ehitus AS<br />
The Most Competitive<br />
Communication, Transportation<br />
and Logistics Enterprise:<br />
Eesti Telekom AS<br />
The Most Competitive<br />
Forestry and Agriculture Enterprise:<br />
Riigimetsa Majandamise Keskus<br />
The Most Competitive<br />
Hotel and Restaurant Enterprise:<br />
Domina Management AS<br />
The Most Competitive<br />
Business Service and<br />
Real Estate Enterprise:<br />
Falck Eesti AS<br />
The Most Competitive<br />
Service Enterprise:<br />
Kuusakoski AS<br />
2007<br />
The Most Competitive Enterprise:<br />
Tallink Grupp AS<br />
The Most Competitive Tourism Enterprise:<br />
Tallink Grupp AS<br />
The Most Competitive<br />
Small and Medium-sized Enterprise:<br />
Betoonimeister AS<br />
The Most Competitive<br />
Retail Enterprise:<br />
Catwees AS<br />
The Most Competitive<br />
Wholesale Enterprise:<br />
Mazeikiu Nafta Trading House OÜ<br />
The Most Competitive<br />
Industrial and Energy Enterprise:<br />
BLRT Grupp AS<br />
The Most Competitive<br />
Food Industry Enterprise:<br />
A. Le Coq AS<br />
The Most Competitive<br />
Construction Enterprise:<br />
Merko Ehitus AS<br />
The Most Competitive<br />
Communication and IT-services Enterprise:<br />
EMT AS<br />
The Most Competitive<br />
Forestry and Agriculture Enterprise:<br />
Ekseko AS<br />
The Most Competitive<br />
Business Service and<br />
Real Estate Enterprise:<br />
Artig KV OÜ<br />
The Most Competitive<br />
Financial Brokerage Enterprise:<br />
Hansapank AS<br />
The Most Competitive<br />
Service Enterprise:<br />
Tallinna Vesi AS<br />
The Most Competitive<br />
Transportation and Logistics Enterprise:<br />
Tallinna Sadam AS<br />
2008<br />
The Most Competitive Enterprise:<br />
Tallink Grupp AS<br />
The Most Competitive Tourism Enterprise:<br />
Tallink Grupp AS<br />
The Most Competitive<br />
Small and Medium-sized Enterprise:<br />
Kaamos Kinnisvara OÜ<br />
The Most Competitive<br />
Retail Enterprise:<br />
Varmapartner OÜ<br />
The Most Competitive<br />
Wholesale Enterprise:<br />
Mazeikiu Nafta Trading House OÜ<br />
The Most Competitive<br />
Industrial and Energy Enterprise:<br />
BLRT Grupp AS<br />
The Most Competitive<br />
Food Industry Enterprise:<br />
Saku Õlletehase AS<br />
The Most Competitive<br />
Construction Enterprise:<br />
Oma Ehitaja AS<br />
The Most Competitive<br />
Communication and IT-services Enterprise:<br />
Eesti Telekom AS<br />
The Most Competitive<br />
Forestry and Agriculture Enterprise:<br />
Oilseeds Trade AS<br />
The Most Competitive<br />
Business Service and<br />
Real Estate Enterprise:<br />
Mainor AS<br />
The Most Competitive<br />
Financial Brokerage Enterprise:<br />
Gild Professional Services AS<br />
The Most Competitive<br />
Service Enterprise:<br />
Olympic Casino Eesti AS<br />
The Most Competitive<br />
Transportation and Logistics Enterprise:<br />
Tallinna Sadam AS<br />
71
Acknowledge the Promoter<br />
of Entrepreneurship 2009<br />
“The young<br />
unemployed of<br />
Tartumaa<br />
as entrepreneurs”<br />
Best Promoter<br />
of Entrepreneurship<br />
2009<br />
„Acknowledge the promoter of entrepreneurship“<br />
is the national preliminary<br />
round organised within the<br />
frames of the over-European competition<br />
“European Enterprise Awards”<br />
where the projects contributing to the<br />
development of business environment,<br />
enterprising mood, business<br />
knowledge, responsible entrepreneurship<br />
or internationalisation of the<br />
companies.<br />
The jury chose the project of Foundation Tartu<br />
Ärinõuandla “The young unemployed of Tartumaa<br />
as entrepreneurs“ the main winner from<br />
among the three finalists in this year’s competition<br />
on 13 August. The project represents<br />
Estonia also in the over-European competition.<br />
As a result of the project 14 new companies<br />
were established, also 39 out of 47 people having<br />
participated in the project found job (of which<br />
11 as entrepreneurs and 28 as employees). The<br />
initiative of Tartu Ärinõuandla injected enterprising<br />
thinking to the young people which is currently<br />
very hard to underestimate. As a result of<br />
giving the enterprising attitude 14 companies act<br />
as a result of this project and more than half of<br />
the ones having participated in the trainings<br />
found job for themselves,” Lauri Tammiste, the<br />
member of the jury reasoned the choice.<br />
The project “The young unemployed of Tartumaa<br />
as entrepreneurs“ also won in the subcategory<br />
of responsible and seconding entre -<br />
preneurship<br />
The project “Development of entrepreneurship<br />
and supporting the projects of starting entrepreneurs“<br />
submitted by Narva City Government<br />
in the category of improving the business environment.<br />
In the frames of the project the starting<br />
entrepreneurs have been supported in the<br />
face of both co-financing and incubation service,<br />
the foundation Narva Tööstuspark has been<br />
established, the competition “Entrepreneur of<br />
Narva “ is organised, the information package<br />
Narva Investment Passport has been prepared<br />
for the potential investors and also support is<br />
asked for the training of entrepreneurs.<br />
72
Photo: Karel Korp<br />
Photo: Kristo Nurmis<br />
The project “Business home of the young“ submitted<br />
by the business centre of Tartu University<br />
won in the category of promoting entreprisingness.<br />
70 young people have participated in the<br />
project and six independent companies have<br />
been established, the fields of activities of which<br />
are from the information technology up to the<br />
construction of wooden boats.<br />
In specifying the winners and the best ones the<br />
common over-European methodology was<br />
used. The evaluation was based on the originality<br />
of initiative, impact on local economy proceeding<br />
from both short term and long-term<br />
perspective and the sustainability of the project.<br />
Also, it was considered to what extent different<br />
hobby groups have been involved in<br />
implementation and carrying out of the project<br />
and which are the usage possibilities of obtained<br />
experience in other districts.<br />
The members of the jury of the national competition<br />
“Acknowledge the Promoter of Entrepreneurship<br />
2009“ consisted of Keit Kasemets,<br />
startegical director of State Chancellery as the<br />
chairman of the jury, Lauri Tammiste, the head<br />
of department of economic development of the<br />
Ministry of Economic Affairs and Communications,<br />
Egle Käärats, vice chancellor of the<br />
labour sector of the Ministry of Social Affairs,<br />
Ülari Alamets, member of the management<br />
board of Enterprise Estonia, Siim Raie, the general<br />
director of the Estonian Chamber of Commerce<br />
and Industry and professor Tiit Elenurm,<br />
head of the chair of entrepreneurship of the<br />
Estonian Business School.<br />
The competition European Enterprise awards is<br />
organised by the European Commission for the<br />
fourth time. The aim of competition is to acknowledge<br />
the best initiatives focused on the<br />
promotion of entrepreneurship.<br />
Last year the total of 350 initiatives were submitted<br />
in the member states of the European<br />
Union, 47 of which participated in the over-<br />
European competition.<br />
In 2008 the competition of business plans of the<br />
young “Ajujaht“ (Brainstorm) carried out in<br />
cooperation with BDA and Enterprise Estonia<br />
and the project “Studying village“ of the nonprofit<br />
organisation Kodukant were recognised<br />
the Estonian best projects promoting entrepreneurship.<br />
•<br />
73
Swedbank special award<br />
WEBMEDIa<br />
Best Adjuster<br />
2009<br />
Artjom Sokolov:<br />
„The activity of Webmedia<br />
is a good sample of innovation<br />
and thinking without limits<br />
which is really needed by<br />
the small Estonian economy.”<br />
In the frames of the Estonian Companies’<br />
Competitiveness Ranking this<br />
year also the special award of Swedbank<br />
will be given. Today Swedbank<br />
wished to bring the company to the<br />
fore which has well adjusted in the<br />
changed environment and found the<br />
possibilities for increasing one’s business<br />
regardless of the complicated<br />
times.<br />
Artjom Sokolov, the managing director<br />
of the corporate banking of Swedbank<br />
brought the company’s innova -<br />
tive ness in its activity and purposefulness<br />
in searching the new markets to<br />
the fore. For example, the software<br />
solutions created by Webmedia for the<br />
state institutions and large-scale<br />
companies have been taken to the<br />
Arab countries, Egypt and Moldova.<br />
“The wide-scale export of services<br />
based on knowledge is one of the<br />
bases of the development of the Estonian<br />
economy. The activity of Webmedia<br />
is a good sample of innovation<br />
and thinking without limits which is<br />
really needed by the small Estonian<br />
economy,“ Sokolov says. According to<br />
him it is acknowledgeable that in the<br />
phase of shrinking economy new jobs<br />
have been established in the company<br />
and much attention should be also<br />
drawn to the employees in addition to<br />
economic success – Webmedia is one<br />
of the most family-friendly companies<br />
in Estonia. The manager of Webmedia<br />
Taavi Kotka tells that when observing<br />
the events around it seems void to<br />
speak about the results of 2008 in autumn<br />
2009. Webmedia is a happy company<br />
according to him, as each next<br />
year has been better than the previous<br />
one. The following discussion with<br />
the company’s manager Taavi Kotka is<br />
full of slightly different approach to<br />
entrepreneurship, such approach<br />
which considers also the factors with<br />
which the companies maybe consider<br />
only in words. Webmedia has in every<br />
sense taken many steps.<br />
74
Photo: Toomas Tuul<br />
TAAVI KOTKA<br />
Which was the success of the last year and<br />
which situations had to be faced?<br />
The major success was surely the launching of<br />
the activities in Qatar and the wins of the large<br />
scale projects outside Estonia. The challenge was<br />
the switching from the “profit“ regime to “economic<br />
recession“ regime similarly to others in<br />
2008 and accordingly also the transformation of<br />
the organisation. We are especially satisfied that<br />
the investments of the “profit” time started to provide<br />
benefit just now and we believe that these assist<br />
us also past the more difficult time.<br />
Your mission is to be the most reliable<br />
IT development partner – which tips<br />
are you using to achieve this?<br />
Webmedia has four main values: Innovation,<br />
Passion, Team-Spirit and Results. The latter<br />
“Results“ means that the initial promises are<br />
always completed, even if this is not economically<br />
beneficial for us and one should pay more<br />
for that. In creating reliability in the eyes of the<br />
client the remaining three main values are also<br />
not less important.<br />
Where to expand? Which are the objectives?<br />
The long-term objectives of Webmedia are very<br />
ambitious and their description here could seem<br />
like a crazy delirium, but in the shorter perspective<br />
we have set ourselves the objective to be the<br />
company ready for the stock exchange by the<br />
year 2013 (e.g. fit for stock exchange, not publicly<br />
traded company) and we move continuously towards<br />
this aim. This means the continuation of<br />
at least annual 20-30% growth, considerable<br />
growth of income outside Estonia, completion of<br />
product portfolios, increasing of the team, improvement<br />
of internal processes etc. We do not<br />
connect our expansion plans with the countries,<br />
these are rather related to the sectors and products<br />
wherein we feel strong today.<br />
Flexibility is an interesting word –<br />
what does it mean in your company?<br />
We live according to the principle: the company<br />
respects you and you respect the company. If you<br />
require more room for your private life, let it be<br />
the single free day or for longer period, your wish<br />
should be fulfilled. The company knows that you<br />
contribute this back some day. The same is valid<br />
vice versa, if the company needs you more than<br />
foreseen. This is an unwritten rule which is the<br />
part of Webmedia’s inner culture. It is very hard to<br />
communicate this in words, but this was expressed<br />
in activities in the title of the Most Employee-Friendly<br />
Company in 2008.<br />
What brought Taavi Kotka<br />
to Webmedia and what motivates<br />
most in this activity?<br />
I joined Webmedia in 2000 about a year after the<br />
establishing of the company. The possibility to<br />
participate in the team was offered, the objective<br />
of which was to create the Estonian best ITcompany<br />
and the freedom of activity was given<br />
to test the innovative software development<br />
methods. The better opportunity for the young<br />
student of informatics specialty could not be<br />
thought out.<br />
The client base of Webmedia mainly consists of<br />
the leader companies of its sectors (telecom,<br />
finance, insurance, e-commerce etc.) in the private<br />
sector and the more innovative institutions<br />
of the public sector. These are the well-known<br />
“good clients“ at the market who have understood<br />
that IT is not only a matter of fashion, but<br />
it is really possible to considerably improve the<br />
functioning of these companies or institutions<br />
by thinking out new solutions together and have<br />
an impact on the economic results. If you have<br />
good clients who are not afraid to test radical<br />
innovations and you have a youthful and curious<br />
team, then this is the best workplace for me –<br />
this motivates. •<br />
75
Best Student Company 2009<br />
Roheline jälg<br />
Best Student Company<br />
2009<br />
Restore the<br />
damage incurred<br />
by you for the<br />
nature<br />
The best student company 2009<br />
Roheline Jälg (Green Footprint) provides<br />
an opportunity for the peace of<br />
mind for the person respecting the<br />
nature: now everyone has the possibility<br />
to redeem its ecological footprint.<br />
Roheline Jälg, the company crowned<br />
this spring the best Estonian student<br />
company and thereafter having arrived<br />
with the triumph from the competition<br />
of the European student<br />
companies from Rotterdam seems at<br />
first sight as the simple initiative. The<br />
young people from Tallinn School<br />
No. 21 Margus Potisepp, Richard<br />
Pikmets, Sander Kaur and Kristina<br />
Õllek have found one model of calculating<br />
the ecological footprint available<br />
in Internet out of many and taken<br />
this to Estonia. That’s all.<br />
76
Photo: Toomas Tuul<br />
KRISTINA ÕLLEK, RICHARD PIKMETS, MARGUS POTISEPP, SANDER KAUR<br />
But this is not as simple as it seems. The company<br />
is not only enabling to calculate the natural<br />
damage of your vital functions, but also<br />
to cover this. Margus Potisepp says that the<br />
data for preparing the calculator of ecological<br />
footprint were collected from the international<br />
sources of reference such as Greenhouse Gas<br />
Protocol and by consulting with the organisations<br />
such as DEFRA (UK Department for Environment,<br />
Food and Rural Affairs), EIA<br />
(Energy Information Administration) and others,<br />
also by communicating with the makers<br />
of calculators originating from Great Britain<br />
and USA.<br />
The calculator has been adjusted for the Estonians<br />
with the assistance of Eesti Energia and<br />
State Forest Management Centre (RMK). It was<br />
learned for example from Eesti Energia, how<br />
much carbon dioxide is emerging in burning the<br />
oil shale for the production of one kWh electricity,<br />
presuming that most of the Estonian electricity<br />
comes from the burning of oil shale. The<br />
calculator is also completed in cooperation with<br />
the British Embassy and Tartu University.<br />
According to the calculator of the website of Roheline<br />
Jälg which is not 100 percent accurate,<br />
but should just give a simple image, the writer<br />
of this story - typical city resident - would create<br />
15.34 tons of carbon dioxide a year with its consumption.<br />
77 trees need to be planted for the<br />
neutralisation of this quantity. In average each<br />
Estonian should plant about 20 trees in the<br />
opinion of the company.<br />
The author of the story has covered purely accidentally<br />
the footprint this year, as he planted 85<br />
fir plants to its home garden. Roheline Jälg recommends<br />
to the ones who have not planted or<br />
cannot plant the trees to decrease the consumption<br />
or pay little money and let the others<br />
plant. RMK separated the land unit for that purpose<br />
in Harjumaa in Kose rural municipality.<br />
The planting of one tree costs 20 kroons including<br />
the cost of the plant, preparation of the land<br />
unit, post-planting maintenance and labour and<br />
transport costs. Ten percent of the price of the<br />
tree goes to the fund which finances the next<br />
environmental projects started by the student<br />
company.<br />
Potisepp says that if to consider the current<br />
participation in the fairs and exhibitions, 700<br />
persons have calculated their CO2 footprint<br />
through the company. Approximately 3000 persons<br />
are added to it who have used the calculator<br />
at the website of the company. More than<br />
1000 people have neutralised their CO2 footprint,<br />
including among them many foreigners –<br />
Germans, Americans, Dutch, Norwegians, Austrians<br />
etc.<br />
The young people have set the planting of 100 000<br />
trees as the objective of the three years which<br />
neutralises 20 000 tons of carbon dioxide. The<br />
separate mission is also the increase of environmental<br />
awareness and changing of consumption<br />
habits to hinder the ungovernable waste of resources,<br />
the environmental damages incurring<br />
from it and the warming up of climate which are<br />
all the keywords of the current society.<br />
Roheline Jälg was chosen the best student company<br />
this year in the competition of 14 Estonian<br />
student companies. The company of Toila Gymnasium<br />
Aktsioon won the second place which<br />
provided the service of active holiday. Roheline<br />
Jälg won the competition of the European student<br />
companies in the competition of even 32<br />
companies. The second place went to Switzerland<br />
and the third to Germany. Junior Achievement<br />
Development Fund deals with the<br />
preparation of the students for entrepreneurship.<br />
Roheline Jälg is officially acting as the non-profit<br />
organisation. One of its founders – Kristina Õllek<br />
graduated this year from the gymnasium and entered<br />
to the Estonian Art Academy. The remaining<br />
team consists of the school-leavers of the<br />
secondary school no. 21. Potisepp dreams about<br />
the possibility to go to Great Britain to study the<br />
power engineering, the others are still thinking<br />
about their choices. •<br />
77
eview of the enterpreneurship contests´ ceremonial award-gala 2009<br />
1<br />
1 The competition of Competitiveness Ranking<br />
has provided an outstanding opportunity to assess<br />
the activities of hundreds of companies and<br />
thereby also the general economic development.<br />
On the photo: the representatives of the<br />
most competitive companies of 2009 with the<br />
President of the Republic of Estonia, Prime Minister,<br />
Chairman of the Riigikogu, Minister of<br />
Economic Affairs and organizers.<br />
2 President Toomas Hendrik Ilves gives over the<br />
prize of the Estonian Most Competitive Company<br />
2009 to Tõnu Ääro, the manager of Mazeikiu<br />
Nafta Trading House.<br />
3 The Entrepreneurship Award 2009 issued by Enterprise<br />
Estonia was given to VKG Oil which also<br />
got the title Exporter 2009. On the photo: Nikolai<br />
Petrovitš, Chairman of the Management<br />
Board of VKG Oil receiving the prize from the<br />
President.<br />
4 “Even during the most difficult times in economy<br />
Estonia has the companies and entrepreneurs<br />
who cope well regardless of the<br />
difficulties and have faith in future,“ the President<br />
Toomas Hendrik Ilves said at the prize gala<br />
night of the entrepreneurship competitions in<br />
Estonia Concert Hall. He also emphasized that<br />
the status of the Estonian economy tomorrow,<br />
in a year and in ten years depends on the entrepreneurs.<br />
2<br />
3<br />
78
eview of the enterpreneurship contests´ ceremonial award-gala 2009<br />
4<br />
5<br />
5 Table of winners: from the left Taavi Kotka —<br />
manager of Webmedia AS, winner of special<br />
prize of Swedbank Best Adjuster 2009, Margus<br />
Potisepp — representative of Roheline Jälg,<br />
winner of the title Best Student Company 2009,<br />
Allar Korjas — Director of Export Division of Enterprise<br />
Estonia, Priit Koff — communication<br />
manager of Tallinna Vesi having won the title of<br />
the Most Competitive Service Company 2009.<br />
6 Peep Põldsamm, the chairman of the management<br />
board of the company Modesat Communications<br />
obtaining the title of the Innovator of<br />
the Year. As the first in the world, the company<br />
solved the technological challenge to forward<br />
the broadband internet for the plane moving<br />
1200 km ih an hour.<br />
7 BLRT Grupp became already for the sixth time<br />
the title of the Most Competitive Industrial and<br />
Energy Enterprise. Due to the market situation<br />
BLRT will not plan to expand this year, it will<br />
rather focus on keeping stability, competitiveness<br />
and effectiveness.<br />
6 7<br />
79
Photo: Priit Simson<br />
LEEV KUUM<br />
Estonian Institute<br />
of Economic Research<br />
2008 —<br />
(the first)<br />
year of crisis<br />
In the middle of the year one could<br />
hope as justified that the financial<br />
year will be poor, but the economic<br />
growth will remain though with the<br />
plus-sign. This hope fell apart in September,<br />
when the financial crisis having<br />
started from USA hit the world.<br />
The latter soon became the economic<br />
crisis and spread as wildfire over the<br />
world.<br />
The world’s financial collapse and abrupt increase<br />
in distrust hit Estonia at the bad time. In<br />
the first half of 2008 the after-effects of overheating<br />
of 2005-2006 still could be clearly felt –<br />
the volume of construction works decreased,<br />
the increase in loans stopped, the risk of unemployment<br />
weakened the future belief of the<br />
consumers and thus also decreased the demand.<br />
The capital of many companies was<br />
stuck under the real estate, the growth in unsold<br />
inventories caused difficulties in continuation<br />
of production. The way out was seen in the<br />
development of export which had to make up<br />
the reversion of the domestic market. The<br />
global economic crisis though decreased the<br />
demand at the Estonian traditional foreign markets.<br />
The banking crisis worsened the work of<br />
commercial banks. In co-impact of own and<br />
global problems the Estonian economy was in<br />
the deep crisis in the second half-year.<br />
Now more in detail about everything. In 2008<br />
the gross domestic product (GDP) decreased by<br />
3.6% in fixed prices and made 248.1 billion<br />
kroons in current prices (the increase in current<br />
prices was 9.2 billion kroons, i.e. 3.7%). The<br />
economic situation worsened quarter by quarter:<br />
I q – increase 0.2%, II q – decrease 1.1%,<br />
III q – decrease 3.5% and IV q – decrease 9.7%<br />
(the decrease of 0.5% of I half-year, 6.7% of<br />
II half-year). The negative impacts of global financial<br />
crisis on GDP (in sum) were the highest<br />
in industry, trade and transport-warehousing.<br />
The calculation of GDP based on the consumption<br />
method indicates that the domestic demand<br />
decreased by 4.6%, the private consumption of<br />
which 4.0% and investments 8.6%. 28.4% of the<br />
created added value was invested and 54.8% was<br />
consumed by the households.<br />
Regardless of the economic recession the number<br />
of the employed as the annual average did<br />
not decrease, but even increased by one thousand.<br />
The average number of the employed was<br />
656.6 thousand people and was quite even all<br />
the year round. The number of the employed<br />
still in IV quarter was 652.6 thousand people.<br />
Probably the companies waited for the more<br />
favourable economic development up to the last<br />
chance and did not hurry with the redundancy of<br />
the people. Even in construction the number of<br />
employees was still 77.7 thousand in the second<br />
half of 2008, which is just 8.2 thousand less<br />
than during the boom. The registered unemployed<br />
stayed in I half-year within 16-17 thousand<br />
people, but increased in II half-year each<br />
month and reached 30.4 thousand in December.<br />
The unemployment rate as the annual average<br />
made 5.5%, being 0.8% higher than in 2007.<br />
During the whole year the increase in consumer<br />
prices was in the centre of attention of the economic<br />
analysts which considerably exceeded the<br />
expectations. The annual level of inflation was<br />
10.4% which is the highest of the last ten years.<br />
The matter is more curious as this is the year of<br />
economic recession. High inflation can be partly<br />
explained with the rise in world market prices of<br />
some raw materials and energy carriers, rise in<br />
prices of labour in Estonia and increase of several<br />
excises. The essential reason is also the insufficient<br />
competition at the domestic market<br />
which enabled the companies to increase the<br />
prices without worrying about their position at<br />
the market. The fast rise in price “ate” the rise<br />
86
Photo: Tuulum<br />
in salary and made the real growth of economy<br />
negative. In 2008 the food products and residential<br />
expenses (14.4% and 15.8% respectively) had<br />
the faster rise in prices than average.<br />
The goods export increased in 2008 in the nominal<br />
price by 5.5% and reached 132.5 billion<br />
kroons. The growth remained smaller than expected<br />
and this also partly due to the world’s<br />
economic crisis. On the other hand, the rise in<br />
price of labour and others caused the rise in<br />
price of export (export price index 4.2%) which<br />
decreased our competitiveness at the foreign<br />
markets. The companies of the processing industry<br />
exported 54% of its production which is<br />
3% points less than in 2007. The goods were exported<br />
to 160 countries, whereby the main target<br />
countries were still Finland, Sweden and<br />
Russia. The percentage of the countries of the<br />
European Union in export was 70%. The export<br />
of goods was greatly based on the imported raw<br />
material and half-products which is proven by<br />
the fact that the major export group was again<br />
the plant and equipment, by making about one<br />
fifth of the export sales.<br />
The goods import in 2008 made total of 169.9 billion<br />
kroons by decreasing 4.9% compared to the<br />
previous year (in nominal prices). Thanks to the<br />
de crease of import the balance sheet of the trade<br />
in goods considerably improved which has been<br />
in big minus through the years. Now the deficit<br />
made 37.4 billion kroons which is lower of the<br />
record of 2007 by 15.8 billion kroons. The highest<br />
negative balance sheet was in the trade of mineral<br />
products (about 12 billion kroons). At the same<br />
time the highest positive balance was in the trade<br />
of wood and wood products (about 7 billion EEK).<br />
The balance sheet of services was traditionally<br />
positive in 2008, whereby both export and import<br />
increased. The services were exported for<br />
55 billion kroons (in 2007 50 billion kroons) and<br />
imported for 38 billion kroons (in 2007 35 billion<br />
kroons). The positive balance sheet of services<br />
decreased in its turn the chronic deficit of current<br />
account which now made 23.4 billion<br />
kroons, i.e. 9.4% as to the GDP (in 2007 43.5 billion<br />
kroons and 18.2%).<br />
The fast increase in salaries in 2007 (20.5%) expressed<br />
the after-effect also on the salary of<br />
2008 (adjustment between the fields of activities).<br />
Regardless of the economic recession the<br />
average salary increased to 12 818 kroons according<br />
to the initial data, i.e. 13.1%. The 10.4%<br />
rise in consumer prices also had some impact<br />
on the faster rise in price than labour productivity.<br />
As a result of the latter the real salary increased<br />
by “only“ 2.7% (13% in 2007).<br />
The real estate market had the major fall already<br />
in 2007 (the number of transactions fell<br />
by 17%) which promised to hope that in 2008 we<br />
can already talk about the stabilization of the<br />
market. This was not the case and now we can<br />
state that the bottom was still far in IV quarter<br />
of 2007. The economic crisis also surely added<br />
to the continuing fall. In the year ended 34.4<br />
thousand notarised real estate transactions<br />
were concluded with the total cost of 33.9 million<br />
kroons. It should be noted that in 2006 and<br />
2007 60.2 and 50 thousand transactions were<br />
concluded respectively. Thus the shrinking of<br />
the real estate market in 2008 was even more<br />
intensive than in 2007. The latter is confirmed<br />
also by changing of the average cost of real<br />
estate transaction – if in 2007 this was 1170<br />
thousand kroons, then in 2008 985 thousand<br />
kroons, i.e. 16% less (in 2007 the fall in the cost<br />
was 4.5%).<br />
The expansion of the loan market continued in<br />
2008, but considerably slower than in 2007. The<br />
total loan portfolio of the commercial banks was<br />
260.1 billion kroons at the year end, by increasing<br />
20.6 billion kroons, i.e. 8.6% with a year. A<br />
year earlier the relevant numbers were 62 billion<br />
kroons and 35%. The best times of expansion<br />
of the loan market had passed this time.<br />
The loan balance of the citizens (without leasing)<br />
increased 120.7 billion kroons by the year<br />
end, being 109 billion kroons a year earlier. The<br />
loan growth decreased approximately three<br />
times compared to 2007 (28 billion kroons). In<br />
the year ended the deposits of the citizens increased<br />
6.1 billion kroons in the banks and<br />
made total of 59.8 billion kroons at the year end.<br />
The deposits of the citizens make about half of<br />
their loan portfolio and 2/3 of their annual salary<br />
fund.<br />
The activities of the companies in 2008 are described<br />
by the following data: industrial production<br />
(volume index) fell by 6.5%, retail of<br />
goods (volume index) decreased by 3% and the<br />
cost of construction works carried out with own<br />
forces in current price decreased by 9.1%. As to<br />
the industry and trade the second half-year was<br />
considerably worse than the first.<br />
It could be added that the balance of payments<br />
of 2008 with 10.3 billion kroons and the state<br />
budget with 5.2 billion kroons remained in<br />
minus.<br />
87
ASSESSMENTS OF<br />
INTERNATIONAL RATING<br />
AGENCIES TO ESTONIA<br />
(as at 31 March 2009)<br />
• International competitiveness rating<br />
(Institute for Management Development, Lausanne)<br />
23rd place in the comparison of 55 countries. The rating describes the<br />
Estonian business environment, export capacity, openness, development of<br />
infrastructure. Compared to the last year the rating has fallen by one place.<br />
• Global competitiveness rating<br />
(World Economic Forum, Geneva)<br />
32nd place in the comparison of 134 countries. The rating describes the<br />
state’s capability to guarantee the sustainable economic growth in the<br />
medium long period. The latter is based on the information which describes<br />
the state’s development phase depending on whether the development<br />
is carried out based on resources, technology or innovation.<br />
Compared to the last year the rating has fallen by 5 places.<br />
• International human development index<br />
(UNO)<br />
42nd place in the ranking of 179 countries. The index considers the educational<br />
level, age, economic development level of citizens etc. Compared<br />
to the year 2007 the rise is by 2 places.<br />
• International index of economic freedom<br />
(The Heritage Foundation)<br />
12th place in the comparison of 162 countries. No changes with a year. The<br />
basis of assessment is the commercial policy, national intervention, financial<br />
policy, percentage of black market in economy etc.<br />
• International corruption index<br />
(Transparency International)<br />
27th place in the ranking of 180 countries. The corruption is the lowest in<br />
the country at the first place. A year ago the Estonian position was worse<br />
by one place.<br />
• International rating describing the capability of fulfilment<br />
of the long-term foreign obligations<br />
(Standard & Poors)<br />
A/A–1. The basis is the structural reforms carried out in the country, volume<br />
of direct investments, fiscal and financial policy. The rating “A“ means<br />
that the state is totally reliable.<br />
• International information technology index<br />
(World Economic Forum)<br />
18th place in the comparison of 134 countries. The basis is the use of IT in<br />
promoting the state economy. Compared to the last year Estonia has risen<br />
by two places.<br />
• Bertelsmann’s transformation index<br />
(Bertelsmann Media Worldwide)<br />
Estonia has the 3rd place among 125 countries. It describes the development<br />
of the market economy and democracy in the country through the<br />
speed and effectiveness of such reforms. The place of Estonia has not<br />
changed within the last year.<br />
• Tourism competitiveness index<br />
(World Economic Forum)<br />
Estonia has the 27th place among 133 countries. The index considers the<br />
governing security in the state, transport and IT infrastructure, natural and<br />
cultural resources, health and hygiene conditions. Estonia has fallen by<br />
one place within the last year. •<br />
88
Photo: Allan Alajaan
Copywriters:<br />
Estonian Chamber of Commerce and Industry<br />
Piret Salmistu – piret@koda.ee<br />
Kadri Liimal – kadri@koda.ee<br />
Phone: +372 604 0060<br />
Enterprise Estonia<br />
Jüri Luud – jyri@eas.ee<br />
Phone: +372 627 9700<br />
Estonian Institute of Economic Research<br />
Marje Josing – marje@ki.ee<br />
Mati Reiman – mati@ki.ee<br />
Phone: +372 668 1242<br />
Articles:<br />
Kaileen Mägi – The articles about the winners of the<br />
Estonian Companies’ Competitiveness Ranking and<br />
the winner of Swedbank Special Award<br />
Toivo Tänavsuu, Eesti Ekspress – The articles about<br />
the winners of the Entrepreneurship Award and the<br />
Best Student Company<br />
Layout:<br />
Disainikorp<br />
Print:<br />
Kroonpress<br />
91