Sensors and Methods for Mobile Robot Positioning
Sensors and Methods for Mobile Robot Positioning
Sensors and Methods for Mobile Robot Positioning

Create successful ePaper yourself
Turn your PDF publications into a flip-book with our unique Google optimized e-Paper software.
192 Part II Systems <strong>and</strong> <strong>Methods</strong> <strong>for</strong> <strong>Mobile</strong> <strong>Robot</strong> <strong>Positioning</strong><br />
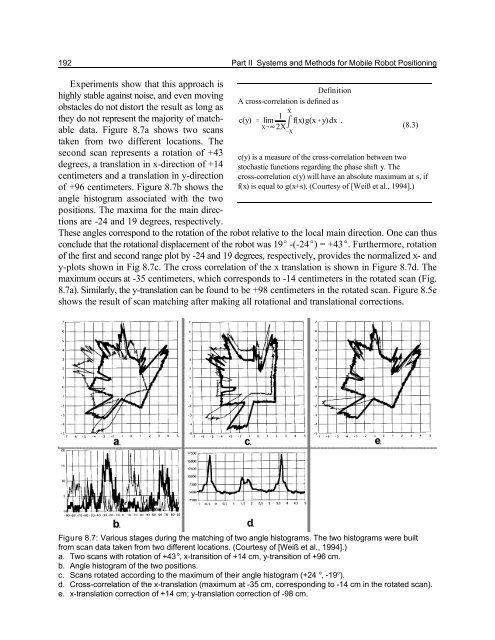
Experiments show that this approach is<br />
highly stable against noise, <strong>and</strong> even moving<br />
obstacles do not distort the result as long as<br />
they do not represent the majority of matchable<br />
data. Figure 8.7a shows two scans<br />
taken from two different locations. The<br />
second scan represents a rotation of +43<br />
degrees, a translation in x-direction of +14<br />
centimeters <strong>and</strong> a translation in y-direction<br />
of +96 centimeters. Figure 8.7b shows the<br />
angle histogram associated with the two<br />
positions. The maxima <strong>for</strong> the main directions<br />
are -24 <strong>and</strong> 19 degrees, respectively.<br />
Definition<br />
A cross-correlation is defined as<br />
X<br />
1<br />
c(y) ' lim f(x)g(x%y)dx .<br />
X64 2X m<br />
&X<br />
(8.3)<br />
c(y) is a measure of the cross-correlation between two<br />
stochastic functions regarding the phase shift y. The<br />
cross-correlation c(y) will have an absolute maximum at s, if<br />
f(x) is equal to g(x+s). (Courtesy of [Weiß et al., 1994].)<br />
These angles correspond to the rotation of the robot relative to the local main direction. One can thus<br />
conclude that the rotational displacement of the robot was 19E -(-24E) = +43E. Furthermore, rotation<br />
of the first <strong>and</strong> second range plot by -24 <strong>and</strong> 19 degrees, respectively, provides the normalized x- <strong>and</strong><br />
y-plots shown in Fig 8.7c. The cross correlation of the x translation is shown in Figure 8.7d. The<br />
maximum occurs at -35 centimeters, which corresponds to -14 centimeters in the rotated scan (Fig.<br />
8.7a). Similarly, the y-translation can be found to be +98 centimeters in the rotated scan. Figure 8.5e<br />
shows the result of scan matching after making all rotational <strong>and</strong> translational corrections.<br />
Figure 8.7: Various stages during the matching of two angle histograms. The two histograms were built<br />
from scan data taken from two different locations. (Courtesy of [Weiß et al., 1994].)<br />
o<br />
a. Two scans with rotation of +43 , x-transition of +14 cm, y-transition of +96 cm.<br />
b. Angle histogram of the two positions.<br />
o o<br />
c. Scans rotated according to the maximum of their angle histogram (+24 , -19 ).<br />
d. Cross-correlation of the x-translation (maximum at -35 cm, corresponding to -14 cm in the rotated scan).<br />
e. x-translation correction of +14 cm; y-translation correction of -98 cm.