Brochure for Olis RSM 1000 - Olis, Inc.
Brochure for Olis RSM 1000 - Olis, Inc. Brochure for Olis RSM 1000 - Olis, Inc.
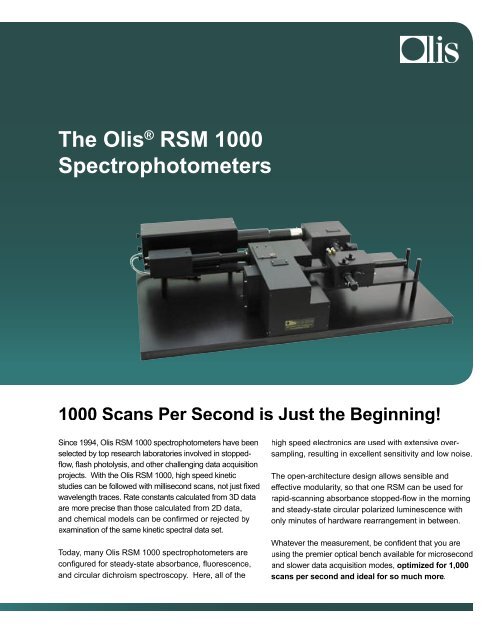
The Olis ® RSM 1000 Spectrophotometers 1000 Scans Per Second is Just the Beginning! Since 1994, Olis RSM 1000 spectrophotometers have been selected by top research laboratories involved in stoppedflow, flash photolysis, and other challenging data acquisition projects. With the Olis RSM 1000, high speed kinetic studies can be followed with millisecond scans, not just fixed wavelength traces. Rate constants calculated from 3D data are more precise than those calculated from 2D data, and chemical models can be confi rmed or rejected by examination of the same kinetic spectral data set. Today, many Olis RSM 1000 spectrophotometers are confi gured for steady-state absorbance, fl uorescence, and circular dichroism spectroscopy. Here, all of the high speed electronics are used with extensive oversampling, resulting in excellent sensitivity and low noise. The open-architecture design allows sensible and effective modularity, so that one RSM can be used for rapid-scanning absorbance stopped-fl ow in the morning and steady-state circular polarized luminescence with only minutes of hardware rearrangement in between. Whatever the measurement, be confident that you are using the premier optical bench available for microsecond and slower data acquisition modes, optimized for 1,000 scans per second and ideal for so much more.
- Page 2 and 3: A Breakthrough Monochromator is the
- Page 4 and 5: Only Desirable Optical Characterist
- Page 6 and 7: Absorbance Absorbance is the easies
- Page 8 and 9: Circular Dichroism This model is ge
- Page 10 and 11: What Benefits Does Rapid-scanning B
- Page 12 and 13: Collect Data How Does One Handle Me
- Page 14 and 15: With an Olis ® RSM 1000, you will
- Page 16: The OLIS RSM 1000 is a unique kinet
The <strong>Olis</strong> ® <strong>RSM</strong> <strong>1000</strong><br />
Spectrophotometers<br />
<strong>1000</strong> Scans Per Second is Just the Beginning!<br />
Since 1994, <strong>Olis</strong> <strong>RSM</strong> <strong>1000</strong> spectrophotometers have been<br />
selected by top research laboratories involved in stoppedflow,<br />
flash photolysis, and other challenging data acquisition<br />
projects. With the <strong>Olis</strong> <strong>RSM</strong> <strong>1000</strong>, high speed kinetic<br />
studies can be followed with millisecond scans, not just fixed<br />
wavelength traces. Rate constants calculated from 3D data<br />
are more precise than those calculated from 2D data,<br />
and chemical models can be confi rmed or rejected by<br />
examination of the same kinetic spectral data set.<br />
Today, many <strong>Olis</strong> <strong>RSM</strong> <strong>1000</strong> spectrophotometers are<br />
confi gured <strong>for</strong> steady-state absorbance, fl uorescence,<br />
and circular dichroism spectroscopy. Here, all of the<br />
high speed electronics are used with extensive oversampling,<br />
resulting in excellent sensitivity and low noise.<br />
The open-architecture design allows sensible and<br />
effective modularity, so that one <strong>RSM</strong> can be used <strong>for</strong><br />
rapid-scanning absorbance stopped-fl ow in the morning<br />
and steady-state circular polarized luminescence with<br />
only minutes of hardware rearrangement in between.<br />
Whatever the measurement, be confident that you are<br />
using the premier optical bench available <strong>for</strong> microsecond<br />
and slower data acquisition modes, optimized <strong>for</strong> 1,000<br />
scans per second and ideal <strong>for</strong> so much more.
A Breakthrough<br />
Monochromator<br />
is the Center of<br />
all <strong>Olis</strong> <strong>RSM</strong> <strong>1000</strong><br />
Spectrophotometers<br />
The patented DeSa 2 monochromator spends all<br />
day long scanning 1,000 times per second over a<br />
spectral range in the UV, Visible, or NIR region with<br />
milliabsorbance sensitivity and absolute reproducibility.<br />
All optics are fixed in position. Scanning is effected by<br />
moving a (narrow) slit across an (25 mm) aperture at the<br />
intermediate plane of the double grating monochromator.<br />
This mode of scanning is possible only with a<br />
“subtractive” double grating monochromator.<br />
In addition to millisecond spectral scanning, the DeSa<br />
“Subtractive Double Grating Monochromator with<br />
Moving Intermediate Slit” 1 produces a homogeneous<br />
output beam, very low stray light, very high<br />
photometric precision and accuracy, and a dark<br />
reading between every scan.<br />
The ScanDisk has 16 slits and<br />
spins at 62.5 Hz to achieve the<br />
<strong>1000</strong> scans per second.<br />
(16 * 62.5 = <strong>1000</strong>)<br />
Slits are spaced to allow a<br />
50 microsecond dark period<br />
between each scan.<br />
25 mm<br />
1<br />
US Patent 5,285,254, issued February 8, 1994.<br />
2<br />
DeSa, originally de Sá, is the family name of Dr. Richard J. DeSa, and<br />
retains the Portuguese pronunciation (approximately, di Sah or day Sah).<br />
2
Unique Scanning<br />
Mechanism is<br />
Responsible<br />
As a double monochromator, the DeSa has three slits:<br />
an entrance, intermediate, and exit. Entrance and exit<br />
slits could be any width, often 1.24 mm or less.<br />
(housed within ScanDisk)<br />
Our innovation is to house the intermediate slit in a<br />
motorized “ScanDisk.” The 0.2 or 1 mm slit version<br />
is on the left; the spoke version is shown at right. A<br />
SpokeDisk is available to realize the Fellgett effect.<br />
With the lid of the monochromator removed, one<br />
can see the 25 mm aperture at the midplane of the<br />
monochromator where the intermediate slit blocks<br />
all of the light except that behind the slit itself (photo<br />
on facing page shows the light passing through the<br />
intermediate slit).<br />
When rapid-scanning is not needed, one inserts<br />
a ‘SlitDisk’ which does not spin but which houses<br />
a single slit of chosen width, fi xed in position.<br />
Now 50 microsecond and slower kinetic traces<br />
can be collected at a single wavelength, 1 wherein<br />
‘scanning’ is simulated and/or done by instructing the<br />
monochromator to move the wavelength between<br />
collection of successive fi xed wavelength traces. 2<br />
1<br />
Acquisition rates to 20 MHz can be handled by the <strong>Olis</strong> <strong>RSM</strong><br />
<strong>1000</strong>, making it ideal <strong>for</strong> microsecond acquisition following<br />
laser fl ash photolysis, <strong>for</strong> instance.<br />
2<br />
Such cases are most common in circular dichroism, where<br />
one scans from 260 nm, where there are many photons, to<br />
below 180 nm, where photons are few.<br />
3
Only Desirable<br />
Optical<br />
Characteristics<br />
• The <strong>Olis</strong> <strong>RSM</strong> <strong>1000</strong> is a premium grade double<br />
monochromator <strong>for</strong> high resolution, high speed,<br />
high precision data acquisition.<br />
• All readings are dual beam, ensuring greatest<br />
noise reduction.<br />
One fi refl y, one second of data collection, and<br />
a little computation to produce an excellent<br />
emission spectrum from raw data comprised of<br />
three different amplitude fl ashes by the animal.<br />
The firefly was placed in the sample cuvette of<br />
the rapid-scan fluorimeter; it was considerably<br />
annoyed by this and flashed 3 times in rapid<br />
succession. <strong>1000</strong> scans captured the flashes.<br />
• The measuring beam is monochromatic, so<br />
that the sample sees only the light intended,<br />
protecting against unintentional sample<br />
photolysis. Rapid-scanning of highly photolabile<br />
samples such as B12 is successful.<br />
• The detectors are positioned millimeters from<br />
the sample, so that accurate readings on light<br />
scattering samples are achieved.<br />
• Detectors are chosen to optimize <strong>for</strong> the spectral<br />
range and data acquisition rate. Choices are<br />
photomultiplier tubes (PMTs), red-sensitive PMTs,<br />
InGaAs detectors, and photon counting detectors.<br />
• Xenon arc lamps of 75, 150, and 450 watt provide<br />
brilliant light throughput across the entire UV/Vis/<br />
NIR regions.<br />
• Gratings are chosen to optimize <strong>for</strong> any spectral<br />
range and spectral resolution. Gratings are easily<br />
accessed, making it practical to change them<br />
between measurements.<br />
The kinetics of the fl ashes cannot be fi tted, but<br />
one can do SVD and a simple fi t (e.g., A→.... )<br />
to construct of the emission spectrum.<br />
Add the step digital fi ltering (modern smoothing)<br />
to achieve the correct emission spectrum<br />
shown above.<br />
These data illustrate millisecond spectral<br />
scanning, in a low light situation, with sharp<br />
spectral resolution. There is no other technology<br />
instrument which can match this per<strong>for</strong>mance.<br />
• Millisecond emissions scans of low light level<br />
signals are exclusively possible with the<br />
fl uorescence-optimized <strong>Olis</strong> <strong>RSM</strong> <strong>1000</strong> series.<br />
• The entrance and exit positions of the DeSa<br />
monochromator are reversible, such that the<br />
sample can be the source of illumination.<br />
• Ports are available to mount a laser, fl ash lamp, or<br />
other actinic source at the sample.<br />
• Effectively any sample holder can be added<br />
directly or with a custom fi t.<br />
4
Research<br />
Spectrophotometers<br />
with the DeSa<br />
Monochromator<br />
Absorbance, fl uorescence, and<br />
circular dichroism spectrophotometers<br />
are created around the DeSa<br />
monochromator. Spectral range,<br />
spectral resolution, sensitivity, and<br />
other parameters differ <strong>for</strong> the three<br />
experimental cases. Mirrors, gratings,<br />
lamps, intermediate slits, detectors,<br />
and sample chambers are selected to<br />
optimize each <strong>Olis</strong> <strong>RSM</strong> <strong>1000</strong> <strong>for</strong> its<br />
mode of operation.<br />
<strong>Olis</strong> <strong>RSM</strong> <strong>1000</strong> <strong>for</strong> UV/Vis<br />
absorbance<br />
Accessories <strong>for</strong> stopped-fl ow are<br />
common, since the speed of a stoppedfl<br />
ow reaction is ideally suited to the<br />
millisecond spectral scan rate of the<br />
<strong>RSM</strong> <strong>1000</strong>. Flash photolysis, using<br />
lasers, LEDs, and pulse sources<br />
are equally suited to add to the<br />
spectrophotometer, with acquisition<br />
of microsecond data as successful as<br />
millisecond scans.<br />
The designed-in modularity means that<br />
one “model” can be reconfi gured by any<br />
interested party.<br />
A model in development in late 2006<br />
has two DeSa monochromators. One<br />
serves as the excitation monochromator<br />
and is equipped with a SweepDisk,<br />
which sweeps a 250 nm spectral width<br />
in one second (or slower). The other<br />
monochromator is confi gured to collect<br />
<strong>1000</strong> emission scans per second.<br />
By scanning both monochromators<br />
simultaneously, one obtains a matrix of<br />
<strong>1000</strong> emission scans, collected while<br />
the excitation wavelength is varied. This<br />
process can be repeated at rates to<br />
several Hz.<br />
<strong>Olis</strong> DSM <strong>1000</strong> CD with<br />
scanning emission module<br />
<strong>Olis</strong> <strong>RSM</strong> <strong>1000</strong> F4<br />
with stopped-flow<br />
5
Absorbance<br />
Absorbance is the easiest of the modes, due to the<br />
size of the signal. Millisecond scanning is nearly<br />
always practical. An intermediate slit of 0.2 or 1 mm<br />
is common. Gratings optimized <strong>for</strong> the UV, visible, or<br />
NIR are selected. Photomultiplier tubes provide sensitivity<br />
and high-speed detection in the UV/Vis ranges.<br />
InGaAs detectors expand utility into the NIR region.<br />
Results provided by Dr. Robert Phillips of the<br />
University of Georgia. Shown above, nine scans<br />
of hundreds collected during 5 second stoppedfl<br />
ow reaction. Any wavelength from 600-300 nm<br />
can be extracted from scans; kinetics at 455 nm<br />
shown at right.<br />
All <strong>Olis</strong> <strong>RSM</strong> systems are mounted on 2” thick honeycombed<br />
breadboards. These anodized aluminum surfaces<br />
provide static and dynamic rigidity. The boards<br />
are 20 x 60” or 30 x 60”, depending on the hardware<br />
mounted.<br />
<strong>Olis</strong> <strong>RSM</strong> <strong>1000</strong><br />
Results provided by Dr. Jorge Colon of the<br />
University of Puerto Rico. Shown above, nine<br />
scans of hundreds collected during 5 second<br />
stopped-fl ow reaction. Any wavelength from 675-<br />
445 nm can be extracted from scans; kinetics at<br />
560 nm shown at right.<br />
<strong>Olis</strong> <strong>RSM</strong> <strong>1000</strong> with scanning<br />
emission module<br />
Results provided by Dr. Robert Blake of Xavier<br />
University. Shown above, nine scans of hundreds<br />
collected during 5 second stopped-fl ow reaction.<br />
Any wavelength from 625-400 nm can be extracted<br />
from scans; kinetics at 514 nm shown at right.<br />
The first four <strong>Olis</strong> <strong>RSM</strong> <strong>1000</strong>s<br />
were delivered in 1994, one <strong>for</strong><br />
laser photolysis and three <strong>for</strong><br />
stopped-flow studies.<br />
6
Fluorescence<br />
Fluorescence systems are the most variable of the<br />
three models, as there are more choices in lamps,<br />
detectors and detector positions, and excitation/<br />
emission monochromator combinations. “Fluorescence<br />
optimization” can involve as little as a different detector,<br />
perhaps a photon counter, to a second lamp, second<br />
monochromator, and additional detector. Often, two<br />
pairs of gratings are provided, one <strong>for</strong> broad resolution<br />
fluorescence and a second <strong>for</strong> high resolution<br />
absorbance. Shown are three configurations of the <strong>Olis</strong><br />
<strong>RSM</strong> <strong>1000</strong> as a spectrofluorimeter.<br />
The <strong>Olis</strong> <strong>RSM</strong> <strong>1000</strong> F1 uses a 150 watt<br />
Xenon arc lamp as the excitation source <strong>for</strong><br />
millisecond emission scanning. Absorbance<br />
readings are possible, but do not utilize the<br />
DeSa monochromator so rapid-scanning is not<br />
supported.<br />
<strong>Olis</strong> <strong>RSM</strong> <strong>1000</strong> F1<br />
The <strong>Olis</strong> <strong>RSM</strong> <strong>1000</strong> F4 is identical to the model<br />
F1, except the large 450 watt Xenon arc lamp<br />
replaces the 150 as the excitation source <strong>for</strong><br />
millisecond emission scanning. One does realize<br />
the expected 3-fold higher light throughput with<br />
this 3x larger excitation source.<br />
<strong>Olis</strong> <strong>RSM</strong> <strong>1000</strong> F4<br />
This version of an <strong>Olis</strong> <strong>RSM</strong> <strong>1000</strong> F4 has<br />
an additional lamp, which enters the DeSa<br />
monochromator so that millisecond absorbance<br />
scanning is possible. One will use one lamp<br />
and the appropriate detector(s) to collect either<br />
rapid-scanning absorbance or rapid-scanning<br />
fl uorescence with this model.<br />
<strong>Olis</strong> <strong>RSM</strong> <strong>1000</strong> F4 with dual beam<br />
absorbance module<br />
7
Circular Dichroism<br />
This model is generally identifi ed as the <strong>Olis</strong> DSM<br />
<strong>1000</strong> CD, as it rarely retains the “rapid-scanning<br />
mode” but instead becomes a ‘Digital Subtractive<br />
Method’ CD spectrophotometer.<br />
Protein spectrum ready <strong>for</strong> secondary<br />
structure determination<br />
Circular dichroism of proteins is done in the 260-180<br />
nm regions and rapid-scanning across this range<br />
is impractical. There are too few photons. And,<br />
even more critically, there is much more light at one<br />
end of the span than the other. 1 Sweeping a span<br />
of ‘bright’ to ‘very dim’ in a millisecond is less than<br />
optimal. Thus, effectively all CDs utilizing the DeSa<br />
monochromator use the SlitDisk.<br />
Everything about the system is ideal <strong>for</strong> CD: highest<br />
sensitivity, highest light throughput, and broadest<br />
dynamic range of any CD yet made. The high-speed<br />
electronics are used to collect one million dual<br />
beam data points per second. Typically, under 0.5<br />
seconds per point is adequate <strong>for</strong> low noise data<br />
above 195 nm; below this threshold, the software<br />
progressively spends more time per point to<br />
maintain best RMS noise.<br />
“Digital Subtractive Method” CD spectroscopy is<br />
exclusive to <strong>Olis</strong>, <strong>Inc</strong>., and secures error-proof<br />
CD data acquisition: no calibration and no lock-in<br />
amplifi er settings mean no potential <strong>for</strong> uncorrectable<br />
systematic error. 2<br />
NIR CD scan of nickel tartrate<br />
1<br />
While this ‘very bright’ to ‘very dim’ situation is most<br />
egregious in CD, it might occur in fluorescence and<br />
absorbance, too. ‘Normal’ spectrophotometers handle<br />
this situation by adjusting the high voltages to the<br />
detectors or the slit widths durring the scan. In one<br />
millisecond, there is time <strong>for</strong> neither adjustment.<br />
However, when the <strong>RSM</strong> is fitted with the SlitDisk,<br />
adjusting the high volts is done, and the <strong>RSM</strong> acts like a<br />
‘normal’ spectrophotometer.<br />
2<br />
Request the DSM CD brochure <strong>for</strong> details.<br />
The <strong>Olis</strong> DSM <strong>1000</strong> CD is one of three DSM CDs<br />
offered by <strong>Olis</strong>, <strong>Inc</strong>., and is the premium model, offering<br />
higher light throughput and faster scanning than all CDs<br />
by any manufacturer. Under ideal conditions, up to 62<br />
CD scans per second can be acquired!<br />
8
Spectral and<br />
Detection Ranges<br />
The spectral range of the DeSa monochromator is<br />
fi xed by the blaze wavelength of the 50 mm 2 gratings. 1<br />
The detection range of the spectrophotometer is<br />
determined by the detectors, either photomultiplier<br />
tubes, useful from the lowest wavelengths to<br />
approximately 1100 nm, or InGaAs detectors, useful<br />
from around 600 nm to as far as 2500 nm.<br />
Gratings are accessed through ‘trapdoors’ on the lid<br />
of the DeSa monochromator. With the lid removed,<br />
the grating can be lifted out and replaced with<br />
another. The mountings are cemented in place.<br />
The gratings are locked into position with a simple<br />
mechanical arm which swings into position.<br />
Considerations For Choosing Gratings For The <strong>RSM</strong><br />
The span provided by the gratings you choose is<br />
spread across the 25-mm ScanDisk aperture. The<br />
greater the number of lines in the grating, the fewer<br />
the number of wavelengths that will be projected at<br />
the aperture, i.e., the better the resolution.<br />
Aperture of Scan, Slit, or SpokeDisk<br />
25 mm<br />
White light enters the fi rst<br />
mono and is dispersed<br />
into a spectrum, which is<br />
then directed into mono<br />
2 through the 25 mm<br />
aperture.<br />
View through the<br />
25 mm aperture as<br />
the SlitDisk is being<br />
withdrawn. (See page<br />
3 <strong>for</strong> view from mono<br />
2 without a Disk in<br />
place.)<br />
9<br />
1<br />
Refer to page 15 <strong>for</strong> a selection of commonly used gratings.
What Benefits Does<br />
Rapid-scanning Bring<br />
to Kinetic<br />
Experiments?<br />
3D presentation of all raw data from one<br />
experiment<br />
Single wavelength analysis is often incomplete and<br />
incorrect. With multiple wavelength data, one has<br />
a “movie” of a kinetic process with ‘frames’ every<br />
one millisecond. Having this real-time record of<br />
the reaction allows one to make conclusions about<br />
the chemistry as well as the rates. And the rate<br />
constants will be known with higher precision.<br />
But collecting suffi cient data <strong>for</strong> multi-wavelength<br />
analysis with a fi xed wavelength kinetic spectrophotometer<br />
can take considerable ef<strong>for</strong>t and sample.<br />
At left, we see what benefi ts rapid-scanning<br />
brings. The fi rst graph shows the raw data from<br />
one stopped-fl ow shot. The second graph shows<br />
the same data in a 2D display. A kinetic trace,<br />
as shown in the right-hand graph, can be pulled<br />
from any of the hundreds of wavelengths of the<br />
kinetically acquired scans. One places his cursor<br />
on the wavelength in the spectral plot and out pops<br />
the kinetic trace at that wavelength. And, using the<br />
‘dynamic’ setting, one can scan along the kinetic<br />
trace and watch the chemistry change with time.<br />
2D presentation of select raw data from same<br />
experiment<br />
The third graph shows the raw data from two stoppedfl<br />
ow shots taken in a traditional fi xed wavelength<br />
mode. Twice as much sample was used <strong>for</strong> these two<br />
kinetic traces as was used <strong>for</strong> the far more in<strong>for</strong>mative<br />
multiple wavelength data!<br />
<strong>Olis</strong> <strong>RSM</strong> <strong>1000</strong> systems can achieve precisely such<br />
millisecond results in fl uorescence, too, as well<br />
as NIR absorbance and fl uorescence, and (under<br />
certain conditions) in CD, CPL, and FDCD.<br />
2D presentation of results from two fixed<br />
wavelength experiments<br />
10
What Alternatives to<br />
the <strong>Olis</strong> <strong>RSM</strong> <strong>1000</strong><br />
Are There?<br />
The alternative equipment <strong>for</strong> multiple wavelength<br />
acquisition are diode array and CCD systems.<br />
These systems are inherently less sensitive 1 and<br />
often slower 2 than the <strong>Olis</strong> <strong>RSM</strong> <strong>1000</strong> line. They<br />
have limited utility in the UV and NIR, and they are<br />
useless in low light level situations. They cannot<br />
work with turbid nor photolabile samples. And diode<br />
array and CCD systems cannot be enhanced to<br />
support fl uorescence or circular dichroism.<br />
Diode array spectrophotometers are heralded as<br />
modern, neat, all-electronic, no-moving-parts,<br />
etc. They are. However, use of them is limited to<br />
absorbance readings on non-photolabile samples<br />
within an approximate 200-900 nm range, wherein<br />
under ten scans per second is suffi cient. And even<br />
in these cases, one will have less confi dence in<br />
the photometric accuracy of the collected spectral<br />
in<strong>for</strong>mation than with the premium per<strong>for</strong>mance <strong>Olis</strong><br />
<strong>RSM</strong> <strong>1000</strong> spectrophotometer.<br />
Scans collected at the fastest acquisition rate<br />
from an <strong>Olis</strong> computerized HP 8452 diode<br />
array. 100 scans over a 100 nm span with 2<br />
nm resolution took 108.3 seconds to collect.<br />
During this time, the <strong>Olis</strong> <strong>RSM</strong> <strong>1000</strong> could<br />
have acquired <strong>1000</strong> * 108.3, or 108,300<br />
scans of a 50, 230, or even a 500 nm span<br />
with 0.5 or better resolution. (This reminder<br />
helps to explain the cost difference between<br />
the technologies, too!)<br />
1<br />
A photomultiplier tube is 100-fold more sensitive than a<br />
diode array detector<br />
2<br />
When rapid-scanning, the maximum data acquisition rate<br />
of an <strong>Olis</strong> <strong>RSM</strong> <strong>1000</strong> is one scan per one millisecond.<br />
When rapid-scanning is not employed, the maximum<br />
data acquisition is limited by the 20 MHz A/D card or<br />
the optional digital oscilloscope, which could have<br />
nanosecond acquisition rates.<br />
11
Collect Data<br />
How Does One<br />
Handle Megabyte<br />
Data Files?<br />
Extraordinary ef<strong>for</strong>t and years of cutting-edge<br />
software development was undertaken to “deal<br />
with all the data your machine will vomit at the<br />
poor scientist.” 1<br />
Apply SVD<br />
Choose Fit From Two Species Mechanisms<br />
Today’s <strong>Olis</strong> SpectralWorks software handles<br />
megabyte data fi les as ef<strong>for</strong>tlessly as the best<br />
alternative programs handle a single scan or<br />
trace. Fitting of millions of data points takes the<br />
<strong>Olis</strong> software a second. Plotting of hundreds of<br />
thousand points takes a second. Truly, the number<br />
crunching and popping up 3D data sets happens<br />
effectively instantaneously.<br />
Moving from the raw data to the fi nal answer takes<br />
only two steps: SVD and Spectral Reconstruction<br />
using Matrix Exponentiation. The second panel, “Apply<br />
SVD,” shows the “eigenvectors” which are returned by<br />
Singular Value Decomposition. SVD fi nds the number<br />
of species in the raw data (here, two) and isolates the<br />
remaining in<strong>for</strong>mation, i.e., random noise. The third<br />
panel shows the chemical models <strong>for</strong> a two species fi t.<br />
An A → B mechanism was chosen. The fi nal panel is<br />
the fi tted results, giving the investigator not only rate<br />
constants but spectral in<strong>for</strong>mation about his reaction.<br />
This 250 millisecond protein unfolding study used data<br />
from one stopped-fl ow shot.<br />
Evaluate Results<br />
The unique <strong>Olis</strong> software<br />
executes these steps as quickly<br />
as the investigator makes his<br />
selections, that is, effectively<br />
instantaneously.<br />
1<br />
This comment made to Richard DeSa by his post-doctoral advisor,<br />
Prof Quentin H. Gibson, during a personal correspondence in the<br />
early 1990s. As DeSa loves to point out, part of Gibson’s genius<br />
is the ability to see through issues to their kernel. Without this<br />
software, an <strong>Olis</strong> <strong>RSM</strong> <strong>1000</strong> would instantly overwhelm both the<br />
hard-drive and the investigator! (Along with being the first step in<br />
global analysis, SVD reduces the size of the file 40-fold.)<br />
12
Using a Standard to<br />
Illustrate the Absence<br />
of Bias in the Fitting<br />
Algorithms.<br />
Collect Data<br />
Using the <strong>Olis</strong> <strong>RSM</strong> <strong>1000</strong> in its fl uorescence<br />
mode, 50 scans were collected in 0.05 seconds<br />
from light emitted by overhead fl uorescent lamps.<br />
The mercury lines and the 120 Hz modulation of<br />
the lamp are easily identifi ed in the eigenvectors<br />
(second panel) and the answer (fi nal graphs).<br />
SVD identifi ed the changes in the light caused by the<br />
lamp’s on/off operation at 60 Hz, and the spectrum of<br />
the light (a continuum with sharp Hg emission lines).<br />
SVD acts with no bias about the source of the data,<br />
chemical, kinetic, thermal, or other process.<br />
SVD: Single species<br />
Apply SVD<br />
Since user starting values<br />
are only used <strong>for</strong> the most<br />
complicated cases, bias cannot<br />
be entered during the fit, either.<br />
Choose Fit From One Species Mechanisms<br />
Kinetic Fit: Select 1 species and then fit single rate<br />
so as to construct the spectrum<br />
Mechanism: Not a kinetic process<br />
Comments: Fluorescent lights switching on and off<br />
at 120 Hz, demonstration of a particular shape (the<br />
spectrum) varying in a particular way (sinusoidal).<br />
The eigenvectors are presented in the way shown to<br />
emphasize that the kinetic and spectral eigenvectors<br />
are related. One reads the display by noting that the<br />
kinetic eigenvectors show a particular time course and<br />
that it is the corresponding spectral eigenvector which<br />
varies in that way.<br />
Evaluate Results<br />
File: p05_120h.sc3 1<br />
1<br />
These data, as with all data shown in this brochure, are provided <strong>for</strong><br />
pedagogical, demonstration, and testing purposes in the <strong>Olis</strong> GlobalWorks<br />
software.<br />
13
With an <strong>Olis</strong> ®<br />
<strong>RSM</strong><br />
<strong>1000</strong>, you will get<br />
perfectly reliable and<br />
reproducible results,<br />
quickly, easily,<br />
economically, and<br />
in a wide range of<br />
experimental cases.<br />
Holmium Oxide Filter<br />
One Millisecond Per Scan<br />
While the <strong>Olis</strong> <strong>RSM</strong> <strong>1000</strong> is collecting 1,000 scans<br />
per second, its dual beam, double grating hardware<br />
is supporting milliabsorbance sensitivity. This one<br />
millisecond scan of a holmium oxide fi lter can be<br />
compared with the data on page 11. Notice that<br />
the <strong>RSM</strong> can scan a wider spectral range and still<br />
maintain better spectral resolution.<br />
And, the <strong>RSM</strong> spent 0.001 seconds, not 0.1 second.<br />
The <strong>RSM</strong> is “orders of magnitude” better than a diode<br />
array detector.<br />
0.001 AU RMS Noise in 0.5 Milliseconds<br />
Recall that S/N improves as a square root of the<br />
number of data fi tted. Noise in the fourth and fi fth<br />
decimal places, as is required <strong>for</strong> circular dichroism<br />
work (<strong>for</strong> instance) is obtainable.<br />
Air-to-Air Baseline<br />
Better <strong>for</strong> So Many Cases<br />
Collect accurate absorbance readings on cytochromes,<br />
mitochrondia, tissue suspensions, and other scattering<br />
samples. (Dual wavelength is a subset of hundreds<br />
of wavelengths.) Use with photolabile samples,<br />
microvolume samples, changing samples, and always<br />
get better results than with alternative technologies.<br />
Turbid Sample Reading<br />
14
Optics, Detection,<br />
and Mathematics: the<br />
Complete Package<br />
Subnanometer resolution <strong>for</strong> highest<br />
resolution samples<br />
Select gratings <strong>for</strong> the DeSa monochromator to<br />
optimize <strong>for</strong> spectral range, resolution, and span.<br />
Gratings are accessed without tools or optical<br />
alignment, so that moving from one pair to another is a<br />
2-3 minute operation.<br />
MOST POPULAR GRATINGS FOR THE DESA MONOCHROMATOR 2<br />
Blaze<br />
Wavelength<br />
Ruling<br />
Density<br />
lines/mm<br />
Linear<br />
Dispersion<br />
nm/mm<br />
Resolution 1<br />
(0.2 mm slit)<br />
nm<br />
Wavelength<br />
Span<br />
nm<br />
Wavelength<br />
Range 2<br />
nm<br />
230 2400 1.54 0.3 38 150-350<br />
300 600 6.15 1.2 154 200-450<br />
500 400 9.22 1.8 231 330-750<br />
500 1200 3.07 0.6 77 330-750<br />
<strong>1000</strong> 600 6.15 1.2 154 670-1800<br />
1<br />
Resolution values based on nominal intermediate slit width of 0.2 mm.<br />
2<br />
Wavelength range based on a 2/3 blaze to 3/2 blaze.<br />
Monochromatic Illumination<br />
Gentle monochromatic light is<br />
used <strong>for</strong> all measurements, so that<br />
photolabile samples can be studied<br />
safely and successfully. Sample is<br />
measured only with the appropriate<br />
wavelengths: broadband light and<br />
stray light—inherent in diode array<br />
systems—are never a concern.<br />
Powerful Mathematics easily handle MB data files<br />
The software provided with each <strong>Olis</strong><br />
spectrophotometer handles up to 4000 scans of up to<br />
500 points per second more adroitly than commercial<br />
programs handle single scans. Equations available:<br />
60+ models <strong>for</strong> multiple wavelength (3D) data, 25+<br />
<strong>for</strong> 2D. The key behind this power is the trio of SVD,<br />
Downhill Simplex, and Matrix Exponentiation. 1<br />
1<br />
These remarkable algorithms are discussed in Methods in<br />
Enzymology, volume 384, 2004, chapters 1, 2, and 3.<br />
2<br />
See a much longer list of suitable gratings on our web site at http://<br />
olisweb.com/products/rsm/gratings.php.<br />
15
The OLIS <strong>RSM</strong> <strong>1000</strong> is a unique kinetics spectrometer that is capable of obtaining spectra over the<br />
visible range with millisecond time resolution using sensitive photomultipliers that permits the intensity of<br />
sample illumination to be minimal. Furthermore, extraction of meaningful kinetic data from the spectral<br />
noise through singular value decomposition is built into data collection and analysis and will allow us to<br />
monitor the very small optical absorption changes association with the oxidation and reduction of the<br />
monolayers of synthetic redox proteins that are a principal object of study of the MRSEC grant. There is<br />
no other commercial instrument that comes close to this combination of capabilities.<br />
Christopher Moser, Ph.D.<br />
Associate Director, Johnson Research Foundation<br />
January 22, 2003<br />
Your instrument, although designed <strong>for</strong> absorption spectra, was quickly modifi ed to measure the<br />
rapid fl ash produced. In our fi rst experiments we took a few micrograms of the modifi ed aequorin<br />
and triggered it. The individual 1 msec spectra looked awful, but the cumulative data showed the two<br />
emission peaks very clearly, with the correct positions <strong>for</strong> both aequorin and fl uorescein emission. Our<br />
subsequent rapid scanned stopped fl ow emission spectra of this transient signal showed how good<br />
the detection capabilities of the instrument are. We were looking at very small amounts of the protein<br />
and obtained individual 1 msec emission spectra with excellent S/N. In a few hours we obtained quality<br />
data and spectra that are publication quality. To anyone looking at low light level chemiluminescent<br />
or bioluminescent reactions, or wishing to obtain spectral and kinetic data on transient or precious<br />
biological samples the rapid scanner is a must. A wonderful instrument!!<br />
Russell Hart, D. Phil.<br />
Director of Clinical Assays<br />
March 31, 1993<br />
For more in<strong>for</strong>mation on this and other <strong>Olis</strong> products:<br />
Visit<br />
Write<br />
Call<br />
www.olisweb.com<br />
sales@olisweb.com<br />
1-800-852-3504 in the US & Canada<br />
1-706-353-6547 worldwide


