Notes to the Consolidated Financial Statements - Seylan Bank
Notes to the Consolidated Financial Statements - Seylan Bank
Notes to the Consolidated Financial Statements - Seylan Bank

You also want an ePaper? Increase the reach of your titles
YUMPU automatically turns print PDFs into web optimized ePapers that Google loves.
North Bound > <strong>Seylan</strong> <strong>Bank</strong> Annual Report 2011<br />
297<br />
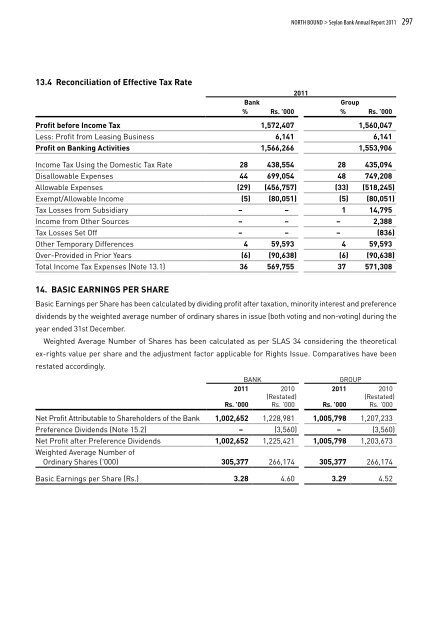
13.4 Reconciliation of Effective Tax Rate<br />
2011<br />
<strong>Bank</strong><br />
Group<br />
% Rs. ’000 % Rs. ’000<br />
Profit before Income Tax 1,572,407 1,560,047<br />
Less: Profit from Leasing Business 6,141 6,141<br />
Profit on <strong>Bank</strong>ing Activities 1,566,266 1,553,906<br />
Income Tax Using <strong>the</strong> Domestic Tax Rate 28 438,554 28 435,094<br />
Disallowable Expenses 44 699,054 48 749,208<br />
Allowable Expenses (29) (456,757) (33) (518,245)<br />
Exempt/Allowable Income (5) (80,051) (5) (80,051)<br />
Tax Losses from Subsidiary – – 1 14,795<br />
Income from O<strong>the</strong>r Sources – – – 2,388<br />
Tax Losses Set Off – – – (836)<br />
O<strong>the</strong>r Temporary Differences 4 59,593 4 59,593<br />
Over-Provided in Prior Years (6) (90,638) (6) (90,638)<br />
Total Income Tax Expenses (Note 13.1) 36 569,755 37 571,308<br />
14. Basic Earnings Per Share<br />
Basic Earnings per Share has been calculated by dividing profit after taxation, minority interest and preference<br />
dividends by <strong>the</strong> weighted average number of ordinary shares in issue (both voting and non-voting) during <strong>the</strong><br />
year ended 31st December.<br />
Weighted Average Number of Shares has been calculated as per SLAS 34 considering <strong>the</strong> <strong>the</strong>oretical<br />
ex-rights value per share and <strong>the</strong> adjustment fac<strong>to</strong>r applicable for Rights Issue. Comparatives have been<br />
restated accordingly.<br />
BANK<br />
GROUP<br />
2011 2010 2011 2010<br />
(Restated)<br />
(Restated)<br />
Rs. ’000 Rs. ’000 Rs. ’000 Rs. ’000<br />
Net Profit Attributable <strong>to</strong> Shareholders of <strong>the</strong> <strong>Bank</strong> 1,002,652 1,228,981 1,005,798 1,207,233<br />
Preference Dividends (Note 15.2) – (3,560) – (3,560)<br />
Net Profit after Preference Dividends 1,002,652 1,225,421 1,005,798 1,203,673<br />
Weighted Average Number of<br />
Ordinary Shares ('000) 305,377 266,174 305,377 266,174<br />
Basic Earnings per Share (Rs.) 3.28 4.60 3.29 4.52