The Personal Software Process (PSP) Tutorial - SIGAda
The Personal Software Process (PSP) Tutorial - SIGAda
The Personal Software Process (PSP) Tutorial - SIGAda
You also want an ePaper? Increase the reach of your titles
YUMPU automatically turns print PDFs into web optimized ePapers that Google loves.
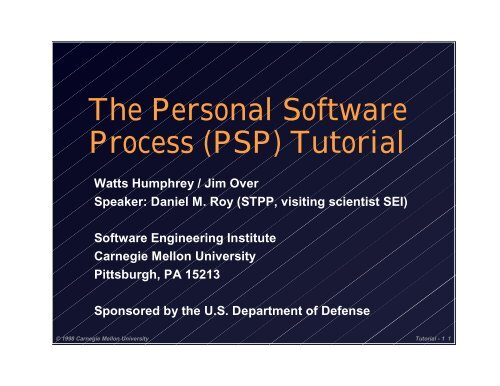
<strong>The</strong> <strong>Personal</strong> <strong>Software</strong><br />
<strong>Process</strong> (<strong>PSP</strong>) <strong>Tutorial</strong><br />
Watts Humphrey / Jim Over<br />
Speaker: Daniel M. Roy (STPP, visiting scientist SEI)<br />
<strong>Software</strong> Engineering Institute<br />
Carnegie Mellon University<br />
Pittsburgh, PA 15213<br />
Sponsored by the U.S. Department of Defense<br />
© 1998 Carnegie Mellon University <strong>Tutorial</strong> - 1 1
<strong>Tutorial</strong> Objectives<br />
To describe the personal software process<br />
(<strong>PSP</strong>)<br />
To show where and how the <strong>PSP</strong> can be used to<br />
improve individual software engineering<br />
performance<br />
To show how the <strong>PSP</strong> can enable software<br />
organizations to improve their capability<br />
To describe the status and plans for the <strong>PSP</strong><br />
© 1998 Carnegie Mellon University <strong>Tutorial</strong> - 1 2
<strong>Tutorial</strong> Agenda<br />
<strong>PSP</strong> Description<br />
• <strong>PSP</strong> overview<br />
• <strong>PSP</strong> processes<br />
• <strong>PSP</strong> planning and quality management<br />
<strong>PSP</strong> Introduction<br />
• course and industry data<br />
• introducing <strong>PSP</strong><br />
• <strong>PSP</strong> and process improvement<br />
© 1998 Carnegie Mellon University <strong>Tutorial</strong> - 1 3
<strong>The</strong> <strong>Software</strong> Problem -1<br />
All businesses are<br />
becoming software<br />
businesses.<br />
<strong>The</strong> business importance<br />
of software is increasing.<br />
• software is now the<br />
critical element in many<br />
products<br />
• software cycle time often<br />
exceeds hardware cycle<br />
time<br />
© 1998 Carnegie Mellon University <strong>Tutorial</strong> - 1 4
<strong>The</strong> <strong>Software</strong> Problem - 2<br />
<strong>Software</strong> quality limits our ability to field many<br />
critical systems.<br />
Poor software quality in fielded systems is<br />
expensive.<br />
• reduced customer satisfaction<br />
• delayed shipments<br />
• expensive service and enhancement<br />
• potential for accident or loss of life<br />
© 1998 Carnegie Mellon University <strong>Tutorial</strong> - 1 5
<strong>The</strong> <strong>Software</strong> Problem - 3<br />
It is now generally recognized that an effective<br />
way to improve the software business is by<br />
improving the development and maintenance<br />
processes.<br />
Organizational progress with process<br />
improvement is limited because<br />
• there is limited process improvement<br />
experience<br />
• process improvement takes time<br />
• process improvement efforts are hard to sell<br />
© 1998 Carnegie Mellon University <strong>Tutorial</strong> - 1 6
<strong>The</strong> <strong>Software</strong> Problem - 4<br />
<strong>The</strong> <strong>PSP</strong> addresses these problems by<br />
• providing convincing evidence of the benefits<br />
of process improvement<br />
• exposing the engineers to the benefits of<br />
using effective processes in their work<br />
• teaching the engineers effective process<br />
improvement methods<br />
• providing the historical data to better manage<br />
cost, schedule, and quality<br />
© 1998 Carnegie Mellon University <strong>Tutorial</strong> - 1 7
<strong>The</strong> <strong>PSP</strong> Paradigm<br />
<strong>The</strong> <strong>PSP</strong> is based on process improvement<br />
principles.<br />
• practitioners establish personal process goals<br />
• they define the methods they will use<br />
• they measure their work<br />
• they analyze the results<br />
• based on these analyses, they adjust their<br />
methods to better meet their personal goals<br />
© 1998 Carnegie Mellon University <strong>Tutorial</strong> - 1 8
<strong>The</strong> <strong>PSP</strong> Strategy<br />
Start with the engineer’s current process<br />
Gradually introduce new methods<br />
Practice these methods on module-sized<br />
programs<br />
<strong>The</strong> engineers then see for themselves how<br />
these methods help them.<br />
© 1998 Carnegie Mellon University <strong>Tutorial</strong> - 1 9
<strong>PSP</strong> Overview - 1<br />
<strong>The</strong> <strong>PSP</strong> is a process for individuals to use.<br />
It applies to most structured personal tasks.<br />
• writing small programs or documents<br />
• defining requirements or processes<br />
• conducting reviews or tests, etc.<br />
It is extendible to team development of largescale<br />
software systems.<br />
It is a SW CMM Level 5 process for individual<br />
engineers.<br />
© 1998 Carnegie Mellon University <strong>Tutorial</strong> - 1 10
<strong>PSP</strong> Overview - 2<br />
Individuals learn the <strong>PSP</strong> in 7 process steps.<br />
<strong>The</strong>y write 10 module-sized programs using<br />
these <strong>PSP</strong> steps.<br />
• they gather and analyze data on their work<br />
• based on these analyses they improve their<br />
working methods<br />
<strong>The</strong> <strong>PSP</strong> exercises provide the rapid feedback<br />
needed for effective learning.<br />
© 1998 Carnegie Mellon University <strong>Tutorial</strong> - 1 11
<strong>The</strong> <strong>PSP</strong> Course - 1<br />
<strong>The</strong> <strong>PSP</strong> is best introduced with a course<br />
format.<br />
Prerequisites<br />
• fluency with one programming language<br />
• basic understanding of programming design<br />
• mathematics through integral calculus<br />
Additional background is helpful.<br />
• statistics<br />
• project management<br />
• formal methods<br />
© 1998 Carnegie Mellon University <strong>Tutorial</strong> - 1 12
<strong>The</strong> <strong>PSP</strong> Course - 2<br />
Facilities required<br />
• personal computing capability<br />
• spreadsheet and database support<br />
• development environment<br />
Academic course<br />
• one semester workload<br />
• 15+ 90 minute lectures<br />
• laboratory time of 5+ hours per week<br />
• study time of 5+ hours per week<br />
© 1998 Carnegie Mellon University <strong>Tutorial</strong> - 1 13
<strong>The</strong> <strong>PSP</strong> Course - 3<br />
Industry course formats<br />
• two one-week courses with 20+ hours of post<br />
course homework per week<br />
• no homework format consisting of four<br />
sessions “3-4-3-4”<br />
• one day per week format<br />
• two day per week format<br />
© 1998 Carnegie Mellon University <strong>Tutorial</strong> - 1 14
<strong>The</strong> <strong>PSP</strong> Is an Evolving<br />
<strong>Process</strong><br />
<strong>PSP</strong>3<br />
Cyclic development<br />
Team<br />
<strong>Software</strong><br />
<strong>Process</strong><br />
<strong>PSP</strong>2<br />
Code reviews<br />
Design reviews<br />
<strong>PSP</strong>2.1<br />
Design templates<br />
<strong>PSP</strong>1<br />
Size estimating<br />
Test report<br />
<strong>PSP</strong>1.1<br />
Task planning<br />
Schedule planning<br />
<strong>PSP</strong>0<br />
Current process<br />
Basic measures<br />
<strong>PSP</strong>0.1<br />
Coding standard<br />
<strong>Process</strong> improvement<br />
proposal<br />
Size measurement<br />
© 1998 Carnegie Mellon University <strong>Tutorial</strong> - 1 15
<strong>The</strong> <strong>PSP</strong>0 <strong>Process</strong><br />
With <strong>PSP</strong>0, engineers use their current design<br />
and development methods.<br />
<strong>The</strong>y gather data on their work.<br />
• the time spent by phase<br />
• the defects found in compile and test<br />
<strong>The</strong>y analyze and report these data.<br />
© 1998 Carnegie Mellon University <strong>Tutorial</strong> - 1 16
<strong>The</strong> <strong>PSP</strong>0 <strong>Process</strong> Lessons<br />
With <strong>PSP</strong>0, engineers learn to use a basic<br />
personal process.<br />
• they gather data on their personal work<br />
• they learn how and why to measure the sizes<br />
of the products they produce<br />
• they gather baseline data on their personal<br />
processes<br />
© 1998 Carnegie Mellon University <strong>Tutorial</strong> - 1 17
<strong>The</strong> <strong>PSP</strong>1 <strong>Process</strong><br />
<strong>The</strong> <strong>PSP</strong>0 is augmented to include<br />
• coding standards<br />
• size estimating<br />
• resource estimating<br />
• schedule estimating<br />
• earned value tracking<br />
• process improvement proposal (PIP)<br />
• test report<br />
© 1998 Carnegie Mellon University <strong>Tutorial</strong> - 1 18
<strong>The</strong> <strong>PSP</strong>1 Lessons<br />
With <strong>PSP</strong>1, engineers estimate the sizes and<br />
development times of the products they<br />
produce.<br />
• they use their historical data to improve their<br />
estimates<br />
• they project the likely statistical ranges of<br />
their estimates and learn how to reduce these<br />
ranges<br />
© 1998 Carnegie Mellon University <strong>Tutorial</strong> - 1 19
<strong>The</strong> <strong>PSP</strong>2 and <strong>PSP</strong>3 Additions<br />
<strong>PSP</strong>1 is augmented to include<br />
• personal design and code reviews<br />
• yield and cost of quality measures<br />
• design completion criteria<br />
• design templates<br />
With <strong>PSP</strong>3, engineers see how to use the <strong>PSP</strong><br />
for larger scale work.<br />
• cyclic development<br />
• issue tracking log<br />
© 1998 Carnegie Mellon University <strong>Tutorial</strong> - 1 20
<strong>PSP</strong>2 and <strong>PSP</strong>3 Lessons<br />
With <strong>PSP</strong>2, engineers use their historical data to<br />
improve the quality of the program modules<br />
they produce.<br />
• they measure the efficiency of their defect<br />
removal methods<br />
• they use various process quality measures,<br />
including yield, COQ (cost of quality), and<br />
A/FR (appraisal/failure ratio)<br />
With <strong>PSP</strong>3, engineers learn how to adjust their<br />
personal processes for different types of work.<br />
© 1998 Carnegie Mellon University <strong>Tutorial</strong> - 1 21
<strong>The</strong> Basic <strong>PSP</strong> Elements<br />
A process script<br />
A project plan summary form<br />
A time recording log<br />
A defect reporting log<br />
A defect type standard<br />
© 1998 Carnegie Mellon University <strong>Tutorial</strong> - 1 22
<strong>Process</strong> Script<br />
Scripts guide the<br />
engineers through<br />
the process.<br />
• purpose<br />
• inputs required<br />
• process phases<br />
• exit criteria<br />
Phase<br />
Number Purpose: To guide you in developing module-level programs.<br />
Inputs Required • Problem description<br />
• <strong>PSP</strong> Project Plan Summary form<br />
• Historical estimated and actual size and time data<br />
• Time and Defect Recording Logs<br />
• Defect Type Standard<br />
• Stop watch (optional)<br />
1 Planning • Produce or obtain a requirements statement.<br />
• Estimate the total new and changed LOC required and<br />
the prediction interval..<br />
• Estimate the required development time and the<br />
prediction interval.<br />
• Produce a schedule plan (if more than a couple days).<br />
• Enter the plan data in the Project Plan Summary form.<br />
• Complete the Time Recording Log.<br />
2 Development • Design the program, using design templates where<br />
appropriate.<br />
• Review the design and fix and log all defects found.<br />
• Implement the design.<br />
• Review the code and fix and log all defects found.<br />
• Compile the program and fix and log all defects found.<br />
• Test the program and fix and log all defects found.<br />
• Complete the Time Recording Log.<br />
3 Postmortem Complete the Project Plan Summary form with actual<br />
time, defect, and size data.<br />
Exit Criteria • A thoroughly tested program<br />
• Completed Project Plan Summary with estimated and<br />
actual data<br />
• Completed design templates<br />
• Completed Design Review Checklist and Code Review<br />
Checklist<br />
• Completed Test Report Template<br />
• Complete PIP forms<br />
• Completed Defect and Time Recording Logs<br />
© 1998 Carnegie Mellon University <strong>Tutorial</strong> - 1 23
Project Plan Summary<br />
<strong>The</strong> project plan summary<br />
form holds<br />
• project plan data<br />
• actual project results<br />
- size<br />
- times<br />
- defect data<br />
• cumulative data on all<br />
<strong>PSP</strong> projects to date<br />
<strong>PSP</strong>2.1 Project Plan Summary<br />
Student<br />
Date<br />
Program Program #<br />
Instructor<br />
Language<br />
Summary Plan Actual To Date<br />
LOC/Hour<br />
Actual Time<br />
Planned Time<br />
CPI(Cost-Performance Index)<br />
(Actual/Planned)<br />
% Reuse<br />
% New Reuse<br />
Test Defects/KLOC<br />
Total Defects/KLOC<br />
Yield %<br />
% Appraisal COQ<br />
% Failure COQ<br />
COQ A/F Ratio<br />
Program Size (LOC): Plan Actual To Date<br />
Base(B)<br />
(Measured)<br />
(Measured)<br />
Deleted (D)<br />
(Estimated)<br />
(Counted)<br />
Modified (M)<br />
(Estimated)<br />
(Counted)<br />
Added (A)<br />
(N-M)<br />
(T-B+D-R)<br />
Reused (R)<br />
(Estimated)<br />
(Counted)<br />
Total New & Changed (N)<br />
(Estimated)<br />
(A+M)<br />
Total LOC (T)<br />
(N+B-M-D+R)<br />
(Measured)<br />
Total New Reused<br />
(Estimated)<br />
(Counted)<br />
Est Object LOC (E)<br />
(Estimated)<br />
Upper Prediction Interval (70%)<br />
Lower Prediction Interval (70%)<br />
Time in Phase (min.) Plan Actual To Date To Date %<br />
Planning<br />
Design<br />
Design review<br />
Code<br />
Code review<br />
Compile<br />
Test<br />
Postmortem<br />
Total<br />
Total Time UPI (70%)<br />
Total Time LPI (70%)<br />
© 1998 Carnegie Mellon University <strong>Tutorial</strong> - 1 24
Time Recording Log<br />
Time spent<br />
working on<br />
each <strong>PSP</strong><br />
phase is<br />
recorded.<br />
• start time<br />
• stop time<br />
• interrupt<br />
time<br />
• phase<br />
• comments<br />
Time Recording Log<br />
Student JD Veloper Date 7/1<br />
Instructor Humphrey Program # 1A<br />
Date Start Stop Interruption Delta Phase Comments<br />
Time<br />
Time<br />
7/1 8:00 8:16 5 11 Plan Estimated time<br />
© 1998 Carnegie Mellon University <strong>Tutorial</strong> - 1 25
Defect Recording Log<br />
Information on<br />
each defect<br />
found in reviews,<br />
compiling, and<br />
test is recorded.<br />
• Number<br />
• type<br />
• phase injected<br />
• phase removed<br />
• find/fix time<br />
• description<br />
Defect Types<br />
10 Documentation 60 Checking<br />
20 Syntax 70 Data<br />
30 Build, Package 80 Function<br />
40 Assignment 90 System<br />
50 Interface 100 Environment<br />
C18 Defect Recording Log<br />
JD Veloper Date 7/1<br />
Instructor Humphrey Program # 1A<br />
Date Number Type Inject Remove Fix Time Fix Defect<br />
7/1 1 40 code compile 2<br />
Description: Missing declaration<br />
Date Number Type Inject Remove Fix Time Fix Defect<br />
2 20 code compile 1<br />
Description: Typo in function name<br />
Date Number Type Inject Remove Fix Time Fix Defect<br />
Description:<br />
Date Number Type Inject Remove Fix Time Fix Defect<br />
Description:<br />
Date Number Type Inject Remove Fix Time Fix Defect<br />
Description:<br />
© 1998 Carnegie Mellon University <strong>Tutorial</strong> - 1 26
<strong>The</strong> <strong>PSP</strong> <strong>Process</strong> Flow<br />
Requirements<br />
<strong>PSP</strong> <strong>Process</strong><br />
Planning<br />
Development<br />
<strong>Process</strong><br />
scripts<br />
guide<br />
Design<br />
Design review<br />
Code<br />
Code review<br />
Compile<br />
Test<br />
Time<br />
and<br />
defect<br />
logs<br />
Project<br />
plan<br />
summary<br />
Postmortem<br />
Finished product<br />
Project and process<br />
data summary report<br />
© 1998 Carnegie Mellon University <strong>Tutorial</strong> - 1 27
<strong>PSP</strong> Planning<br />
In the <strong>PSP</strong>, engineers use their personal data to<br />
make plans.<br />
Planning consists of<br />
• size estimating<br />
• resource estimating<br />
• schedule estimating<br />
In the <strong>PSP</strong>, lines of code (LOC) are used as the<br />
size measure<br />
• Other measures could be used.<br />
© 1998 Carnegie Mellon University <strong>Tutorial</strong> - 1 28
<strong>The</strong> Project Planning Framework<br />
Customer<br />
need<br />
Define<br />
requirements<br />
Items<br />
Produce<br />
conceptual<br />
design<br />
PROBE Method<br />
Tasks<br />
Customer<br />
Estimate<br />
size<br />
Estimate<br />
resources<br />
Size<br />
database<br />
Productivity<br />
database<br />
Produce<br />
schedule<br />
Resources<br />
available<br />
Management<br />
Product<br />
delivery<br />
Develop<br />
product<br />
Size, resource<br />
schedule<br />
data<br />
<strong>Process</strong><br />
analysis<br />
Tracking<br />
reports<br />
© 1998 Carnegie Mellon University <strong>Tutorial</strong> - 1 29
Why Estimate Size?<br />
To make better plans<br />
• to better size the job<br />
• to divide the job into separable elements<br />
To assist in tracking progress<br />
• can judge when job scope changes<br />
• can better measure the work<br />
Value for the <strong>PSP</strong><br />
• learn estimating methods<br />
• build estimating skills<br />
© 1998 Carnegie Mellon University <strong>Tutorial</strong> - 1 30
Size Estimating Principles - 1<br />
Estimating is an uncertain process.<br />
• no one knows how big the product will be<br />
• the earlier the estimate, the less is known<br />
• estimates can be biased by business and<br />
other pressures<br />
Estimating is an intuitive learning process.<br />
• ability improves with experience<br />
• some people will be better at estimating than<br />
others<br />
© 1998 Carnegie Mellon University <strong>Tutorial</strong> - 1 31
Size Estimating Principles - 2<br />
<strong>The</strong> estimating objectives are to<br />
• make consistent estimates<br />
• understand estimate variability<br />
• balance under and over estimates<br />
<strong>The</strong> principal advantages of using a defined<br />
estimating method are<br />
• You have a known practice you can improve.<br />
• It provides a framework for gathering data.<br />
• By using a consistent method and historical<br />
data, your estimates will get more consistent<br />
© 1998 Carnegie Mellon University <strong>Tutorial</strong> - 1 32
Size Estimating Proxies<br />
A proxy is a substitute<br />
A suitable size estimating proxy will help<br />
visualize ill-defined products early in<br />
development.<br />
Potential proxies are<br />
• functions, procedures, and methods<br />
• function points<br />
• objects<br />
• report pages, files, screens<br />
© 1998 Carnegie Mellon University <strong>Tutorial</strong> - 1 33
Objects as Proxies - 1<br />
Objects make good proxies because<br />
• numbers of objects correlate reasonably well<br />
with development hours<br />
• object lines of code (LOC) correlate very<br />
closely with development hours<br />
• historical object LOC data can be obtained<br />
and used<br />
• using these historical data, object LOC can<br />
readily be estimated<br />
© 1998 Carnegie Mellon University <strong>Tutorial</strong> - 1 34
Objects as Proxies - 2<br />
When objects are selected as application<br />
entities, they can be visualized early in<br />
development.<br />
Functions and procedures can often be<br />
estimated in the same way.<br />
Objects, functions, procedures, and their LOC<br />
can be automatically counted.<br />
© 1998 Carnegie Mellon University <strong>Tutorial</strong> - 1 35
Object LOC Correlation with<br />
Development Hours<br />
Hours<br />
180<br />
160<br />
140<br />
120<br />
100<br />
80<br />
60<br />
40<br />
20<br />
0<br />
0 500 1000 1500 2000<br />
Object LOC<br />
© 1998 Carnegie Mellon University <strong>Tutorial</strong> - 1 36
<strong>The</strong> PROBE Estimating Method<br />
Start<br />
Conceptual<br />
Design<br />
Step<br />
Number of<br />
Methods<br />
Identify and Size Objects<br />
Object<br />
Type<br />
Relative<br />
Size<br />
Reuse<br />
Categories<br />
Estimate Other LOC<br />
Estimate<br />
Program Size<br />
Estimate<br />
Resources<br />
Calculate<br />
Prediction Interval<br />
Calculate<br />
Prediction Interval<br />
Size Estimate<br />
Resource Estimate<br />
© 1998 Carnegie Mellon University <strong>Tutorial</strong> - 1 37
To Make Size Estimates, You<br />
Need Several Items<br />
Data on historical objects, divided into types<br />
Estimating factors for the relative sizes of each<br />
object type<br />
Regression parameters for computing new and<br />
changed LOC from<br />
• estimated object LOC<br />
• LOC added to the base<br />
• modified LOC<br />
© 1998 Carnegie Mellon University <strong>Tutorial</strong> - 1 38
C++ Object Size Ranges<br />
Table of LOC per method<br />
Type VS S M L VL<br />
Calculation<br />
Data<br />
I/O<br />
Logic<br />
Set-up<br />
2.34 5.13 11.25 24.66 54.04<br />
2.60 4.79 8.84 16.31 30.09<br />
9.01 12.06 16.15 21.62 28.93<br />
7.55 10.98 15.98 23.25 33.83<br />
3.88 5.04 6.56 8.53 11.09<br />
Text<br />
3.75 8.00 17.07 36.41 77.66<br />
© 1998 Carnegie Mellon University <strong>Tutorial</strong> - 1 39
Estimate Program Size<br />
Total program size consists of<br />
• newly developed code (adjusted with the<br />
regression parameters)<br />
• reused code from the library<br />
• base code from prior versions, less deletions<br />
Newly developed code consists of<br />
• additions to the base<br />
• newly developed objects<br />
• base LOC that are modified<br />
© 1998 Carnegie Mellon University <strong>Tutorial</strong> - 1 40
Regression Calculation<br />
12000<br />
Development Time -<br />
Minutes<br />
10000<br />
8000<br />
6000<br />
4000<br />
2000<br />
0<br />
0 500 1000 1500 2000<br />
Program Size = LOC<br />
© 1998 Carnegie Mellon University <strong>Tutorial</strong> - 1 41
<strong>The</strong> Prediction Interval<br />
<strong>The</strong> prediction interval provides a likely range<br />
around the estimate.<br />
• a 90% prediction interval gives the range<br />
within which 90% of the estimates will likely<br />
fall<br />
• it is not a forecast, only an expectation<br />
• it only applies if the estimate behaves like the<br />
historical data<br />
<strong>The</strong> prediction interval is calculated from the<br />
same data used to calculate the regression<br />
parameters.<br />
© 1998 Carnegie Mellon University <strong>Tutorial</strong> - 1 42
Prediction Interval - 90%<br />
12000<br />
Development Time -<br />
Minutes<br />
10000<br />
8000<br />
6000<br />
4000<br />
2000<br />
0<br />
0 500 1000 1500 2000<br />
Program Size = LOC<br />
© 1998 Carnegie Mellon University <strong>Tutorial</strong> - 1 43
<strong>The</strong> Resource Planning <strong>Process</strong><br />
Start with a size estimate<br />
Identify available data<br />
Use regression when you have 3+ sets of data<br />
that correlate<br />
Use data for estimated LOC to actual hours<br />
where available<br />
Calculate the prediction interval<br />
© 1998 Carnegie Mellon University <strong>Tutorial</strong> - 1 44
Schedule Estimating<br />
To make a schedule you need 3 things<br />
• the estimated direct project hours<br />
• a calendar of available direct hours<br />
• the order in which the tasks will be done<br />
You then need to<br />
• estimate the hours needed for each task<br />
• spread these hours over the calendar of<br />
available hours<br />
© 1998 Carnegie Mellon University <strong>Tutorial</strong> - 1 45
<strong>The</strong> <strong>PSP</strong> Quality Strategy - 1<br />
In the <strong>PSP</strong>, defects are the basic quality<br />
measure.<br />
Note that defects are not important to the user<br />
as long as they do not<br />
• affect operations<br />
• cause inconvenience<br />
• cost time or money<br />
• cause loss of confidence in the program’s<br />
results<br />
© 1998 Carnegie Mellon University <strong>Tutorial</strong> - 1 46
<strong>The</strong> <strong>PSP</strong> Quality Strategy - 2<br />
Low defect content is an essential prerequisite<br />
to a quality software process.<br />
• Experienced software engineers typically<br />
inject around 100 defects per KLOC.<br />
• Low defect products can best be assured at<br />
the <strong>PSP</strong> level.<br />
This is where the defects are injected and this is<br />
where the engineers should<br />
• remove them<br />
• determine their causes<br />
• learn to prevent them<br />
© 1998 Carnegie Mellon University <strong>Tutorial</strong> - 1 47
<strong>The</strong> <strong>PSP</strong> Quality Strategy - 3<br />
If you want a quality product out of test, you<br />
must put a quality product into test.<br />
• testing removes only a fraction of the defects<br />
• the more defects in the code entering test, the<br />
more defects there are on test exit<br />
To manage defects, they must be addressed<br />
where they are injected - by each software<br />
engineer.<br />
This requires a comprehensive focus on<br />
software quality.<br />
© 1998 Carnegie Mellon University <strong>Tutorial</strong> - 1 48
<strong>The</strong> <strong>PSP</strong> Quality Strategy - 4<br />
Data show that it is much more efficient to find<br />
defects in reviews than in testing.<br />
• in unit test, typically only about 2 to 4 defects<br />
are found per hour<br />
• code reviews typically find about 10 defects<br />
per hour<br />
• experienced reviewers can find 70% or more<br />
of the defects in a product<br />
• unit test rarely exceeds a 50% yield<br />
<strong>PSP</strong> data show that reviews find 2 to 5 times as<br />
many defects per hour as unit test.<br />
© 1998 Carnegie Mellon University <strong>Tutorial</strong> - 1 49
<strong>PSP</strong> Reviews<br />
In a personal design or code review<br />
• Professionals privately review their products.<br />
• <strong>The</strong>ir objective is to find all defects before the<br />
first compile and test.<br />
• Reviews are most effective when structured<br />
and measured.<br />
Reviews can be used for requirements, designs,<br />
and code.<br />
© 1998 Carnegie Mellon University <strong>Tutorial</strong> - 1 50
Review Yield - 1<br />
Yield<br />
• a measure of process quality<br />
• the percent of defects in the product at review<br />
time that were found by the review<br />
• a measure of the effectiveness of a process<br />
step<br />
- design and code reviews<br />
- the overall process - prior to test<br />
- the development process - including test<br />
Yield(for a phase or the entire process) =<br />
100*(defects found)/(defects found + not found)<br />
© 1998 Carnegie Mellon University <strong>Tutorial</strong> - 1 51
Review Yield - 2<br />
Yield cannot be calculated until all defects have<br />
been found through test and product use.<br />
Yield can be useful early in the process if all or<br />
most defects are counted.<br />
• design and code review defects<br />
• compile defects<br />
• unit test defects<br />
Using process data, control parameters can<br />
help to ensure high yield reviews.<br />
© 1998 Carnegie Mellon University <strong>Tutorial</strong> - 1 52
<strong>The</strong> Cost of Quality (COQ) - 1<br />
Failure costs<br />
• repair, rework, and scrap<br />
• <strong>PSP</strong> failure costs are compile and test time<br />
Appraisal costs<br />
• costs of inspecting for defects<br />
• <strong>PSP</strong> appraisal costs are design review and<br />
code review time<br />
Prevention costs are finding and resolving<br />
defect causes.<br />
© 1998 Carnegie Mellon University <strong>Tutorial</strong> - 1 53
<strong>The</strong> Cost of Quality (COQ) - 2<br />
A useful <strong>PSP</strong> measure is the ratio of appraisal<br />
to failure costs (A/FR).<br />
• A/FR = (appraisal COQ)/(failure COQ)<br />
• A/FR measures process quality.<br />
A/FR experience<br />
• if measured, the A/FR of most software<br />
organizations would be near zero<br />
• in the <strong>PSP</strong>, A/FR should exceed 2.0<br />
• high A/FR is associated with low numbers of<br />
test defects and high product quality<br />
© 1998 Carnegie Mellon University <strong>Tutorial</strong> - 1 54
Test Defects vs. A/FR - Class<br />
Test Defects/KLOC<br />
180<br />
160<br />
140<br />
120<br />
100<br />
80<br />
60<br />
40<br />
20<br />
0<br />
0 1 2 3 4 5<br />
Appraisal to Failure C ost R atio<br />
© 1998 Carnegie Mellon University <strong>Tutorial</strong> - 1 55
Messages to Remember<br />
1. A defined and measured process provides a<br />
repeatable basis for improvement.<br />
2. <strong>The</strong> PROBE method provides a statistically<br />
sound framework for planning.<br />
3. <strong>The</strong> <strong>PSP</strong> quality strategy will help engineers<br />
produce high quality products.<br />
© 1998 Carnegie Mellon University <strong>Tutorial</strong> - 1 56


