Recent Annual Report - Gabelli
Recent Annual Report - Gabelli Recent Annual Report - Gabelli
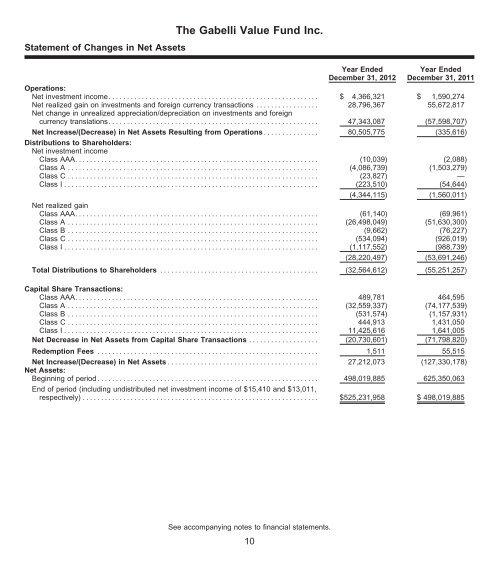
Statement of Changes in Net Assets The Gabelli Value Fund Inc. Year Ended December 31, 2012 Year Ended December 31, 2011 Operations: Netinvestmentincome......................................................... $ 4,366,321 $ 1,590,274 Net realized gain on investments and foreign currency transactions ................. 28,796,367 55,672,817 Net change in unrealized appreciation/depreciation on investments and foreign currency translations......................................................... 47,343,087 (57,598,707) Net Increase/(Decrease) in Net Assets Resulting from Operations ............... 80,505,775 (335,616) Distributions to Shareholders: Net investment income Class AAA.................................................................. (10,039) (2,088) Class A .................................................................... (4,086,739) (1,503,279) Class C .................................................................... (23,827) — Class I ..................................................................... (223,510) (54,644) (4,344,115) (1,560,011) Net realized gain Class AAA.................................................................. (61,140) (69,961) Class A .................................................................... (26,498,049) (51,630,300) Class B .................................................................... (9,662) (76,227) Class C .................................................................... (534,094) (926,019) Class I ..................................................................... (1,117,552) (988,739) (28,220,497) (53,691,246) Total Distributions to Shareholders ........................................... (32,564,612) (55,251,257) Capital Share Transactions: Class AAA.................................................................. 489,781 464,595 Class A .................................................................... (32,559,337) (74,177,539) Class B .................................................................... (531,574) (1,157,931) Class C .................................................................... 444,913 1,431,050 Class I ..................................................................... 11,425,616 1,641,005 Net Decrease in Net Assets from Capital Share Transactions ................... (20,730,601) (71,798,820) Redemption Fees ............................................................ 1,511 55,515 Net Increase/(Decrease) in Net Assets ......................................... 27,212,073 (127,330,178) Net Assets: Beginning of period ............................................................ 498,019,885 625,350,063 End of period (including undistributed net investment income of $15,410 and $13,011, respectively)................................................................ $525,231,958 $ 498,019,885 See accompanying notes to financial statements. 10
The Gabelli Value Fund Inc. Financial Highlights Selected data for a share of capital stock outstanding throughout each period: Period Ended December 31 Net Asset Value, Beginning of Period Net Investment Income (Loss)(a) Income (Loss) from Investment Operations Distributions Net Realized and Unrealized Gain (Loss) on Investments Total from Investment Operations Net Investment Income Net Realized Gain on Investments Return of Capital Total Distributions Redemption Fees (a)(b) Net Asset Value, End of Period Total Return† Net Assets, End of Period (in 000’s) Ratios to Average Net Assets / Supplemental Data Class AAA 2012 $13.87 $ 0.14 $ 2.20 $ 2.34 $(0.14) $(0.86) — $(1.00) $0.00 $15.21 17.0% $ 1,192 0.92% 1.42% 3% 2011 15.58 0.07 (0.08) (0.01) (0.05) (1.65) — (1.70) 0.00 13.87 0.1 634 0.45 1.43 6 2010(c) 14.37 0.00(b) 1.70 1.70 (0.03) (0.46) — (0.49) 0.00 15.58 11.8 275 0.00(d)(e) 1.43(e) 14 Class A 2012 $13.89 $ 0.13 $ 2.21 $ 2.34 $(0.13) $(0.86) — $(0.99) $0.00 $15.24 17.0% $494,048 0.85% 1.42% 3% 2011 15.59 0.05 (0.05) 0.00(b) (0.05) (1.65) — (1.70) 0.00 13.89 0.1 480,414 0.29 1.43 6 2010 12.58 0.01 3.46 3.47 (0.00)(b) (0.46) — (0.46) 0.00 15.59 27.6 607,818 0.05 1.43 14 2009 9.00 0.04 3.69 3.73 (0.04) (0.11) — (0.15) 0.00 12.58 41.4 449,865 0.36 1.52 5 2008 16.78 0.04 (7.47) (7.43) (0.04) (0.03) $(0.28) (0.35) 0.00 9.00 (44.2) 366,568 0.28 1.41 4 Class B 2012 $12.27 $(0.02) $ 1.98 $ 1.96 — $(0.86) — $(0.86) $0.00 $13.37 16.1% $ 152 (0.17)% 2.17% 3% 2011 14.04 (0.08) (0.04) (0.12) — (1.65) — (1.65) 0.00 12.27 (0.7) 640 (0.56) 2.18 6 2010 11.45 (0.09) 3.14 3.05 — (0.46) — (0.46) 0.00 14.04 26.6 1,844 (0.72) 2.18 14 2009 8.24 (0.03) 3.35 3.32 — (0.11) — (0.11) 0.00 11.45 40.3 3,850 (0.38) 2.27 5 2008 15.46 (0.06) (6.85) (6.91) — (0.03) $(0.28) (0.31) 0.00 8.24 (44.6) 4,252 (0.48) 2.16 4 Class C 2012 $12.30 $ 0.02 $ 1.95 $ 1.97 $(0.04) $(0.86) — $(0.90) $0.00 $13.37 16.1% $ 8,914 0.12% 2.17% 3% 2011 14.07 (0.06) (0.06) (0.12) — (1.65) — (1.65) 0.00 12.30 (0.7) 7,789 (0.43) 2.18 6 2010 11.47 (0.09) 3.15 3.06 — (0.46) — (0.46) 0.00 14.07 26.7 7,378 (0.70) 2.18 14 2009 8.25 (0.04) 3.37 3.33 — (0.11) — (0.11) 0.00 11.47 40.4 6,314 (0.39) 2.27 5 2008 15.48 (0.06) (6.86) (6.92) — (0.03) $(0.28) (0.31) 0.00 8.25 (44.6) 5,686 (0.47) 2.16 4 Class I 2012 $13.88 $ 0.19 $ 2.18 $ 2.37 $(0.17) $(0.86) — $(1.03) $0.00 $15.22 17.2% $ 20,926 1.25% 1.17% 3% 2011 15.58 0.09 (0.05) 0.04 (0.09) (1.65) — (1.74) 0.00 13.88 0.4 8,543 0.57 1.18 6 2010 12.56 0.04 3.48 3.52 (0.04) (0.46) — (0.50) 0.00 15.58 28.0 8,035 0.31 1.18 14 2009 8.99 0.06 3.69 3.75 (0.07) (0.11) — (0.18) 0.00 12.56 41.6 4,647 0.59 1.27 5 2008(f) 15.87 0.08 (6.57) (6.49) (0.08) (0.03) $(0.28) (0.39) 0.00 8.99 (40.8) 3,528 0.66(e) 1.16(e) 4 Net Investment Income (Loss) Operating Expenses Portfolio Turnover Rate † Total return represents aggregate total return of a hypothetical $1,000 investment at the beginning of the period and sold at the end of the period including reinvestment of distributions and does not reflect applicable sales charges. Total return for a period of less than one year is not annualized. (a) Per share amounts have been calculated using the average shares outstanding method. (b) Amount represents less than $0.005 per share. (c) From the commencement of offering Class AAA Shares on April 30, 2010 through December 31, 2010. (d) Amount represents less than 0.005%. (e) Annualized. (f) From the commencement of offering Class I Shares on January 11, 2008 through December 31, 2008. See accompanying notes to financial statements. 11
- Page 1 and 2: The Gabelli Value Fund Inc. Shareho
- Page 3 and 4: Barron’s 2013 Roundtable Mario J.
- Page 5 and 6: Mario Gabelli’s Picks Company Tic
- Page 7 and 8: Let’s Talk Stocks The following a
- Page 9 and 10: from an improving auto sales outloo
- Page 11 and 12: VALUE _____________________________
- Page 13 and 14: The Gabelli Value Fund Inc. Annual
- Page 15 and 16: Comparative Results Average Annual
- Page 17 and 18: Summary of Portfolio Holdings (Unau
- Page 19 and 20: The Gabelli Value Fund Inc. Schedul
- Page 21: Statement of Assets and Liabilities
- Page 25 and 26: The Gabelli Value Fund Inc. Notes t
- Page 27 and 28: The Gabelli Value Fund Inc. Notes t
- Page 29 and 30: The Gabelli Value Fund Inc. Notes t
- Page 31 and 32: The Gabelli Value Fund Inc. Notes t
- Page 33 and 34: The Gabelli Value Fund Inc. Report
- Page 35 and 36: The Gabelli Value Fund Inc. Additio
Statement of Changes in Net Assets<br />
The <strong>Gabelli</strong> Value Fund Inc.<br />
Year Ended<br />
December 31, 2012<br />
Year Ended<br />
December 31, 2011<br />
Operations:<br />
Netinvestmentincome......................................................... $ 4,366,321 $ 1,590,274<br />
Net realized gain on investments and foreign currency transactions ................. 28,796,367 55,672,817<br />
Net change in unrealized appreciation/depreciation on investments and foreign<br />
currency translations......................................................... 47,343,087 (57,598,707)<br />
Net Increase/(Decrease) in Net Assets Resulting from Operations ............... 80,505,775 (335,616)<br />
Distributions to Shareholders:<br />
Net investment income<br />
Class AAA.................................................................. (10,039) (2,088)<br />
Class A .................................................................... (4,086,739) (1,503,279)<br />
Class C .................................................................... (23,827) —<br />
Class I ..................................................................... (223,510) (54,644)<br />
(4,344,115) (1,560,011)<br />
Net realized gain<br />
Class AAA.................................................................. (61,140) (69,961)<br />
Class A .................................................................... (26,498,049) (51,630,300)<br />
Class B .................................................................... (9,662) (76,227)<br />
Class C .................................................................... (534,094) (926,019)<br />
Class I ..................................................................... (1,117,552) (988,739)<br />
(28,220,497) (53,691,246)<br />
Total Distributions to Shareholders ........................................... (32,564,612) (55,251,257)<br />
Capital Share Transactions:<br />
Class AAA.................................................................. 489,781 464,595<br />
Class A .................................................................... (32,559,337) (74,177,539)<br />
Class B .................................................................... (531,574) (1,157,931)<br />
Class C .................................................................... 444,913 1,431,050<br />
Class I ..................................................................... 11,425,616 1,641,005<br />
Net Decrease in Net Assets from Capital Share Transactions ................... (20,730,601) (71,798,820)<br />
Redemption Fees ............................................................ 1,511 55,515<br />
Net Increase/(Decrease) in Net Assets ......................................... 27,212,073 (127,330,178)<br />
Net Assets:<br />
Beginning of period ............................................................ 498,019,885 625,350,063<br />
End of period (including undistributed net investment income of $15,410 and $13,011,<br />
respectively)................................................................ $525,231,958 $ 498,019,885<br />
See accompanying notes to financial statements.<br />
10


