- Page 1 and 2:
9 th National Light Rail Transit Co
- Page 3 and 4:
E Foreword xperience, Economics and
- Page 5 and 6:
Contents OPENING GENERAL SESSION St
- Page 7 and 8: Shared-Use Corridors: A Survey of C
- Page 9: LIGHT RAIL ELECTRIFICATION Feederle
- Page 13 and 14: T OPENING GENERAL SESSION Status of
- Page 15 and 16: Schumann and Loetterle 5 SEATTLE/TA
- Page 17 and 18: Schumann and Loetterle 7 Current Co
- Page 19 and 20: Schumann and Loetterle 9 Current Co
- Page 21 and 22: Schumann and Loetterle 11 Current C
- Page 23 and 24: Schumann and Loetterle 13 In early
- Page 25 and 26: Schumann and Loetterle 15 CALGARY F
- Page 27 and 28: Schumann and Loetterle 17 9. http:/
- Page 29 and 30: TABLE 3 Right of Way Locations km o
- Page 31 and 32: TABLE 5 Revenue Service Vehicles Ch
- Page 33 and 34: PLANNING AND FORECASTING FOR LIGHT
- Page 35 and 36: Thompson 27 These ideas appealed to
- Page 37 and 38: Thompson 29 beginning, however, tha
- Page 39 and 40: Thompson 31 in the interviews becau
- Page 41 and 42: Thompson 33 San Diego San Diego was
- Page 43 and 44: Thompson 35 to the National Confere
- Page 45 and 46: S PLANNING AND FORECASTING FOR LIGH
- Page 47 and 48: Day and Stauder 39 Pre-1996 Transpo
- Page 49 and 50: Day and Stauder 41 part of the gene
- Page 51 and 52: Day and Stauder 43 Comparability Ac
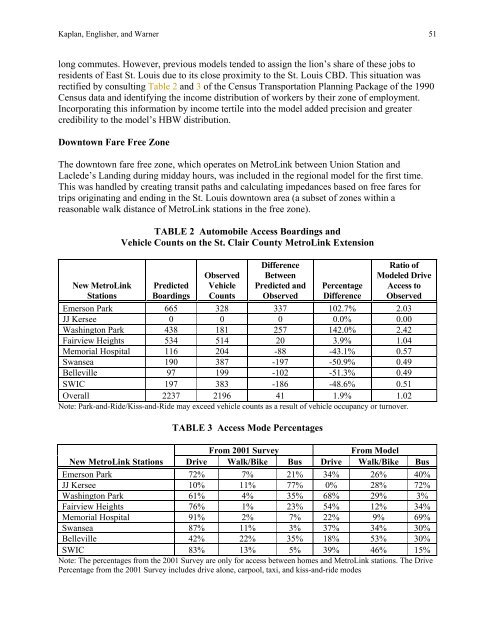
- Page 53 and 54: Kaplan, Englisher, and Warner 45 PR
- Page 55 and 56: Washington Park Fairview Heights Me
- Page 57: FIGURE 3 TAZ splits in St. Clair Co
- Page 61 and 62: Kaplan, Englisher, and Warner 53 to
- Page 63 and 64: Kaplan, Englisher, and Warner 55 No
- Page 65 and 66: Kaplan, Englisher, and Warner 57 Co
- Page 67 and 68: Straus and Watry 59 then, Muni has
- Page 69 and 70: Straus and Watry 61 Various factors
- Page 71 and 72: Straus and Watry 63 Francisco Count
- Page 73 and 74: Straus and Watry 65 where it would
- Page 75 and 76: Straus and Watry 67 require lifting
- Page 77 and 78: Straus and Watry 69 TABLE 2 In-Vehi
- Page 79 and 80: Straus and Watry 71 FIGURE 5 Bay Vi
- Page 81 and 82: Straus and Watry 73 LESSONS LEARNED
- Page 83 and 84: Marchwinski, Spitz, and Adler 75 BA
- Page 85 and 86: Marchwinski, Spitz, and Adler 77 re
- Page 87 and 88: Marchwinski, Spitz, and Adler 79 QU
- Page 89 and 90: Marchwinski, Spitz, and Adler 81 St
- Page 91 and 92: Marchwinski, Spitz, and Adler 83 TA
- Page 93 and 94: Marchwinski, Spitz, and Adler 85 It
- Page 96 and 97: LOW-FLOOR LIGHT RAIL VEHICLES Struc
- Page 98 and 99: Sarunac and Zeolla 91 STRUCTURAL ST
- Page 100 and 101: Sarunac and Zeolla 93 LRV-LFE DESIG
- Page 102 and 103: Sarunac and Zeolla 95 The values no
- Page 104 and 105: Sarunac and Zeolla 97 to evaluate a
- Page 106 and 107: Sarunac and Zeolla 99 TABLE 1 Summa
- Page 108 and 109:
Sarunac and Zeolla 101 Comparison o
- Page 110 and 111:
Sarunac and Zeolla 103 approach, ap
- Page 112 and 113:
Morgan 105 concept can be readily i
- Page 114 and 115:
Morgan 107 DART LRVs are all relati
- Page 116 and 117:
Morgan 109 trailer truck with 4-dis
- Page 118 and 119:
Morgan 111 Conclusion Because of th
- Page 120 and 121:
Morgan 113 TABLE 1 Comparison of Se
- Page 122 and 123:
Morgan 115 After the real estate, t
- Page 124 and 125:
Morgan 117 Fleet Maintenance Standa
- Page 126 and 127:
LOW-FLOOR LIGHT RAIL VEHICLES Integ
- Page 128 and 129:
Fraser, Leary, Marianeschi, and Pel
- Page 130 and 131:
Fraser, Leary, Marianeschi, and Pel
- Page 132 and 133:
Fraser, Leary, Marianeschi, and Pel
- Page 134 and 135:
Fraser, Leary, Marianeschi, and Pel
- Page 136 and 137:
Fraser, Leary, Marianeschi, and Pel
- Page 138:
Fraser, Leary, Marianeschi, and Pel
- Page 142 and 143:
D LIGHT RAIL TRANSIT AND OTHER MODE
- Page 144 and 145:
McBrayer 137 As of September 2002,
- Page 146 and 147:
McBrayer 139 Understandable Route T
- Page 148 and 149:
McBrayer 141 and reward investment
- Page 150 and 151:
McBrayer 143 The results of this ap
- Page 152 and 153:
McBrayer 145 of transit improvement
- Page 154:
McBrayer 147 system, the use of ali
- Page 158 and 159:
A LIGHT RAIL TRANSIT TRAFFIC ENGINE
- Page 160 and 161:
Boorse 153 use could be problematic
- Page 162 and 163:
Boorse 155 Section 10C.10—Do Not
- Page 164 and 165:
Boorse 157 purpose. In fact, to the
- Page 166 and 167:
Boorse 159 (a) (b) FIGURE 3 Figures
- Page 168 and 169:
Boorse 161 Section 10D.05—Traffic
- Page 170 and 171:
Boorse 163 (a) (b) FIGURE 4 Example
- Page 172 and 173:
Boorse 165 practices. This resulted
- Page 174 and 175:
Black 167 FIGURE 1 Hudson-Bergen LR
- Page 176 and 177:
Black 169 Return Phases may also be
- Page 178 and 179:
Black 171 FIGURE 5 Naztec preemptio
- Page 180 and 181:
Black 173 FIGURE 8 Split times cann
- Page 182 and 183:
Koonce, Urbanik, and Mishra 175 inh
- Page 184 and 185:
Koonce, Urbanik, and Mishra 177 EXI
- Page 186 and 187:
Koonce, Urbanik, and Mishra 179 TAB
- Page 188 and 189:
Koonce, Urbanik, and Mishra 181 FIG
- Page 190 and 191:
Koonce, Urbanik, and Mishra 183 (a)
- Page 192:
Koonce, Urbanik, and Mishra 185 CON
- Page 196 and 197:
O LIGHT RAIL TRANSIT AND TRANSIT-OR
- Page 198 and 199:
Arrington 191 FIGURE 2 Eastside Vil
- Page 200 and 201:
Arrington 193 restricted to propert
- Page 202 and 203:
Arrington 195 Portland’s Westside
- Page 204 and 205:
Arrington 197 FIGURE 4 Orenco Stati
- Page 206 and 207:
Arrington 199 FIGURE 5 America Plaz
- Page 208 and 209:
Arrington 201 with 2,600 units. Und
- Page 210 and 211:
Arrington 203 TABLE 2 Ten Steps to
- Page 212 and 213:
LIGHT RAIL TRANSIT AND TRANSIT-ORIE
- Page 214 and 215:
Fitzsimmons and Birch 207 FIGURE 1
- Page 216 and 217:
Fitzsimmons and Birch 209 pockets o
- Page 218 and 219:
Fitzsimmons and Birch 211 The Futur
- Page 220 and 221:
Fitzsimmons and Birch 213 The state
- Page 222 and 223:
M LIGHT RAIL TRANSIT AND TRANSIT-OR
- Page 224 and 225:
H UNTERSPOINTSHIPYARD Beatty 217 H
- Page 226 and 227:
HUNTERS POINT EXPWY Beatty 219 WILL
- Page 228 and 229:
Beatty 221 an attractive alternativ
- Page 230 and 231:
Beatty 223 Bayshore Boulevard at Su
- Page 232 and 233:
Beatty 225 secondary bus type. The
- Page 234 and 235:
Beatty 227 SUNNYDALE AVENUE Platfor
- Page 236 and 237:
Beatty 229 SUNNYDALE AVENUE 18' 12'
- Page 238 and 239:
Beatty 231 The Southern Terminal is
- Page 240 and 241:
Edwards and Phillips 233 means for
- Page 242 and 243:
Edwards and Phillips 235 Road corri
- Page 244 and 245:
Edwards and Phillips 237 viable nei
- Page 246 and 247:
Edwards and Phillips 239 recreation
- Page 248 and 249:
Edwards and Phillips 241 bridge). T
- Page 250 and 251:
Edwards and Phillips 243 Additional
- Page 252 and 253:
Edwards and Phillips 245 • Serve
- Page 254 and 255:
Edwards and Phillips 247 • Ensure
- Page 256 and 257:
CROSSINGS AND SHARED CORRIDORS “L
- Page 258 and 259:
Ames and Gamlen 253
- Page 260 and 261:
TABLE 1 Third Street LRT Project Ra
- Page 262 and 263:
Ames and Gamlen 257 Condition Freig
- Page 264 and 265:
Ames and Gamlen 259 TABLE 2 Third S
- Page 266 and 267:
Ames and Gamlen 261 where the light
- Page 268 and 269:
Ames and Gamlen 263 Table 4 shows t
- Page 270 and 271:
Ames and Gamlen 265 CONCLUSION Impl
- Page 272 and 273:
Irwin 267 recommendations. TriMet
- Page 274 and 275:
Irwin 269 TRIMET STANDARDS TriMet h
- Page 276 and 277:
Irwin 271 FIGURE 2 Pedestrian warni
- Page 278 and 279:
Irwin 273 Channeling Figure 4 detai
- Page 280 and 281:
Irwin 275 FIGURE 5 Typical crossing
- Page 282 and 283:
Irwin 277 The disadvantages of swin
- Page 284 and 285:
Irwin 279 FIGURE 8 Standard detail
- Page 286 and 287:
Irwin 281 FIGURE 9 Audible or visua
- Page 288 and 289:
Irwin 283 . FIGURE 10 Audible or vi
- Page 290 and 291:
Irwin 285 In general, ODOT Rail dis
- Page 292 and 293:
Irwin 287 FIGURE 12 Pedestrian sigh
- Page 294 and 295:
CROSSINGS AND SHARED CORRIDORS Reso
- Page 296 and 297:
Ryan, Rabiner, and Trumbull 291 The
- Page 298 and 299:
Ryan, Rabiner, and Trumbull 293 FIG
- Page 300 and 301:
Ryan, Rabiner, and Trumbull 295 The
- Page 302 and 303:
Ryan, Rabiner, and Trumbull 297 FIG
- Page 304 and 305:
Ryan, Rabiner, and Trumbull 299 REF
- Page 306 and 307:
Sela, Resor, and Hickey 301 opportu
- Page 308 and 309:
Sela, Resor, and Hickey 303 TABLE 1
- Page 310 and 311:
City Atlanta Baltimore Operating Ag
- Page 312 and 313:
TABLE 2 (continued) Transit Systems
- Page 314 and 315:
Sela, Resor, and Hickey 309 Time Se
- Page 316 and 317:
Sela, Resor, and Hickey 311 Grade C
- Page 318 and 319:
Sela, Resor, and Hickey 313 records
- Page 320 and 321:
Sela, Resor, and Hickey 315 recomme
- Page 323 and 324:
CRITIQUES: HOW ARE WE DOING? Riders
- Page 325 and 326:
Polzin and Page 321 NTD ID TABLE 1
- Page 327 and 328:
Polzin and Page 323 35 30 Ridership
- Page 329 and 330:
Polzin and Page 325 As an indicatio
- Page 331 and 332:
D allas TX Denver CO 100 100 80 80
- Page 333 and 334:
Polzin and Page 329 Passengers per
- Page 335 and 336:
Polzin and Page 331 TABLE 3 Percent
- Page 337 and 338:
Polzin and Page 333 Figure 10 graph
- Page 339 and 340:
Polzin and Page 335 3500 Passenger
- Page 341 and 342:
Polzin and Page 337 productivity tr
- Page 343 and 344:
Cooper and Furmaniak 339 PROJECT OV
- Page 345 and 346:
Cooper and Furmaniak 341 less than
- Page 347 and 348:
Cooper and Furmaniak 343 substation
- Page 349 and 350:
Cooper and Furmaniak 345 120,000 10
- Page 351 and 352:
Cooper and Furmaniak 347 failures,
- Page 353 and 354:
Cooper and Furmaniak 349 creatively
- Page 355 and 356:
D CRITIQUES: HOW ARE WE DOING? Peak
- Page 357 and 358:
Demery and Higgins 353 The finding
- Page 359 and 360:
Demery and Higgins 355 TABLE 1 Regr
- Page 361 and 362:
Demery and Higgins 357 TABLE 3 Regr
- Page 363 and 364:
Demery and Higgins 359 have to be s
- Page 365 and 366:
Demery and Higgins 361 regularly ex
- Page 367 and 368:
Demery and Higgins 363 passengers (
- Page 369 and 370:
Demery and Higgins 365 92-ft (28-m)
- Page 371 and 372:
Demery and Higgins 367 NOTES 1. The
- Page 373 and 374:
Demery and Higgins 369 18. Moore, J
- Page 375 and 376:
M CRITIQUES: HOW ARE WE DOING? Ligh
- Page 377 and 378:
Henry 373 SUCCESS MEANS FAILURE? De
- Page 379 and 380:
Henry 375 trolley car” for their
- Page 381 and 382:
Henry 377 Cox’s claims appear to
- Page 383 and 384:
Henry 379 ATTACK ON SMART GROWTH AN
- Page 385 and 386:
Henry 381 But another question is r
- Page 387 and 388:
Henry 383 FIGURE 1 Average proporti
- Page 389:
Henry 385 REFERENCES 1. Layton, Lyn
- Page 393 and 394:
CIVIL DESIGN Design and Constructio
- Page 395 and 396:
Berliner, Campo, Dickerson, and Mac
- Page 397 and 398:
Berliner, Campo, Dickerson, and Mac
- Page 399 and 400:
Berliner, Campo, Dickerson, and Mac
- Page 401 and 402:
Berliner, Campo, Dickerson, and Mac
- Page 403 and 404:
Berliner, Campo, Dickerson, and Mac
- Page 405 and 406:
Berliner, Campo, Dickerson, and Mac
- Page 407 and 408:
Berliner, Campo, Dickerson, and Mac
- Page 409 and 410:
Berliner, Campo, Dickerson, and Mac
- Page 411 and 412:
CIVIL DESIGN Floating Slab Trackbed
- Page 413 and 414:
Carman, Smoluchowski, and Berliner
- Page 415 and 416:
Carman, Smoluchowski, and Berliner
- Page 417 and 418:
Carman, Smoluchowski, and Berliner
- Page 419 and 420:
Carman, Smoluchowski, and Berliner
- Page 421 and 422:
FIGURE 5 Plan view of NERL MOS-1 FS
- Page 423 and 424:
Carman, Smoluchowski, and Berliner
- Page 425 and 426:
CIVIL DESIGN Fitting Light Rail Tra
- Page 427 and 428:
Emili, Spadaccino, Risoldi, Tuzi, a
- Page 429 and 430:
FIGURE 3 Aerial view of the constru
- Page 431 and 432:
Emili, Spadaccino, Risoldi, Tuzi, a
- Page 433 and 434:
FIGURE 6 Piazza Vittorio Emanuele u
- Page 435 and 436:
FIGURE 8 Vibration measurement resu
- Page 437 and 438:
Emili, Spadaccino, Risoldi, Tuzi, a
- Page 439 and 440:
FIGURE 11 Side and central precast
- Page 441 and 442:
T CIVIL DESIGN Embedded Track Desig
- Page 443 and 444:
FIGURE 1 Configuration 1: Rail full
- Page 445 and 446:
Daniels 441 Configuration 2: Rail o
- Page 447 and 448:
FIGURE 4 Idealizations for modeling
- Page 449 and 450:
Daniels 445 Results Available from
- Page 451 and 452:
Note: Fatigue life is calculated on
- Page 453 and 454:
35 Note: Fatigue life is calculated
- Page 455 and 456:
Daniels 451 Pressures: Rail Support
- Page 457 and 458:
12 10 Slab Pressure on Ground Suppo
- Page 459 and 460:
RAIL UPLIFT FORCE FROM THERMAL EFFE
- Page 461 and 462:
Daniels 457 SUMMARY Analysis of emb
- Page 463 and 464:
T CIVIL DESIGN Debate of At-Grade V
- Page 465 and 466:
Li and Tertadian 461 \ FIGURE 1 Exp
- Page 467 and 468:
Li and Tertadian 463 FIGURE 2 Exist
- Page 469 and 470:
Li and Tertadian 465 navigability.
- Page 471 and 472:
Li and Tertadian 467 being consider
- Page 473:
Li and Tertadian 469 TABLE 1 Estima
- Page 476 and 477:
474 Transportation Research Circula
- Page 478 and 479:
476 Transportation Research Circula
- Page 480 and 481:
478 Transportation Research Circula
- Page 482 and 483:
480 Transportation Research Circula
- Page 484 and 485:
482 Transportation Research Circula
- Page 486 and 487:
484 Transportation Research Circula
- Page 488 and 489:
486 Transportation Research Circula
- Page 490 and 491:
488 Transportation Research Circula
- Page 492 and 493:
490 Transportation Research Circula
- Page 494 and 495:
492 Transportation Research Circula
- Page 496 and 497:
494 Transportation Research Circula
- Page 498 and 499:
496 Transportation Research Circula
- Page 500 and 501:
498 Transportation Research Circula
- Page 502 and 503:
500 Transportation Research Circula
- Page 504 and 505:
502 Transportation Research Circula
- Page 506 and 507:
504 Transportation Research Circula
- Page 508 and 509:
506 Transportation Research Circula
- Page 510 and 511:
508 Transportation Research Circula
- Page 512 and 513:
510 Transportation Research Circula
- Page 514 and 515:
512 Transportation Research Circula
- Page 516 and 517:
OPERATIONS AND COMMUNICATIONS From
- Page 518 and 519:
Swiecick, Van Dyke, and O’Connor
- Page 520 and 521:
Swiecick, Van Dyke, and O’Connor
- Page 522 and 523:
Swiecick, Van Dyke, and O’Connor
- Page 524 and 525:
Swiecick, Van Dyke, and O’Connor
- Page 526 and 527:
524 Transportation Research Circula
- Page 528 and 529:
526 Transportation Research Circula
- Page 530 and 531:
P OPERATIONS AND COMMUNICATIONS Imp
- Page 532 and 533:
530 Transportation Research Circula
- Page 534 and 535:
532 Transportation Research Circula
- Page 536:
PROJECT MANAGEMENT
- Page 539 and 540:
538 Transportation Research Circula
- Page 541 and 542:
540 Transportation Research Circula
- Page 543 and 544:
542 Transportation Research Circula
- Page 545 and 546:
544 Transportation Research Circula
- Page 547 and 548:
546 Transportation Research Circula
- Page 549 and 550:
548 Transportation Research Circula
- Page 551 and 552:
550 Transportation Research Circula
- Page 553 and 554:
552 Transportation Research Circula
- Page 555 and 556:
554 Transportation Research Circula
- Page 557 and 558:
556 Transportation Research Circula
- Page 559 and 560:
558 Transportation Research Circula
- Page 561 and 562:
560 Transportation Research Circula
- Page 563 and 564:
562 Transportation Research Circula
- Page 565 and 566:
564 Transportation Research Circula
- Page 567 and 568:
566 Transportation Research Circula
- Page 569 and 570:
568 Transportation Research Circula
- Page 571 and 572:
570 Transportation Research Circula
- Page 573 and 574:
572 Transportation Research Circula
- Page 575 and 576:
574 Transportation Research Circula
- Page 577 and 578:
PROJECT MANAGEMENT Design-Build Con
- Page 579 and 580:
578 Transportation Research Circula
- Page 581 and 582:
580 Transportation Research Circula
- Page 584:
PORTLAND POSTER SESSION
- Page 587 and 588:
586 Transportation Research Circula
- Page 589 and 590:
588 Transportation Research Circula
- Page 591 and 592:
590 Transportation Research Circula
- Page 593 and 594:
592 Transportation Research Circula
- Page 595 and 596:
594 Transportation Research Circula
- Page 597 and 598:
596 Transportation Research Circula
- Page 599 and 600:
598 Transportation Research Circula
- Page 601 and 602:
600 Transportation Research Circula
- Page 603 and 604:
T PORTLAND POSTER SESSION Special P
- Page 605 and 606:
604 Transportation Research Circula
- Page 607 and 608:
606 Transportation Research Circula
- Page 609 and 610:
608 Transportation Research Circula
- Page 611 and 612:
610 Transportation Research Circula
- Page 613 and 614:
612 Transportation Research Circula
- Page 615 and 616:
614 Transportation Research Circula
- Page 617 and 618:
616 Transportation Research Circula
- Page 619 and 620:
618 Transportation Research Circula
- Page 621 and 622:
620 Transportation Research Circula
- Page 623 and 624:
622 Transportation Research Circula
- Page 625 and 626:
624 Transportation Research Circula
- Page 627 and 628:
626 Transportation Research Circula
- Page 629 and 630:
628 Transportation Research Circula
- Page 631 and 632:
630 Transportation Research Circula
- Page 633 and 634:
632 Transportation Research Circula
- Page 635 and 636:
634 Transportation Research Circula
- Page 638:
LIGHT RAIL ELECTRIFICATION
- Page 641 and 642:
640 Transportation Research Circula
- Page 643 and 644:
642 Transportation Research Circula
- Page 645 and 646:
644 Transportation Research Circula
- Page 647 and 648:
646 Transportation Research Circula
- Page 649 and 650:
648 Transportation Research Circula
- Page 651 and 652:
LIGHT RAIL ELECTRIFICATION Operatio
- Page 653 and 654:
652 Transportation Research Circula
- Page 655 and 656:
654 Transportation Research Circula
- Page 657 and 658:
656 Transportation Research Circula
- Page 659 and 660:
658 Transportation Research Circula
- Page 661 and 662:
660 Transportation Research Circula
- Page 663 and 664:
662 Transportation Research Circula
- Page 665 and 666:
664 Transportation Research Circula
- Page 667 and 668:
666 Transportation Research Circula
- Page 669 and 670:
668 Transportation Research Circula
- Page 671 and 672:
670 Transportation Research Circula
- Page 673 and 674:
672 Transportation Research Circula
- Page 675 and 676:
674 Transportation Research Circula
- Page 677 and 678:
676 Transportation Research Circula
- Page 679 and 680:
L LIGHT RAIL ELECTRIFICATION Built-
- Page 681 and 682:
680 Transportation Research Circula
- Page 683 and 684:
682 Transportation Research Circula
- Page 685 and 686:
684 Transportation Research Circula
- Page 687 and 688:
686 Transportation Research Circula
- Page 689 and 690:
688 Transportation Research Circula
- Page 691 and 692:
690 Transportation Research Circula
- Page 693 and 694:
692 Transportation Research Circula
- Page 695 and 696:
694 Transportation Research Circula
- Page 697 and 698:
T LIGHT RAIL ELECTRIFICATION One Br
- Page 699 and 700:
FIGURE 1 Light rail in Portland.
- Page 701 and 702:
700 Transportation Research Circula
- Page 703 and 704:
702 Transportation Research Circula
- Page 705 and 706:
704 Transportation Research Circula
- Page 707 and 708:
FIGURE 2 Voltage profile.
- Page 709 and 710:
708 Transportation Research Circula
- Page 711 and 712:
710 Transportation Research Circula
- Page 713 and 714:
714 Transportation Research Circula
- Page 715 and 716:
716 Transportation Research Circula
- Page 717 and 718:
718 Transportation Research Circula
- Page 719 and 720:
720 Transportation Research Circula
- Page 721 and 722:
722 Transportation Research Circula
- Page 723 and 724:
724 Transportation Research Circula
- Page 725 and 726:
726 Transportation Research Circula
- Page 727 and 728:
728 Transportation Research Circula
- Page 729 and 730:
730 Transportation Research Circula
- Page 731 and 732:
732 Transportation Research Circula
- Page 733 and 734:
734 Transportation Research Circula
- Page 735 and 736:
736 Transportation Research Circula
- Page 737 and 738:
738 Transportation Research Circula
- Page 739 and 740:
740 Transportation Research Circula
- Page 741 and 742:
742 Transportation Research Circula
- Page 743 and 744:
744 Transportation Research Circula
- Page 745 and 746:
746 Transportation Research Circula
- Page 747 and 748:
748 Transportation Research Circula
- Page 749 and 750:
750 Transportation Research Circula
- Page 751 and 752:
752 Transportation Research Circula
- Page 753 and 754:
754 Transportation Research Circula
- Page 755 and 756:
756 Transportation Research Circula
- Page 757 and 758:
758 Transportation Research Circula
- Page 759 and 760:
760 Transportation Research Circula
- Page 761 and 762:
762 Transportation Research Circula
- Page 763 and 764:
764 Transportation Research Circula
- Page 765 and 766:
766 Transportation Research Circula
- Page 767 and 768:
768 Transportation Research Circula
- Page 769 and 770:
770 Transportation Research Circula
- Page 771 and 772:
772 Transportation Research Circula
- Page 773 and 774:
774 Transportation Research Circula
- Page 775 and 776:
776 Transportation Research Circula
- Page 777 and 778:
778 Transportation Research Circula
- Page 779 and 780:
780 Transportation Research Circula
- Page 781 and 782:
TRANSPORTATION RESEARCH BOARD 2003
- Page 783 and 784:
Officers George F. Dixon, III, Chai
- Page 785:
APTA Officers and Board of Director
- Page 788 and 789:
The National Academy of Sciences is