DFS Series Digital Force Gauge With Integral Loadcell - Ross Brown ...
DFS Series Digital Force Gauge With Integral Loadcell - Ross Brown ...
DFS Series Digital Force Gauge With Integral Loadcell - Ross Brown ...

You also want an ePaper? Increase the reach of your titles
YUMPU automatically turns print PDFs into web optimized ePapers that Google loves.
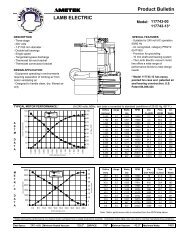
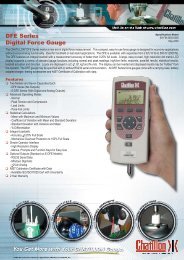
Advanced Measurement Functions.<br />
Load Averaging<br />
Two methods of load averaging are standard with your <strong>DFS</strong>. Load averaging is<br />
useful to determining load characteristics of long test periods or for samples with<br />
characteristically noisy load readings.<br />
Load Method<br />
This method allows you to defi ne a load threshold. The gauge will begin taking<br />
readings once the load threshold has been reached and will continue to take and<br />
average readings until the measured load falls below the threshold value.<br />
Percentage and Sharp Break Detection<br />
Break detection is provided and two types of breaks are supported. A sharp break<br />
can be used to detect whenever the load measurement drops 5% from a peak<br />
load. Alternatively, you may override the sharp break and setup the gauge with a<br />
% break detector. The % break detector allows you to set the drop percentage that<br />
is used to defi ne a break. This type of break is useful on samples with high elastic<br />
characteristics.<br />
View Break<br />
View Average Load<br />
T<br />
Preload 25<br />
32.05 T-PK<br />
LBF<br />
Xmit-W Clear More<br />
View Average Load<br />
T<br />
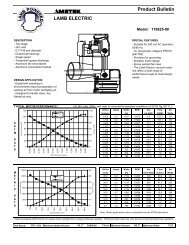
Time Method<br />
The Time method allows you to establish your load averaging based on a load<br />
threshold and time duration. The load threshold determines the start of the averaging,<br />
while the time duration defi nes the length of the test period. The gauge will<br />
begin taking readings when the threshold is reached and will continue to take and<br />
average readings until the time duration has expired.<br />
C<br />
Preload 25<br />
32.05 T-PK<br />
LBF<br />
Time 60sec<br />
Xmit-W Clear More<br />
C<br />
T<br />
10% Break<br />
Peak 50.2%TB<br />
Break 48.5LBF<br />
BkPt 25.0<br />
Xmit-W Clear More<br />
Load Comparison<br />
Load comparisons of up to two sets of 5 results may be measured using the <strong>DFS</strong>.<br />
The gauge will measure and store up to 5 results for each of two tests (10 results).<br />
The gauge will then display the fi rst set of results with the second set of results and<br />
calculate statistical relationships such as % difference, COV, variance and standard<br />
deviation. This feature is ideal for functional capacity testing.<br />
View Load Comparion<br />
T<br />
3 Results<br />
C<br />
Test 1 50.2<br />
Test 2 48.5LBF<br />
Var 1.5 (3.1%)<br />
Xmit-W Clear More<br />
C<br />
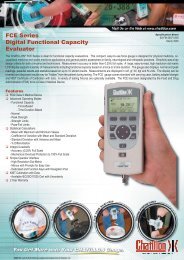
Automate with Nexygen Software<br />
Your <strong>DFS</strong> can make use of our Nexygen software for gauge applications. <strong>With</strong><br />
Nexygen software, you can perform tests and graph results automatically using a<br />
personal computer. Load results may be shown graphically versus time. Tabular<br />
results are displayed and can be used to create relationships, queries or used to<br />
produce reports. You can format the display to match your requirements and establish<br />
pre- and post-test questions that require the operator to answer questions based on<br />
the test setup. Setup is easy too. Menus, radio buttons and prompts guide you through<br />
instrument and test setup. Since Nexygen software is OLE2 compatible, information<br />
can be exchanged transparently with Microsoft Word, Excel, Access, PowerPoint and<br />
Outlook. You won’t fi nd a more comprehensive gauge software package!