CHAPTER 4 RESULTS AND DISCUSSION
CHAPTER 4 RESULTS AND DISCUSSION
CHAPTER 4 RESULTS AND DISCUSSION

Create successful ePaper yourself
Turn your PDF publications into a flip-book with our unique Google optimized e-Paper software.
52<br />
<strong>CHAPTER</strong> 4<br />
<strong>RESULTS</strong> <strong>AND</strong> <strong>DISCUSSION</strong><br />
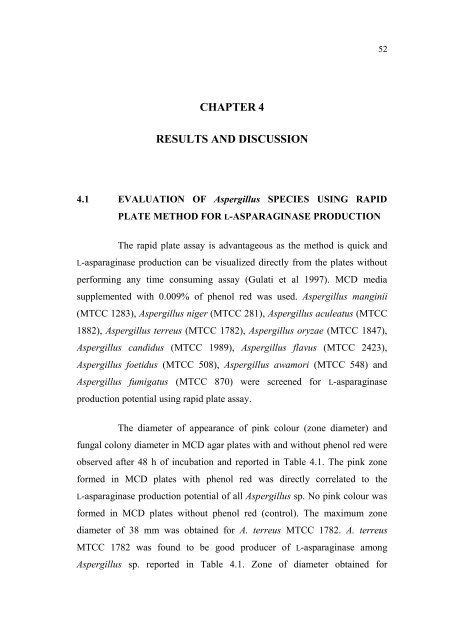
4.1 EVALUATION OF Aspergillus SPECIES USING RAPID<br />
PLATE METHOD FOR L-ASPARAGINASE PRODUCTION<br />
The rapid plate assay is advantageous as the method is quick and<br />
L-asparaginase production can be visualized directly from the plates without<br />
performing any time consuming assay (Gulati et al 1997). MCD media<br />
supplemented with 0.009% of phenol red was used. Aspergillus manginii<br />
(MTCC 1283), Aspergillus niger (MTCC 281), Aspergillus aculeatus (MTCC<br />
1882), Aspergillus terreus (MTCC 1782), Aspergillus oryzae (MTCC 1847),<br />
Aspergillus candidus (MTCC 1989), Aspergillus flavus (MTCC 2423),<br />
Aspergillus foetidus (MTCC 508), Aspergillus awamori (MTCC 548) and<br />
Aspergillus fumigatus (MTCC 870) were screened for L-asparaginase<br />
production potential using rapid plate assay.<br />
The diameter of appearance of pink colour (zone diameter) and<br />
fungal colony diameter in MCD agar plates with and without phenol red were<br />
observed after 48 h of incubation and reported in Table 4.1. The pink zone<br />
formed in MCD plates with phenol red was directly correlated to the<br />
L-asparaginase production potential of all Aspergillus sp. No pink colour was<br />
formed in MCD plates without phenol red (control). The maximum zone<br />
diameter of 38 mm was obtained for A. terreus MTCC 1782. A. terreus<br />
MTCC 1782 was found to be good producer of L-asparaginase among<br />
Aspergillus sp. reported in Table 4.1. Zone of diameter obtained for
53<br />
Aspergillus terreus MTCC 1782 in rapid plates assay is shown in<br />
Figure A.1.1: (a) plate with dye, (b) plate without dye and (c) plate with dye<br />
and without inoculum. Rapid plate assay was found to be fast and an efficient<br />
method for screening of fungal species. A. terreus MTCC 1782 was found to<br />
be good producer of L-asparaginase among the Aspergillus species studied.<br />
Thus A. terreus MTCC 1782 was selected as potential fungal source for<br />
L-asparaginase production in further study.<br />
Table 4.1 Zone and colony diameter of various Aspergillus species<br />
screened for L-asparaginase production<br />
Sl.<br />
No.<br />
Aspergillus<br />
species<br />
Zone<br />
diameter,<br />
mm<br />
with dye<br />
Colony<br />
diameter,<br />
mm<br />
without dye<br />
Zone<br />
diameter,<br />
mm<br />
Colony<br />
diameter,<br />
mm<br />
1 Aspergillus terreus 38 24 -- 22<br />
2 Aspergillus niger 36 22 -- 20<br />
3 Aspergillus oryzae 34 20 -- 22<br />
4<br />
Aspergillus<br />
fumigates<br />
34 22 -- 20<br />
5 Aspergillus flavus 32 20 -- 18<br />
6<br />
7<br />
8<br />
9<br />
10<br />
Aspergillus<br />
awamori<br />
Aspergillus<br />
aculeatus<br />
Aspergillus<br />
foetidus<br />
Aspergillus<br />
candidus<br />
Aspergillus<br />
manginii<br />
28 18 -- 22<br />
24 16 -- 18<br />
18 10 -- 12<br />
20 12 -- 14<br />
16 12 -- 14
54<br />
4.2 EVALUATION <strong>AND</strong> OPTIMIZATION OF VARIOUS<br />
NATURAL SUBSTRATE, SODIUM NITRATE <strong>AND</strong><br />
L-ASPARAGINE FOR L-ASPARAGINASE PRODUCTION<br />
BY Aspergillus terreus MTCC 1782 USING CLASSICAL<br />
METHOD OF ONE-FACTOR AT A TIME APPROACH<br />
The effect of synthetic L-proline and natural substrates namely<br />
SBMF, GNOC powder, CSOC powder, peanut flour and wheat bran powder<br />
in submerged fermentation of A. terreus MTCC 1782 for production of<br />
extracellular L-asparaginase was studied using classical method of one factor<br />
at a time approach. The influence of sodium nitrate as additional nitrogen<br />
source, L-asparagine as inducer was also studied.<br />
4.2.1 Effect of synthetic L-proline and natural substrates on<br />
L-asparaginase production<br />
The concentration of L-proline was varied from 0.5% to 3% (w/v)<br />
in MCD media to study the effect of L-proline on L-asparaginase production<br />
by A. terreus MTCC 1782. The operating condition variables such as<br />
agitation speed, temperature and pH were maintained at 160 rpm, 32ºC and<br />
6.2, respectively (Sarquis et al 2004). L-asparaginase activity obtained in<br />
different days for varied concentration of L-proline is shown in Figure 4.1.<br />
The MCD media containing 2% L-proline showed maximum enzyme activity<br />
of 13.92 IU/mL on second day. Decrease in L-asparaginase activity was<br />
observed after second day for all L-proline concentration.<br />
The SBMF, GNOC powder, CSOC powder, peanut flour and wheat<br />
bran powder (mesh size of 80/120) in MCD media were evaluated as alternate<br />
to L-proline for L-asparaginase production by A. terreus MTCC 1782. The<br />
operating conditions such as agitation speed, temperature and pH were<br />
maintained at 160 rpm, 32ºC and 6.2. The concentration of soya bean meal<br />
was varied from 1% to 5% in MCD media. The effect of varied concentration
55<br />
of soya bean meal on L-asparaginase production is shown in Figure 4.2. It was<br />
observed that the MCD media containing 3% soya bean meal showed<br />
maximum enzyme activity of 9 IU/mL on third day of growth, while other<br />
concentrations exhibited lower enzyme activity.<br />
The concentration of GNOC powder was varied from 1% to 5% in<br />
MCD media. The effect of varied concentration of GNOC powder on<br />
L-asparaginase production is shown in Figure 4.3. It was observed that media<br />
containing 2% GNOC powder showed maximum enzyme activity of<br />
9.17 IU/mL on fourth day, while other concentrations exhibited lower enzyme<br />
activity. The effect of varied concentration of cottonseed oil cake on<br />
L-asparaginase production is shown in Figure 4.4. It was observed that the<br />
media containing 3% concentration of CSOC powder showed maximum<br />
enzyme activity of 8.26 IU/mL on fourth day, while other concentrations<br />
exhibited lower enzyme activity.<br />
The concentration of peanut flour was varied from 1% to 5 % in<br />
MCD media. The effect of varied concentration of peanut flour on<br />
L-asparaginase production is shown in Figure 4.5. It was observed that media<br />
containing 4% peanut flour showed maximum enzyme activity of 7.25 IU/mL<br />
on third day, while other concentration exhibited lower enzyme activity. The<br />
concentration of wheat bran powder was varied from 1% to 5% in MCD<br />
media. The effect of varied concentration of wheat bran powder on<br />
L-asparaginase production is shown in Figure 4.6. It was observed that media<br />
containing 2% wheat bran showed maximum enzyme activity of 4.32 IU/mL<br />
on fourth day, while other concentrations exhibited lower enzyme activity.<br />
The decrease in enzyme activity was observed after 3 rd /4 th day of<br />
incubation. This may be due to the depletion of the substrate at all concentrations.<br />
However the increase in L-asparaginase activity is found with increase in substrate<br />
concentration and then the activity decreases at their higher concentrations. The<br />
decrease in enzyme activity at higher concentration of substrate may be due to
56<br />
the substrate inhibition. The optimum level of these substrates was selected to<br />
explore the effect of additional nitrogen source (Sodium nitrate) and inducer<br />
(L-asparagine).<br />
Figure 4.1 Effect of synthetic L-proline on L-asparaginase production<br />
Figure 4.2 Effect of SBMF on L-asparaginase production
57<br />
Figure 4.3 Effect of GNOC powder on L-asparaginase production<br />
Figure 4.4 Effect of CSOC powder on L-asparaginase production
58<br />
Figure 4.5 Effect of peanut flour on L-asparaginase production<br />
Figure 4.6 Effect of wheat bran powder on L-asparaginase production
59<br />
4.2.2 Effect of sodium nitrate on L-asparaginase production using<br />
synthetic L-proline and natural substrates<br />
The effect of sodium nitrate as supplementary nitrogen source on<br />
L-asparaginase production by A. terreus MTCC 1782 using optimum<br />
concentration of synthetic L-proline, SBMF, GNOC powder, CSOC powder,<br />
peanut and wheat in MCD media was studied. Sodium nitrate concentration<br />
was varied from 0.5% to 2.5%. The effect of varied concentration of sodium<br />
nitrate on L-asparaginase production using 2% L-proline in MCD media is<br />
shown in Figure 4.7. It was observed that the 1.5% of sodium nitrate in MCD<br />
media containing 2% L-proline has shown maximum L-asparaginase activity<br />
of 23.31 IU/mL on third day, while other sodium nitrate concentration<br />
exhibited lower L-asparaginase activity.<br />
The effect of varied concentration of sodium nitrate on<br />
L-asparaginase production using MCD media containing 3% SBMF media is<br />
shown in Figure 4.8. It was observed that the media containing 2% sodium<br />
nitrate showed maximum L-asparaginase activity of 16.08 IU/mL on third day<br />
while other sodium nitrate concentration exhibited lower L-asparaginase<br />
activity.<br />
The effect of varied concentration of sodium nitrate on<br />
L-asparaginase production using 2% GNOC powder in MCD media is shown<br />
in Figure 4.9. It was observed that the media containing 1% sodium nitrate<br />
showed maximum L-asparaginase activity of 10.83 IU/mL on forth day, while<br />
other sodium nitrate concentrations exhibited lower L-asparaginase activity.<br />
The effect of varied concentration of sodium nitrate on L-asparaginase<br />
production using 3% cottonseed oil cake in MCD media is shown in<br />
Figure 4.10. The highest L-asparaginase activity is obtained for 1% sodium<br />
nitrate, with 10.61 IU/mL on fifth day, while other sodium nitrate<br />
concentration exhibited lower L-asparaginase activity.
60<br />
The effect of varied concentration of sodium nitrate on<br />
L-asparaginase production using MCD media containing 4% peanut media is<br />
shown in Figure 4.11. It was observed that the media containing 2% sodium<br />
nitrate showed maximum L-asparaginase activity of 13.60 IU/mL on third day<br />
while other sodium nitrate concentration exhibited lower L-asparaginase<br />
activity. The effect of varied concentration of sodium nitrate on<br />
L-asparaginase production using MCD media with 2% wheat bran powder is<br />
shown in Figure 4.12. It was observed that the media containing 2% sodium<br />
nitrate showed maximum L-asparaginase activity of 7.41 IU/mL on fourth day<br />
while other sodium nitrate concentrations exhibited lower L-asparaginase<br />
activity.<br />
The 0.5% sodium nitrate has not significantly increased the<br />
L-asparaginase activity after fourth day of fermentation; this may be due to<br />
the insufficient nitrogen source. The 1% sodium nitrate was identified to give<br />
maximum L-asparaginase production using synthetic L-proline. The 2%<br />
sodium nitrate was identified to yield maximum L-asparaginase activity for<br />
the natural substrates, namely, SBMF, peanut flour and wheat bran powder.<br />
The 1% sodium nitrate was identified to give maximum L-asparaginase<br />
production using natural substrates, namely, GNOC and CSOC. The optimum<br />
concentration of sodium nitrate was used for further investigation on effect of<br />
L-asparagine in L-asparaginase production by A. terreus MTCC 1782.
61<br />
Figure 4.7<br />
Effect of sodium nitrate on L-asparaginase production using<br />
2% synthetic L-proline<br />
Figure 4.8<br />
Effect of sodium nitrate on L-asparaginase production using<br />
3% SBMF
62<br />
Figure 4.9<br />
Effect of sodium nitrate on L-asparaginase production using<br />
2% GNOC powder<br />
Figure 4.10 Effect of sodium nitrate on L-asparaginase production using<br />
3% CSOC powder
63<br />
Figure 4.11 Effect of sodium nitrate on L-asparaginase production using<br />
4% peanut flour<br />
Figure 4.12 Effect of sodium nitrate on L-asparaginase production using<br />
2% wheat bran powder
64<br />
4.2.3 Effect of L-asparagine on L-asparaginase production using<br />
synthetic L-proline and natural substrates<br />
The L-asparagine concentration was varied from 0.4% to 1.4% in<br />
MCD to study its effect on L-asparaginase production by A. terreus MTCC<br />
1782 using optimum concentration of substrates namely synthetic L-proline,<br />
SBMF, GNOC powder, CSOC powder, wheat bran powder, peanut powder<br />
and supplemented with optimum concentration of sodium nitrate as additional<br />
nitrogen source. L-asparagine acts as an inducer in L-asparaginase production.<br />
The effect of L-asparagine on production of L-asparaginase using 2%<br />
L-proline supplemented and 1% sodium nitrate in MCD media is shown in<br />
Figure 4.13. It was observed that the 1% L-asparagine gave maximum<br />
L-asparaginase activity of 34.98 IU/mL on the third day of fermentation,<br />
while other L-asparagine concentrations exhibited low L-asparaginase activity.<br />
The MCD media with optimal concentration of the natural substrate<br />
and sodium nitrate was used to study the effect of L-asparagine on<br />
L-asparaginase production by A. terreus MTCC 1782. L-asparagine acts as a<br />
precursor in L-asparaginase production. The L-asparagine was varied from<br />
0.6% to 1.4%. The effect of L-asparagine on L-asparaginase production using<br />
3% SBMF and 2% sodium nitrate MCD media is shown in Figure 4.14. The<br />
1.2% L-asparagine has shown maximum L-asparaginase activity of 27.78 IU/mL<br />
on third day of fermentation, while the other L-asparagine concentrations<br />
exhibited low L-asparaginase activity. The effect of L-asparagine on<br />
L-asparaginase production using 2% GNOC powder and 1% of sodium nitrate<br />
in MCD media is shown in Figure 4.15. It was observed that the 1.2%<br />
L-asparagine gave maximum L-asparaginase activity of 30.35 IU/mL on<br />
fourth day of fermentation, while other L-asparagine concentrations exhibited<br />
lower enzyme activity.<br />
The effect of L-asparagine on L-asparaginase production using 3%<br />
CSOC powder and 1% sodium nitrate in MCD media is shown in Figure 4.16.
65<br />
It was observed that the 1% L-asparagine gave maximum L-asparaginase<br />
activity of 22.82 IU/mL on fifth day of fermentation, while other L-asparagine<br />
concentrations exhibited low L-asparaginase activity. The effect of<br />
L-asparagine on L-asparaginase production using MCD media with 4% peanut<br />
flour and 2% sodium nitrate is shown in Figure 4.17. The 1.2% L-asparagine<br />
has shown maximum L-asparaginase activity of 15.20 IU/mL on third day of<br />
fermentation, while the other L-asparagine concentrations exhibited low<br />
L-asparaginase activity. The effect of L-asparagine on MCD media with 2%<br />
wheat bran powder and 2% sodium nitrate is shown in Figure 4.18. The 1.2%<br />
L-asparagine has shown maximum L-asparaginase activity of 10.03 IU/mL on<br />
fourth day of fermentation, while the other L-asparagine concentrations exhibited<br />
low L-asparaginase activity. The decrease in L-asparaginase activity with increase<br />
in L-asparagine above 1.2% optimum concentration was observed. The<br />
L-asparaginase production by A. terreus MTCC 1782 was found enhanced<br />
using the optimum concentration of all substrate along with sodium nitrate as<br />
supplementary nitrogen source and L-asparagine as an inducer MCD media.<br />
Figure 4.13 Effect of L-asparagine on L-asparaginase production using<br />
2% L-proline and 1% sodium nitrate
66<br />
Figure 4.14 Effect of L-asparagine on L-asparaginase production using<br />
3% SBMF and 2% sodium nitrate<br />
Figure 4.15 Effect of L-asparagine on L-asparaginase production using<br />
2% GNOC powder and 1% sodium nitrate
67<br />
Figure 4.16 Effect of L-asparagine on L-asparaginase production using<br />
3% CSOC powder and 1% sodium nitrate<br />
Figure 4.17 Effect of L-asparagine on L-asparaginase production using<br />
4% peanut flour and 2% sodium nitrate
68<br />
Figure 4.18 Effect of L-asparagine on L-asparaginase production using<br />
2% wheat bran powder and 2% sodium nitrate<br />
The maximum<br />
L-asparaginase activity obtained for optimum<br />
concentration of various substrates, sodium nitrate and L-asparagine are<br />
compared with control experiment using L-asparagine as sole nitrogen source.<br />
The MCD media with 1% L-asparagine as the sole nitrogen source (control<br />
experiment) gave the L-asparaginase activity of 5.71 IU/mL. The maximum<br />
L-asparaginase activity of 34.98 IU/mL was obtained using MCD media with<br />
2% L-proline, 1% sodium nitrate and 1% L-asparagine. The maximum<br />
L-asparaginase activity of 30.35 IU/mL was obtained using MCD media with<br />
2% GNOC powder, 1% sodium nitrate and 1.2% L-asparagine. The maximum<br />
L-asparaginase activity of 27.78 IU/mL was obtained using MCD media with<br />
3% SBMF, 2% sodium nitrate and 1.2% L-asparagine. The maximum<br />
L-asparaginase activity obtained using CSOC powder (22.82 IU/mL), peanut<br />
flour (15.19 IU/mL) and wheat bran powder (10.03 IU/mL) based MCD<br />
media supplemented with sodium nitrate and L-asparagine was comparatively
69<br />
lower than L-proline, GNOC powder and SBMF based MCD media<br />
supplemented with sodium nitrate and L-asparagine.<br />
The L-asparaginase activity obtained using optimum concentration<br />
of various substrate, sodium nitrate as supplementary nitrogen source and<br />
L-asparagine as an inducer MCD media was comparatively higher than the<br />
maximum L-asparaginase activity of 19.5 IU/mL obtained using media<br />
containing 2% (w/v) L-asparagine as the sole substrate along with 1% (w/v)<br />
ammonium sulfate as an additional nitrogen source using isolated Aspergillus sp.<br />
(Sreenivasulu et al 2009) and L-asparaginase activity of 6.3 IU/mL for<br />
Bipolaris sp. BR438 using MCD medium containing 1% L-asparagine as the<br />
sole substrate (Lapmak et al 2010).<br />
Thus the synthetic L-proline, SBMF and GNOC powder based<br />
MCD media with sodium nitrate and L-asparagine were considered for<br />
optimization of carbon source and operating conditions for L-asparaginase<br />
production by A. terreus MTCC 1782 using classical method of one-factor at<br />
a time approach.<br />
4.3 EVALUATION <strong>AND</strong> OPTIMIZATION OF CARBON<br />
SOURCE FOR L-ASPARAGINASE PRODUCTION BY<br />
A. terreus MTCC 1782 USING CLASSICAL METHOD OF<br />
ONE FACTOR AT A TIME APPROACH<br />
The independent effect of various carbon sources such as glucose,<br />
sucrose, maltose, fructose and lactose on L-asparaginase production was<br />
studied using optimum concentration of different substrates namely, synthetic<br />
L-proline, SBMF and GNOC powder in MCD media. The concentration of<br />
sodium nitrate and L-asparagine was fixed at their optimum concentration<br />
found in classical method. The best carbon source was optimized using<br />
classical method of one factor at a time approach.
70<br />
The influence of various carbon sources such as glucose, sucrose,<br />
maltose, fructose and lactose was studied for extracellular L-asparaginase<br />
production by A. terreus MTCC 1782 in submerged fermentation using<br />
synthetic L-proline, SBMF and GNOC powder. The effect of various carbon<br />
sources on L-asparaginase production by A. terreus MTCC 1782 is shown in<br />
Figure 4.19, 4.20 and 4.21. The glucose was found as the best carbon source<br />
for L-asparaginase production by A. terreus MTCC 1782 using MCD media<br />
with L-proline as substrate along with 1% sodium nitrate and 1% L-asparagine<br />
(Figure 4.19). The maximum L-asparaginase activity of 30.50 IU/mL<br />
observed was for glucose followed by fructose and lactose. Sucrose was<br />
found as the best carbon source for L-asparaginase production by A. terreus<br />
MTCC 1782 using MCD media with 2% GNOC powder as substrate along<br />
with 1% sodium nitrate and 1.2% L-asparagine (Figure 4.20). The maximum<br />
L-asparaginase activity observed was 30.39 IU/mL for glucose followed by<br />
fructose and lactose. The glucose was found as the best carbon source for<br />
L-asparaginase production by A. terreus MTCC 1782 using MCD media with<br />
3% SBMF as substrate with 2% sodium nitrate and 1.2% L-asparagine<br />
(Figure 4.21). The maximum L-asparaginase activity observed was 29.86<br />
IU/mL for glucose followed by fructose and lactose.<br />
The effect of varied concentration of glucose on L-asparaginase<br />
production by A. terreus MTCC 1782 using 2% L-proline as substrate, 1%<br />
sodium nitrate and 1% L-asparagine is shown in Figure 4.22. The glucose<br />
concentration was from 0.2% to 1.2%. It was observed that the 0.6% glucose<br />
gave the maximum L-asparaginase activity of 35.03 IU/mL; low<br />
L-asparaginase activity was observed for all other glucose concentration. The<br />
effect of varied concentration of sucrose on L-asparaginase production by<br />
A. terreus MTCC 1782 using MCD media with 2% groundnut oil cake flour<br />
as substrate, 1% sodium nitrate and 1.2% L-asparagine is given in shown in
71<br />
Figure 4.23. The sucrose concentration was from 0.2% to 1.2%. It was<br />
observed that the 0.8% sucrose gave the maximum L-asparaginase activity of<br />
35.30 IU/mL; low L-asparaginase activity was observed for all other sucrose<br />
concentration. The effect of glucose on L-asparaginase production by<br />
A. terreus MTCC 1782 using MCD media with 3% SBMF as substrate, 2%<br />
sodium nitrate and 1.2% L-asparagine is shown in Figure 4.24. The glucose<br />
concentration was from 0.2% to 1.2%. It was observed that the 0.6% glucose<br />
gave the maximum L-asparaginase activity of 36.04 IU/mL; low<br />
L-asparaginase activity was obtained at all other glucose concentration. Hence<br />
the 0.6% glucose, 0.8% sucrose and 0.6% glucose were for further studies in<br />
L-asparaginase production using L-proline, GNOC powder and SBMF,<br />
respectively.<br />
The role of carbon source in the synthesis of L-asparaginase is<br />
controversial. It is generally accepted as catabolic repression in the case of<br />
E. coli and Erwinia aeroideae at higher concentration (Jeffries 1976; Liu et al<br />
1972). Glucose was the best carbon source under aerobic conditions for<br />
synthesis of L-asparaginase by Serratia marcescens (Sukumaran et al 1979).<br />
In contrast when the gram-positive bacteria were grown on nutritional<br />
conditions in which the nitrogen source was apparently the limiting factor for<br />
growth, the level of L-asparaginase activity increased, whereas the<br />
L-asparaginase activity was decreased when limiting for carbon source<br />
(Golden et al 1985). In the present work the MCD media containing rich<br />
nitrogen source along with carbon source enhanced the L-asparaginase<br />
production by A. terreus MTCC 1782.
72<br />
Figure 4.19 Effect of various carbon sources on L-asparaginase<br />
production using 2% L-proline, 1% sodium nitrate and 1%<br />
L-asparagine<br />
Figure 4.20 Effect of various carbon sources on L-asparaginase<br />
production using 2% GNOC powder, 1% sodium nitrate<br />
and 1.2% L-asparagine
73<br />
Figure 4.21 Effect of various carbon sources on L-asparaginase<br />
production using 3% SBMF, 2% sodium nitrate and 1.2%<br />
L-asparagine<br />
Figure 4.22 Effect of glucose on L-asparaginase production using 2%<br />
L-proline, 1% sodium nitrate and 1% L-asparagine
74<br />
Figure 4.23 Effect of sucrose on L-asparaginase production using 2%<br />
GNOC powder, 1% sodium nitrate and 1.2% L-asparagine<br />
Figure 4.24 Effect of glucose on L-asparaginase production using 3%<br />
SBMF, 2% sodium nitrate and 1.2% L-asparagine
75<br />
4.4 STATISTICAL <strong>AND</strong> EVOLUTIONARY OPTIMIZATION<br />
OF FERMENTATION MEDIA COMPONENTS FOR<br />
ENHANCED L-ASPARAGINASE PRODUCTION BY<br />
A. terreus MTCC 1782<br />
The sequential optimization strategy of design of experiments and<br />
ANN linked GA were employed for evaluation and optimization of<br />
fermentation media components for enhanced production of L-asparaginase<br />
by A. terreus 1782 under submerged fermentation using different substrates<br />
namely synthetic L-proline, SBMF and GNOC powder.<br />
4.4.1 Optimization of media components for L-asparaginase<br />
production using L-proline as substrate<br />
The independent effect of fermentation media components for<br />
L-asparaginase production by A. terreus MTCC 1782 using MCD media<br />
containing synthetic substrate L-proline was evaluated using PB design. The<br />
first four significant and important fermentation media components were<br />
further optimized using RSM based 5-level CCD for four variables and ANN<br />
linked GA for maximum L-asparaginase production.<br />
4.4.1.1 Sequential optimization of media components using design of<br />
experiments<br />
The effect of seven medium components and initial pH on<br />
production of L-asparaginase by A. terreus was studied using PB design given<br />
in Table 4.2. The L-asparaginase activity obtained using PBD experiments<br />
showed a wide variation from 10.88 IU/mL to 36.58 IU/mL of L-asparaginase<br />
activity. It was subjected to statistical analysis using MINITAB 15.0 software<br />
to estimate independent effect, t-value, p-value and confidence level. The<br />
regression coefficients, t-value and confidence level are reported in Table 4.3.
76<br />
The variables with positive regression coefficient represent an increase in<br />
L-asparaginase activity due to the increase in concentration of the variables.<br />
The variables with negative regression coefficient represent decrease in<br />
L-asparaginase activity due to the increase in concentration of the variables.<br />
The media components namely L-proline (x 1 ), sodium nitrate (x 2 ),<br />
L-asparagine (x 3 ), glucose (x 4 ) and pH (x 8 ) were found to increase the<br />
L-asparaginase activity at their high level. Whereas, the media components<br />
namely di-potassium hydrogen phosphate (x 5 ), magnesium sulfate (x 6 ) and<br />
potassium chloride (x 7 ) were found to decrease the L-asparaginase activity at<br />
their higher level.<br />
Table 4.2 PBD in actual unit of L-proline (x 1 ), sodium nitrate (x 2 ),<br />
L-asparagine (x 3 ) and glucose (x 4 ), di-potassium hydrogen<br />
phosphate (x 5 ), magnesium sulfate (x 6 ), potassium chloride<br />
(x 7 ) and pH (x 8 ) with experimental L-asparaginase activity<br />
Std.<br />
Order<br />
Media components, % (w/v)<br />
x 1 x 2 x 3 x 4 x 5 x 6 x 7 x 8<br />
L-Asparaginase<br />
activity,<br />
IU/mL<br />
1 3.0 0.5 1.5 0.5 0.1 0.04 0.06 6.5 28.37<br />
2 1.0 1.5 0.5 1.0 0.1 0.04 0.04 6.5 36.58<br />
3 1.0 1.5 1.5 0.5 0.2 0.04 0.04 6.0 26.55<br />
4 3.0 0.5 1.5 1.0 0.1 0.06 0.04 6.0 32.69<br />
5 3.0 1.5 0.5 1.0 0.2 0.04 0.06 6.0 22.50<br />
6 3.0 1.5 1.5 0.5 0.2 0.06 0.04 6.5 34.87<br />
7 1.0 1.5 1.5 1.0 0.1 0.06 0.06 6.0 34.29<br />
8 1.0 0.5 1.5 1.0 0.2 0.04 0.06 6.5 22.93<br />
9 1.0 0.5 0.5 1.0 0.2 0.06 0.04 6.5 16.32<br />
10 3.0 0.5 0.5 0.5 0.2 0.06 0.06 6.0 12.16<br />
11 1.0 1.5 0.5 0.5 0.1 0.06 0.06 6.5 10.88<br />
12 1.0 0.5 0.5 0.5 0.1 0.04 0.04 6.0 10.93
77<br />
Table 4.3 Statistical analysis of PBD for evaluation of media components<br />
and initial pH for L-asparaginase production<br />
Variable<br />
Main<br />
effect<br />
Coefficients t-value p-value<br />
Intercept 24.089 20.14
78<br />
Figure 4.25 Pareto plot shows the effect of media components and<br />
operating conditions on L-asparaginase activity (X 1 - L-proline;<br />
X 2 - Sodium nitrate; X 3 -L-asparagine; X 4 - Glucose; X 5 - Dipotassium<br />
hydrogen phosphate; X 6 - Magnesium sulfate;<br />
X 7 - Potassium chloride; X 8 - initial pH)<br />
The central composite design with two axial points at a distance<br />
α=2 from the design center and six replicates about the center point, making a<br />
total of 31 runs given in Table 4.4, was used for optimization of significant<br />
fermentation media components. The concentration of other media<br />
components was kept constant. The central composite design experiment was<br />
designed using the MINITAB 14.0 software. L-asparaginase production by<br />
A. terreus was carried out in 50 ml of submerged batch cultures in 250 mL<br />
Erlenmeyer flasks. The student’s t-test and F-test were performed using<br />
MINITAB 15.0 software for experimental L-asparaginase activity reported in<br />
Table 4.4. The coefficients, t-value and p-value for linear, quadratic and<br />
combined effects were given in the Table 4.5 at 95% significance level<br />
(p≤0.05). The p-values are used as a tool to check the significance of each of<br />
the coefficients, which in turn may indicate the pattern of the interactions<br />
between the variable. The smaller the p-value more significant is the
79<br />
corresponding coefficient. It was observed that the coefficient for overall<br />
effect of the variables was highly significant (p
80<br />
where Y LA is the L-asparaginase activity (IU/mL), X i and X j are independent<br />
variables (media components) in coded units. The RSM regression model<br />
predicated L-asparaginase activity for each CCD experiment is presented in<br />
Table 4.4.<br />
Table 4.4 Five-level CCD in actual unit of media components with<br />
Std.<br />
Order<br />
experimental, RSM and ANN predicted L-asparaginase activity<br />
Media components, % (w/v) L-Asparaginase activity, IU/mL<br />
RSM ANN<br />
x 1 x 2 x 3 x 4 Experimental<br />
predicted predicted<br />
1 1.0 0.5 0.5 0.5 18.34 15.90 18.33<br />
2 3.0 0.5 0.5 0.5 23.09 23.05 23.21<br />
3 1.0 1.5 0.5 0.5 26.61 26.88 26.61<br />
4 3.0 1.5 0.5 0.5 29.54 30.30 30.09<br />
5 1.0 0.5 1.5 0.5 23.99 25.17 24.19<br />
6 3.0 0.5 1.5 0.5 33.27 32.12 33.61<br />
7 1.0 1.5 1.5 0.5 38.23 35.38 37.35<br />
8 3.0 1.5 1.5 0.5 38.03 38.60 36.99<br />
9 1.0 0.5 0.5 1.0 11.25 12.03 10.58<br />
10 3.0 0.5 0.5 1.0 18.08 20.46 17.23<br />
11 1.0 1.5 0.5 1.0 18.45 19.13 18.34<br />
12 3.0 1.5 0.5 1.0 23.67 23.83 23.66<br />
13 1.0 0.5 1.5 1.0 23.62 22.39 23.76<br />
14 3.0 0.5 1.5 1.0 29.54 30.62 30.14<br />
15 1.0 1.5 1.5 1.0 27.35 28.73 27.42<br />
16 3.0 1.5 1.5 1.0 31.25 33.22 31.07<br />
17 0.0 1.0 1.0 0.75 14.88 16.43 14.63<br />
18 4.0 1.0 1.0 0.75 30.50 28.07 30.24<br />
19 2.0 0.0 1.0 0.75 24.21 24.36 24.02<br />
20 2.0 2.0 1.0 0.75 38.98 37.94 38.78<br />
21 2.0 1.0 0.0 0.75 16.21 15.37 16.61<br />
22 2.0 1.0 2.0 0.75 34.07 34.03 34.19<br />
23 2.0 1.0 1.0 0.25 28.69 30.98 28.50<br />
24 2.0 1.0 1.0 1.25 24.90 21.73 25.14<br />
25 2.0 1.0 1.0 0.75 38.39 38.73 38.82<br />
26 2.0 1.0 1.0 0.75 38.82 38.73 38.79<br />
27 2.0 1.0 1.0 0.75 38.82 38.73 38.80<br />
28 2.0 1.0 1.0 0.75 39.03 38.73 38.80<br />
29 2.0 1.0 1.0 0.75 38.61 38.73 38.80<br />
30 2.0 1.0 1.0 0.75 38.77 38.73 38.74<br />
31 2.0 1.0 1.0 0.75 38.71 38.73 38.75
81<br />
Table 4.5 Estimated regression coefficients for optimization of media<br />
components using CCD<br />
Variable<br />
Estimated<br />
coefficients<br />
t-value<br />
p-value<br />
Constant 38.73 53.559
82<br />
proline 2.18%, sodium nitrate 1.44%, L-asparagine 1.34% and glucose 0.63%<br />
with maximum predicted L-asparaginase activity of 42.61 IU/mL (Table 4.7).<br />
Table 4.6 Analysis of variance of RSM regression model relating<br />
significant media components and L-asparaginase activity<br />
Source<br />
Degree of<br />
freedom<br />
(DF)<br />
Sum of<br />
squares<br />
(SS)<br />
Mean<br />
square<br />
(MS)<br />
F-value<br />
p-value<br />
Regression 14 2111.14 150.796 41.18
83<br />
4.4.1.2 Optimization of media components using artificial neural<br />
network linked genetic algorithm<br />
Back propagation algorithms for a multilayer feed-forward ANN<br />
shown in Figure 4.27 was used to model the nonlinear relationships between<br />
significant media components and L-asparaginase activity. This network was<br />
used to train and evaluate the dependence of L-asparaginase activity on media<br />
components using adaptive gradient learning rule with learning rate of 0.1 and<br />
momentum of 0.4. ANN input parameters used for optimization of media<br />
components for L-asparaginase production by A. terreus using MCD media<br />
containing L-proline as substrate is shown Figure A.2.1. The ANN model<br />
predicted the L-asparaginase activity with high coefficient of determination<br />
(Cal.R 2 =0.997). This indicates that the ANN model is highly accurate in<br />
successful prediction of L-asparaginase activity. Hence the ANN shown in<br />
Figure 4.27 adequately represents the relationship between the media<br />
components and L-asparaginase activity. Though both RSM regression model<br />
and ANN model provided accurate predictions, ANN model (Cal.R 2 =0.997)<br />
showed better correlation with the high experimental L-asparaginase activity<br />
(40.86 IU/mL) than the RSM regression model (Cal.R 2 =0.973). Hence the<br />
optimization of significant media components for L-asparaginase production<br />
using the ANN model has provided accurate predictions and found to be more<br />
effective with a high degree of accuracy than CCD of RSM.<br />
Closeness of the experimental L-asparaginase activity and predicted<br />
L-asparaginase activity using RSM and ANN model is shown in Figure 4.28.<br />
The predicted R 2 -value of ANN model (Pred.R 2 =0.995) indicates that the<br />
predicted L-asparaginase activity of ANN model was more close to the<br />
experimental L-asparaginase activity than RSM model (Pred.R 2 =0.935). The<br />
predicted R 2 was nearer to the calculated R 2 in RSM regression model than ANN<br />
model. Hence the CCD optimization using RSM regression model was found to be<br />
more efficient and accurate in predicting the optimal concentration of media<br />
components for maximum L-asparaginase production than ANN model.
84<br />
GA with population size of 30, mutation rate of 0.1 and uniform<br />
cross overrate of 0.8 was used to optimize the ANN model to find the<br />
maximum L-asparaginase activity and optimum concentration of media<br />
components. The predicted optimum concentration of the medium<br />
components was L-proline 1.7%, sodium nitrate 1.99%, L-asparagine 1.38%<br />
and glucose 0.65%. The maximum predicted L-asparaginase activity of<br />
39.95 IU/mL at the optimum concentration is reported in Table 4.7. The<br />
percentage importance of significant medium components on L-asparaginase<br />
production was evaluated using GA and it is given in Figure 4.29. The<br />
percentage contribution of medium components on L-asparaginase production<br />
was found to be 35.05% by glucose, 28.13% by L-proline, 24.11% by<br />
L-asparagine and 12.71% by sodium nitrate. Best five optimum conditions<br />
predicted by ANN linked GA for maximum L-asparaginase activity is given in<br />
Table A.2.1.The predicted optimum concentration of the media components<br />
by ANN model was found as L-proline 1.7%, sodium nitrate 1.99%,<br />
L-asparagine 1.38% and glucose 0.65% with the validated experimental<br />
L-asparaginase production of 39.95 IU/mL.<br />
Figure 4.27 Back propagation artificial neural network for four input<br />
layer with four hidden layer
85<br />
Figure 4.28 Predicted distribution coefficient of RSM and ANN model<br />
predicted L-asparaginase activity<br />
Figure 4.29 Importance of media components on L-asparaginase<br />
production (X 4 - Glucose; X 1 - L-proline; X 3 - L-asparagine;<br />
X 2 - Sodium nitrate)
86<br />
4.4.1.3 Experimental validation of RSM and ANN predicted conditions<br />
The predicted condition obtained by RSM regression model and<br />
ANN model were experimentally verified. The confirmation experiments<br />
were conducted in triplicate using the optimum concentration of media<br />
components of RSM regression model and ANN model. The concentration of<br />
other media components and operations conditions were kept constant. The<br />
experimental L-asparaginase activity obtained using predicted optimal<br />
concentration of RSM regression model and ANN model are reported in<br />
Table 4.7. The experimental L-asparaginase activity of 40.37 IU/mL was<br />
obtained at the predicted optimal conditions of RSM regression model which<br />
was 5.25% less than the predicted activity of 42.61 IU/mL. The experimental<br />
L-asparaginase activity of 40.86 IU/mL was obtained at the predicted optimal<br />
conditions of ANN linked GA which was 2.28% higher than the predicted<br />
activity of 39.95 IU/mL. The ANN model was found to give better<br />
experimental validation than RSM regression model. L-asparaginase activity<br />
was found enhanced after ANN linked GA optimization approach when<br />
compared to reported L-asparaginase activity by statistical and classical<br />
method of one factor at a time approach. The reported activity for isolated<br />
Bipolaris sp. BR438 is 6.20 IU/mL (Lapmak et al 2010), isolated Aspergillus<br />
sp. 19.50 is IU/mL (Sreenivasulu et al 2009) and Streptomyces gulbargensis<br />
is 23.90 IU/mL (Lingappa et al 2009). L-asparaginase activity was enhanced<br />
by 14.37% than classical method of one factor at a time approach.<br />
Table 4.7 Optimum concentration of media components, RSM and ANN<br />
linked GA predicted and experimental L-asparaginase activity<br />
Approach<br />
Optimum<br />
concentration, % (w/v)<br />
L-Asparaginase activity,<br />
IU/mL Cal. R 2 value<br />
x 1 x 2 x 3 x 4 Predicted Experimental<br />
RSM 2.18 1.44 1.34 0.63 42.61 40.37 0.973<br />
ANN linked GA 1.70 1.99 1.38 0.65 39.95 40.86 0.997
87<br />
4.4.2 Optimization of media components for L-asparaginase<br />
production using SBMF as substrate<br />
The independent effect of fermentation media components on<br />
L-asparaginase production by A. terreus MTCC 1782 using natural substrate<br />
SBMF in MCD media was evaluated using PB design. The first four<br />
significant and important media components were further optimized using<br />
RSM based 5-level CCD for four variables and ANN linked GA for<br />
maximum L-asparaginase production.<br />
4.4.2.1 Sequential optimization of media components using design of<br />
experiments<br />
The experimental L-asparaginase activity obtained using PBD<br />
experiments are reported in Table 4.8; it showed a wide variation from 5.38 to<br />
36.36 IU/mL. The independent effect, coefficients, t-value, p-value and<br />
confidence level of the variables were estimated using MINITAB 15.0<br />
software and reported in Table 4.9. The media components with positive<br />
coefficients such as SBMF (x 1 ), sodium nitrate (x 2 ), L-asparagine (x 3 ),<br />
glucose (x 4 ) and pH (x 8 ) have increased the L-asparaginase production. The<br />
media components with negative coefficient such as di-potassium hydrogen<br />
phosphate (x 5 ), magnesium sulfate (x 6 ) and potassium chloride (x 7 ) have<br />
decreased the L-asparaginase production due to increase in the concentration.<br />
Pareto plot in Figure 4.30 shows the relative importance of media components<br />
and initial pH on L-asparaginase production. The media components with<br />
confidence level of 90% and above were considered as significant and above<br />
80–90% were considered as important for L-asparaginase production. It was<br />
confirmed from Table 4.9 and Figure 4.30 that the L-asparagine and SBMF<br />
are significant and sodium nitrate and glucose are other most important media<br />
components for L-asparaginase production. The significant and important
88<br />
media components were further optimized using CCD and ANN linked GA<br />
for maximum L-asparaginase production.<br />
The central composite design with two axial points at a distance<br />
α=2 from the design center and six replicates about the center point making a<br />
total of 31 run was used for optimization of media components. The student’s<br />
t-test and Fisher’s F-test of ANOVA were performed using the experimental<br />
L-asparaginase activity obtained using CCD given in Table 4.10. The<br />
coefficients, t-value and p-value of t-test for linear, quadratic and combined<br />
effects were given in the Table 4.11. The p-values are used as a tool to check<br />
the significance of each variable at 95 % significance level, which in turn<br />
indicates the pattern of the interaction effect of the variables on<br />
L-asparaginase production. The smaller the p-value more significant is the<br />
corresponding variable. It was observed from Table 4.11 that the overall<br />
effect of the media components has significant (p
89<br />
Table 4.8 PBD in actual unit of SBMF (x 1 ), sodium nitrate (x 2 ),<br />
L-asparagine (x 3 ) and glucose (x 4 ), di-potassium hydrogen<br />
phosphate (x 5 ), magnesium sulfate (x 6 ), potassium chloride<br />
(x 7 ) and pH (x 8 ) with experimental L-asparaginase activity<br />
Std.<br />
order<br />
Media components, % (w/v)<br />
L-Asparaginase<br />
activity, IU/mL<br />
x 1 x 2 x 3 x 4 x 5 x 6 x 7 x 8<br />
1 4.0 0.5 1.5 0.5 0.1 0.04 0.06 6.5 30.28<br />
2 4.0 1.5 0.5 1.0 0.1 0.04 0.04 6.5 36.36<br />
3 2.0 1.5 1.5 0.5 0.2 0.04 0.04 6.0 21.01<br />
4 4.0 0.5 1.5 1.0 0.1 0.06 0.04 6.0 24.42<br />
5 4.0 1.5 0.5 1.0 0.2 0.04 0.06 6.0 21.91<br />
6 4.0 1.5 1.5 0.5 0.2 0.06 0.04 6.5 31.19<br />
7 2.0 1.5 1.5 1.0 0.1 0.06 0.06 6.0 31.56<br />
8 2.0 0.5 1.5 1.0 0.2 0.04 0.06 6.5 17.97<br />
9 2.0 0.5 0.5 1.0 0.2 0.06 0.04 6.5 10.29<br />
10 4.0 0.5 0.5 0.5 0.2 0.06 0.06 6.0 7.41<br />
11 2.0 1.5 0.5 0.5 0.1 0.06 0.06 6.5 5.38<br />
12 2.0 0.5 0.5 0.5 0.1 0.04 0.04 6.0 7.84<br />
Table 4.9 Statistical analysis of PBD for evaluation of media components<br />
and initial pH for L-asparaginase production<br />
Variable<br />
Main<br />
effect<br />
Coefficients t-value p-value<br />
Intercept 20.472 10.71 0.002<br />
Confidence<br />
level, %<br />
X 1 9.589 4.795 2.51 0.087 91.30<br />
X 2 8.203 4.102 2.14 0.121 87.90<br />
X 3 11.207 5.604 2.93 0.061 83.90<br />
X 4 6.568 3.284 1.72 0.184 81.60<br />
X 5 -4.346 -2.173 -1.14 0.338 76.20<br />
X 6 -4.186 -2.093 -1.09 0.354 74.60<br />
X 7 -2.764 -1.382 -0.72 0.522 47.80<br />
X 8 2.888 1.444 0.76 0.505 49.50
90<br />
Figure 4.30 Pareto plot of media components and operating conditions<br />
for L-asparaginase activity (X 1 - SBMF; X 2 - sodium nitrate;<br />
X 3 - L-asparagine; X 4 - glucose; X 5 - di-potassium hydrogen<br />
phosphate; X 6 - magnesium sulfate; X 7 - potassium chloride;<br />
X 8 - pH)<br />
Table 4.10 Five-level CCD in actual unit of media components with<br />
experimental, RSM and ANN predicted L-asparaginase activity<br />
Std.<br />
order<br />
Media components, % (w/v)<br />
x 1 x 2 x 3 x 4 Experimental<br />
L-Asparaginase activity, IU/mL<br />
RSM<br />
predicted<br />
ANN<br />
predicted<br />
1 2.0 1.0 0.5 0.5 16.42 17.01 16.13<br />
2 4.0 1.0 0.5 0.5 23.84 24.06 24.01<br />
3 2.0 2.0 0.5 0.5 16.69 16.74 16.69<br />
4 4.0 2.0 0.5 0.5 19.30 22.73 19.43<br />
5 2.0 1.0 1.5 0.5 36.42 33.60 36.38<br />
6 4.0 1.0 1.5 0.5 32.26 35.03 32.46<br />
7 2.0 2.0 1.5 0.5 23.67 23.77 23.58
91<br />
Table 4.10 (Continued)<br />
Std.<br />
order<br />
Media components, % (w/v)<br />
x 1 x 2 x 3 x 4 Experimental<br />
L-Asparaginase activity, IU/mL<br />
RSM<br />
predicted<br />
ANN<br />
predicted<br />
8 4.0 2.0 1.5 0.5 26.39 24.13 26.27<br />
9 2.0 1.0 0.5 1.0 12.32 11.38 14.78<br />
10 4.0 1.0 0.5 1.0 7.84 9.74 7.67<br />
11 2.0 2.0 0.5 1.0 14.18 13.41 14.17<br />
12 4.0 2.0 0.5 1.0 11.09 10.71 10.86<br />
13 2.0 1.0 1.5 1.0 30.71 29.29 30.84<br />
14 4.0 1.0 1.5 1.0 25.27 22.02 25.13<br />
15 2.0 2.0 1.5 1.0 25.16 21.74 25.19<br />
16 4.0 2.0 1.5 1.0 11.99 13.41 12.20<br />
17 1.0 1.5 1.0 0.75 15.94 19.66 16.01<br />
18 5.0 1.5 1.0 0.75 20.90 18.38 20.88<br />
19 3.0 0.5 1.0 0.75 18.66 19.54 18.54<br />
20 3.0 2.5 1.0 0.75 10.34 10.67 10.31<br />
21 3.0 1.5 0.0 0.75 16.10 13.45 13.72<br />
22 3.0 1.5 2.0 0.75 28.90 32.75 28.68<br />
23 3.0 1.5 1.0 0.25 34.77 33.14 37.37<br />
24 3.0 1.5 1.0 1.25 13.97 16.80 14.13<br />
25 3.0 1.5 1.0 0.75 37.38 37.28 37.05<br />
26 3.0 1.5 1.0 0.75 37.22 37.28 37.13<br />
27 3.0 1.5 1.0 0.75 37.06 37.28 36.85<br />
28 3.0 1.5 1.0 0.75 37.70 37.28 36.88<br />
29 3.0 1.5 1.0 0.75 36.85 37.28 36.86<br />
30 3.0 1.5 1.0 0.75 37.27 37.28 36.85<br />
31 3.0 1.5 1.0 0.75 37.48 37.28 37.07
92<br />
Table 4.11 Estimated regression coefficients for optimization of media<br />
components using CCD<br />
Variable<br />
Estimated<br />
coefficients<br />
t-value<br />
p-value<br />
Constant 37.281 36.241
93<br />
L-asparaginase activity. Hence the RSM regression model given in Equation<br />
4.2 was well fitted to represent the effect of media components on<br />
L-asparaginase production using CCD.<br />
Y<br />
LA<br />
= 37.28 - 0.32X - 2.22X<br />
- 0.27X X<br />
1<br />
2<br />
1<br />
-1.41X X<br />
1<br />
3<br />
2<br />
- 2.17X X<br />
+ 4.83X<br />
1<br />
4<br />
3<br />
- 4.08<br />
- 2.39X X<br />
2<br />
4<br />
3<br />
- 4.56X<br />
2<br />
1<br />
+ 0.57X X<br />
2<br />
- 5.54X<br />
4<br />
2<br />
2<br />
- 3.54X<br />
+ 0.33X X<br />
3<br />
4<br />
2<br />
3<br />
- 3.08X<br />
2<br />
4<br />
(4.2)<br />
where Y LA is L-asparaginase activity (IU/mL), X i and X j are media<br />
components in coded units. The second-order regression model was solved<br />
for maximum L-asparaginase production using MATLAB 7.0 program. The<br />
optimum concentration of the media components was found as SBMF 3.01%,<br />
sodium nitrate 1.29%, L-asparagine 1.39% and glucose 0.58% with the<br />
predicted maximum L-asparaginase activity of 40.97 IU/mL.<br />
Table 4.12<br />
Analysis of variance of CCD optimization of media<br />
components for L-asparaginase production<br />
Source<br />
Degree of<br />
freedom<br />
Sum of<br />
squares<br />
(SS)<br />
Mean<br />
square<br />
(MS)<br />
F-value<br />
p-value<br />
Regression 14 2919.80 208.55 28.15
94<br />
2.5<br />
2.0<br />
1.5<br />
Sodium nitrate, %*SBMF, %<br />
10.3 10.3<br />
4.2<br />
22.5<br />
16.4<br />
34.7<br />
2.0<br />
1.5<br />
1.0<br />
L-asparaginae, %*SBMF, %<br />
34.7<br />
22.5<br />
1.2<br />
1.0<br />
0.8<br />
16.4<br />
Glucose, %*SBMF, %<br />
22.5<br />
34.7<br />
4.2<br />
16.4<br />
1.0<br />
0.5<br />
1.5<br />
16.4<br />
28.6<br />
3.0<br />
16.4<br />
4.5<br />
0.5<br />
0.0<br />
10.3<br />
4.2<br />
1.5<br />
28.6<br />
16.4<br />
3.0<br />
10.3<br />
4.5<br />
0.6<br />
0.4<br />
1.5<br />
28.6<br />
3.0<br />
4.5<br />
2.0<br />
1.5<br />
1.0<br />
L-asparaginae, %*Sodium nitrate, %<br />
34.7<br />
10.3<br />
22.5<br />
1.2<br />
1.0<br />
0.8<br />
Glucose, %*Sodium nitrate, %<br />
10.3 22.5<br />
4.2<br />
16.4<br />
34.7<br />
1.2<br />
1.0<br />
0.8<br />
Glucose, %*L-asparaginae, %<br />
4.2<br />
22.5<br />
16.4<br />
34.7<br />
0.5<br />
0.0<br />
10.3<br />
4.2<br />
0.8<br />
28.6<br />
16.4<br />
1.6<br />
10.3<br />
2.4<br />
0.6<br />
0.4<br />
28.6<br />
0.8<br />
1.6<br />
16.4<br />
2.4<br />
0.6<br />
0.4<br />
0<br />
28.6<br />
1<br />
2<br />
Figure 4.31 Interaction effects of variables on L-asparaginase activity<br />
4.4.2.2 Optimization of media components using artificial neural<br />
network linked genetic algorithm<br />
The dependence of L-asparaginase activity on media components<br />
was modeled using ANN shown in Figure 3.27 with ‘Tanh’ as transfer<br />
function. The incremental back propagation algorithm was used to train and<br />
evaluate the network performance using adaptive gradient learning rule with<br />
learning rate of 0.1 and momentum of 0.4. The experimental L-asparaginase<br />
activity given in Table 4.9 was used. Randomly selected 25 CCD<br />
experimental data was used for training and 6 for testing the network. The<br />
L-asparaginase activity was predicated using ANN trained model for all<br />
experimental combination in CCD and reported in Table 4.9. The ANN model<br />
has predicted the L-asparaginase activity with high coefficient of<br />
determination (Cal.R 2 =0.996). Hence the ANN trained nonlinear model can<br />
be effectively used to describe the effect of media components, namely,
95<br />
SBMF, sodium nitrate, L-asparagine and glucose on L-asparaginase activity<br />
and the back propagation algorithm of ANN was highly accurate in successful<br />
prediction of L-asparaginase activity.<br />
The predicted L-asparaginase activity of RSM regression model<br />
was higher than the ANN model. ANN model (Cal.R 2 =0.996) showed better<br />
correlation with the experimental L-asparaginase activity than RSM<br />
regression model (Cal.R 2 =0.961). The closeness of the experimental<br />
L-asparaginase activity and predicted L-asparaginase activity using RSM and<br />
ANN model is shown in Figure 4.32. The pred.R 2 -value of ANN model<br />
(Pred.R 2 =0.993) indicates that the predicted L-asparaginase activity of ANN<br />
model was more close to the experimental L-asparaginase activity than RSM<br />
model (Pred.R 2 =0.959).<br />
The GA with population size of 30, uniform crossover rate of 0.8<br />
and mutation rate of 0.1 was used to find the global optimum concentration of<br />
the media components for maximum L-asparaginase activity using ANN<br />
trained model. The degree of importance of the media components on<br />
L-asparaginase production was analyzed using GA and it is given in<br />
Figure 4.33. It was found that SBMF has contributed 33.28%, sodium nitrate<br />
27.88%, L-asparagine 22.3% and glucose 16.56% on L-asparaginase<br />
production. ANN linked GA predicted optimum concentration of media<br />
components was SBMF 3.37%, sodium nitrate 1.17%, L-asparagine 1.36%<br />
and glucose 0.25% with the maximum predicted L-asparaginase activity of<br />
37.38 IU/mL (Table 4.13).
96<br />
Figure 4.32 Predicted distribution coefficients for RSM and ANN<br />
predicted L-asparaginase activity<br />
Figure 4.33 Importance of media components on L-asparaginase activity<br />
(X 1 - SBMF; X 2 - Sodium nitrate; X 3 - L-asparagine;<br />
X 4 - Glucose)<br />
4.4.2.3 Experimental validation of RSM and ANN predicted conditions<br />
The predicted optimal concentration of media components obtained<br />
using RSM regression model and ANN model were experimentally verified
97<br />
by conducting experiments in triplicate. The concentration of other media<br />
components and process conditions were kept constant as used in CCD<br />
experiments. The experimental L-asparaginase activity of 40.76 IU/mL was<br />
obtained at the predicted optimal conditions of RSM regression model and<br />
38.95 IU/mL at the predicted optimal conditions of ANN linked GA<br />
(Table 4.13). Although there was no significant difference in experimental<br />
activity obtained in confirmation experiments of both RSM regression model<br />
and ANN linked GA, RSM regression model of central composite design<br />
gave better predicted and experimental results. Hence the CCD optimization<br />
using RSM regression model was found to be more efficient and accurate in<br />
predicting the optimal concentration of media components for maximum<br />
L-asparaginase production. The experimental L-asparaginase activity obtained<br />
at optimal conditions of RSM was 0.5% lower than the predicted activity of<br />
40.97 IU/mL. L-asparaginase activity was enhanced by 46.72% than classical<br />
method of one factor at a time approach. The L-asparaginase production was<br />
enhanced after optimization when results obtained in classical methods and<br />
compared to the reported L-asparaginase production using statistical and classical<br />
methods (Lapmak et al 2010; Sreenivasulu et al 2009; Lingappa et al 2009).<br />
Table 4.13 Optimum concentration of media components, RSM and<br />
ANN predicted and experimental L-asparaginase activity<br />
Approach<br />
Optimum<br />
concentration,<br />
% (w/v)<br />
L-Asparaginase<br />
activity, IU/mL<br />
x 1 x 2 x 3 x 4 Predicted Experimental<br />
Cal.R 2<br />
value<br />
RSM 3.06 1.29 1.39 0.58 40.97 40.76 0.961<br />
ANN linked GA 3.37 1.17 1.36 0.25 37.38 38.95 0.996
98<br />
4.4.3 Optimization of media components for L-asparaginase<br />
production using GNOC powder substrate<br />
The independent effect of fermentation media components for<br />
L-asparaginase production by A. terreus MTCC 1782 using MCD media<br />
containing low cost natural substrate GNOC powder was evaluated using PB<br />
design. The significant media components were further optimized for<br />
maximum L-asparaginase production using RSM based 5-level CCD and<br />
ANN linked GA.<br />
4.4.3.1 Sequential optimization of media components using design of<br />
experiments<br />
L-Asparaginase activity obtained using PBD given Table 4.14 was<br />
statistically analyzed. Media components with confidence level greater than<br />
90% were considered to have significant influence on L-asparaginase<br />
production. The estimated t-value, p-value and confidence level for<br />
L-asparaginase activity are given in Table 4.15. On analysis of coefficients<br />
and t-value of student’s t-test of the media components, GNOC (x 1 ), sodium<br />
nitrate (x 2 ), L-asparagine (x 3 ) and sucrose (x 4 ) have increased (co-efficient<br />
with positive sign) the L-asparaginase production due to increases in their<br />
concentration, whereas di-potassium hydrogen phosphate (x 5 ), magnesium<br />
sulfate (x 6 ), potassium chloride (x 7 ) and pH (x 8 ) have decreased (co-efficient<br />
with negative sign) the L-asparaginase production due to increase in their<br />
concentration. Sucrose with confidence level of 94.0%, GNOC with<br />
confidence level of 93.4%, sodium nitrate with confidence level of 91.3% and<br />
L-apsaragine with confidence level of 90.2% were found as significant<br />
(p≤0.1) media components for L-asparaginase production. It also is confirmed<br />
from Pareto plot in Figure 4.34 that the GNOC, sodium nitrate, L-asparagine<br />
and sucrose are the significant media components on L-asparaginase<br />
production and selected further optimization using RSM and ANN linked GA<br />
for maximum L-asparaginase production.
99<br />
Table 4.14 PBD in actual unit of GNOC (x 1 ), sodium nitrate (x 2 ),<br />
L-asparagine (x 3 ) and sucrose (x 4 ), di-potassium hydrogen<br />
phosphate (x 5 ), magnesium sulfate (x 6 ), potassium chloride<br />
(x 7 ) and pH (x 8 ) with experimental L-asparaginase activity<br />
Std.<br />
order<br />
Media components, % (w/v)<br />
L-Asparaginase<br />
activity, IU/mL<br />
x 1 x 2 x 3 x 4 x 5 x 6 x 7 x 8<br />
1 3 1 1.5 0.3 0.1 0.04 0.06 6.5 30.87<br />
2 3 2 0.5 0.9 0.1 0.04 0.04 6.5 35.94<br />
3 1 2 1.5 0.3 0.2 0.04 0.04 6.0 22.28<br />
4 3 1 1.5 0.9 0.1 0.06 0.04 6.0 30.18<br />
5 3 2 0.5 0.9 0.2 0.04 0.06 6.0 33.54<br />
6 3 2 1.5 0.3 0.2 0.06 0.04 6.5 25.75<br />
7 1 2 1.5 0.9 0.1 0.06 0.06 6.0 35.03<br />
8 1 1 1.5 0.9 0.2 0.04 0.06 6.5 18.56<br />
9 1 1 0.5 0.9 0.2 0.06 0.04 6.5 14.50<br />
10 3 1 0.5 0.3 0.2 0.06 0.06 6.0 10.45<br />
11 1 2 0.5 0.3 0.1 0.06 0.06 6.5 11.30<br />
12 1 1 0.5 0.3 0.1 0.04 0.04 6.0 15.62<br />
Table 4.15<br />
Statistical analysis of PBD for evaluation of media<br />
components and initial pH on L-asparaginase production<br />
Variable<br />
Main<br />
effect<br />
Coefficients t-value p-value<br />
Intercept 23.668 16.32 0.001<br />
Confidence<br />
level, %<br />
X 1 8.240 4.120 2.84 0.066 93.4<br />
X 2 7.277 3.638 2.51 0.087 91.3<br />
X 3 6.887 3.443 2.37 0.098 90.2<br />
X 4 8.580 4.290 2.96 0.060 94.0<br />
X 5 -5.643 -2.822 -1.95 0.147 85.3<br />
X 6 -4.933 -2.467 -1.70 0.188 81.2<br />
X 7 -0.753 -0.377 -0.26 0.812 18.8<br />
X 8 -1.697 -0.848 -0.58 0.600 40.0
100<br />
Figure 4.34 Pareto plot shows the effect of media components and<br />
operating conditions on L-asparaginase activity (X 1 - GNOC;<br />
X 2 - Sodium nitrate; X 3 -L-asparagine; X 4 - Sucrose; X 5 - Dipotassium<br />
hydrogen phosphate; X 6 - Magnesium sulfate;<br />
X 7 - Potassium chloride; X 8 - initial pH)<br />
The central composite design of 31 experimental run was used for<br />
the optimization of significant fermentation media components like GNOC<br />
(x 1 ), sodium nitrate (x 2 ), L-asparagine (x 3 ) and sucrose (x 4 ). The concentration<br />
of other media components was kept at constant. The student’s t-test and<br />
F-test were performed using MINITAB 15.0 software for experimental activity<br />
given in Table 4.16. The coefficients, t-value and p-value for linear, quadratic<br />
and combined effects are given in the Table 4.17, at 95% significance level.<br />
The overall effect of the media components on L-asparaginase production was<br />
highly significant (p
101<br />
significantly (p=0.004) decreased the L-asparaginase production. There was<br />
no significant change in L-asparaginase production due the interaction effect<br />
of the media components GNOC versus sodium nitrate (p=0.607), GNOC<br />
versus L-asparagine (p=0.154), GNOC versus sucrose (p=0.599), sodium<br />
nitrate versus sucrose (p=0.630) and L-asparagine versus sucrose (p=0.203) at<br />
95% confidence level (p>0.05).<br />
The interaction effect between any two variable was also studied<br />
graphically using contour plots as shown in Figure 4.35, other two variables<br />
were kept constant at their middle level. The elliptical shape of the contour<br />
plot for sodium nitrate versus L-asparagine indicates the significant interaction<br />
effect on L-asparaginase production. The contour plot of GNOC versus<br />
L-asparagine was not perfectly circular, which indicates the interaction effect<br />
and decreases the L-asparaginase production (co-efficient with negative sign<br />
in Table 4.17). The circular shape of the contour plots among the other<br />
variables illustrated in Figure 4.35 indicates that there was less or no<br />
interaction.<br />
Table 4.16 Five-level CCD in actual unit of media components with<br />
experimental, RSM and ANN predicted L-asparaginase activity<br />
Std.<br />
order<br />
Media components, % (w/v)<br />
x 1 x 2 x 3 x 4 Experimental<br />
L-Asparaginase activity, IU/mL<br />
RSM<br />
predicted<br />
ANN<br />
predicted<br />
1 1.0 1.0 0.5 0.3 21.70 21.31 21.70<br />
2 3.0 1.0 0.5 0.3 24.10 21.34 24.05<br />
3 1.0 2.0 0.5 0.3 33.43 29.79 33.44<br />
4 3.0 2.0 0.5 0.3 29.43 28.58 29.00<br />
5 1.0 1.0 1.5 0.3 29.17 26.83 29.78<br />
6 3.0 1.0 1.5 0.3 29.17 30.40 29.27
102<br />
Table 4.16 (Continued)<br />
Std.<br />
order<br />
Media components, % (w/v)<br />
x 1 x 2 x 3 x 4 Experimental<br />
L-Asparaginase activity, IU/mL<br />
RSM<br />
predicted<br />
ANN<br />
predicted<br />
7 1.0 2.0 1.5 0.3 26.29 27.44 27.53<br />
8 3.0 2.0 1.5 0.3 30.77 29.76 30.18<br />
9 1.0 1.0 0.5 0.9 22.72 20.93 22.05<br />
10 3.0 1.0 0.5 0.9 21.38 19.70 21.51<br />
11 1.0 2.0 0.5 0.9 30.02 28.26 29.99<br />
12 3.0 2.0 0.5 0.9 26.23 25.78 26.20<br />
13 1.0 1.0 1.5 0.9 29.27 29.59 29.51<br />
14 3.0 1.0 1.5 0.9 31.03 31.89 31.15<br />
15 1.0 2.0 1.5 0.9 29.06 29.04 28.16<br />
16 3.0 2.0 1.5 0.9 30.23 30.09 30.29<br />
17 0.0 1.5 1.0 0.6 27.78 30.35 27.77<br />
18 4.0 1.5 1.0 0.6 30.71 31.45 30.48<br />
19 2.0 0.5 1.0 0.6 27.03 28.65 27.11<br />
20 2.0 2.5 1.0 0.6 33.64 35.34 34.23<br />
21 2.0 1.5 0.0 0.6 16.21 21.21 16.55<br />
22 2.0 1.5 2.0 0.6 32.74 31.05 32.41<br />
23 2.0 1.5 1.0 0.0 16.05 18.69 16.45<br />
24 2.0 1.5 1.0 1.2 17.97 18.64 18.30<br />
25 2.0 1.5 1.0 0.6 35.46 35.33 35.59<br />
26 2.0 1.5 1.0 0.6 35.08 35.33 35.46<br />
27 2.0 1.5 1.0 0.6 35.56 35.33 35.44<br />
28 2.0 1.5 1.0 0.6 35.46 35.33 35.66<br />
29 2.0 1.5 1.0 0.6 35.14 35.33 35.42<br />
30 2.0 1.5 1.0 0.6 35.35 35.33 35.57<br />
31 2.0 1.5 1.0 0.6 35.25 35.33 35.65
103<br />
Table 4.17<br />
Estimated regression coefficients for optimization of<br />
significant media components using CCD<br />
Variable<br />
Estimated<br />
coefficients<br />
t-value<br />
p-value<br />
Constant 35.331 39.564
104<br />
to represent the effect of the variables on L-asparaginase production<br />
using CCD.<br />
Y<br />
LA<br />
= 35.33 + 0.27X<br />
- 2.3X<br />
2<br />
3<br />
- 0.29X<br />
2<br />
X<br />
4<br />
1<br />
- 4.17X<br />
+ 1.67X<br />
2<br />
4<br />
+ 0.78X<br />
3<br />
X<br />
2<br />
- 0.31X X<br />
4<br />
+ 2.46X<br />
1<br />
2<br />
3<br />
- 0.01X<br />
+ 0.88X X<br />
1<br />
3<br />
4<br />
-1.11X<br />
1<br />
2<br />
1<br />
- 0.32X X<br />
- 0.83X<br />
4<br />
2<br />
2<br />
-1.97X<br />
2<br />
X<br />
3<br />
(4.3)<br />
where Y LA is the L-asparaginase activity (IU/mL), X i and X j are independent<br />
variables in coded units. The regression model was solved for maximum<br />
L-asparaginase production using MATLAB 7.0 program. GNOC 2.18%,<br />
sodium nitrate 1.69%, L-asparagine 1.21% and sucrose 0.62% were obtained<br />
as optimum concentration of significant media components with the<br />
maximum predicted L-asparaginase activity of 36.21 IU/mL.<br />
Table 4.18 Analysis of variance of RSM regression model relating<br />
significant media components and L-asparaginase activity<br />
Source<br />
Degree of<br />
freedom<br />
Sum of<br />
squares<br />
(SS)<br />
Mean<br />
square<br />
(MS)<br />
F-value<br />
p-value<br />
Regression 14 906.850 64.775 11.60
105<br />
2.5<br />
2.0<br />
1.5<br />
Sodium nitrate, %*GNOC, %<br />
33<br />
2.0<br />
1.5<br />
1.0<br />
L-asparagine, %*GNOC, %<br />
33<br />
29<br />
1.00<br />
0.75<br />
0.50<br />
Sucrose, %*GNOC, %<br />
25 21<br />
33<br />
29<br />
1.0<br />
0.5<br />
0<br />
29<br />
2<br />
4<br />
0.5<br />
0.0<br />
0<br />
29 25<br />
2<br />
21<br />
4<br />
0.25<br />
0.00<br />
0<br />
25<br />
21<br />
2<br />
29<br />
4<br />
2.0<br />
1.5<br />
1.0<br />
L-asparagine, %*Sodium nitrate, %<br />
33 29<br />
33<br />
1.00<br />
0.75<br />
0.50<br />
Sucrose, %*Sodium nitrate, %<br />
21<br />
25<br />
33<br />
1.00<br />
0.75<br />
0.50<br />
Sucrose, %*L-asparagine, %<br />
9 17<br />
25<br />
21<br />
33<br />
0.5<br />
0.0<br />
25<br />
17<br />
0.8<br />
21<br />
1.6<br />
29<br />
2.4<br />
0.25<br />
0.00<br />
25<br />
17<br />
0.8<br />
21<br />
1.6<br />
29<br />
2.4<br />
0.25<br />
0.00<br />
0<br />
17<br />
29<br />
1<br />
21<br />
2<br />
Figure 4.35 Interaction effects of variables on L-asparaginase<br />
production in contour plots<br />
4.4.3.2 Optimization by artificial neural network linked genetic algorithm<br />
A multilayer feed-forward ANN using back propagation algorithm<br />
was used to model the nonlinear relationships between media components<br />
(GNOC, sodium nitrate, L-asparagine and sucrose) and L-asparaginase<br />
activity obtained using CCD. The ANN with four neurons in input layer, four<br />
in hidden layer and one in output layer shown in Figure 4.27 was used with<br />
‘Tanh’ as transfer function. The high coefficient of determination<br />
(Cal.R 2 =0.995) of ANN model indicates that the model is highly accurate in<br />
successful prediction of L-asparaginase activity. Hence the ANN can be<br />
effectively used to represent the relationship between the media components<br />
studied and L-asparaginase activity. The ANN predicted L-asparaginase<br />
activity is given in Table 4.16. High value of Cal.R 2 =0.995 of ANN model<br />
showed better correlation with the experimental L-asparaginase activity than<br />
RSM regression model (Cal.R 2 =0.91).
106<br />
Closeness of the experimental L-asparaginase activity and predicted<br />
L-asparaginase activity using RSM and ANN model is shown in Figure 4.36.<br />
The pred.R 2 -value of ANN model (Pred.R 2 =0.994) indicates that the predicted<br />
L-asparaginase activity of ANN model was more close to the experimental<br />
L-asparaginase activity than RSM model (Pred.R 2 =0.901).<br />
ANN model was solved using GA with population size of 30,<br />
mutation rate of 0.1 and uniform crossover rate of 0.8 to find the optimum<br />
concentration of the media components for the maximum L-asparaginase<br />
production. The percentage importance of the media components was found<br />
to be sucrose, 35.05%; L-asparagine, 24.77%; sodium nitrate, 24.42%;<br />
GNOC, 19.38% on L-asparaginase production (Figure 4.37). The predicted<br />
optimum concentration of the media components were GNOC, 3.99%;<br />
sodium nitrate, 1.04%; L-asparagine, 1.84% and sucrose, 0.64% with<br />
maximum predicted L-asparaginase production of 36.64 IU/mL (Table 4.19).<br />
Though both RSM regression model and ANN model provided accurate<br />
predictions, ANN model (R 2 =0.995) showed better correlation with the<br />
experimental L-asparaginase activity than RSM regression model (R 2 =0.91).<br />
The predicted conditions obtained by RSM regression model and ANN model<br />
were experimentally verified.
107<br />
Figure 4.36 Predicted distribution coefficient of RSM and ANN model<br />
predicted L-asparaginase activity<br />
Figure 4.37 Importance of media components on L-asparaginase<br />
production (X 1 - GNOC; X 2 - Sodium nitrate;<br />
X 3 - L-asparagine; X 4 - Sucrose)
108<br />
4.4.3.3 Experimental validation of RSM and ANN predicted conditions<br />
The confirmation experiments were conducted in triplicate using<br />
predicted optimum concentration of media components by both RSM<br />
regression model and ANN model for validation. All the other fermentation<br />
conditions were fixed as CCD experiment for optimization. The experimental<br />
L-asparaginase activity of 35.56 IU/mL is obtained using predicted optimal<br />
concentrations of RSM regression model (Table 4.19). The experimental<br />
L-asparaginase activity of 36.97 IU/mL was obtained using the predicted<br />
optimal concentration of ANN model which was nearer to the ANN predicted<br />
activity than RSM regression model. The experimental activity was higher in<br />
ANN optimum conditions than RSM optimum conditions, which indicates<br />
that the ANN model was more accurate. The L-asparaginase activity was<br />
enhanced and it is higher than the reported activity for isolated Aspergillus sp.<br />
19.50 IU/mL (Sreenivasulu et al 2009), isolated Bipolaris sp. (BR438)<br />
6.20 IU/mL (Lapmak et al 2010) and Streptomyces gulbargensis 23.90 IU/mL<br />
(Lingappa et al 2009).<br />
Table 4.19 Optimum concentration of media components, RSM and<br />
ANN predicted and experimental L-asparaginase activity<br />
Approach<br />
Optimum<br />
L-Asparaginase activity,<br />
concentration,<br />
IU/mL<br />
% (w/v)<br />
x 1 x 2 x 3 x 4 Predicted Experimental<br />
Cal.R 2<br />
value<br />
RSM 2.18 1.69 1.21 0.62 36.21 35.56 0.910<br />
ANN linked GA 3.99 1.04 1.84 0.64 36.64 36.97 0.995
109<br />
4.5 STATISTICAL <strong>AND</strong> EVOLUTIONARY OPTIMIZATION<br />
OF PROCESS CONDITIONS FOR ENHANCED<br />
L-ASPARAGINASE PRODUCTION BY A. terreus MTCC 1782<br />
Fermentation process conditions such as temperature (x 1 ), initial pH<br />
(x 2 ), inoculum size (x 3 ), agitation rate (x 4 ) and fermentation time (x 5 ) were<br />
optimized using RSM based CCD and ANN linked GA for L-asparaginase<br />
production by submerged fermentation of A. terreus MTCC 1782 using<br />
different substrate, namely, SBMF, GNOC and synthetic L-proline as<br />
substrate in MCD media.<br />
4.5.1 Optimization of process conditions for L-asparaginase<br />
production using synthetic L-proline as substrate<br />
RSM based 3-level CCD for five variables and ANN linked GA<br />
were used for optimization of process conditions for enhanced production of<br />
L-asparaginase by A. terreus MTCC 1782 using synthetic L-proline as<br />
substrate.<br />
4.5.1.1 Optimization of process conditions using response surface<br />
methodology<br />
Experimental L-asparaginase activity obtained using CCD in Table<br />
4.20 was statistically analyzed by student’s t-test and Fisher’s F-test at 95%<br />
confidence level (p=0.05). The coefficients, t-value and p-value for linear,<br />
quadratic and interaction effect of process conditions are given in the<br />
Table 4.21. The overall effect of process conditions on L-asparaginase<br />
production was found highly significant (p
110<br />
and interaction effect of all the process conditions were found to have no<br />
significant effect (p
111<br />
Table 4.20 (Continued)<br />
Run<br />
order<br />
X 1 ,<br />
°C X 2<br />
Process conditions<br />
X 3 ,<br />
% (v/v)<br />
X 4 ,<br />
rpm<br />
L-Asparaginase activity, IU/mL<br />
X 5 ,<br />
h Experimental RSM<br />
predicted<br />
ANN<br />
predicted<br />
15 28 5.8 1 120 96 16.26 16.25 16.42<br />
16 28 5.8 3 180 96 21.86 21.31 21.86<br />
17 33 6.3 2 180 72 39.67 39.39 39.64<br />
18 33 6.3 2 150 72 43.51 40.35 43.54<br />
19 33 6.3 2 150 48 38.50 40.43 38.35<br />
20 28 6.3 2 150 72 27.99 31.43 28.04<br />
21 33 6.3 1 150 72 42.50 40.07 42.37<br />
22 33 5.8 2 150 72 30.55 31.29 30.37<br />
23 33 6.3 2 150 72 42.71 40.35 43.57<br />
24 38 5.8 3 120 96 17.97 17.07 14.74<br />
25 38 5.8 1 180 96 18.87 19.79 19.04<br />
26 38 6.8 1 180 48 22.55 23.17 22.55<br />
27 38 5.8 1 120 48 25.06 25.43 25.01<br />
28 38 6.8 3 180 96 17.01 16.37 17.23<br />
29 33 6.3 2 150 72 42.97 40.35 43.54<br />
30 33 6.3 2 150 72 43.99 40.35 43.52<br />
31 33 6.3 2 150 72 43.08 40.35 43.53<br />
32 38 5.8 3 180 48 26.13 25.95 26.13
112<br />
Table 4.21 Estimated regression coefficients of RSM regression model<br />
for optimization of process conditions<br />
Variable Estimated coefficients t-value p-value<br />
Constant 40.358 34.762
113<br />
Figure 4.38 Interaction effects of process conditions on L-asparaginase<br />
production in contour plots (X 1 - Temperature, °C;<br />
X 2 - initial pH; X 3 - Inoculum size, % (v/v); X 4 - Agitation<br />
rate, rpm; X 5 - Incubation time, h)<br />
The ANOVA results of the RSM regression model is given in<br />
Table 4.22, at 95% confidence level. The ANOVA results demonstrate that<br />
the model is highly significant (p
114<br />
Y<br />
LA<br />
=<br />
40.36 + 1.57X<br />
-1.06X<br />
-1.03X<br />
2<br />
3<br />
2<br />
3<br />
1<br />
- 0.89X<br />
X<br />
- 0.39X<br />
2<br />
4<br />
-1.21X<br />
2<br />
X<br />
4<br />
2<br />
-1.14X<br />
- 0.78X<br />
2<br />
5<br />
+ 1.03X<br />
2<br />
3<br />
- 0.36X X<br />
X<br />
- 0.07X<br />
5<br />
1<br />
2<br />
4<br />
-1.23X<br />
+ 0.82X<br />
-1.21X<br />
3<br />
X<br />
4<br />
1<br />
X<br />
3<br />
5<br />
- 0.31X<br />
- 7.35X<br />
3<br />
X<br />
5<br />
2<br />
1<br />
- 0.64X X<br />
1<br />
- 9.45X<br />
4<br />
- 0.43X<br />
4<br />
2<br />
2<br />
- 0.57X<br />
X<br />
5<br />
1<br />
X<br />
(4.4)<br />
5<br />
where Y LA is the L-asparaginase activity (IU/mL), X i and X j are independent<br />
variables in coded units. Optimum process conditions were found by solving<br />
RSM regression model in Equation (4.4) for maximum L-asparaginase<br />
production. Temperature 33.85°C, initial pH 6.29, inoculum size 1.52% (v/v),<br />
agitation rate 144 rpm and incubation time of 60.61 h were found to be<br />
optimum conditions with maximum predicted L-asparaginase activity of 40.97<br />
IU/mL.<br />
Table 4.22 Analysis of variance of RSM for optimization of process<br />
conditions<br />
Source<br />
Degree of<br />
freedom<br />
Sum of<br />
squares (SS)<br />
Mean square<br />
(MS)<br />
F-value p-value<br />
Regression 20 2815.03 140.751 8.53
115<br />
conditions for L-asparaginase production by A. terreus MTCC 1782 using<br />
synthetic L-proline. ‘Tanh’ was used as neuron activation function. The<br />
experimental L-asparaginase activity given in Table 4.20 was used to train the<br />
ANN to understand the dependence of L-asparaginase production on operating<br />
conditions such as temperature, pH, inoculum size, agitation rate and<br />
incubation time using neural power software. A multilayer feed-forward ANN<br />
using incremental back propagation algorithm and adaptive gradient learning<br />
rule with learning rate of 0.1 and momentum of 0.4 was used to train the<br />
ANN using randomly selected 25 experimental run in Table 4.20 and<br />
performance was tested using other 7 experimental run.<br />
The trained ANN was used to predict the L-asparaginase activity<br />
for all the CCD data set on operating conditions given in Table 4.20. The high<br />
coefficient of determination (Cal.R 2 =0.999) for L-asparaginase activity<br />
predicted by ANN model indicates that the ANN is highly accurate in<br />
successful prediction of L-asparaginase activity. Hence the ANN shown in<br />
Figure 4.39 can be used to develop the relationship between the operating<br />
conditions and L-asparaginase activity. ANN predicted L-asparaginase activity<br />
is given in Table 4.20. Though both RSM regression model and ANN model<br />
provided accurate predictions, ANN showed better and accurate correlation<br />
with the experimental L-asparaginase activity than RSM regression model.<br />
The closeness of the experimental L-asparaginase activity with RSM and<br />
ANN predicted L-asparaginase activity is shown in Figure 4.40. The higher<br />
predicted R 2 value of 0.995 for the ANN model than RSM model<br />
(Pred.R 2 =0.935) indicates the high degree of accuracy of the ANN model.<br />
Hence Figure 4.41 shows a good agreement between experimental and ANN<br />
predicted L-asparaginase activity.<br />
GA with population size of 30, mutation rate of 0.1 and uniform<br />
crossover rate of 0.8 was run for 94501 iterations to find the predicted
116<br />
optimum operating conditions for maximum L-asparaginase activity. The<br />
percentage importance of the operating conditions on L-asparaginase<br />
production was found to be: temperature 25.28%, initial pH 24.81%, agitation<br />
rate 18.87%, incubation time 18.1% and inoculum size 13.15%, as shown in<br />
Figure 4.41. It was predicted that the temperature of 35°C, pH of 6.25,<br />
inoculum size of 1%, agitation rate of 140.18 rpm and incubation time of<br />
58.45 h favours the maximum production of L-asparaginase. The maximum<br />
predicted L-asparaginase activity at ANN predicted process condition was<br />
44.38 IU/mL (Table 4.23).<br />
4.5.1.3 Experimental validation of RSM and ANN predicted conditions<br />
Confirmation experiments were conducted in triplicate at predicted<br />
optimum process conditions of RSM and ANN models for validation. All<br />
other fermentation conditions and medium composition were fixed as in CCD<br />
experiments. The experimental L-asparaginase activity of 40.56 IU/mL was<br />
obtained at the predicted optimal conditions of RSM regression model<br />
(Table 4.23). The experimental L-asparaginase activity of 43.29 IU/mL was<br />
obtained at the predicted optimal conditions of ANN linked GA, which is<br />
close to the maximum predicted L-asparaginase activity of 44.38 IU/mL.<br />
L-asparaginase production was enhanced by 23.58% higher than classical<br />
method of one factor at a time approach after optimization using evolutionary<br />
method, and it is higher than RSM method and other reports in literature<br />
(Sreenivasulu et al 2009; Lingappa et al 2009; Lapmak et al 2010). The<br />
optimization process conditions for L-asparaginase production using<br />
L-proline as substrate by ANN linked GA was found to be more efficient and<br />
accurate than RSM.
117<br />
Figure 4.39 Back propagation neural network with five input layers and<br />
four hidden layers used for optimization of process<br />
conditions for L-asparaginase production<br />
Figure 4.40 Predicted distribution coefficients of RSM and ANN<br />
predicted L-asparaginase activity
118<br />
Figure 4.41 Importance of operating conditions on L-asparaginase<br />
production (X 1 -Temperature, °C; X 2 - initial pH;<br />
X 3 - Inoculum size, % (v/v); X 4 - Agitation rate, rpm;<br />
X 5 - Incubation time, h)<br />
Table 4.23 Optimum process conditions with experimental, RSM and<br />
ANN predicted L-asparaginase activity<br />
Method<br />
Optimum process<br />
conditions<br />
X 1 ,°C X 2 X 3 ,% X 4,<br />
rpm<br />
L-asparaginase activity,<br />
IU/mL Cal.R 2<br />
X 5, h Predicted Experimental<br />
value<br />
RSM 33.85 6.29 1.52 144.24 60.61 40.97 40.56 0.939<br />
ANN linked<br />
GA<br />
35.06 6.25 1.00 140.18 58.45 44.38 43.29 0.999<br />
4.5.2 Optimization of process conditions for L-asparaginase<br />
production using soybean meal flour as substrate<br />
The RSM based 3-level CCD for five variables and ANN linked<br />
GA were used for optimization of the process conditions for optimization of<br />
fermentation culture conditions for L-asparaginase production by A. terreus<br />
MTCC 1782 utilizing SBMF as natural substrate in MCD media.
119<br />
4.5.2.1 Optimization of culture conditions using response surface<br />
methodology<br />
The student’s t-test and F-test were performed using MINITAB 15.0<br />
software for experimental L-asparaginase activity obtained using CCD<br />
reported in Table 4.24. The coefficients, t-value and p-value for linear,<br />
quadratic and combined effects were given in the Table 4.25, at 95%<br />
significance level. The L-asparaginase production was significantly (p
120<br />
plots among the variables indicates that there was no or less interaction effect<br />
by the variables on L-asparaginase activity.<br />
The effect of the culture conditions on L-asparaginase activity was<br />
fitted into the second-order polynomial model given in Equation 4.5 using<br />
regression analysis. Statistical analysis of the regression model in the form of<br />
analysis of variance (ANOVA), which is required to test the significance and<br />
adequacy of the model, is reported in Table 4.26, at 95% confidence level.<br />
The ANOVA of the regression model demonstrates that the model is highly<br />
significant (p
121<br />
4.5.2.2 Optimization of process conditions using artificial neural<br />
network linked genetic algorithm<br />
The ANN with five neurons in input layer, four in hidden layer and<br />
one in output layer shown in Figure 4.39 was used for optimization of process<br />
conditions for L-asparaginase production by A. terreus MTCC 1782 using<br />
SBMF. ‘Tanh’ was used as neuron activation function. The experimental<br />
L-asparaginase activity given in Table 4.24 was used to train the ANN to<br />
understand the dependence of L-asparaginase production on operating<br />
conditions such as temperature, pH, inoculum size, agitation rate and<br />
incubation time using neural power software. A multilayer feed-forward ANN<br />
using incremental back propagation algorithm and adaptive gradient learning<br />
rule with learning rate of 0.1 and momentum of 0.4 was used to train the<br />
ANN using randomly selected 25 experimental run in Table 4.24 and<br />
performance was tested using other 7 experimental run.<br />
Table 4.24 Three-level CCD in actual unit of temperature (x 1 ), initial<br />
pH (x 2 ), inoculum size (x 3 ), agitation rate (x 4 ) and<br />
fermentation time (x 5 ) with experimental, RSM and ANN<br />
predicted L-Asparaginase activity<br />
Run<br />
order<br />
X 1 ,<br />
°C X 2<br />
Process conditions<br />
X 3 ,<br />
% (v/v)<br />
X 4 ,<br />
rpm<br />
L-Asparaginase activity, IU/mL<br />
X 5 ,<br />
h Experimental RSM<br />
predicted<br />
ANN<br />
predicted<br />
1 33 6.3 2 150 48 34.76 36.01 35.16<br />
2 38 5.8 1 120 48 22.28 22.26 22.21<br />
3 33 6.3 3 150 72 28.36 30.56 28.41<br />
4 38 5.8 1 180 96 17.49 17.87 17.44<br />
5 33 6.3 2 150 72 40.15 37.84 39.91<br />
6 28 5.8 1 120 96 25.64 25.29 25.70<br />
7 33 6.3 2 150 72 40.31 37.84 39.91
122<br />
Table 4.24 (Continued)<br />
Run<br />
order<br />
X 1 ,<br />
°C X 2<br />
Process conditions<br />
X 3 ,<br />
% (v/v)<br />
X 4 ,<br />
rpm<br />
L-Asparaginase activity, IU/mL<br />
X 5 ,<br />
h Experimental RSM<br />
predicted<br />
ANN<br />
predicted<br />
8 38 6.8 3 120 48 16.95 16.39 17.02<br />
9 33 6.3 2 180 72 36.36 36.02 35.59<br />
10 33 6.8 2 150 72 32.10 35.34 32.21<br />
11 33 6.3 2 150 96 32.47 34.49 32.99<br />
12 33 5.8 2 150 72 35.62 35.65 35.73<br />
13 28 6.3 2 150 72 27.51 30.09 27.59<br />
14 38 5.8 3 120 96 17.38 17.12 16.74<br />
15 33 6.3 2 150 72 39.88 37.84 39.91<br />
16 33 6.3 2 120 72 33.16 36.77 32.74<br />
17 38 6.8 3 180 96 14.82 14.66 14.97<br />
18 28 5.8 3 180 96 18.77 18.77 18.79<br />
19 38 5.8 3 180 48 17.49 17.82 17.91<br />
20 33 6.3 2 150 72 40.20 37.84 39.91<br />
21 33 6.3 2 150 72 39.94 37.84 39.91<br />
22 38 6.8 1 120 96 24.79 24.27 24.98<br />
23 28 6.8 3 120 96 13.11 12.22 12.70<br />
24 28 5.8 1 180 48 24.15 24.39 24.11<br />
25 33 6.3 1 150 72 37.48 38.55 37.69<br />
26 38 6.3 2 150 72 28.58 29.28 28.65<br />
27 28 6.8 1 180 96 24.10 23.84 24.05<br />
28 28 6.8 1 120 48 28.36 27.70 28.37<br />
29 38 6.8 1 180 48 26.44 26.51 26.23<br />
30 28 6.8 3 180 48 13.59 13.29 13.63<br />
31 28 5.8 3 120 48 18.29 17.89 18.24<br />
32 33 6.3 2 150 72 39.72 37.84 39.91
123<br />
Table 4.25 Estimated regression coefficients of RSM regression model<br />
for optimization of process conditions<br />
Variable<br />
Estimated<br />
coefficients<br />
t-value<br />
p-value<br />
Constant 37.845 51.006
124<br />
Table 4.26 Analysis of variance of RSM for optimization of process<br />
conditions<br />
Source<br />
Degree of<br />
freedom<br />
Sum of<br />
squares<br />
(SS)<br />
Mean<br />
square<br />
(MS)<br />
F-value<br />
p-value<br />
Regression 20 2441.06 122.053 18.11
125<br />
The trained ANN was used to predict the L-asparaginase activity<br />
for all the CCD data set on operating conditions in Table 4.24. The high<br />
coefficient of determination (Cal.R 2 =0.999) for L-asparaginase activity<br />
predicted by ANN model indicates that the ANN was highly accurate in<br />
successful prediction of L-asparaginase activity. Hence the ANN shown in<br />
Figure 4.39 can be effectively used to develop the relationship between the<br />
operating conditions and L-asparaginase activity. ANN predicted<br />
L-asparaginase activity is given in Table 4.24 Though both RSM regression<br />
model and ANN model provided accurate predictions, ANN showed better<br />
and accurate correlation with experimental L-asparaginase activity than RSM<br />
regression model. The closeness of the experimental L-asparaginase activity<br />
with RSM and ANN predicted L-asparaginase activity is shown in Figure<br />
4.43. The higher predicted R 2 value for ANN model (Pred.R 2 =0.995) than<br />
RSM model (Pred.R 2 =0.969) and closer value of predicted (Pred.R 2 =0.970)<br />
and calculated coefficient of determination (Cal.R 2 =0.999) indicate the high<br />
degree of accuracy of ANN model for optimization of culture conditions.<br />
Hence Figure 4.43 shows a good agreement between experimental and ANN<br />
predicted L-asparaginase activity.<br />
GA with population size of 30, mutation rate of 0.1 and uniform<br />
crossover rate of 0.8 was run for 35501 iterations to find the predicted<br />
optimum operating conditions for maximum L-asparaginase activity. The<br />
percentage importance of the operating conditions on L-asparaginase<br />
production was found to be: temperature 24.79%, initial pH 20.87%, agitation<br />
rate 18.98%, incubation time 17.8% and inoculum size 17.55% (Figure 4.44).<br />
It was predicted that the temperature of 32.13°C, initial pH of 5.8, inoculum<br />
size of 1%, agitation rate of 179.98 rpm and incubation time of 63.03 h favors<br />
the maximum production of L-asparaginase. The maximum predicted<br />
L-asparaginase activity at ANN predicted process condition was 40.86 IU/mL<br />
(Table 4.27).
126<br />
Figure 4.43 Predicted distribution coefficients of RSM and ANN<br />
predicted L-asparaginase activity<br />
Figure 4.44 Importance of operating conditions on L-asparaginase<br />
production (X 1 - temperature, °C; X 2 - initial pH;<br />
X 3 - Inoculum size, % (v/v); X 4 - Agitation rate, rpm;<br />
X 5 - Incubation time, h)
127<br />
4.5.2.3 Experimental validation of RSM and ANN predicted conditions<br />
Confirmation experiments were conducted in triplicate at predicted<br />
optimum process conditions of RSM and ANN models for validation. All<br />
other fermentation conditions and medium composition were fixed as in CCD<br />
experiments. The experimental L-asparaginase activity of 40.85 IU/mL was<br />
obtained at the predicted optimum process conditions of RSM regression<br />
model (Table 4.27) and it is closer to the predicted activity (39.37 IU/mL).<br />
The experimental L-asparaginase activity of 41.78 IU/mL was obtained at the<br />
predicted optimum conditions of ANN linked GA, which is close to the<br />
maximum predicted L-asparaginase activity of 40.86 IU/mL. The<br />
experimental L-asparaginase activity obtained using ANN linked GA was<br />
higher than RSM predicted and experimental activity. Thus optimization<br />
process conditions for L-asparaginase production using SBMF as substrate by<br />
ANN linked GA was found to be more efficient and accurate than RSM. The<br />
L-asparaginase production was enhanced by 23.58% higher than classical<br />
method of one-factor at a time approach after optimization using evolutionary<br />
method and it is higher than other reports found in literature (Sreenivasulu<br />
et al 2009; Lingappa et al 2009; Lapmak et al 2010).<br />
Table 4.27 Optimum process conditions with experimental, RSM and<br />
Method<br />
ANN predicted L-asparaginase activity<br />
Optimum process<br />
conditions<br />
L-Asparaginase<br />
activity,<br />
IU/mL<br />
Cal.R 2<br />
value<br />
X 1 ,°C X 2 X 3 ,% X 4,<br />
rpm<br />
X 5, h Predicted Experimental<br />
RSM 32.74 6.41 1.28 143.03 66.91 39.37 40.85 0.970<br />
ANN<br />
32.13 5.80 1.00 179.98 63.03 40.86 41.78 0.999<br />
linked GA
128<br />
4.5.3 Optimization of process conditions for L-asparaginase<br />
production using groundnut oil cake as substrate<br />
The RSM based 3-level CCD for five variables and ANN linked<br />
GA were used for optimization of process conditions for enhanced production<br />
of L-asparaginase by submerged fermentation A. terreus MTCC 1782 utilizing<br />
GNOC powder as low cost natural substrate in MCD media.<br />
4.5.3.1 Optimization of operating conditions using response surface<br />
methodology<br />
The student’s t-test and F-test of RSM regression model were<br />
performed for the experimental L-asparaginase activity obtained using CCD<br />
given in Table 4.28. The coefficients, t-value and p-value for linear, quadratic<br />
and combined effects were given in the Table 4.28, at 95% significance level.<br />
It was observed that the overall effect of all process conditions studied have<br />
significantly increased (p
129<br />
were kept constant at their middle level. The circular or near circular shape of<br />
the contour plots among the process conditions indicate that there was less or<br />
no interaction effect on L-asparaginase production.<br />
The result of ANOVA of RSM regression model in Equation (4.6)<br />
is given in Table 4.30, at 95% confidence level. The ANOVA of the<br />
regression model demonstrates that the model is highly significant (p
130<br />
4.5.3.2 Optimization using artificial neural network linked genetic<br />
algorithm<br />
A multilayer feed-forward ANN shown in Figure 4.40 was used for<br />
optimization of process conditions for<br />
L-asparaginase production by<br />
A. terreus MTCC 1782 using GNOC powder. Incremental back propagation<br />
algorithm was used to train and test the performance of the network using<br />
adaptive gradient learning rule. The neuron activation function ‘Tanh’ was<br />
used with learning rate of 0.1 and momentum of 0.4. The network was trained<br />
to understand the dependence of L-asparaginase activity on operating<br />
conditions using randomly selected 25 experimental run in Table 4.30 and<br />
performance was tested using other 7 experimental run.<br />
Table 4.28 Three-level CCD in actual unit of temperature (x 1 ), initial<br />
pH (x 2 ), inoculum size (x 3 ), agitation rate (x 4 ) and<br />
fermentation time (x 5 ) with experimental, RSM and ANN<br />
predicted L-asparaginase activity<br />
Run<br />
order<br />
X 1 ,<br />
°C X 2<br />
Process conditions<br />
X 3 ,<br />
% (v/v)<br />
X 4 ,<br />
Rpm<br />
L-Asparaginase activity, IU/mL<br />
X 5 ,<br />
h Experimental RSM<br />
predicted<br />
ANN<br />
predicted<br />
1 38 5.8 1 120 48 20.21 19.92 19.87<br />
2 28 6.8 1 180 96 24.36 24.06 24.38<br />
3 33 5.8 2 150 72 31.51 34.51 31.54<br />
4 38 6.3 2 150 72 19.83 22.02 19.91<br />
5 28 6.8 3 180 48 14.82 14.72 14.77<br />
6 28 6.8 1 120 48 18.98 19.03 19.1<br />
7 28 5.8 1 180 48 24.10 23.63 24.34<br />
8 33 6.3 2 150 72 37.22 34.59 36.88<br />
9 38 5.8 1 180 96 19.51 18.87 19.38
131<br />
Table 4.28 (Continued)<br />
Run<br />
order<br />
X 1 ,<br />
°C X 2<br />
Process conditions<br />
X 3 ,<br />
% (v/v)<br />
X 4 ,<br />
Rpm<br />
L-Asparaginase activity, IU/mL<br />
X 5 ,<br />
h Experimental RSM<br />
predicted<br />
ANN<br />
predicted<br />
10 33 6.3 2 150 72 37.11 34.59 36.88<br />
11 28 5.8 3 120 48 20.63 20.50 20.64<br />
12 38 5.8 3 120 96 16.31 16.02 16.82<br />
13 38 5.8 3 180 48 16.79 16.35 16.68<br />
14 38 6.8 1 120 96 10.82 10.70 10.87<br />
15 38 6.8 3 180 96 15.57 15.30 15.31<br />
16 33 6.3 2 150 72 37.16 34.59 36.88<br />
17 38 6.8 1 180 48 15.14 14.88 15.41<br />
18 28 6.8 3 120 96 15.67 15.71 15.64<br />
19 33 6.8 2 150 72 29.27 30.12 29.09<br />
20 33 6.3 2 150 96 31.30 33.64 31.19<br />
21 38 6.8 3 120 48 11.78 11.86 11.56<br />
22 33 6.3 1 150 72 31.88 34.19 32.53<br />
23 33 6.3 2 120 72 32.15 33.09 32.03<br />
24 33 6.3 2 150 48 31.40 32.92 31.05<br />
25 33 6.3 2 150 72 37.22 34.59 36.88<br />
26 33 6.3 2 150 72 37.27 34.59 36.88<br />
27 33 6.3 2 150 72 37.06 34.59 36.88<br />
28 28 5.8 1 120 96 25.91 25.58 25.79<br />
29 33 6.3 3 150 72 29.43 30.97 29.90<br />
30 28 5.8 3 180 96 20.95 20.47 20.62<br />
31 33 6.3 2 180 72 31.30 34.21 31.52<br />
32 28 6.3 2 150 72 25.32 26.99 25.45
132<br />
Table 4.29 Estimated regression coefficients of RSM regression model<br />
for optimization of process conditions<br />
Variable Estimated coefficients t-value p-value<br />
Constant 34.595 43.841
133<br />
Table 4.30 Analysis of variance of RSM for optimization of process<br />
conditions<br />
Source<br />
Degree of<br />
freedom<br />
(DF)<br />
Sum of<br />
squares<br />
(SS)<br />
Mean<br />
square<br />
(MS)<br />
F-value<br />
p-value<br />
Regression 20 2151.64 107.582 14.11
134<br />
The coefficient of determination (Cal.R 2 =0.999) of ANN model<br />
indicates that the ANN was highly accurate in successful prediction of<br />
L-asparaginase activity. The ANN shown in Figure 4.39 can be effectively<br />
used to develop the relationship between the process conditions and<br />
L-asparaginase activity. ANN predicted L-asparaginase activity given in<br />
Table 4.31 was obtained after 9618 iterations. Though both RSM and ANN<br />
models provided accurate predictions, ANN model (Cal.R 2 =0.999) showed<br />
better correlation with the experimental L-asparaginase activity than RSM<br />
regression model (Cal.R 2 =0.962). Closeness of the experimental<br />
L-asparaginase activity with RSM and ANN predicted L-asparaginase activity<br />
is shown in Figure 4.46. The higher predicted coefficient of determination<br />
(Pred.R 2 =0.999) of the ANN model than RSM model (Pred.R 2 =0.961)<br />
indicates the high degree of accuracy of the ANN model. Hence Figure 4.46<br />
shows good agreement between experimental and predicted L-asparaginase<br />
activity.<br />
Once the ANN model was developed and tested, GA was applied to<br />
optimize the model for maximum L-asparaginase activity. The GA with<br />
population size of 30, uniform crossover rate of 0.8 and mutation rate of 0.1<br />
was run for 71001 iterations to find the global optimum values of the process<br />
conditions for maximum L-asparaginase activity. The percentage importance<br />
of process conditions on L-asparaginase production was studied using GA. It<br />
was found to be maximum by agitation rate 28.99% followed by temperature<br />
23.17%, initial pH 17.47%, fermentation time 15.91% and inoculum size<br />
14.46% on L-asparaginase production as shown in Figure 4.47. Temperature<br />
of 32.08°C, initial pH of 5.8, inoculum size of 1% (v/v), agitation rate of<br />
123.5 rpm and fermentation time of 55.1 h was found to give maximum<br />
L-asparaginase activity of 38.57 IU/mL (Table 4.31).
135<br />
Figure 4.46 Predicted distribution coefficients of RSM and ANN<br />
predicted L-asparaginase activity<br />
Figure 4.47 Importance of operating conditions on L-asparaginase<br />
production (X 1 - Temperature, °C; X 2 - initial pH;<br />
X 3 - Inoculum size, % (v/v); X 4 - Agitation rate, rpm;<br />
X 5 - Incubation time, h)
136<br />
4.5.3.3 Experimental validation of RSM and ANN predicted conditions<br />
Confirmation experiments were conducted in triplicate at the<br />
predicted optimum process conditions of RSM and ANN linked GA for<br />
validation. All other fermentation conditions and medium composition were<br />
fixed as used in CCD experiments for optimization. The experimental<br />
L-asparaginase activity of 34.58 IU/mL (Table 4.31) was obtained at the<br />
predicted optimum conditions of RSM model. The experimental<br />
L-asparaginase activity obtained at the predicted optimum conditions of ANN<br />
linked GA was of 37.84 IU/mL which is very nearer to the ANN predicted<br />
maximum activity of 38.57 IU/mL. Also, the predicted and experimental<br />
L-asparaginase activity obtained using ANN linked GA were higher than<br />
RSM approach. Hence the optimization process condition for L-asparaginase<br />
production using GNOC by ANN linked GA was found to be more efficient<br />
and accurate than RSM. The L-asparaginase activity was found enhanced<br />
through optimization of operating conditions and it is higher than other<br />
findings reported in literature (Sreenivasulu et al 2009; Lingappa et al 2009;<br />
Lapmak et al 2010). The L-asparaginase production was enhanced by 7.19%<br />
higher than classical method of one factor at a time approach after<br />
optimization using ANN linked GA.<br />
Table 4.31 Optimum process conditions with experimental, RSM and<br />
ANN predicted L-asparaginase activity<br />
Method<br />
L-Asparaginase<br />
Optimum conditions<br />
activity, IU/mL Cal. R 2<br />
value<br />
X 1 ,°C X 2 X 3 ,% X 4,<br />
rpm<br />
X 5, h Predicted Experimental<br />
RSM 32.24 6.07 1.52 155.15 75.63 35.73 34.58 0.962<br />
ANN<br />
linked<br />
GA<br />
32.08 5.80 1.00 123.50 55.10 38.57 37.84 0.999
137<br />
4.6 BENCH SCALE PRODUCTION <strong>AND</strong> UNSTRUCTURED<br />
KINETIC MODELING OF L-ASPARAGINASE<br />
PRODUCTION BY A. terreus MTCC 1782<br />
A 5 L bench scale bioreactor (3 L working volume) was used for<br />
batch production of L-asparaginase by submerged fermentation of A. terreus<br />
MTCC 1782 using two different substrates, namely, synthetic L-proline and<br />
SBMF. The Monod (M), Logistic (T) and Modified Logistic (ML) models<br />
discussed in Chapter 3.14.1 were studied to fit experimental biomass to<br />
understand the growth kinetics of A. terreus for L-asparaginase production,<br />
and growth kinetic parameters such as μ 0 , μ m , K s and “r” were estimated. The<br />
Monod incorporated Leudeking–Piret model (MLP), Logistic incorporated<br />
Leudeking–Piret model (LLP) and Modified Logistic incorporated<br />
Leudeking–Piret model (MLLP) discussed in Chapter 3.14.2 were studied to<br />
fit experimental L-asparaginase activity, and model parameters such as α<br />
(growth associated product formation parameter) and (non-growth<br />
associated product formation parameter) were estimated to understand the<br />
L-asparaginase production kinetics and its dependence on growth of by<br />
A. terreus. The Monod incorporated Modified Leudeking–Piret model<br />
(MMLP), Logistic incorporated Modified Leudeking–Piret model (LMLP)<br />
and Modified Logistic incorporated Modified Leudeking–Piret model<br />
(MLMLP) discussed in Chapter 3.14.3 were studied to fit experimental<br />
residual glucose concentration and model parameters such (growth<br />
associated substrate utilization parameter) and η (non-growth associated<br />
substrate utilization parameter) were estimated to understand the substrate<br />
utilization kinetics and its influence on fungal growth and product formation<br />
rate. The biomass concentration, L-asparaginase activity and residual glucose<br />
concentration were predicted using the kinetic parameters of the respective<br />
models. The estimated kinetic parameters and model predicted values of<br />
biomass concentration, L-asparaginase activity and residual glucose
138<br />
concentration were statistically analyzed and compared with experimental<br />
values to find the best model. The dependence of L-asparaginase production<br />
on growth of A. terreus and glucose utilization rate were discussed.<br />
4.6.1 Kinetics modeling of L-asparaginase production using synthetic<br />
L-proline<br />
The MCD media (3 L) containing synthetic L-proline was used for<br />
L-asparaginase production by A. terreus MTCC 1782 in a 5 L bench<br />
bioreactor. The biomass concentration, L-asparaginase activity and residual<br />
glucose concentration were measured periodically up 72 h with an interval of<br />
8 h. The profile of L-asparaginase activity, biomass and residual glucose<br />
concentration in time course of fermentation are given in Figure 4.48. The<br />
L-asparaginase production started to increase significantly after the eighth<br />
hour of fermentation when the growth of the microorganism reaches the midexponential<br />
phase. The maximum L-asparaginase activity of 44.58 IU/mL was<br />
obtained in post-exponential growth phase at 64 h and remains constant after<br />
72 h. The rate of L-asparaginase formation and growth were high in<br />
exponential phase and low in post-exponential phase and constant in<br />
stationary phase. The glucose utilization rate was low in early growth phase<br />
until 8 h and high in exponential phase until 48 h of fermentation and it was<br />
low in late exponential phase (after 56 h to 64 h) and was very low in<br />
stationary phase (after 64 h). Almost 94% of glucose was depleted in 56 h of<br />
fermentation. The exponential phase of the fungal growth was observed from<br />
8 to 48 h. The biomass concentration has reached a maximum of 5.29 g/L in<br />
64 h and there was no further increase in biomass concentration until 72 h.<br />
The biomass concentration has decreased slowly. L-asparaginase production<br />
was noted in exponential growth phase, post-exponential growth phase as<br />
well as in early stationary phase.
139<br />
The kinetic data on L-asparaginase production shown in Figure 4.48<br />
were tested to fit various kinetic models discussed in Chapter 3.14 on growth,<br />
product formation and substrate utilization rate. The closeness of model<br />
predicted and experimental values were statically analyzed using the concept<br />
of coefficient of determination (R 2 ), average percentage error (δ m ) and chisquare<br />
test (χ 2 ) to find the best-suited model. The goodness of fit of the<br />
various models was compared using δ m and χ 2 statistic analysis. The summary<br />
of estimated kinetic parameters and statistical analysis of various models are<br />
given in Table 4.32. The tabulated χ 2 value at 95% confidence level for<br />
9 degrees of freedom is 16.02. The R 2 value of various models studied on<br />
growth kinetics of A. terreus for L-asparaginase production is shown in<br />
Figure 4.49. Sample MATLAB output is shown in Figure A3.1. The<br />
coherence of experimental and ML model predicted biomass concentration<br />
was high with high R 2 value (0.989). δ m (1.91%) and χ 2 (0.13) values were<br />
also low for ML model when compared to all other models studied. This<br />
implies that the ML model is most appropriate to best describe the microbial<br />
growth of A. terreus for L-asparaginase production. Hence the growth kinetics<br />
of A. terreus for L-asparaginase production follows exponential growth and it<br />
is under catabolic repression with high substrate inhibition coefficient<br />
(r=0.985) indicates low glucose inhibition.<br />
The R 2 value of various models studied on L-asparaginase<br />
formation kinetics by A. terreus is shown in Figure 4.50. The coherence of<br />
experimental and MLLP model predicted the L-asparaginase activity was high<br />
with high R 2 value (0.977). δ m (12.62%) and χ 2 (3.21) values were also<br />
minimum for MLLP model when compared to all other models. This implies<br />
that the MLLP model is most appropriate to describe the L-asparaginase<br />
formation kinetics by A. terreus. The magnitude of growth-associated<br />
parameter (α=4.216) is much greater than the non-growth associated
140<br />
parameter (=0.083) in MLLP model which is typical for growth-associated<br />
product formation. Hence the L-asparaginase production by A. terreus is<br />
dependent on biomass concentration and increases with increase in fungal<br />
growth. This also reveals that the L-asparaginase production is under catabolic<br />
repression with high substrate inhibition coefficient (r = 0.985) indicating low<br />
glucose inhibition.<br />
The R 2 value of the various models studied on glucose utilization<br />
kinetics for L-asparaginase production by A. terreus is shown in Figure 4.51.<br />
The coherence of the experimental and MLMLP model predicted residual<br />
glucose concentration was high with high R 2 value (0.918). δ m (9.71%) and χ 2<br />
(3.46) values were also minimum for MLMLP model when compared to all<br />
other models. This implies that the MLMLP is the most appropriate model to<br />
describe the glucose utilization kinetics by A. terreus for L-asparaginase<br />
production. The magnitude of growth-associated parameter (=1.104) is much<br />
greater than magnitude of the non-growth associated parameter (η=0.024) in<br />
MLMLP model which is typical for growth-associated substrate utilization.<br />
Hence the fermentation profile of glucose utilization is growth associated with<br />
high substrate inhibition coefficient (r=0.985). The statistical analysis of the<br />
experimental data showed that the unstructured models could satisfactorily<br />
explain the batch kinetics of L-asparaginase production. The closeness of<br />
experimental and best fitted model predicted biomass concentration,<br />
L-asparaginase activity and residual glucose concentration is shown in<br />
Figure 4.52.
141<br />
Figure 4.48 Profile of microbial growth, L-asparaginase formation and<br />
glucose utilization rate for L-asparaginase production by<br />
A. terreus (○Biomass, ∆Residual glucose, *L-asparaginase<br />
activity)<br />
Figure 4.49 Correlation coefficient of various models studied for growth<br />
kinetics of A. terreus MTCC 1782 for L-asparaginase<br />
production (□M, ∆L, *ML)
142<br />
Figure 4.50 Correlation coefficient of various models studied for<br />
L-asparaginase formation kinetics by A. terreus MTCC 1782<br />
(□MLP; ×LLP; ○MLLP)<br />
Figure 4.51 Correlation coefficient of various models studied for glucose<br />
utilization kinetics by A. terreus MTCC 1782 for<br />
L-asparaginase production (◊MMLP; ×LMLP; ○MLMLP)
143<br />
Figure 4.52 Profile of experimental (symbols) and model predicted<br />
(hatched lines) biomass concentration using ML (Δ),<br />
L-asparaginase activity using MLLP (○) and residual<br />
glucose concentration using MLMLP (□)<br />
Table 4.32<br />
Estimated kinetic parameters and statistical analysis of various<br />
unstructured kinetic models for fungal growth, L-asparaginase<br />
formation and glucose utilization rate for L-asparaginase<br />
production by A. terreus using synthetic L-proline<br />
Product formation<br />
Growth kinetics<br />
Constant<br />
kinetics<br />
Glucose utilization kinetics<br />
M L ML MLP LLP MLLP MMLP LMLP MLMLP<br />
μ 0, h -1 - 0.136 0.121 - 0.136 0.121 - 0.136 0.121<br />
μ m, h -1 0.071 - - 0.071 - - 0.071 - -<br />
K s, g/L 0.859 - - 0.859 - - 0.859 - -<br />
R - - 0.985 - - 0.985 - - 0.985<br />
X 0 g/L - 0.23 0.16 - 0.23 0.16 - 0.23 0.16<br />
X m , g/L - 5.31 5.31 - 5.31 5.31 - 5.31 5.31<br />
- - - 1.536 3.505 4.216 - - -<br />
- - - 0.081 0.067 0.083 - - -<br />
Γ - - - - - - 0.483 0.936 1.104<br />
Η - - - - - - 0.005 0.022 0.024<br />
R 2 0.692 0.960 0.989 0.634 0.954 0.977 0.101 0.906 0.918<br />
δ m -52.47 8.86 1.91 31.06 -0.45 12.62 372.56 10.84 9.71<br />
χ 2 28.53 0.54 0.13 88.85 8.40 3.21 6.92 4.47 3.46
144<br />
4.6.2 Kinetics modeling of L-asparaginase production using SBMF<br />
The MCD media (3 L) containing SBMF of was used for<br />
L-asparaginase production by A. terreus MTCC 1782 in a 5 L bench<br />
bioreactor. The biomass concentration, L-asparaginase activity and residual<br />
glucose concentration were measured periodically upto 72 h with an interval<br />
of 8 h. The experimental biomass concentration, L-asparaginase activity and<br />
residual glucose concentration is shown in Figure 4.53. The exponential phase<br />
of the fungal growth was observed from 8 h to 40 h. The biomass<br />
concentration reaches a maximum of 5.73g/L at 56 h and there is no further<br />
increase in biomass concentration. The L-asparaginase production starts to<br />
increase significantly after the eighth hour of fermentation when the growth<br />
of the microorganism reaches the mid-exponential phase. The L-asparaginase<br />
production was noted in the growth phase of the A. terreus and maximum at<br />
56 h of fermentation. The maximum L-asparaginase activity of 38.87 IU/mL<br />
was observed in exponential growth phase at 56 h. The L-asparaginase<br />
production rate and growth rate were high in exponential phase and low in<br />
post-exponential phase. The glucose utilization rate was low in early growth<br />
phase upto 8 h, high in exponential phase from 8 to 48 h, low in late<br />
exponential phase from 48 to 64 h and was very low in stationary phase from<br />
64 h onwards. The rate of glucose utilization by the microorganism increases<br />
rapidly up to 56 h and then declines when microbial growth reaches the<br />
stationary phase. Almost 92.81% of glucose was depleted within 56 h.<br />
Various unstructured kinetic models discussed in chapter 3.14 were<br />
mathematically analyzed to study the characteristics of L-asparaginase<br />
production by A. terreus. The growth kinetic parameters such as μ 0 , μ m , K s ,<br />
and ‘r’ of the models were estimated. The summary of growth kinetic<br />
parameters of the various models is given in Table 4.33. The estimated kinetic<br />
parameters were used to simulate the models for predicted biomass
145<br />
concentration using MATLAB 7 program. The predicted biomass<br />
concentration of models compared with experimental values as shown in<br />
Figure 4.54. The R 2 of experimental and predicted values were analyzed to<br />
find the best suited model. The goodness of fit of the various models was also<br />
compared using χ 2 statistic analysis and average mean error (δ m ).<br />
Determination coefficient, average percentage error and χ 2 values between<br />
experimental and predicted biomass concentration are reported in Table 4.33.<br />
The tabulated χ 2 value at 95% confidence level for degree of freedom of 9 is<br />
16.02. The coherence of the predicted and experimental biomass<br />
concentration (R 2 =0.997) in the Logistic model implies that this model is<br />
most appropriate to describe the growth kinetics of A. terreus for<br />
L-asparaginase production. The χ 2 (0.02
146<br />
model was found to be the best model to represent L-asparaginase formation<br />
by A. terreus 1782. All other model predictions have shown larger deviation<br />
from experimental L-asparaginase activity. The magnitude of the growthassociated<br />
parameter (α=4.656) is much greater than the magnitude of the<br />
non-growth associated parameter (=0.119) for LLP model. Hence, the<br />
fermentation production of L-asparaginase by A. terreus is a typical growthassociated<br />
process.<br />
The MMLP model, LMLP and MLMLP models were fit to<br />
represent the experimental residual glucose concentration. The estimated<br />
kinetic parameters reported in Table 4.33 were used to simulate the models<br />
for predicted residual glucose concentration using MATLAB 7 program. The<br />
predicted residual glucose concentration of models was compared with<br />
experimental values as shown in Figure 4.56. The simulation results of the<br />
LMLP model is in good agreement with the experimental L-asparaginase<br />
activity, implies that the LMLP model (R 2 =0.995) is the most appropriate to<br />
represent the glucose utilization kinetics in L-asparaginase production by<br />
A. terreus. The χ 2 (1.55
147<br />
Figure 4.53 Profile of microbial growth, L-asparaginase formation and<br />
glucose utilization rate for L-asparaginase production by<br />
A. terreus (○Biomass, ∆Residual glucose, *L-asparaginase<br />
activity)<br />
Figure 4.54 Correlation coefficient of various models studied on growth<br />
kinetics of A. terreus (□M, *L, ○ML)
148<br />
Figure 4.55 Correlation coefficient of various models studied on<br />
L-asparaginase formation kinetics (□MLP, *LLP, ○MLLP)<br />
Figure 4.56 Correlation coefficient of various models studied glucose<br />
utilization kinetics (□MMLP, *LMLP, ○MLMLP)
149<br />
Figure 4.57 Experimental (symbols) and model predicted (hatched lines)<br />
biomass concentration using Logistic model (Δ),<br />
L-asparaginase activity using LLP (○) and residual glucose<br />
concentration using LMLP (□)<br />
Table 4.33 Estimated kinetic parameters and statistical analysis of<br />
various unstructured kinetic models for fungal growth,<br />
L-asparaginase formation and glucose utilization rate for<br />
L-asparaginase production by A. terreus using SBMF<br />
Constant<br />
Growth kinetics Product formation kinetics Glucose utilization kinetics<br />
M L ML MLP LLP MLLP MMLP LMLP MLMLP<br />
μ 0, h -1 - 0.116 0.081 - 0.116 0.081 - 0.116 0.081<br />
μ m, h -1 0.069 - - 0.069 - - 0.069 - -<br />
K s, g/L 2.351 - - 2.351 - - 2.351 - -<br />
R - - 0.921 - - 0.921 - - 0.921<br />
X 0 g/L - 0.370 0.370 - 0.370 0.370 - 0.370 0.370<br />
X m , g/L - 5.790 5.790 - 5.790 5.790 - 5.790 5.790<br />
- - - 3.706 4.656 9.776 - - -<br />
- - - 0.249 0.119 0.251 - - -<br />
Γ - - - - - - 1.186 0.551 1.075<br />
Η - - - - - - 0.086 0.013 0.021<br />
R 2 0.773 0.997 0.973 0.858 0.993 0.968 0.979 0.995 0.640<br />
δ m 37.24 0.21 44.73 51.42 18.68 34.56 827.33 12.34 57.05<br />
χ 2 4.91 0.02 4.84 212.64 3.88 43.24 50.47 1.55 3.05