Integrating CFD and Experiment in Aerodynamics - CFD4Aircraft
Integrating CFD and Experiment in Aerodynamics - CFD4Aircraft Integrating CFD and Experiment in Aerodynamics - CFD4Aircraft
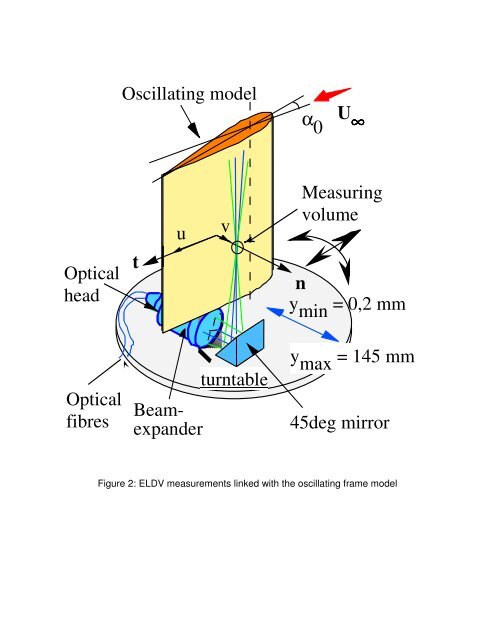
Oscillating model α 0 U ∞ Optical head t u v Measuring volume n y min = 0,2 mm Optical fibres Beamexpander turntable y max = 145 mm 45deg mirror Figure 2: ELDV measurements linked with the oscillating frame model
000000000 MEASUREM ENT S MEASUREM ENTS CH 1 CH 2 465 B OSCIL LOSCOP VOLT E S:DIV VOLT S:DIV SETU P SETU P A and B TIME/D IV and D EL AY TIM E SETT INGS BSA enhan ced SETT ING S BSA enhan ced TRIGGER POW ER A TR IGGER SHIFT ENTER SHIFT ENTER Laser source 000000000 Transmitin g block Optical head U V positio nsensor PM1 Optical fibers PM2 Oscillosco p 1 3.95 3.00 4.00 64 10.67 7 8 9 4 5 6 1 2 3 0 . +/- Color separator DANTEC 9.318 1.00 1560 8 0 1 3.9 5 3.00 4.00 10.6 7 64 7 8 9 4 5 6 1 2 3 0 . +/- Postprocessing: Macintos hLabview IEE E DANTE C 9.31 8 1.0 0 1560 8 0 BSA (Burst Spectrum Analyser) Figure 3: ELDV Acquisition chain
- Page 43 and 44: 16 [31] Gursul, I., Proposed Mechan
- Page 45 and 46: 18 Figure 3: Spectrum of unsteady f
- Page 47 and 48: 20 Figure 7: Flow visualisation of
- Page 49 and 50: Figure 11: Upper surface pressure d
- Page 51 and 52: While the information presented in
- Page 53 and 54: Figure 3 : DFR against Flap angle f
- Page 55 and 56: Figure 7 shows a series of plots of
- Page 57 and 58: Figure 9 : Contours of Mach number,
- Page 59 and 60: ¥:97§Y©R¥e©H !V( H ¨9#f§e!"
- Page 61 and 62: é¡êŒëWì¤í?î(ïeð±ñWòL
- Page 63 and 64: Ó3×ÓnØ*Ù(Ú*Û+Ü ÝÞ#ß)ÝG
- Page 65 and 66: 6‹wB6h67 C,7D4 ')(r,+.st/9:!/L£8
- Page 67 and 68: ACBDsEutCIvwlxV^ c Q!Lkd_Q_SFM PQ_^
- Page 69 and 70: ǹºF»¼@½:¾¿_À!Á »_ÂÃk
- Page 71 and 72: yaw angle. Also, extreme value coef
- Page 73 and 74: 0.9 Cs vs yaw angle Side force coef
- Page 75 and 76: Fig. 5. Grid block structure around
- Page 77 and 78: Cs comparison at V=0.6 m/s Fig. 10.
- Page 79 and 80: Investigation of Flow Turning in a
- Page 81 and 82: duct as it approaches the blocker c
- Page 83 and 84: Figure 1. Natural Blockage Thrust R
- Page 85 and 86: Figure 7. Post-Exit rake Total Span
- Page 87 and 88: Figure 11. Comparison of Static Pre
- Page 89 and 90: 2.2 Data Aquired The Embedded Laser
- Page 91 and 92: First, plots of the turbulent Reyno
- Page 93: Particles seeding tube 3 m 1 m mode
- Page 97 and 98: Figure 5: Influence of the pseudo t
- Page 99 and 100: Figure 7: Turbulent Reynolds' numbe
- Page 101 and 102: Figure 9: Turbulent Reynolds' numbe
- Page 103 and 104: Figure 11: Vortex Shedding cycle fo
- Page 105 and 106: Figure 13: Comparison with experime
Oscillat<strong>in</strong>g model<br />
α 0<br />
U ∞<br />
Optical<br />
head<br />
t<br />
u<br />
v<br />
Measur<strong>in</strong>g<br />
volume<br />
n<br />
y m<strong>in</strong> = 0,2 mm<br />
Optical<br />
fibres<br />
Beamexp<strong>and</strong>er<br />
turntable<br />
y max = 145 mm<br />
45deg mirror<br />
Figure 2: ELDV measurements l<strong>in</strong>ked with the oscillat<strong>in</strong>g frame model


