Integrating CFD and Experiment in Aerodynamics - CFD4Aircraft
Integrating CFD and Experiment in Aerodynamics - CFD4Aircraft Integrating CFD and Experiment in Aerodynamics - CFD4Aircraft
from cfd4aircraft.com
More from this publisher
13.11.2014
Views
Figure 9. Detail of CFD Model Geometry Figure 10. Velocity Vectors in the Thrust Reverser.
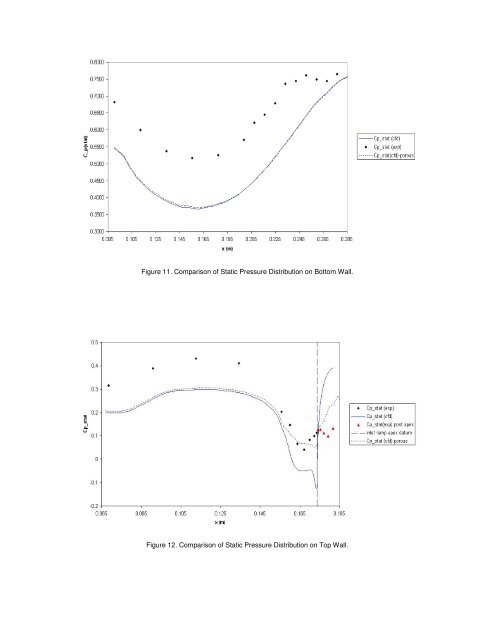
Figure 11. Comparison of Static Pressure Distribution on Bottom Wall. Figure 12. Comparison of Static Pressure Distribution on Top Wall.
- Page 35 and 36: 8 Computational simulations can con
- Page 37 and 38: 10 separation location over rounded
- Page 39 and 40: 12 3.7 Vortex / flexible wing inter
- Page 41 and 42: 14 [8] Mitchell, A.M. and Molton, P
- Page 43 and 44: 16 [31] Gursul, I., Proposed Mechan
- Page 45 and 46: 18 Figure 3: Spectrum of unsteady f
- Page 47 and 48: 20 Figure 7: Flow visualisation of
- Page 49 and 50: Figure 11: Upper surface pressure d
- Page 51 and 52: While the information presented in
- Page 53 and 54: Figure 3 : DFR against Flap angle f
- Page 55 and 56: Figure 7 shows a series of plots of
- Page 57 and 58: Figure 9 : Contours of Mach number,
- Page 59 and 60: ¥:97§Y©R¥e©H !V( H ¨9#f§e!"
- Page 61 and 62: é¡êŒëWì¤í?î(ïeð±ñWòL
- Page 63 and 64: Ó3×ÓnØ*Ù(Ú*Û+Ü ÝÞ#ß)ÝG
- Page 65 and 66: 6‹wB6h67 C,7D4 ')(r,+.st/9:!/L£8
- Page 67 and 68: ACBDsEutCIvwlxV^ c Q!Lkd_Q_SFM PQ_^
- Page 69 and 70: ǹºF»¼@½:¾¿_À!Á »_ÂÃk
- Page 71 and 72: yaw angle. Also, extreme value coef
- Page 73 and 74: 0.9 Cs vs yaw angle Side force coef
- Page 75 and 76: Fig. 5. Grid block structure around
- Page 77 and 78: Cs comparison at V=0.6 m/s Fig. 10.
- Page 79 and 80: Investigation of Flow Turning in a
- Page 81 and 82: duct as it approaches the blocker c
- Page 83 and 84: Figure 1. Natural Blockage Thrust R
- Page 85: Figure 7. Post-Exit rake Total Span
- Page 89 and 90: 2.2 Data Aquired The Embedded Laser
- Page 91 and 92: First, plots of the turbulent Reyno
- Page 93 and 94: Particles seeding tube 3 m 1 m mode
- Page 95 and 96: 000000000 MEASUREM ENT S MEASUREM E
- Page 97 and 98: Figure 5: Influence of the pseudo t
- Page 99 and 100: Figure 7: Turbulent Reynolds' numbe
- Page 101 and 102: Figure 9: Turbulent Reynolds' numbe
- Page 103 and 104: Figure 11: Vortex Shedding cycle fo
- Page 105 and 106: Figure 13: Comparison with experime
Figure 11. Comparison of Static Pressure Distribution on Bottom Wall.<br />
Figure 12. Comparison of Static Pressure Distribution on Top Wall.


