Integrating CFD and Experiment in Aerodynamics - CFD4Aircraft
Integrating CFD and Experiment in Aerodynamics - CFD4Aircraft Integrating CFD and Experiment in Aerodynamics - CFD4Aircraft
19 Figure 5: Time history of average and difference of breakdown locations showing asymmetric oscillations. Figure 6: Asymmetric structural mode for a slightly flexible delta wing when vortex breakdown occurred on the wing.
20 Figure 7: Flow visualisation of vortices over a nonslender delta wing with a sweep angle of Λ = 50 o (left). Dual vortex structure (of the sane sign of vorticity) in a cross-flow plane exists upstream of vortex breakdown (right), alpha = 15 o . Figure 8: Surface flow visualisation for Λ = 50 o for α = 2.5 o (left) and α = 15 o (right).
- Page 1 and 2: Integrating CFD and Experiment in A
- Page 3 and 4: Experimentalist’s requirements fo
- Page 5 and 6: persistent discrepancy may be due t
- Page 7 and 8: numbers significantly lower than th
- Page 9 and 10: Heat flux measurements. Over the pa
- Page 11 and 12: The measurements are made on select
- Page 13 and 14: advantage that the signal is emitte
- Page 15 and 16: 12. Mébarki, Y. and Mérienne, M.
- Page 17 and 18: castellated nozzles entrained more
- Page 19 and 20: Axisymmetric Regular Convergent Div
- Page 21 and 22: Figure 5: Typical instantaneous PIV
- Page 23 and 24: Figure 8: Streamwise Velocity Profi
- Page 25 and 26: 1.25 CFD (SKW PRESTO) Experimental
- Page 27 and 28: 5 Conclusions In this paper we have
- Page 29 and 30: 2 which include boundary layer and
- Page 31 and 32: 4 not received much attention in th
- Page 33 and 34: 6 Although a great deal of effort h
- Page 35 and 36: 8 Computational simulations can con
- Page 37 and 38: 10 separation location over rounded
- Page 39 and 40: 12 3.7 Vortex / flexible wing inter
- Page 41 and 42: 14 [8] Mitchell, A.M. and Molton, P
- Page 43 and 44: 16 [31] Gursul, I., Proposed Mechan
- Page 45: 18 Figure 3: Spectrum of unsteady f
- Page 49 and 50: Figure 11: Upper surface pressure d
- Page 51 and 52: While the information presented in
- Page 53 and 54: Figure 3 : DFR against Flap angle f
- Page 55 and 56: Figure 7 shows a series of plots of
- Page 57 and 58: Figure 9 : Contours of Mach number,
- Page 59 and 60: ¥:97§Y©R¥e©H !V( H ¨9#f§e!"
- Page 61 and 62: é¡êŒëWì¤í?î(ïeð±ñWòL
- Page 63 and 64: Ó3×ÓnØ*Ù(Ú*Û+Ü ÝÞ#ß)ÝG
- Page 65 and 66: 6‹wB6h67 C,7D4 ')(r,+.st/9:!/L£8
- Page 67 and 68: ACBDsEutCIvwlxV^ c Q!Lkd_Q_SFM PQ_^
- Page 69 and 70: ǹºF»¼@½:¾¿_À!Á »_ÂÃk
- Page 71 and 72: yaw angle. Also, extreme value coef
- Page 73 and 74: 0.9 Cs vs yaw angle Side force coef
- Page 75 and 76: Fig. 5. Grid block structure around
- Page 77 and 78: Cs comparison at V=0.6 m/s Fig. 10.
- Page 79 and 80: Investigation of Flow Turning in a
- Page 81 and 82: duct as it approaches the blocker c
- Page 83 and 84: Figure 1. Natural Blockage Thrust R
- Page 85 and 86: Figure 7. Post-Exit rake Total Span
- Page 87 and 88: Figure 11. Comparison of Static Pre
- Page 89 and 90: 2.2 Data Aquired The Embedded Laser
- Page 91 and 92: First, plots of the turbulent Reyno
- Page 93 and 94: Particles seeding tube 3 m 1 m mode
- Page 95 and 96: 000000000 MEASUREM ENT S MEASUREM E
20<br />
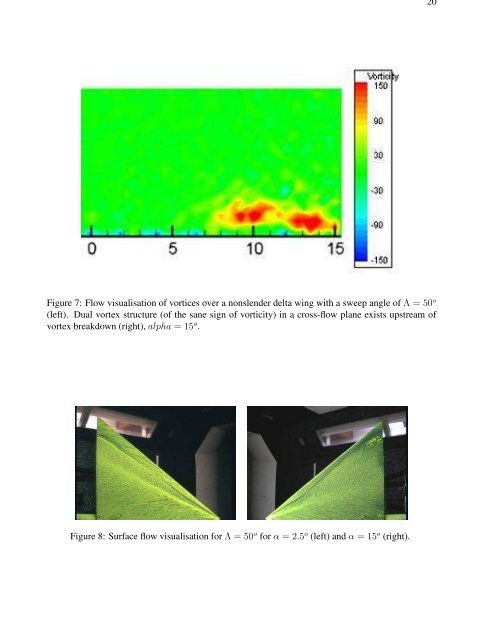
Figure 7: Flow visualisation of vortices over a nonslender delta w<strong>in</strong>g with a sweep angle of Λ = 50 o<br />
(left). Dual vortex structure (of the sane sign of vorticity) <strong>in</strong> a cross-flow plane exists upstream of<br />
vortex breakdown (right), alpha = 15 o .<br />
Figure 8: Surface flow visualisation for Λ = 50 o for α = 2.5 o (left) <strong>and</strong> α = 15 o (right).


