Illinois EPA - ladco
Illinois EPA - ladco
Illinois EPA - ladco

Create successful ePaper yourself
Turn your PDF publications into a flip-book with our unique Google optimized e-Paper software.
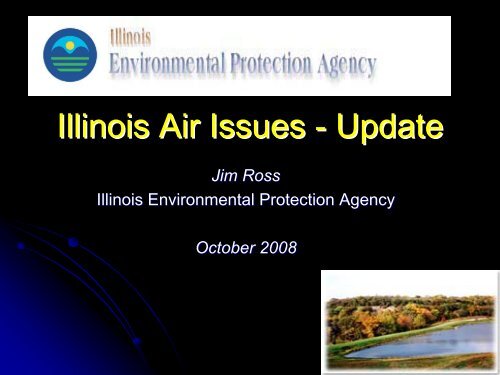
<strong>Illinois</strong> Air Issues - Update<br />
Jim Ross<br />
<strong>Illinois</strong> Environmental Protection Agency<br />
October 2008
Overview<br />
• SIP Status<br />
• Regional/State O 3 & PM 2.5 Control Plans<br />
• Redesignation Policy<br />
• Big Reductions Coming in <strong>Illinois</strong> - Beyond<br />
CAIR<br />
2
<strong>Illinois</strong><br />
• 2 non-attainment areas (NAA):<br />
Chicago area & Metro-East<br />
St. Louis area – both<br />
areas non-attainment for both:<br />
• PM-2.5<br />
• Ozone (moderate)<br />
• Over 6,500 permitted sources of air pollution<br />
• 673 Major Sources of air pollution<br />
• 325 sources (5%) emit 92% of the emissions<br />
3
New non-attainment issues<br />
• PM2.5:<br />
• Rock Island County (violating monitor in Davenport, Iowa)<br />
• Massac County (violating monitor in Paducah, Kentucky)<br />
Both counties determined non-attainment by US<strong>EPA</strong> due to<br />
monitors in other states. I<strong>EPA</strong> gathering info to show both IL<br />
counties should be attainment<br />
• 8-hour Ozone<br />
• Peoria County: : 2005 - 2007 monitoring data slightly over the<br />
standard. I<strong>EPA</strong> designation recommendation due to US<strong>EPA</strong> in<br />
March 2009 based on monitoring data from 2006 - 2008, which<br />
shows area back into attainment<br />
4
CAIR vacatur impact<br />
• NOx SIP call back<br />
• Attainment SIPs reevaluated and further<br />
delayed<br />
• New regulations may be needed – SO2<br />
and PM RACT<br />
• Uncertainty for regulators and the<br />
regulated<br />
5
Modeling Results w/ CAIR<br />
“On the books” controls plus CAIR and NOx RACT<br />
<br />
• Chicago area:<br />
• Ozone: Attainment in Lake Michigan region by 2010<br />
except for Holland, MI – which attains by 2012.<br />
• PM2.5: Attainment by 2010<br />
• Metro-East:<br />
• Ozone: Attainment by 2010<br />
• PM2.5: : attainment NOT demonstrated for PM 2.5 by 2010<br />
– will attain in 2012 with local controls<br />
6<br />
Rob Kaleel<br />
6
Modeling w/out CAIR<br />
“On the books” controls plus NOx SIP call and<br />
NOx RACT <br />
• Chicago area:<br />
• Ozone: Attainment in 2010<br />
• PM2.5: Becomes a problem (attained with CAIR) –<br />
latest modeling show slightly above standard in<br />
2010<br />
•<br />
• Metro-East:<br />
• Ozone = ? (attained with CAIR)<br />
• PM2.5 remains a problem past 2010<br />
7
SIP Status: 8-Hour OZONE<br />
(1997 standard: 0.08 ppm)<br />
• Chicago Non-attainment Area (NAA)<br />
• Did not submit on time<br />
• Sent letter to US<strong>EPA</strong> on June 29, 2007 – contained schedule and<br />
commitment to complete<br />
• Switch to 2005 base year from 2002 caused initial delay<br />
• Modeling w/ CAIR shows attainment by 2010 (except Holland, MI)<br />
• Modeling w/out CAIR shows still OK<br />
• Plan to submit attainment demonstration to US<strong>EPA</strong> by December<br />
2008<br />
• Metro-East<br />
NAA<br />
• Submitted attainment demonstration to US<strong>EPA</strong> on time - June 2007<br />
• Modeling w/ CAIR shows attainment by 2010<br />
• Missouri and <strong>Illinois</strong> have not addressed post CAIR scenario yet<br />
• CAIR vacatur may impact – awaiting US<strong>EPA</strong> review of our<br />
attainment demonstration<br />
8
• Chicago NAA<br />
PM2.5<br />
SIP Status: PM2.5<br />
(1997 annual: 15 ug/m3, 24-hour: 65 ug/m3)<br />
• Modeling w/ CAIR shows attainment in 2010<br />
• Modeling w/out CAIR produces different results – will not attain<br />
in 2010<br />
• May ask for extension out to 2012<br />
• Modeling w/out shows attainment in 2012<br />
• Plan to submit attainment demonstration in December 2008<br />
• Metro-East<br />
NAA<br />
• Modeling w/CAIR shows will NOT attain by 2010<br />
• Modeling w/out CAIR by LADCO shows bigger problem<br />
• Will request attainment date extension until 2012<br />
• Work with <strong>Illinois</strong> major sources in NAA and Missouri DNR to get<br />
additional controls<br />
• Doing local scale modeling to better understand emissions<br />
picture – where to focus our attention (problem sources)<br />
• Plan to submit attainment demonstration as soon as possible<br />
9
NOx RACT (required for Ozone NAA)<br />
• Geographic applicability: : Chicago and<br />
Metro-East non-attainment areas<br />
• 2 Rules:<br />
1. Engine and Turbines (capacity of 500 bhp or 3.5<br />
MW)<br />
2. All sources w/ PTE >= 100 tpy & units w/ actual ><br />
15 tpy & 5 tpy ozone season.<br />
• Rules pending before <strong>Illinois</strong> Pollution<br />
Control Board<br />
• Final rules submitted to US<strong>EPA</strong> in 2009<br />
10
NOx SIP Call<br />
• Reinstituted<br />
• Allocations should be made prior to 2009<br />
ozone season – working with US<strong>EPA</strong><br />
11
VOC RACT (required for Ozone NAA)<br />
• Chicago and Metro-East non-attainment<br />
areas<br />
• Group I and II CTG’s<br />
• Group I projected rules submitted to <strong>Illinois</strong><br />
Pollution Control Board = January 2009<br />
12
Additional PM2.5 Measures<br />
• SO2 & PM RACT in NAA’s<br />
• Both required in absence of CAIR and needed<br />
for attainment<br />
• For Metro-East: pursuing local PM2.5<br />
reduction strategy with major sources in<br />
area<br />
13
SO2 and PM RACT<br />
• SO2 and PM RACT back on table for PM2.5 non-<br />
attainment areas<br />
• SO2 RACT: Likely need for Metro-East regardless of CAIR<br />
status<br />
• Plan to submit to <strong>Illinois</strong> Pollution Control Board in March 2009<br />
• PM RACT: reviewing – took significant measures for PM-10<br />
• If CAIR reappears, both may still be needed - either as<br />
Contingency Measures or for attainment of new 24-hour<br />
PM2.5 standard<br />
• If contingency measures, implementation triggered by measured<br />
violations after 2009. These measures address modeling<br />
uncertainty (differing results from 2002 versus 2005 base year)<br />
14
BART/Regional Haze<br />
• <strong>Illinois</strong> <strong>EPA</strong> is continuing to work with affected<br />
sources<br />
• Smoke Management Plan (MOU’s(<br />
with IDNR,<br />
IDOT, USFS, Forest Preserve Districts in<br />
northern <strong>Illinois</strong>, other land managers) including<br />
revised language in open burning permits<br />
• Projected SIP submittal to US<strong>EPA</strong> = March 2009<br />
15
Redesignation Policy<br />
• Evolving, flexible policy based on air quality – data driven, weight of<br />
evidence, risk analysis<br />
• Regional approach is desired - neighbors and partners in combating<br />
pollution<br />
• Need combination of local and regional controls<br />
• VOC/OC controls effective locally, SO2 & NOx controls effective<br />
regionally<br />
• I<strong>EPA</strong> is pursuing a regional, multi-pollutant<br />
pollutant, multi-sector<br />
planning<br />
approach<br />
• Where culpability exists for persistent problems – states should<br />
consult and work together for solutions<br />
• Oppose other states moving toward redesignation prematurely<br />
• <strong>Illinois</strong> must consider other state’s actions when contemplating<br />
whether to seek redesignation<br />
16
(Redesignation Policy cont.)<br />
• Ozone<br />
• Entire state is monitored attainment for Ozone (but<br />
design monitor in Metro-East area is non-attainment)<br />
• Chicago Area:<br />
• Nearby, downwind monitors where <strong>Illinois</strong> has significant<br />
impact showing non-attainment<br />
- Holland, MI. Regional<br />
planning approach continues – <strong>Illinois</strong> has taken significant<br />
actions to address this issue<br />
• Metro-East<br />
• St. Louis is non-attainment for ozone<br />
• Pursuing regional planning approach<br />
• PM2.5<br />
• Continued monitored non-attainment in both NAA’s<br />
therefore cannot seek redesignation<br />
• Modeling shows Metro-East Granite City area<br />
problem persistent out to 2018 – Chicago area now<br />
an issue out past 2010 due to CAIR vacatur<br />
17
Chicago 8-hour 8<br />
ozone redesignation<br />
request for the 1997 standard<br />
• 2006 - 2008 monitoring data shows attainment for Lake<br />
Michigan area – all sites except Holland, Michigan.<br />
• <strong>Illinois</strong> has taken significant steps to reduce emissions<br />
consistent with our redesignation policy<br />
• May submit redesignation request by December 2008<br />
with Chicago ozone attainment demonstration<br />
• No other non-attainment areas in <strong>Illinois</strong> qualify for<br />
redesignation<br />
18
Significant<br />
Reductions<br />
coming<br />
in <strong>Illinois</strong><br />
• Coal-Fired<br />
Power Plants<br />
• Multi-Pollutant<br />
Reduction<br />
Agreements<br />
with Power<br />
Plants<br />
19
• 59 Coal-Fired boilers (at 21 large power plants)<br />
• Largest source of man-made made Hg emissions, largest<br />
source of SO 2 and one of largest sources of NOx<br />
• 17,007 Megawatts of coal-fired electric generating<br />
capacity<br />
capacity – about 49% of total generation in IL (nuclear ~ 49%)<br />
2005 Emissions<br />
Total stationary<br />
sources<br />
SO2<br />
(tons/year)<br />
NOx<br />
(tons/year)<br />
486,523 208,335<br />
Coal-fired plants 326,171 124,620<br />
% from Coal-Fired<br />
Plants<br />
67% 60%<br />
20
Impact of CAIR in <strong>Illinois</strong><br />
US<strong>EPA</strong> Estimates<br />
• By 2015, CAIR will reduce SO 2 emissions by 125,000 tons – 34%<br />
reduction.<br />
(tons/yr) 2003 2010 2015<br />
SO 2 w/o CAIR 365,000 402,000 447,000<br />
SO 2 w/CAIR - 240,000 240,000<br />
• By 2015, CAIR will reduce emissions of NOx by 81,000 tons – 55%<br />
reduction.<br />
(tons/yr) 2003 2010 2015<br />
NOx w/o CAIR 146,000 146,000 159,000<br />
NOx w/CAIR - 69,000 65,000<br />
21
MPS and CPS Agreements – the<br />
Deals w/ Coal-fired Power<br />
Plants<br />
• Ameren, Dynegy and Midwest Generation<br />
represent 88% of <strong>Illinois</strong>’ coal fired capacity<br />
• Hg rule flexibility in exchange for significant NOx<br />
and SO2 reductions – Hg rule was the driver<br />
• Negotiated Emission Standards case-by<br />
by-case<br />
• Reversed Industry positions: strong opposition<br />
of proposed rules became support for Hg rule<br />
and to lesser extent, <strong>Illinois</strong> CAIR<br />
22
• Multi-Pollutant Standard (MPS)<br />
• Ameren & Dynegy<br />
• 35 IAC Part 225, Subpart B, 225.233 Multi Pollutant Standard<br />
• Combined Pollutant Standard (CPS)<br />
• Midwest Generation<br />
• 35 IAC Part 225, Subpart F: Combined Pollutant Standards<br />
23
SO 2 Agreed to Reductions<br />
SO2<br />
Requirement<br />
(lbs/mmbtu)<br />
By<br />
Year<br />
SO2<br />
eliminated<br />
(tons/yr)<br />
SO2<br />
%<br />
reduced<br />
Ameren 0.25 2015 127,145 76.3<br />
Dynegy 0.19 2015 38,745 65<br />
Midwest<br />
Generation<br />
0.28<br />
0.11<br />
2015<br />
2019<br />
35,343<br />
67,710<br />
45<br />
80<br />
Total 233,600<br />
24
Emission<br />
Rate<br />
(lbs/mmbt<br />
u)<br />
CAIR Midwest Generation Ameren Dynegy<br />
%<br />
% Emission Rate<br />
Reduction<br />
Reduction (lbs/mmbtu)<br />
Emission<br />
Rate<br />
(lbs/mmbtu)<br />
%<br />
Reductio<br />
n<br />
Emission<br />
Rate<br />
(lbs/mmbtu)<br />
%<br />
Reduction<br />
SO2<br />
2013 0.50 31% 0.44 13.7% 0.33 69% 0.24 56%<br />
2014 0.41 19.6%<br />
2015 0.45 34% 0.28 45.1% 0.25 76% 0.19 65%<br />
2016 0.195 61.8%<br />
2017 0.15 70.6%<br />
2018 0.13 74.5%<br />
2019 0.45 34% 0.11 78.4% 2 0.25 76% 0.19 65%<br />
25
Projected Annual SO2 Emissions Projection Under the MPS<br />
and CPS and Under <strong>EPA</strong> CAIR<br />
Baseline Average<br />
2003,04,05<br />
180,000<br />
2013 MPS/CPS<br />
150,000<br />
2013 <strong>EPA</strong> CAIR<br />
Tons/Year<br />
120,000<br />
90,000<br />
60,000<br />
30,000<br />
2015 MPS/CPS<br />
2015 <strong>EPA</strong> CAIR<br />
2019 MPS/CPS<br />
0<br />
Ameren Dynegy MWGen<br />
2019 <strong>EPA</strong> CAIR<br />
26
NOx Agreed to Reductions<br />
Ameren<br />
NOx<br />
Requirement<br />
(lbs/mmbtu)<br />
By<br />
Year<br />
NOx<br />
eliminated<br />
(tons/yr)<br />
NOx<br />
%<br />
reduced<br />
0.11 2012 18,799 52.2<br />
Dynegy<br />
0.10 2012 9,980 48<br />
Midwest<br />
Generation<br />
Total<br />
0.11 2012 32,655 68<br />
61,434<br />
27
NOx CAIR MidWest Gen Ameren Dynegy<br />
Annual – 0.15 44% 0.11 62% 0.11 52% 0.10 48%<br />
2012<br />
Annual -<br />
2015<br />
0.12 55% 0.11 62% 0.11 52% 0.10 48%<br />
Seasonal<br />
- 2012<br />
No data No data 0.11 51% 0.11 22% 0.10 25%<br />
28
Projected Annual NOx Emissions Projection Under the MPS<br />
/ CPS and Under <strong>EPA</strong> CAIR<br />
60,000<br />
50,000<br />
Tons/Year<br />
40,000<br />
30,000<br />
20,000<br />
10,000<br />
2003,04,05<br />
Baseline Average<br />
2012 MPS/CPS<br />
2012 <strong>EPA</strong> CAIR<br />
0<br />
Ameren Dynegy MWGen<br />
29
Conclusion: <strong>Illinois</strong> has substantial<br />
reductions coming<br />
<strong>Illinois</strong> has recently made groundbreaking strides<br />
towards controlling the emissions from coal-fired<br />
power plants. Notable measures that affect<br />
these power plants and that will serve to<br />
significantly reduce their air emissions include:<br />
• The <strong>Illinois</strong> Mercury Rule,<br />
• ???Clean Air Interstate Rule (CAIR)???,<br />
• Multi-pollutant reduction agreements,<br />
• Settlement of alleged air violations through legal<br />
consent decrees<br />
30