SAE Manual Sections 1 to 4_1 (May 06).pdf - National Statistical ...
SAE Manual Sections 1 to 4_1 (May 06).pdf - National Statistical ...
SAE Manual Sections 1 to 4_1 (May 06).pdf - National Statistical ...

You also want an ePaper? Increase the reach of your titles
YUMPU automatically turns print PDFs into web optimized ePapers that Google loves.
A Guide <strong>to</strong> Small Area Estimation - Version 1.1 05/05/20<strong>06</strong><br />
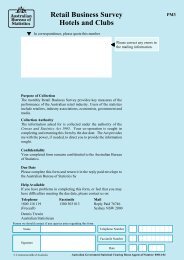
Figure 4.3 : Trade-off between Quality and Cost / Time / Effort<br />
<strong>Statistical</strong> expertise<br />
Robustness of results<br />
Understanding results<br />
Interpretability<br />
Issues<br />
Validity of assumptions<br />
User requirements<br />
Availability of resources<br />
Timeliness/deadlines<br />
Quality<br />
Simple<br />
models<br />
Complex<br />
models<br />
Level of<br />
precision<br />
Finer<br />
disaggregation<br />
Good auxiliary data<br />
Cost/time/effort<br />
As you can see from Figure 4.3, good quality auxiliary data is a crucial prerequisite for<br />
obtaining quality small area estimates. Quality is of course a relative term and depends<br />
very much upon the clients’ decision making requirements.<br />
Assuming that we have good quality auxiliary data, we would expect more sophisticated<br />
methods <strong>to</strong> provide results of a higher level of quality, as indicated by the upward slope<br />
of the cost-quality curve. The same curve also indicates that somewhere in the<br />
continuum there exists an optimal point (a level of precision) whereby any additional<br />
effort/cost/time from that point on, has either marginal or declining effects on quality.<br />
More elaborate techniques may give only marginal improvements in accuracy but<br />
decrease timeliness, an important dimension of quality. Overall quality may also be<br />
eroded when exceedingly smaller areas or finer disaggregations of the data are<br />
demanded. For example, in the disability analysis, disaggregating disability by type of<br />
impairment, level of severity and age group, in addition <strong>to</strong> the small area level, leads <strong>to</strong><br />
poor quality estimates, especially for the rarest impairment types such as sensory.<br />
There are also other issues, as shown just above the cost-curve in Figure 4.3, that may<br />
have significant bearing in relation <strong>to</strong> quality and cost of small area estimates. For<br />
example, the use of more complex models may require a higher level of subject matter<br />
knowledge and expertise <strong>to</strong> assist in understanding and interpreting model results.<br />
Such knowledge is also important for testing the validity of assumptions inherent in the<br />
model and in checking the robustness and sensitivity of model results.<br />
Finally, there are important points that have <strong>to</strong> be made in relation <strong>to</strong> the quality versus<br />
cost issue discussed above. Firstly, that simplicity is an important aspect of quality in<br />
that it aids the interpretability of small area output. We do not intend <strong>to</strong> imply from<br />
Figure 4.3 that simpler methods always imply poor quality estimates. More complex<br />
methods should only be attempted where there are likely <strong>to</strong> be demonstrable gains in<br />
Australian Bureau of Statistics 34