1 1.10 Application of estuarine and coastal classifications in marine ...
1 1.10 Application of estuarine and coastal classifications in marine ...
1 1.10 Application of estuarine and coastal classifications in marine ...

Create successful ePaper yourself
Turn your PDF publications into a flip-book with our unique Google optimized e-Paper software.
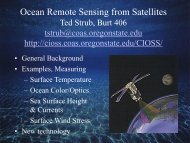
Figure 16. Classes or themes represented <strong>in</strong> maps can be utilized as strata <strong>in</strong> the optimal design<br />
<strong>of</strong> monitor<strong>in</strong>g or sampl<strong>in</strong>g strategies. Most biological populations are heterogeneous, therefore, a<br />
stratified r<strong>and</strong>om sampl<strong>in</strong>g design is one option for optimiz<strong>in</strong>g sampl<strong>in</strong>g design.<br />
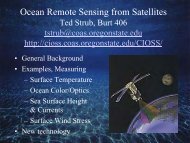
Figure 17. Trend analysis for <strong>coastal</strong> habitats <strong>of</strong> Barnegat Bay, New Jersey from 1972 to 1995<br />
show<strong>in</strong>g how a consistent classification framework can be effectively applied to detect changes<br />
over time. Analyses conducted by Rutgers University Center for Remote Sens<strong>in</strong>g <strong>and</strong> Spatial<br />
Analysis (Lathrop <strong>and</strong> Bognar 2001).<br />
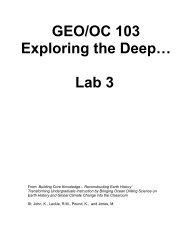
Figure 18. Spatial classification <strong>of</strong> losses <strong>and</strong> ga<strong>in</strong>s <strong>in</strong> wetl<strong>and</strong>s from 1990 to 2000 <strong>in</strong><br />
southwestern Louisiana (Barras et al. 2003).<br />
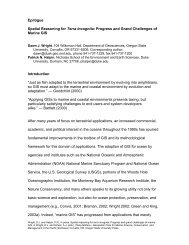
Figure 19. A.) Spatially explicit change detection us<strong>in</strong>g a consistent l<strong>and</strong> use classification<br />
reveals where changes occurred <strong>and</strong> type <strong>of</strong> class that mangrove was converted to <strong>in</strong> several SE<br />
Asian countries. B.) Example <strong>of</strong> l<strong>and</strong> change map show<strong>in</strong>g spatial distribution <strong>of</strong> mangrove<br />
deforestation <strong>in</strong> Ayeyarwady Delta, Burma, from 1975-1990, 1990-2000, <strong>and</strong> 2000-2005 (Giri et<br />
al. 2007).<br />
Figure 20. Environmental Sensitivity Index (ESI) map for a section <strong>of</strong> the Alabama coastl<strong>in</strong>e.<br />
96