- Page 1 and 2:
1.10 Application of estuarine and c
- Page 3 and 4:
SYNOPSIS Coastal and marine classif
- Page 5 and 6:
government and non-governmental man
- Page 7 and 8:
paucity of species and habitat data
- Page 9 and 10:
and many sub-catastrophic disturban
- Page 11 and 12:
conservation practitioners, industr
- Page 13 and 14:
levels of the hierarchy are defined
- Page 15 and 16:
distributions, both within and surr
- Page 17 and 18:
In a hierarchical framework for the
- Page 19 and 20:
1.10.2.3 Australian Coastal Classif
- Page 21 and 22:
Ecological theory predicts that the
- Page 23 and 24:
outbreaks in the late 1970s (Green
- Page 25 and 26:
intertidal zones, and shallow coast
- Page 27 and 28:
1.10.3.1 Identifying Priority Conse
- Page 29 and 30:
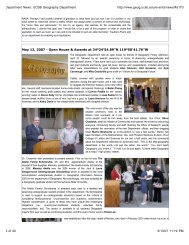
y the Massachusetts Oceans Act (200
- Page 31 and 32:
eight color coded zones to provide
- Page 33 and 34:
appropriate place to investigate fe
- Page 35 and 36:
1.10.4.3 Massachusetts Ocean Plan T
- Page 37 and 38:
One of the foundational concepts un
- Page 39 and 40:
ecosystems has shown that considera
- Page 41 and 42:
In May 2004, Germany was the first
- Page 43 and 44:
improve the design and interpretati
- Page 45 and 46:
NOAA’s CoastWatch Change Analysis
- Page 47 and 48:
ground resolution of 30 m. Each cla
- Page 49 and 50:
also be used to assess the role of
- Page 51 and 52:
States (Gundlach and Hayes 1978). T
- Page 53 and 54:
information at the species level. I
- Page 55 and 56:
1.10.8.4 Classifying and Mapping Hu
- Page 57 and 58:
map of the entire Australian shorel
- Page 59 and 60:
within 11 regions, leading to an ov
- Page 61 and 62: enhancement of certain functions in
- Page 63 and 64: achieved by identifying barriers to
- Page 65 and 66: ecosystem service values extracted
- Page 67 and 68: 1.10.12 FUTURE DIRECTIONS AND PRIOR
- Page 69 and 70: 1.10.12.1 Linking Patterns and Proc
- Page 71 and 72: approach. New classifications will
- Page 73 and 74: Arundel, H. and Mount, R. 2007. Nat
- Page 75 and 76: Connell, J. H. 1978. Diversity in t
- Page 77 and 78: Duke. N.C., Meynecke, J.O., Dittman
- Page 79 and 80: Green, A.L., C.E. Birkeland, R.H. R
- Page 81 and 82: Hiddink, J. G., Jennings, S., Kaise
- Page 83 and 84: Kostylev, V., Todd, B.J., Fader, G.
- Page 85 and 86: Maxwell, D.L., Stelzenmüller, V.,
- Page 87 and 88: Spatial and temporal patterns in fi
- Page 89 and 90: Sharples, C. 2006. Indicative Mappi
- Page 91 and 92: Wells, S., Ravilous, C., Corcoran,
- Page 93 and 94: FIGURE LEGENDS Figure 1. A) Classes
- Page 95 and 96: Figure 10. Ecological evaluation in
- Page 97 and 98: Figure 21. Combining 'intolerance'
- Page 99 and 100: selected planning units in gray ins
- Page 101 and 102: Box 2. Classifications as thematic
- Page 103 and 104: Figure 1. 1
- Page 105 and 106: Figure 3. 3
- Page 107 and 108: Figure 5. 5
- Page 109 and 110: Figure 7. 7
- Page 111: Figure 9. 9
- Page 115 and 116: Figure 13. 13
- Page 117 and 118: Figure 15. Fishing effort (hrs/day)
- Page 119 and 120: Figure 17. 17
- Page 121 and 122: Figure 19. 100% Conversion. 80% 60%
- Page 123 and 124: Figure 21. 21
- Page 125 and 126: Figure 23. 23
- Page 127 and 128: Figure 25. 25
- Page 129 and 130: Figure 27. 27
- Page 131 and 132: Figure 29. 29
- Page 133 and 134: Figure 31. 31
- Page 135: Figure 33. 33