1 1.10 Application of estuarine and coastal classifications in marine ...
1 1.10 Application of estuarine and coastal classifications in marine ...
1 1.10 Application of estuarine and coastal classifications in marine ...

Create successful ePaper yourself
Turn your PDF publications into a flip-book with our unique Google optimized e-Paper software.
<strong>1.10</strong> <strong>Application</strong> <strong>of</strong> <strong>estuar<strong>in</strong>e</strong> <strong>and</strong> <strong>coastal</strong> <strong>classifications</strong><br />
<strong>in</strong> mar<strong>in</strong>e spatial management<br />
Authors: Pittman S.J.*, Connor D.W, Radke L., <strong>and</strong> Wright D.J.<br />
Simon J. Pittman, Ph.D.<br />
Biogeography Branch<br />
Center for Coastal Monitor<strong>in</strong>g <strong>and</strong> Assessment<br />
National Oceanic <strong>and</strong> Atmospheric Adm<strong>in</strong>istration<br />
1305 East West Highway, Silver Spr<strong>in</strong>g<br />
Maryl<strong>and</strong> MD 20910<br />
United States <strong>of</strong> America<br />
simon.pittman@noaa.gov<br />
David W. Connor, Ph.D.<br />
Mar<strong>in</strong>e Ecosystems Group<br />
Jo<strong>in</strong>t Nature Conservation Committee<br />
Monkstone House, City Road<br />
Peterborough PE1 1JY<br />
United K<strong>in</strong>gdom<br />
david.connor@jncc.gov.uk<br />
1
Lynda Radke, Ph.D.<br />
Mar<strong>in</strong>e <strong>and</strong> Coastal Environment Group<br />
Geoscience Australia<br />
GPO Box 378<br />
Canberra, ACT 2601<br />
Australia<br />
lynda.radke@ga.gov.au<br />
Dawn J. Wright, Ph.D.<br />
Department <strong>of</strong> Geosciences<br />
Oregon State University<br />
Corvallis, OR 97331-5506<br />
United States <strong>of</strong> America<br />
dawn@dusk.geo.orst.edu<br />
*Correspond<strong>in</strong>g author<br />
Keywords: change analysis, classification, conservation prioritization, habitat mapp<strong>in</strong>g, mar<strong>in</strong>e<br />
spatial plann<strong>in</strong>g, ocean zon<strong>in</strong>g, seascapes, spatial valuation.<br />
2
SYNOPSIS<br />
Coastal <strong>and</strong> mar<strong>in</strong>e <strong>classifications</strong>, both spatially explicit <strong>in</strong> the form <strong>of</strong> maps <strong>and</strong> non-spatial<br />
representations <strong>of</strong> the environment are critical to the effective implementation <strong>of</strong> management<br />
strategies such as mar<strong>in</strong>e spatial plann<strong>in</strong>g. This chapter provides a wide range <strong>of</strong> <strong>classifications</strong><br />
<strong>and</strong> classified maps developed to simplify <strong>and</strong> communicate biological, physical, social <strong>and</strong><br />
economic patterns <strong>in</strong> support <strong>of</strong> enhanced management decision mak<strong>in</strong>g. Examples are provided<br />
from around the world <strong>and</strong> span a range <strong>of</strong> spatial scales from global <strong>classifications</strong> to those for<br />
<strong>in</strong>dividual bays <strong>and</strong> estuaries. Limitations, future challenges <strong>and</strong> priority management needs are<br />
discussed.<br />
<strong>1.10</strong>.1 INTRODUCTION<br />
In the <strong>coastal</strong> environment, ecological processes <strong>in</strong>teract across l<strong>and</strong> <strong>and</strong> sea to create<br />
complex dynamic spatial patterns <strong>in</strong> physical, chemical, biological <strong>and</strong> socio-economic<br />
attributes. The biophysical components (e.g., species, geology, climate, ocean circulation, etc.) <strong>of</strong><br />
<strong>coastal</strong> ecosystems provide the environmental template on which human activities occur <strong>and</strong> this<br />
heterogeneity <strong>in</strong>evitably means that some places will be more productive, more diverse, more<br />
stable, more commercially valuable, more susceptible to climate change or more resilient than<br />
other areas. The widespread recognition that <strong>coastal</strong> environments are spatially heterogeneous<br />
<strong>and</strong> are be<strong>in</strong>g adversely impacted by multiple stressors, many <strong>of</strong> which are directly related to<br />
human activity, has re<strong>in</strong>forced the need for coord<strong>in</strong>ated efforts to effectively monitor, assess <strong>and</strong><br />
judiciously manage ecosystems with<strong>in</strong> a spatial framework (Crowder <strong>and</strong> Norse 2008). Here we<br />
use the term “mar<strong>in</strong>e spatial management” to encompass a diverse range <strong>of</strong> management<br />
3
activities, some <strong>of</strong> which can be classed as ecosystem-based, but all <strong>of</strong> which rely on spatially<br />
explicit <strong>in</strong>formation to support decision mak<strong>in</strong>g. For example, mar<strong>in</strong>e zon<strong>in</strong>g <strong>and</strong> comprehensive<br />
mar<strong>in</strong>e spatial plann<strong>in</strong>g (MSP) are a subset <strong>of</strong> the broader approach <strong>of</strong> mar<strong>in</strong>e spatial<br />
management (Box 1).<br />
In mar<strong>in</strong>e spatial plann<strong>in</strong>g, a fundamental first step <strong>and</strong> critical precursor to spatial<br />
decision mak<strong>in</strong>g is to classify <strong>and</strong> map biophysical patterns, human uses <strong>and</strong> political <strong>and</strong> legal<br />
jurisdictional boundaries with<strong>in</strong> geographical focal areas (Lourie <strong>and</strong> V<strong>in</strong>cent 2004, Boyes et al.<br />
2007, Crowder <strong>and</strong> Norse 2008). Captur<strong>in</strong>g the relevant <strong>in</strong>formation at both operationally <strong>and</strong><br />
ecologically mean<strong>in</strong>gful scales, however, is a major ongo<strong>in</strong>g challenge now be<strong>in</strong>g addressed by<br />
advances <strong>in</strong> geospatial technologies that are rapidly revolutioniz<strong>in</strong>g the way we underst<strong>and</strong> <strong>and</strong><br />
manage the mar<strong>in</strong>e <strong>and</strong> <strong>coastal</strong> environment. Technological improvements <strong>and</strong> diversification <strong>of</strong><br />
air-, space, <strong>and</strong> water-borne sensors comb<strong>in</strong>ed with global position<strong>in</strong>g systems (GPS) for<br />
spatially accurate mapp<strong>in</strong>g are <strong>in</strong>creas<strong>in</strong>g data availability <strong>and</strong> diversity. Geographical<br />
<strong>in</strong>formation systems (GIS) <strong>and</strong> onl<strong>in</strong>e data portals facilitate data access, storage, management,<br />
<strong>in</strong>tegration, analysis <strong>and</strong> visualization <strong>and</strong> are now <strong>in</strong>tegral components <strong>in</strong> modern mar<strong>in</strong>e<br />
management (Boyes et al. 2007, Gillil<strong>and</strong> <strong>and</strong> Laffoley 2008, St. Mart<strong>in</strong> <strong>and</strong> Hall-Arber 2008).<br />
In this chapter we focus on spatial representations <strong>of</strong> classification schemes, a rapidly<br />
emerg<strong>in</strong>g spatial management tool that translates <strong>and</strong> <strong>of</strong>ten simplifies raw environmental data<br />
<strong>in</strong>to a more useful product for management application (Box 2). Often, synoptic <strong>in</strong>formation<br />
needs are urgently required to support timely implementation <strong>of</strong> management strategies <strong>and</strong> thus<br />
detailed scientific assessments are sometimes logistically unfeasible mak<strong>in</strong>g <strong>classifications</strong> based<br />
on comprehensive best available data a practical <strong>and</strong> scientifically defensible solution. In fact,<br />
many recent <strong>classifications</strong> have been specifically created to meet the needs <strong>of</strong> particular<br />
4
government <strong>and</strong> non-governmental management obligations related to directives, conventions,<br />
statutes <strong>and</strong> other <strong>in</strong>ternational, national <strong>and</strong> regional <strong>in</strong>itiatives (e.g., R<strong>of</strong>f <strong>and</strong> Taylor 2000,<br />
Kendall et al. 2002, Harris et al. 2002, Hiscock et al. 2003, Madden et al. 2005, Connor et al.<br />
2006 <strong>and</strong> other examples <strong>in</strong> this chapter).<br />
With the rapid emergence <strong>of</strong> mar<strong>in</strong>e spatial plann<strong>in</strong>g <strong>and</strong> spatially explicit ecosystembased<br />
management approaches, resource management agencies <strong>and</strong> conservation groups are<br />
<strong>in</strong>creas<strong>in</strong>gly utiliz<strong>in</strong>g <strong>classifications</strong> to support geographical priority sett<strong>in</strong>g <strong>and</strong> improv<strong>in</strong>g<br />
<strong>in</strong>formation-based decision mak<strong>in</strong>g for state <strong>of</strong> the environment report<strong>in</strong>g that requires consistent<br />
<strong>and</strong> systematic <strong>in</strong>formation from which to compare <strong>and</strong> contrast ecosystem health. In this<br />
chapter, us<strong>in</strong>g examples from around the world, we document <strong>classifications</strong> that have been<br />
developed to support management decision mak<strong>in</strong>g. We def<strong>in</strong>e mar<strong>in</strong>e spatial management<br />
broadly as any management activity that uses spatially explicit data to support decision mak<strong>in</strong>g<br />
from site characterization to select<strong>in</strong>g anchorage zones to monitor<strong>in</strong>g l<strong>and</strong>scape <strong>and</strong> seascape<br />
change, design<strong>in</strong>g networks <strong>of</strong> protected areas <strong>and</strong> <strong>in</strong>tegrated mar<strong>in</strong>e spatial plann<strong>in</strong>g. Most<br />
utility has been derived from spatially explicit <strong>classifications</strong> <strong>in</strong> the form <strong>of</strong> digital geographical<br />
maps, although not all <strong>coastal</strong> <strong>classifications</strong> are maps. Some <strong>classifications</strong> <strong>in</strong>clude features that<br />
are not easily mapped at scales operationally mean<strong>in</strong>gful for management.<br />
The possibilities for class content (or theme) with<strong>in</strong> <strong>coastal</strong> <strong>classifications</strong> are extremely<br />
broad <strong>and</strong> <strong>in</strong>clusive, with limitations usually related to the availability <strong>of</strong> an appropriate sensor or<br />
logistical (i.e., high f<strong>in</strong>ancial cost) constra<strong>in</strong>ts such as data availability. We <strong>in</strong>clude a crosssection<br />
<strong>of</strong> the data types currently be<strong>in</strong>g used to develop <strong>classifications</strong>, but far more examples<br />
exist than can be adequately covered here. In addition to theme, the spatial extent or<br />
geographical coverage <strong>of</strong> <strong>classifications</strong> varies greatly. This is important <strong>in</strong> terms <strong>of</strong> utility<br />
5
ecause management decisions take place at multiple levels <strong>of</strong> organization rang<strong>in</strong>g from global<br />
(mult<strong>in</strong>ational), national, state, to an <strong>in</strong>dividual bay, estuary or study plot. The Large Mar<strong>in</strong>e<br />
Ecosystems (LME) is perhaps the best known example <strong>of</strong> a global classification <strong>and</strong> comprises<br />
ocean spaces with dist<strong>in</strong>ct bathymetry, hydrography, productivity <strong>and</strong> trophic relationships<br />
(Sherman <strong>and</strong> Duda 1999). LMEs have been widely used as spatial management units for which<br />
data on fisheries <strong>and</strong> other biological <strong>in</strong>dicators <strong>of</strong> ecological <strong>in</strong>tegrity are aggregated, analyzed<br />
<strong>and</strong> assessed (Sherman <strong>and</strong> Duda 1999, Duda <strong>and</strong> Sherman 2002). A newer hierarchical<br />
classification known as the Mar<strong>in</strong>e Ecoregions <strong>of</strong> the World classification (Spald<strong>in</strong>g et al. 2007)<br />
has more recently emerged for <strong>coastal</strong> <strong>and</strong> shelf areas shallower than 200 m <strong>and</strong> is based on<br />
biogeographical divisions. It is a nested system <strong>of</strong> 12 realms, 62 prov<strong>in</strong>ces <strong>and</strong> 232 ecoregions<br />
provid<strong>in</strong>g a broader spatial coverage <strong>and</strong> f<strong>in</strong>er thematic resolution than the exist<strong>in</strong>g LMEs <strong>and</strong> is<br />
aimed at support<strong>in</strong>g the development <strong>of</strong> ecologically representative systems <strong>of</strong> protected areas as<br />
required by the Convention on Biological Diversity <strong>and</strong> Ramsar Convention on Wetl<strong>and</strong>s. At the<br />
f<strong>in</strong>est thematic resolution, the ecoregion has already been widely used by several large nongovernmental<br />
conservation organizations to develop ecoregional mar<strong>in</strong>e <strong>classifications</strong> <strong>and</strong><br />
assessments. Global regionalizations such as the LMEs <strong>and</strong> Mar<strong>in</strong>e Ecoregions are sometimes<br />
referred to as spatial frameworks or bioregional <strong>classifications</strong>, primarily because they focus on<br />
the relatively broad end <strong>of</strong> the scale us<strong>in</strong>g biogeographical patterns <strong>and</strong> the distribution <strong>of</strong><br />
relatively coarse resolution physical forc<strong>in</strong>g factors. As such their management utility differs<br />
from the f<strong>in</strong>er scale more thematically resolved <strong>coastal</strong> <strong>classifications</strong> that focus on habitat types<br />
or communities. At the national level, R<strong>of</strong>f <strong>and</strong> Taylor (2000) developed a hierarchical<br />
geophysical approach to the classification <strong>of</strong> mar<strong>in</strong>e habitats for the Canadian coastl<strong>in</strong>e. Due to<br />
the large extent <strong>of</strong> the Canadian coastl<strong>in</strong>e <strong>and</strong> Economic Exclusion Zone (EEZ) <strong>and</strong> the relative<br />
6
paucity <strong>of</strong> species <strong>and</strong> habitat data, geophysical data were used as a surrogate for mar<strong>in</strong>e<br />
communities <strong>and</strong> for the identification <strong>of</strong> broad representative habitat types. The classification<br />
approach developed by R<strong>of</strong>f <strong>and</strong> Taylor (2000) <strong>and</strong> subsequently by R<strong>of</strong>f et al. (2003) has been<br />
widely applied for the classification <strong>of</strong> seascapes <strong>in</strong> mar<strong>in</strong>e spatial management efforts <strong>in</strong> the<br />
U.S., Europe <strong>and</strong> Australia.<br />
Not all global <strong>classifications</strong>, however, are based on biophysical characteristics. In a<br />
simple numerical model<strong>in</strong>g approach, Halpern et al. (2007, 2008) constructed global maps <strong>of</strong><br />
cumulative impacts from human activity to the mar<strong>in</strong>e environments that allowed areas to be<br />
ranked with an impact score or classified as high, medium <strong>and</strong> low impact. Us<strong>in</strong>g a derivative<br />
approach, a cumulative impacts model was subsequently applied <strong>and</strong> ref<strong>in</strong>ed for the<br />
Papahānaumokuākea Mar<strong>in</strong>e National Monument <strong>in</strong> Hawaii to focus more on locally relevant<br />
threats <strong>in</strong>clud<strong>in</strong>g mar<strong>in</strong>e debris, <strong>in</strong>vasive species, fish<strong>in</strong>g <strong>and</strong> climate change parameters (Selkoe<br />
et al. 2009). In addition, thematic maps are <strong>in</strong>creas<strong>in</strong>gly be<strong>in</strong>g used to represent spatial pattern<strong>in</strong>g<br />
<strong>in</strong> ecological economics, with maps <strong>of</strong> ecosystem services be<strong>in</strong>g used together with spatial<br />
prioritization algorithms such as Marxan to support the decision mak<strong>in</strong>g process (Sala et al 2002,<br />
Leslie et al. 2003; Chan et al. 2006; Geselbracht et al. 2008).<br />
This chapter provides examples <strong>of</strong> applications <strong>of</strong> exist<strong>in</strong>g <strong>classifications</strong> <strong>and</strong> the<br />
development <strong>of</strong> new <strong>classifications</strong> to support a wide range <strong>of</strong> activities <strong>in</strong> mar<strong>in</strong>e <strong>and</strong> <strong>coastal</strong><br />
management. The emphasis is on the use <strong>of</strong> digital maps, quantitative data <strong>and</strong> model<strong>in</strong>g<br />
comb<strong>in</strong>ed with GIS tools s<strong>in</strong>ce these spatial frameworks are contribut<strong>in</strong>g significantly to a spatial<br />
revolution <strong>in</strong> the way that we underst<strong>and</strong>, utilize <strong>and</strong> manage our oceans <strong>and</strong> coasts. We focus<br />
primarily on categorical or thematic maps derived from either remotely sensed data, field<br />
surveys, expert knowledge or as <strong>of</strong>ten occurs an <strong>in</strong>tegrated comb<strong>in</strong>ation <strong>of</strong> these <strong>in</strong>formation<br />
7
sources. The majority <strong>of</strong> our examples are focused on sub-national level <strong>classifications</strong> <strong>and</strong><br />
associated management applications rather than global or national level, although we<br />
acknowledge the importance <strong>of</strong> nested <strong>classifications</strong> to facilitate consistency <strong>in</strong> regional,<br />
national <strong>and</strong> <strong>in</strong>ternational assessments <strong>and</strong> management decision mak<strong>in</strong>g.<br />
<strong>1.10</strong>.1.1 Importance <strong>of</strong> Spatial, Temporal <strong>and</strong> Thematic resolution<br />
In addition to spatial extent, the three attributes <strong>of</strong> a map that imp<strong>in</strong>ge most on the<br />
appropriateness <strong>of</strong> a spatial classification for management application are: 1) spatial resolution;<br />
2) temporal resolution, <strong>and</strong> 3) thematic resolution; all <strong>of</strong> which can <strong>in</strong>fluence the application,<br />
cost-effectiveness <strong>and</strong> feasibility <strong>of</strong> map production (Fassnacht et al. 2006, Kendall <strong>and</strong> Miller<br />
2008). Thematic resolution is <strong>in</strong>fluenced by the scale at which the environment is sampled <strong>and</strong><br />
chang<strong>in</strong>g the number <strong>of</strong> classes can <strong>in</strong>fluence the pattern<strong>in</strong>g, be it benthic seascape or ecosystem<br />
service values, as much as chang<strong>in</strong>g the spatial resolution. It is <strong>of</strong>ten perceived that higher<br />
thematic resolution (i.e., higher number <strong>of</strong> classes) that creates highly specialized categories can<br />
potentially <strong>of</strong>fer greater predictive power, but the predictive performance <strong>of</strong> categorical data<br />
really depends on what is be<strong>in</strong>g predicted. Spatial resolution <strong>and</strong> thematic resolution, as well as,<br />
post-classification techniques such as smooth<strong>in</strong>g can greatly impact the representation <strong>of</strong> rare<br />
<strong>and</strong> fragmented ecosystems <strong>and</strong> this has considerable implications for maps directed at site<br />
prioritization <strong>in</strong> mar<strong>in</strong>e conservation (Thompson <strong>and</strong> Gergel 2008). Furthermore, the static<br />
nature <strong>of</strong> most <strong>classifications</strong> is an issue when applied to dynamic mar<strong>in</strong>e environments. Mar<strong>in</strong>e<br />
environments can be modified significantly by human activities, storms <strong>and</strong> swell events, disease<br />
8
<strong>and</strong> many sub-catastrophic disturbances at temporal scales that are markedly f<strong>in</strong>er than those<br />
<strong>in</strong>tervals that typically exist for the updat<strong>in</strong>g <strong>of</strong> maps.<br />
<strong>1.10</strong>.1.2 Utility <strong>of</strong> Hierarchical Classification Schemes<br />
In many cases, hierarchical classification schemes have been developed to add more<br />
flexibility for the user, particularly when manipulated <strong>in</strong> a GIS, thereby facilitat<strong>in</strong>g the utility for<br />
both management applications <strong>and</strong> ecological applications. For example, the British Columbia<br />
Mar<strong>in</strong>e Ecological Classification <strong>in</strong>cludes Ecozone (e.g., Pacific) as the broadest level <strong>in</strong> the<br />
hierarchy, then nested at progressively f<strong>in</strong>er thematic resolution are the Ecoprov<strong>in</strong>ce (e.g.,<br />
Pacific shelf <strong>and</strong> mounta<strong>in</strong>s); Ecoregion (e.g., Outer Pacific Mar<strong>in</strong>e Shelf); Ecosection (e.g.,<br />
Queen Charlotte Sound) <strong>and</strong> f<strong>in</strong>ally the Ecounit, based on data for wave exposure, depth,<br />
subsurface relief, currents <strong>and</strong> substrate type (Zacharias et al. 1998). This hierarchical structure is<br />
important because ecological patterns <strong>and</strong> processes are multi-scale <strong>and</strong> management actions<br />
occur across a hierarchy <strong>of</strong> spatial scales (Wiens 2000). R<strong>of</strong>f et al. (2003) provided five<br />
important considerations for the development <strong>of</strong> a generalized hierarchical habitat classification<br />
scheme: 1.) the availability <strong>of</strong> data capable <strong>of</strong> discrim<strong>in</strong>at<strong>in</strong>g mean<strong>in</strong>gful habitat classes; 2.)<br />
redundancy <strong>in</strong> discrim<strong>in</strong>at<strong>in</strong>g variables may occur <strong>and</strong> surrogates can be identified; 3.)<br />
discrim<strong>in</strong>atory function <strong>of</strong> variables may be scale dependent (i.e., sal<strong>in</strong>ity may work well at one<br />
level but not another), 4.) habitat types at upper levels <strong>of</strong> the hierarchy should be more dist<strong>in</strong>ct<br />
from one another than those at lower levels, <strong>and</strong> 5.) the importance <strong>of</strong> discrim<strong>in</strong>atory variables<br />
may vary geographically (i.e., East Pacific variables may not all be applicable to the west<br />
Atlantic) (see also R<strong>of</strong>f <strong>and</strong> Taylor 2000).<br />
9
While these are useful guides for the development <strong>of</strong> <strong>classifications</strong>, the detailed<br />
architecture <strong>of</strong> the classification <strong>and</strong> resultant class distributions are also crucial to management<br />
when important decisions on management priorities <strong>and</strong> levels <strong>of</strong> action are weighted heavily on<br />
<strong>in</strong>formation provided <strong>in</strong> a classified map. The utility <strong>of</strong> a hierarchical classification <strong>in</strong>creases<br />
further s<strong>in</strong>ce many <strong>coastal</strong> <strong>classifications</strong> have been developed without a specific application <strong>in</strong><br />
m<strong>in</strong>d <strong>and</strong> without knowledge <strong>of</strong> future applications; many <strong>of</strong> which would be difficult to<br />
perceive given the wide range <strong>of</strong> current uses for <strong>coastal</strong> areas <strong>and</strong> types <strong>of</strong> <strong>coastal</strong> management.<br />
The recent progress <strong>in</strong> MSP has drawn heavily on exist<strong>in</strong>g <strong>classifications</strong>, the majority <strong>of</strong> which<br />
were not specifically designed with fully <strong>in</strong>tegrated MSP <strong>in</strong> m<strong>in</strong>d. Significant efforts are<br />
underway to evaluate their utility <strong>and</strong> to better align <strong>and</strong> <strong>in</strong>tegrate local, regional, national <strong>and</strong><br />
<strong>in</strong>ternational classification schemes to provide <strong>in</strong>teroperability across schemas <strong>and</strong> facilitate<br />
objective broader scale comparisons.<br />
<strong>1.10</strong>.1.3 Examples <strong>of</strong> Hierarchical Classifications<br />
The hierarchical mar<strong>in</strong>e habitat classification developed for EUNIS (European Nature<br />
Information System) (http://eunis.eea.europa.eu/habitats.jsp) <strong>in</strong>tegrates <strong>and</strong> modifies several<br />
exist<strong>in</strong>g schemas, <strong>in</strong>clud<strong>in</strong>g the Mar<strong>in</strong>e Habitat Classification for Brita<strong>in</strong> <strong>and</strong> Irel<strong>and</strong> (Connor et<br />
al. 2004; http://www.jncc.gov.uk/Mar<strong>in</strong>eHabitatClassification) <strong>and</strong> <strong>classifications</strong> developed for<br />
the OSPAR (north-east Atlantic), Hels<strong>in</strong>ki (Baltic Sea) <strong>and</strong> Barcelona (Mediterranean Sea)<br />
Conventions to create a pan-European reference set <strong>of</strong> habitat units with common descriptions.<br />
The Mar<strong>in</strong>e Habitat Classification for Brita<strong>in</strong> <strong>and</strong> Irel<strong>and</strong> is based on multivariate analyses <strong>of</strong><br />
more than 30,000 biological samples <strong>and</strong> is well established as a st<strong>and</strong>ard tool for mar<strong>in</strong>e<br />
10
conservation practitioners, <strong>in</strong>dustry regulators <strong>and</strong> those <strong>in</strong>volved <strong>in</strong> environmental assessment,<br />
survey <strong>and</strong> management. A novel feature <strong>of</strong> the classification is the development <strong>of</strong> a key<br />
(analogous to a taxonomic key for <strong>in</strong>dividual species) for systematic identification <strong>of</strong> habitat<br />
types. The EUNIS classification scheme was designed to enable comparative referenc<strong>in</strong>g <strong>and</strong><br />
report<strong>in</strong>g <strong>in</strong> nature conservation specifically l<strong>in</strong>ked to the legal obligations under EC Habitats<br />
Directive Annex I <strong>and</strong> the Bern Convention Resolution No. 4. EUNIS has been constructed to be<br />
truly hierarchical <strong>in</strong> design, with habitat units at each level aim<strong>in</strong>g to be <strong>of</strong> equivalent ecological<br />
importance <strong>and</strong> with no duplication <strong>of</strong> lower level units with<strong>in</strong> the higher types. The hierarchy<br />
allows mapp<strong>in</strong>g at different spatial scales, as demonstrated by the MESH project (Mapp<strong>in</strong>g<br />
European Seabed Habitats) <strong>in</strong> a web-based GIS application (http://www.searchmesh.net/) which<br />
has collated exist<strong>in</strong>g maps <strong>of</strong> differ<strong>in</strong>g levels <strong>of</strong> detail <strong>and</strong> st<strong>and</strong>ardized them accord<strong>in</strong>g to the<br />
EUNIS scheme. The classification’s use <strong>of</strong> physical parameters (e.g. substratum, sal<strong>in</strong>ity, wave<br />
<strong>and</strong> current energy), l<strong>in</strong>ked clearly to changes <strong>in</strong> community types, provides the basis for<br />
predict<strong>in</strong>g the distribution <strong>of</strong> mar<strong>in</strong>e biotopes from exist<strong>in</strong>g data (Feral, 1999). Predictive models<br />
<strong>of</strong> EUNIS habitat types have been developed for north-west Europe (Coltman et al. 2008). The<br />
comprehensive <strong>and</strong> hierarchical structure <strong>of</strong> the EUNIS classification supports diverse<br />
management applications <strong>in</strong>clud<strong>in</strong>g: 1) provision <strong>of</strong> broad categories for the assessment <strong>of</strong> the<br />
state <strong>and</strong> trends <strong>of</strong> nature <strong>in</strong> the European Environment Agency’s report<strong>in</strong>g process; 2)<br />
support<strong>in</strong>g the development <strong>of</strong> the EU NATURA 2000 conservation network <strong>and</strong> revision <strong>of</strong><br />
Annex I <strong>of</strong> the Habitats Directive; 3) obta<strong>in</strong><strong>in</strong>g an overview <strong>of</strong> habitat distribution across Europe;<br />
to enable nations to place <strong>and</strong> assess their habitats <strong>in</strong> a European context; 4) conduct<strong>in</strong>g<br />
biodiversity assessments; 5) provid<strong>in</strong>g a practical system for the description <strong>and</strong> monitor<strong>in</strong>g <strong>of</strong><br />
11
habitat types for national, regional <strong>and</strong> local levels; <strong>and</strong> 6) identify<strong>in</strong>g <strong>and</strong> document<strong>in</strong>g the<br />
character <strong>and</strong> distribution <strong>of</strong> the most threatened habitat types <strong>in</strong> Europe.<br />
In the U.S., a variety <strong>of</strong> <strong>coastal</strong> <strong>classifications</strong> have been developed to describe local or<br />
regional ecological systems <strong>and</strong> address local objectives. In response to the need for a s<strong>in</strong>gle<br />
classification st<strong>and</strong>ard that is relevant to all U.S. <strong>coastal</strong> <strong>and</strong> mar<strong>in</strong>e environments <strong>and</strong> that can<br />
be applied on local, regional <strong>and</strong> cont<strong>in</strong>ental scales, NOAA <strong>and</strong> NatureServe developed the<br />
Coastal Mar<strong>in</strong>e Ecological Classification St<strong>and</strong>ard (CMECS) (Madden et al. 2005, Madden <strong>and</strong><br />
Grossman 2008). The classification is described as an ecosystem-oriented, science-based<br />
framework developed to allow effective identification, monitor<strong>in</strong>g, protection, <strong>and</strong> restoration <strong>of</strong><br />
unique biotic assemblages, protected species, critical habitat, <strong>and</strong> important ecosystem<br />
components. The hierarchical framework conta<strong>in</strong>s six nested levels; each conta<strong>in</strong><strong>in</strong>g clearly<br />
def<strong>in</strong>ed classes <strong>and</strong> units as follows: Level 1 Regime classes are differentiated by a comb<strong>in</strong>ation<br />
<strong>of</strong> sal<strong>in</strong>ity, geomorphology <strong>and</strong> depth; Level 2 Formation are large physical structures formed by<br />
either water or solid substrate with<strong>in</strong> systems; Level 3 Zone classes <strong>in</strong>clude the water column,<br />
littoral or sea bottom; Level 4 Macrohabitat classes are large physical structures that conta<strong>in</strong><br />
multiple habitats; Level 5 Habitat classes are a specific comb<strong>in</strong>ation <strong>of</strong> physical <strong>and</strong> energy<br />
characteristics that creates a suitable place for colonization or use by biota; Level 6 Biotope<br />
classes represent the characteristic biology associated with a specific habitat. The hierarchy is<br />
conceptually divided <strong>in</strong>to two parts based on the k<strong>in</strong>ds <strong>of</strong> data required for apply<strong>in</strong>g the<br />
classification. Data for the upper levels, Regime through Zone can be captured from maps,<br />
bathymetry, remote imagery <strong>and</strong> exist<strong>in</strong>g historical data. In contrast, the lower levels,<br />
Macrohabitat though Biotope, exist at local spatial scales <strong>and</strong> data collection is done through<br />
f<strong>in</strong>er resolution remote sens<strong>in</strong>g, field observation <strong>and</strong> direct measurement. L<strong>in</strong>kages between<br />
12
levels <strong>of</strong> the hierarchy are def<strong>in</strong>ed by ecosystem processes <strong>and</strong> by spatial relationships. Stated<br />
management utility <strong>in</strong>cludes: 1) Del<strong>in</strong>eation <strong>of</strong> regions for mar<strong>in</strong>e protected areas <strong>and</strong> develop<strong>in</strong>g<br />
guidel<strong>in</strong>es for their management; 2) Identification <strong>of</strong> important habitats <strong>and</strong> critical hotspots for<br />
conservation; 3) Identification <strong>of</strong> Essential Fish Habitat (EFH); <strong>and</strong> 4) Form<strong>in</strong>g a scientific basis<br />
for the development, implementation <strong>and</strong> monitor<strong>in</strong>g <strong>of</strong> ecosystem-based management strategies<br />
for <strong>coastal</strong> systems (Madden <strong>and</strong> Grossman 2008).<br />
For threatened <strong>and</strong> vulnerable shallow-water <strong>coastal</strong> ecosystems such as tropical coral<br />
reefs, habitat mapp<strong>in</strong>g is essential for the development <strong>of</strong> effective mar<strong>in</strong>e management plans<br />
<strong>in</strong>clud<strong>in</strong>g MPA site selection <strong>and</strong> other conservation prioritization activities. Information ga<strong>in</strong>ed<br />
from coral reef mapp<strong>in</strong>g <strong>in</strong>cludes identify<strong>in</strong>g essential fish habitat <strong>and</strong> other ecologically<br />
sensitive areas for protection, calculat<strong>in</strong>g volumetric or area measurements <strong>of</strong> anthropogenic<br />
impacts, identify<strong>in</strong>g reef gaps for submar<strong>in</strong>e cable placement, <strong>and</strong> locat<strong>in</strong>g areas for artificial<br />
reef enhancement. To address multiple management <strong>and</strong> research objectives, NOAA’s Benthic<br />
Habitat Classification for Puerto Rico <strong>and</strong> the U.S. Virg<strong>in</strong> Isl<strong>and</strong>s (Kendall 2001) was developed<br />
with a hierarchical structure that <strong>in</strong>tegrates four levels <strong>of</strong> classification for mapp<strong>in</strong>g coral reef<br />
ecosystems <strong>in</strong>clud<strong>in</strong>g: 1) Geomorphological zone (e.g., forereef, bank etc.); 2) Habitat structure<br />
(e.g., colonized hardbottom); 3) Habitat type (e.g., l<strong>in</strong>ear reef, seagrass) <strong>and</strong> 4) Modifiers used to<br />
show the proportion (% cover) <strong>of</strong> area coverage for macroalgae <strong>and</strong> seagrasses. A hierarchical<br />
structure means that different analyses <strong>and</strong> different levels <strong>of</strong> features can be utilized for<br />
different levels <strong>of</strong> management decision mak<strong>in</strong>g. For example, the percentage seagrass cover<br />
was used as a variable for quantify<strong>in</strong>g changes <strong>in</strong> the spatial distribution <strong>of</strong> seagrasses <strong>and</strong> the<br />
impact from hurricanes over 30 years (Kendall et al. 2004). In 2008, a new classification was<br />
developed for application to f<strong>in</strong>er resolution benthic habitat maps for St John <strong>in</strong> the U.S. Virg<strong>in</strong><br />
13
Isl<strong>and</strong>s with a m<strong>in</strong>imum mapp<strong>in</strong>g unit (MMU) <strong>of</strong> 1000 m 2 . The fundamental difference <strong>in</strong> the St.<br />
John scheme is the deviation from coral-centric classification rules to a biological dom<strong>in</strong>ance<br />
scheme <strong>in</strong> which benthic habitats were classified based on the dom<strong>in</strong>ant biological cover type<br />
present on each mapped feature. The importance <strong>of</strong> describ<strong>in</strong>g the percent cover <strong>of</strong> live coral,<br />
however, was ma<strong>in</strong>ta<strong>in</strong>ed by the <strong>in</strong>troduction <strong>of</strong> a new map attribute Percent Coral Cover. This<br />
attribute describes the percent live coral cover for every feature at the scale <strong>of</strong> diver observation<br />
<strong>in</strong> the water, with no regard to dom<strong>in</strong>ant biological cover (Zitello et al. 2009).<br />
Maps <strong>of</strong> habitat structure, a relatively coarse habitat classification us<strong>in</strong>g dom<strong>in</strong>ant cover<br />
types, was found to be most appropriate for predict<strong>in</strong>g differences <strong>in</strong> fish assemblage<br />
composition (i.e., mangrove, seagrasses/algae, colonized hardbottom <strong>and</strong> unvegetated sediments)<br />
<strong>in</strong> SW Puerto Rico (Pittman et al. 2010) <strong>and</strong> to classify optimal seascapes for fish (Pittman et al.<br />
2007b). When comb<strong>in</strong>ed with <strong>in</strong>formation on topographic complexity <strong>of</strong> the seafloor the benthic<br />
habitat maps at the habitat type level were able to accurately predict the spatial patterns <strong>of</strong> fish<br />
species richness <strong>in</strong> the U.S. Virg<strong>in</strong> Isl<strong>and</strong>s <strong>and</strong> SW Puerto Rico (Pittman et al. 2007a).<br />
Furthermore, <strong>in</strong> the same region, comb<strong>in</strong><strong>in</strong>g geomorphological zones <strong>and</strong> habitat structure<br />
proved useful for expla<strong>in</strong><strong>in</strong>g the across-shelf size dependent distributions for fish (Christensen et<br />
al. 2003).<br />
<strong>1.10</strong>.2 SPATIAL CHARACTERIZATION USING MARINE AND COASTAL<br />
CLASSIFICATIONS<br />
Classification schemes <strong>and</strong> associated maps are <strong>in</strong>dispensible to environmental managers<br />
<strong>in</strong> provid<strong>in</strong>g the basel<strong>in</strong>e <strong>in</strong>formation on the distribution <strong>of</strong> natural features, <strong>in</strong>clud<strong>in</strong>g species<br />
14
distributions, both with<strong>in</strong> <strong>and</strong> surround<strong>in</strong>g their jurisdictions. Spatial characterizations can be<br />
species-centered, biological community centered, can represent bioregions <strong>and</strong> can be derived<br />
from geophysical or chemical variables <strong>and</strong> more recently have extended to characterize human<br />
use patterns <strong>and</strong> threats to ecosystems. The most common data types used for basel<strong>in</strong>e<br />
characterizations <strong>in</strong> the mar<strong>in</strong>e environment are benthic habitat maps <strong>and</strong> l<strong>and</strong>cover maps <strong>in</strong><br />
terrestrial environments. Thematic habitat maps are typically developed from <strong>in</strong>terpretation <strong>of</strong><br />
remotely sensed data (space-, air- or ship-based) guided by georeferenced <strong>in</strong> situ samples to<br />
def<strong>in</strong>e classes or through spatial <strong>in</strong>terpolation <strong>of</strong> georeferenced <strong>in</strong> situ samples. In many<br />
<strong>in</strong>stances the ecological relevance <strong>of</strong> mapped classes is unclear <strong>and</strong> much work is required to<br />
determ<strong>in</strong>e the relationship between the spatial distributions <strong>of</strong> habitat classes <strong>and</strong> the distribution<br />
<strong>of</strong> other ecological attributes <strong>in</strong>clud<strong>in</strong>g species <strong>and</strong> biological communities.<br />
In the Bahamas, Mumby et al. (2008) found that approximately 25-30% <strong>of</strong> benthic<br />
<strong>in</strong>vertebrate species <strong>and</strong> fish were associated with a s<strong>in</strong>gle habitat class, yet they determ<strong>in</strong>ed that<br />
all classes (n=11) were needed if the management objective was to represent all species <strong>in</strong> the<br />
seascape. In the same region, Harborne et al. (2008) found that although each habitat class<br />
supported a dist<strong>in</strong>ct assemblage <strong>of</strong> fish, the efficacy <strong>of</strong> mapped habitats as surrogates for fish<br />
communities was limited by <strong>in</strong>tra-habitat variability that <strong>in</strong>creased with geographical scale. The<br />
relevance <strong>of</strong> mapped classes to biological communities, however, can be dependent on the<br />
mapp<strong>in</strong>g tools applied <strong>and</strong> the variables measured. In southern Engl<strong>and</strong>, Eastwood et al. (2006)<br />
determ<strong>in</strong>ed that benthic <strong>classifications</strong> <strong>of</strong> s<strong>of</strong>t sediments derived from side-scan sonar were not<br />
effective at classify<strong>in</strong>g biological assemblages. Similarly, Stevens <strong>and</strong> Connolly (2004) found<br />
that abiotic surrogates classified from underwater video transects <strong>in</strong> Moreton Bay, Australia,<br />
were not good surrogates for patterns <strong>of</strong> mar<strong>in</strong>e biodiversity. In northern Australia, however,<br />
15
<strong>in</strong>clusion <strong>of</strong> a wider range <strong>of</strong> physical factors <strong>in</strong>clud<strong>in</strong>g sediment composition (gra<strong>in</strong> size <strong>and</strong><br />
carbonate content), sediment mobility, water depth <strong>and</strong> organic flux were able to adequately<br />
characterize macr<strong>of</strong>aunal distributions (Post et al. 2006). The latter study highlights the<br />
importance <strong>of</strong> <strong>in</strong>clud<strong>in</strong>g process-based factors such as sediment mobility <strong>in</strong> determ<strong>in</strong><strong>in</strong>g patterns<br />
<strong>of</strong> diversity <strong>and</strong> <strong>in</strong>dividual species distributions, particularly <strong>in</strong> s<strong>of</strong>t sediment dom<strong>in</strong>ated regions.<br />
In many areas, however, the work <strong>of</strong> assess<strong>in</strong>g the utility <strong>of</strong> benthic habitat maps as surrogates <strong>of</strong><br />
biodiversity or as predictors <strong>of</strong> species distributions is still <strong>in</strong> its <strong>in</strong>fancy <strong>and</strong> is a major pursuit <strong>in</strong><br />
the field <strong>of</strong> mar<strong>in</strong>e spatial ecology.<br />
Habitat maps can also be analyzed us<strong>in</strong>g l<strong>and</strong>scape ecology concepts <strong>and</strong> spatial tools to<br />
exam<strong>in</strong>e the importance <strong>of</strong> spatial heterogeneity <strong>of</strong> the environment <strong>in</strong>clud<strong>in</strong>g the significance<br />
<strong>of</strong> seascape composition (distribution, abundance <strong>and</strong> diversity <strong>of</strong> patch types) <strong>and</strong> seascape<br />
configuration or spatial arrangement (the explicit spatial geometry <strong>of</strong> patches) (Pittman et al.<br />
2004, 2007b, Grober-Dunsmore 2007, 2008). This new approach <strong>in</strong> mar<strong>in</strong>e ecology represents a<br />
shift from a focus on <strong>in</strong>dividual habitat patches to a focus on the surround<strong>in</strong>g seascape mosaic. A<br />
classified map <strong>of</strong> functionally mean<strong>in</strong>gful seascape types can provide a novel spatial template<br />
with which to frame many important management <strong>and</strong> ecological questions <strong>in</strong>clud<strong>in</strong>g the design<br />
<strong>of</strong> mar<strong>in</strong>e protected areas, essential fish habitat <strong>and</strong> design<strong>in</strong>g optimal restoration projects.<br />
Classified maps also play an important role <strong>in</strong> form<strong>in</strong>g spatial predictor variables <strong>in</strong> predictive<br />
mapp<strong>in</strong>g <strong>of</strong> biodiversity <strong>and</strong> expla<strong>in</strong><strong>in</strong>g <strong>in</strong>dividual species distributions for coral reef ecosystems<br />
(Pittman et al. 2007a; Purkis et al. 2008, Pittman et al. 2009, Knudby et al. 2010) (Figure 1).<br />
<strong>1.10</strong>.2.1 Classify<strong>in</strong>g <strong>and</strong> Mapp<strong>in</strong>g Seascapes <strong>of</strong> the Scotian Shelf, NW Atlantic<br />
16
In a hierarchical framework for the Scotian Shelf, R<strong>of</strong>f et al. (2003) classified pelagicbenthic<br />
seascapes by comb<strong>in</strong><strong>in</strong>g a classification <strong>of</strong> benthic seascapes (based on temperature,<br />
bottom temperature, exposure, slope <strong>and</strong> sediment types), with a classification <strong>of</strong> pelagic<br />
seascapes (based on water temperature, depth classes <strong>and</strong> stratification classes) (Figure 2A).<br />
These layers were then used to calculate a derivative map to show relative seascape<br />
heterogeneity (Figure 2B) <strong>in</strong> order to identify areas with high heterogeneity as potential focal<br />
areas for mar<strong>in</strong>e conservation. Further utility can be ga<strong>in</strong>ed by quantify<strong>in</strong>g the seascape<br />
composition <strong>of</strong> exist<strong>in</strong>g or proposed mar<strong>in</strong>e protected areas, for l<strong>in</strong>k<strong>in</strong>g to key faunal populations<br />
or behavioral patterns such as migratory corridors for megafauna <strong>and</strong> addresses questions about<br />
habitat use <strong>and</strong> preferences at scales that may be more mean<strong>in</strong>gful to the highly mobile<br />
organisms (Box 3). Furthermore, such <strong>in</strong>formation can help underst<strong>and</strong> mar<strong>in</strong>e species<br />
distributions <strong>and</strong> characterize essential fish habitat <strong>in</strong>clud<strong>in</strong>g nursery <strong>and</strong> spawn<strong>in</strong>g areas.<br />
Us<strong>in</strong>g similar organizational frameworks, seascapes have been classified <strong>and</strong> del<strong>in</strong>eated <strong>in</strong><br />
Australia (Harris 2007); the Gulf <strong>of</strong> Ma<strong>in</strong>e (CLF/WWF 2006); the Irish Sea (V<strong>in</strong>cent et al.<br />
2004), <strong>and</strong> the Baltic Sea (Al-Hamdani et al. 2007). In the UK, four ma<strong>in</strong> categories <strong>of</strong> seascape<br />
types (or mar<strong>in</strong>e l<strong>and</strong>scapes) have been def<strong>in</strong>ed (Connor et al. 2006). These are:<br />
1.) Coastal (physiographic) features, such as fjords <strong>and</strong> estuaries, where the seabed <strong>and</strong> water<br />
body are closely <strong>in</strong>terl<strong>in</strong>ked.<br />
2.) Topographic <strong>and</strong> bed-form features, occurr<strong>in</strong>g away from the coast <strong>and</strong> form<strong>in</strong>g dist<strong>in</strong>ct<br />
raised or deepened features <strong>of</strong> the seabed at various scales;<br />
3.) Broad-scale seabed habitats, def<strong>in</strong>ed through model<strong>in</strong>g <strong>and</strong> broadly equivalent to EUNIS<br />
higher level habitat classes;<br />
17
4.) Water column [pelagic] features <strong>of</strong> open sea areas, such as mixed <strong>and</strong> stratified water<br />
bodies <strong>and</strong> frontal systems.<br />
<strong>1.10</strong>.2.2 Seascapes <strong>of</strong> the Baltic Sea<br />
Classified maps represent<strong>in</strong>g benthic seascapes (also referred to as benthic mar<strong>in</strong>e<br />
l<strong>and</strong>scapes) were developed to <strong>in</strong>crease the cost-efficiency <strong>of</strong> data collection <strong>and</strong> <strong>in</strong>tegration <strong>in</strong><br />
the Baltic Sea <strong>and</strong> to identify essential fish habitats <strong>and</strong> other important conservation areas for<br />
the implementation <strong>of</strong> the EU Habitats Directive (Reijonen et al. 2008). Seascapes were<br />
classified us<strong>in</strong>g: 1.) physiographic mar<strong>in</strong>e features <strong>of</strong> the coast (7 classes); 2.) topographic<br />
features <strong>of</strong> the seabed (18 classes) (Figure 3), <strong>and</strong> 3.) 60 ecologically relevant benthic seascapes<br />
based on <strong>in</strong>tegrated data on sal<strong>in</strong>ity, sediments <strong>and</strong> photic depth (see Al-Hamdani <strong>and</strong> Reker<br />
2007). These maps have provided a basemap on habitat <strong>and</strong> seascape patterns to support<br />
implementation <strong>of</strong> ecosystem-based management <strong>in</strong> the region. At the sub-regional level the<br />
maps are expected to provide a useful tool <strong>in</strong> develop<strong>in</strong>g <strong>in</strong>tegrated solutions for nature<br />
conservation <strong>and</strong> susta<strong>in</strong>able fisheries, <strong>coastal</strong> development, transport <strong>and</strong> other uses. Several<br />
regional authorities are us<strong>in</strong>g the maps <strong>in</strong> fisheries restoration <strong>and</strong> management plans <strong>and</strong> <strong>in</strong> the<br />
design <strong>and</strong> zonation <strong>of</strong> MPAs. To further characterize the complexity <strong>of</strong> the environment, a<br />
classified map <strong>of</strong> habitat heterogeneity (1 x 1 km 2 grid cells) was quantified from summed<br />
classes derived from variability <strong>in</strong> depth, wave exposure <strong>and</strong> shorel<strong>in</strong>e complexity to provide a<br />
surrogate for biodiversity <strong>and</strong> classes were validated with <strong>in</strong> situ biological datasets (Figure 4).<br />
Although the <strong>in</strong>itial efforts were focused on characteriz<strong>in</strong>g benthic structure, the development <strong>of</strong><br />
pelagic seascapes similar to those developed for the Scotian Shelf are also be<strong>in</strong>g exam<strong>in</strong>ed.<br />
18
<strong>1.10</strong>.2.3 Australian Coastal Classifications<br />
OzCoasts which developed from OzEstuaries was <strong>in</strong>itiated by the Australian National<br />
L<strong>and</strong> <strong>and</strong> Water Resources Audit (NLWRA) from the recognized need for a more strategic data<br />
collection to ensure that <strong>in</strong>formation <strong>and</strong> data were accessible, collated <strong>and</strong> provided to all levels<br />
<strong>of</strong> government <strong>and</strong> the community. Consequently, the first national classification schemes<br />
perta<strong>in</strong><strong>in</strong>g to the condition <strong>and</strong> geomorphology <strong>of</strong> estuaries were created (Harris et al. 2002).<br />
Australian estuaries were classified <strong>in</strong>to six sub-classes based on the wave-, tide-, <strong>and</strong> river<br />
power that shaped them: wave- <strong>and</strong> tide-dom<strong>in</strong>ated deltas, wave- <strong>and</strong> tide-dom<strong>in</strong>ated estuaries,<br />
str<strong>and</strong> pla<strong>in</strong>s <strong>and</strong> tidal creeks (Dalrymple et al. 1992, Harris <strong>and</strong> Heap 2003). The data <strong>in</strong>dicated<br />
that tidal flats were the most common <strong>coastal</strong> depositional environment <strong>in</strong> Australia (n = 273),<br />
followed by wave-dom<strong>in</strong>ated estuaries (n = 145), tide-dom<strong>in</strong>ated estuaries (n = 99), wavedom<strong>in</strong>ated<br />
deltas (n = 81), tide-dom<strong>in</strong>ated deltas (n = 69), str<strong>and</strong> pla<strong>in</strong>s (n = 43), <strong>and</strong> lagoons (n<br />
= 11). The spatial distribution <strong>of</strong> these environments around the coast exhibited a dist<strong>in</strong>ct<br />
zonation, such that five major <strong>coastal</strong> regions were identified: 1.) southeast coast; 2.) southwest<br />
coast; 3.) northwest coast; 4.) Gulf <strong>of</strong> Carpentaria coast; 5.) <strong>and</strong> northeast coast (Harris et al.<br />
2002).<br />
The condition <strong>and</strong> geomorphic classification schemes are a widely used source <strong>of</strong><br />
contextual <strong>in</strong>formation on estuaries. Two additional <strong>classifications</strong> developed for the Australian<br />
<strong>coastal</strong> classification effort <strong>in</strong>clude the National Intertidal/Sub-tidal Benthic (NISB) Habitat<br />
Classification scheme (Mount et al., 2008), <strong>and</strong> a National Coastal L<strong>and</strong>form <strong>and</strong> Stability map<br />
<strong>in</strong> segmented l<strong>in</strong>e format (Sharples et al. 2009). The NISB Classification Scheme was developed<br />
as part <strong>of</strong> a collaborative project between the NLWRA (phase II; 2002-08) <strong>and</strong> the Federal<br />
19
Government Department <strong>of</strong> Climate Change <strong>in</strong> order to support an <strong>in</strong>itial vulnerability<br />
assessment for the whole <strong>of</strong> the Australian coastl<strong>in</strong>e, <strong>and</strong> to contribute to the development <strong>of</strong><br />
mar<strong>in</strong>e ‘ecoregions’ or bioregional subregions. Before NISB, there was no consistently-classified<br />
habitat mapp<strong>in</strong>g <strong>of</strong> the entire Australian coastl<strong>in</strong>e, except at very broad scales that were not <strong>of</strong><br />
practical use <strong>in</strong> a <strong>coastal</strong> vulnerability assessment. The NISB habitat classes <strong>in</strong>clude: mangroves,<br />
saltmarsh, seagrass, macroalgae, coral reef, rock-dom<strong>in</strong>ated, sediment-dom<strong>in</strong>ated <strong>and</strong> filter<br />
feeders (such as sponges). These habitats occur between the approximate position <strong>of</strong> the highest<br />
astronomical tide mark <strong>and</strong> the location <strong>of</strong> the outer limit <strong>of</strong> the photic benthic zone (usually at<br />
the 50 to 70 meter depth contour). High spatial resolution polygons with thematic attributes<br />
based on NISB are also available <strong>in</strong> Ozcoasts, together with national, state <strong>and</strong> regional summary<br />
maps for each habitat (Figure 5). The NISB Classification Scheme has been adopted as a<br />
st<strong>and</strong>ard by S<strong>in</strong>clair Knight Mertz, one <strong>of</strong> Australia’s largest environmental consult<strong>in</strong>g<br />
companies. In addition, it will be used by the CSIRO climate adaptation branch <strong>in</strong> the <strong>coastal</strong><br />
version <strong>of</strong> their Impacts <strong>of</strong> Climate Change on Australian Mar<strong>in</strong>e Life studies (Hobday et al.,<br />
2006).<br />
Coastal environments can also be classified accord<strong>in</strong>g to levels <strong>of</strong> physical disturbance<br />
from extreme storm events that mobilize <strong>and</strong> transport sediments across the shelf, a characteristic<br />
feature <strong>of</strong> many shelf ecosystems. Research has shown that storms <strong>and</strong> strong currents can cause<br />
widespread sediment erosion <strong>and</strong> deposition, some <strong>of</strong> which can bury or remove seagrasses <strong>and</strong><br />
can cause extensive physical damage to coral reefs (Puot<strong>in</strong>en 2007). Harris (unpublished<br />
manuscript) proposes the development <strong>of</strong> a framework for classify<strong>in</strong>g Australia’s cont<strong>in</strong>ental<br />
shelf relative to disturbance based on a central tenet that biodiversity will be highest at<br />
<strong>in</strong>termediate levels <strong>of</strong> disturbance follow<strong>in</strong>g Connell’s Intermediate Disturbance Hypothesis.<br />
20
Ecological theory predicts that the frequency <strong>and</strong> magnitude <strong>of</strong> disturbance can play a major role<br />
<strong>in</strong> controll<strong>in</strong>g biodiversity (Connell 1978, Pickett <strong>and</strong> White 1985) <strong>and</strong> the distribution <strong>and</strong><br />
quality <strong>of</strong> habitats, thus disturbance regime is an important spatial process <strong>of</strong> relevance to the<br />
management <strong>of</strong> mar<strong>in</strong>e environments. Research worldwide <strong>in</strong>dicates that strategies such as MPA<br />
network design will need to consider the spatial impact <strong>and</strong> return frequencies <strong>of</strong> disturbances, as<br />
well as the biological response <strong>and</strong> recovery. Furthermore, with regard to habitat mapp<strong>in</strong>g, areas<br />
<strong>of</strong> high disturbance may require more frequent habitat mapp<strong>in</strong>g <strong>in</strong> order to ma<strong>in</strong>ta<strong>in</strong> accuracy <strong>in</strong><br />
the distribution <strong>of</strong> habitat types.<br />
<strong>1.10</strong>.2.3.1 Characterization <strong>of</strong> Australia’s southwest coast<br />
In order to protect the biological diversity <strong>of</strong> mar<strong>in</strong>e life <strong>in</strong> Australia’s Exclusive<br />
Economic Zone (EEZ) as designated by the Environmental Protection <strong>and</strong> Biodiversity<br />
Conservation Act (1999), regional mar<strong>in</strong>e plans <strong>and</strong> networks <strong>of</strong> representative mar<strong>in</strong>e protected<br />
areas were developed <strong>in</strong> both regional <strong>and</strong> commonwealth waters (Harris et al. 2007). In the<br />
absence <strong>of</strong> direct <strong>in</strong>formation about the distribution <strong>of</strong> biodiversity, appropriate surrogates were<br />
used <strong>in</strong>stead to characterize environmental heterogeneity. To achieve this for the southwest coast<br />
EEZ (Southwest Plann<strong>in</strong>g Region), Geoscience Australia created maps <strong>of</strong> geomorphological<br />
features <strong>and</strong> <strong>of</strong> different seascape classes us<strong>in</strong>g a statistical classifier <strong>and</strong> then quantified the<br />
variety <strong>of</strong> features <strong>and</strong> seascapes to represent the spatial pattern<strong>in</strong>g <strong>of</strong> biophysical conditions<br />
across the region (Figure 6A). Geomorphological features were identified us<strong>in</strong>g a bathymetry<br />
map <strong>of</strong> 250 m spatial resolution based on features <strong>and</strong> term<strong>in</strong>ology recognized by the<br />
International Hydrographic Organization (IHO). Seascapes were classified from data on water<br />
21
depth, slope, gravel content, mud content, seafloor temperature <strong>and</strong> surface primary productivity<br />
(carbon production per day) (Figure 6B). The derivation <strong>of</strong> classes differed from R<strong>of</strong>f et al.<br />
(2003) for the Scotian Shelf <strong>in</strong> that a statistical algorithm was used to allow the natural breaks <strong>in</strong><br />
the data to def<strong>in</strong>e classes <strong>and</strong> class boundaries (Harris 2007). This approach was also used<br />
successfully for the southeastern region <strong>and</strong> for the national bioregionalization process (DEH<br />
2005). The broad spatial coverage <strong>and</strong> complex spatial pattern<strong>in</strong>g <strong>of</strong> seascapes provided<br />
important complementary <strong>in</strong>formation to the exist<strong>in</strong>g localized knowledge <strong>of</strong> biodiversity <strong>in</strong> the<br />
area. Follow<strong>in</strong>g R<strong>of</strong>f et al. (2003), diversity <strong>of</strong> geomorphological classes <strong>and</strong> the diversity <strong>of</strong><br />
seascape classes were calculated with a slid<strong>in</strong>g analytical w<strong>in</strong>dow <strong>of</strong> 20 km radius <strong>in</strong> GIS (Figure<br />
6C). These layers were created both <strong>in</strong>dividually <strong>and</strong> then summed to create a synthesis map<br />
show<strong>in</strong>g comb<strong>in</strong>ed spatial heterogeneity <strong>in</strong> the biophysical environment to identify potential<br />
biodiversity hotspots <strong>and</strong> possible sites for mar<strong>in</strong>e protected areas.<br />
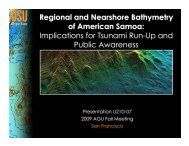
<strong>1.10</strong>.2.4 Mar<strong>in</strong>e Characterization <strong>of</strong> American Samoa<br />
American Samoa is a small west Pacific archipelago <strong>of</strong> five isl<strong>and</strong>s <strong>and</strong> two coral atolls<br />
located approximately 2000 miles south-southwest <strong>of</strong> Hawaii. The ma<strong>in</strong> isl<strong>and</strong> <strong>of</strong> Tutuila hosts<br />
the Fagatele Bay National Mar<strong>in</strong>e Sanctuary (FBNMS) <strong>and</strong> the National Park <strong>of</strong> American<br />
Samoa. Geologically, the isl<strong>and</strong>s are characterized by outcrops <strong>of</strong> basalt <strong>and</strong> limestone, biogenic<br />
<strong>and</strong> volcanic silt, s<strong>and</strong> <strong>and</strong> gravel, calcareous pavements <strong>and</strong> calcareous ooze. The shallow water<br />
habitats are composed primarily <strong>of</strong> fr<strong>in</strong>g<strong>in</strong>g reefs, a few <strong>of</strong>fshore banks, <strong>and</strong> two atolls, host<strong>in</strong>g<br />
an estimated 2,705 species <strong>of</strong> fish, algae, mollusks, <strong>and</strong> corals (Fenner et al. 2008). The fr<strong>in</strong>g<strong>in</strong>g<br />
reefs throughout the territory have been steadily recover<strong>in</strong>g from crown-<strong>of</strong>-thorns starfish<br />
22
outbreaks <strong>in</strong> the late 1970s (Green et al., 1999), as well as from hurricanes <strong>in</strong> 1990, 1991, 2004<br />
<strong>and</strong> 2005. A major coral bleach<strong>in</strong>g event occurred <strong>in</strong> 1994, possibly due to high sea-surface<br />
temperatures from an El Niño.<br />
The territory is currently evaluat<strong>in</strong>g options for <strong>in</strong>creas<strong>in</strong>g the amount <strong>of</strong> mar<strong>in</strong>e<br />
protected areas through a network <strong>of</strong> MPAs. Primary questions have been: (a) What are the<br />
significant deep-water coral reef habitats, relative to the territory’s <strong>coastal</strong> ecology <strong>and</strong> current<br />
<strong>in</strong>itiatives for sanctuary management? (i.e., areas <strong>of</strong> 20% or greater coral cover as m<strong>and</strong>ated for<br />
protection) (b) Where are these critical habitats located, <strong>and</strong> with what major species are they<br />
associated? (c) Which habitats appear to be “biological hotspots” (e.g., areas <strong>of</strong> high<br />
biodiversity), <strong>and</strong> what are the implications for coral reef conservation <strong>and</strong> management? To<br />
support this process Oregon State University, NOAA Biogeography Branch, NOAA National<br />
Undersea Research Program <strong>and</strong> NOAA Coral Reef Ecosystem Division (CRED) have been<br />
characteriz<strong>in</strong>g environmental patterns <strong>and</strong> processes to assist <strong>in</strong> identify<strong>in</strong>g priority areas for<br />
conservation.<br />
Lundblad et al. (2006) used geomorphometrics such as the bathymetric position <strong>in</strong>dex<br />
(BPI) applied to acoustically derived bathymetry to classify the seafloor <strong>in</strong>to dist<strong>in</strong>ct structural<br />
types. The geomorphometrics are based on the hypothesis that many physical <strong>and</strong> biological<br />
processes act<strong>in</strong>g on the benthic seascape may be highly correlated with bathymetric position. In<br />
some cases a species’ habitat may be partially or wholly def<strong>in</strong>ed by the fact it is a hilltop, valley<br />
bottom, exposed ridge, flat pla<strong>in</strong>, upper or lower slope, <strong>and</strong> so forth. Hence, BPI is a measure <strong>of</strong><br />
where a referenced location is relative to the locations surround<strong>in</strong>g it; e.g., a measure <strong>of</strong> where a<br />
po<strong>in</strong>t is <strong>in</strong> the overall l<strong>and</strong>scape or seascape. It is derived from an <strong>in</strong>put bathymetric grid <strong>and</strong> is a<br />
modification <strong>of</strong> the topographic position <strong>in</strong>dex (TPI) algorithm used <strong>in</strong> l<strong>and</strong>scape ecology studies<br />
23
(e.g., Guisan et al., 1999; Jones et al. 2000; Weiss 2001). Positive BPI cell values denote features<br />
or regions that are higher than the surround<strong>in</strong>g area (e.g., ridges). Negative cell values denote<br />
features or regions that are lower than the surround<strong>in</strong>g area (e.g., valleys). BPI values near zero<br />
are either flat areas (where the slope is near zero), or areas <strong>of</strong> constant slope where the slope at<br />
the po<strong>in</strong>t is significantly greater than zero). The relationships between grids derived at f<strong>in</strong>e <strong>and</strong><br />
coarse scales can then be exam<strong>in</strong>ed <strong>and</strong> mapped out as a f<strong>in</strong>al terra<strong>in</strong> classification map us<strong>in</strong>g an<br />
algorithm developed by the user through the creation <strong>of</strong> a classification dictionary (Figure 7).<br />
The <strong>in</strong>tegration <strong>of</strong> <strong>in</strong> situ diver surveys (Bra<strong>in</strong>ard et al., 2008), <strong>and</strong> submersible dives (Wright et<br />
al., 2005, 2006) with bathymetric characteristics is ref<strong>in</strong><strong>in</strong>g the development <strong>of</strong> classified benthic<br />
habitat maps for the region.<br />
Hogrefe (2008) developed a geomorphological classification <strong>of</strong> both the terrestrial isl<strong>and</strong><br />
<strong>and</strong> surround<strong>in</strong>g seafloor terra<strong>in</strong> to def<strong>in</strong>e mar<strong>in</strong>e-terrestrial units based on watershed hydrology<br />
<strong>and</strong> catchment characteristics. The approach employs analysis tools associated with the Arc<br />
Hydro data model (Maidment, 2002) to derive dra<strong>in</strong>age patterns from watersheds <strong>and</strong> affiliated<br />
catchments around the isl<strong>and</strong>, which were then used to identify contiguous mar<strong>in</strong>e/terrestrial<br />
units (Figure 8). Spatiotemporal correlation analyses <strong>of</strong> population density <strong>and</strong> coral reef health<br />
<strong>in</strong>dices with<strong>in</strong> each <strong>of</strong> the mar<strong>in</strong>e/terrestrial bas<strong>in</strong>s revealed a decl<strong>in</strong>e <strong>in</strong> coral reef health<br />
associated with <strong>in</strong>creased population density. The model was then used to identify mar<strong>in</strong>e areas<br />
with long-term monitor<strong>in</strong>g sites that were most at risk from development <strong>in</strong> the watershed.<br />
The seamless l<strong>and</strong>-sea <strong>coastal</strong> terra<strong>in</strong> model provided geomorphological detail <strong>of</strong><br />
sufficient resolution <strong>and</strong> accuracy to enhance the study <strong>of</strong> ecosystem <strong>in</strong>terconnectivity <strong>and</strong> the<br />
effects <strong>of</strong> anthropogenic <strong>in</strong>puts to coral reef habitats. The American Samoa examples underscore<br />
the utility <strong>of</strong> mapp<strong>in</strong>g from “ridge to reef” (i.e., the connectivity between upl<strong>and</strong> watersheds,<br />
24
<strong>in</strong>tertidal zones, <strong>and</strong> shallow <strong>coastal</strong> areas <strong>in</strong>clud<strong>in</strong>g reefs), where <strong>of</strong>fshore classification<br />
categories must be <strong>in</strong>tegrated with those for wetl<strong>and</strong> <strong>and</strong> <strong>in</strong>tertidal regions (e.g., Heyman <strong>and</strong><br />
Kjerfve, 1999; Wright <strong>and</strong> Heyman, 2008; Hogrefe 2008).<br />
<strong>1.10</strong>.3 SPATIAL CONSERVATION PRIORITIZATION AND EVALUATION<br />
With <strong>in</strong>creas<strong>in</strong>g human pressure on the mar<strong>in</strong>e environment <strong>and</strong> a chang<strong>in</strong>g global<br />
climate, the efficient <strong>and</strong> effective allocation <strong>of</strong> conservation resources is both urgent <strong>and</strong><br />
paramount. Quantitative techniques for the identification <strong>and</strong> prioritization <strong>of</strong> conservation<br />
targets are now be<strong>in</strong>g used widely <strong>in</strong> mar<strong>in</strong>e site prioritization around the world. Mar<strong>in</strong>e<br />
<strong>classifications</strong> are a core component <strong>of</strong> the site prioritization process <strong>and</strong> the success <strong>of</strong> these<br />
techniques is heavily dependent on the type, amount <strong>and</strong> quality <strong>of</strong> biophysical data available.<br />
The analytical approaches can <strong>in</strong>volve a simple scor<strong>in</strong>g, whereby each spatial unit (site, grid cell,<br />
polygon etc.) is scored relative to a set <strong>of</strong> factors (vulnerability, species richness, uniqueness,<br />
etc.) or a more analytically complex complementarity-based approach. Complementarity<br />
approaches utilize algorithms to maximize <strong>in</strong>clusion <strong>of</strong> as many components <strong>of</strong> biodiversity as<br />
possible for a given representativeness target, thus focus<strong>in</strong>g more broadly on collective<br />
properties <strong>of</strong> sets <strong>of</strong> locations to provide optimal scenarios (Ferrier <strong>and</strong> W<strong>in</strong>tle 2009).<br />
Complementarity is important <strong>in</strong> situations where efficient sets <strong>of</strong> plann<strong>in</strong>g units are required<br />
that can both m<strong>in</strong>imize the cost <strong>of</strong> conservation action <strong>and</strong> ensure that all biodiversity features<br />
receive some level <strong>of</strong> protection. The purpose <strong>of</strong> identify<strong>in</strong>g priority areas for biodiversity<br />
conservation is usually to mitigate threat, therefore, <strong>in</strong>corporat<strong>in</strong>g <strong>in</strong>formation on threaten<strong>in</strong>g<br />
25
processes <strong>and</strong> the relative vulnerability <strong>of</strong> features or plann<strong>in</strong>g units is crucial for effective<br />
conservation.<br />
In addition to identify<strong>in</strong>g <strong>and</strong> prioritiz<strong>in</strong>g conservation areas, <strong>classifications</strong> <strong>in</strong> the form<br />
<strong>of</strong> mar<strong>in</strong>e habitat maps provide an unprecedented opportunity to evaluate both the content <strong>and</strong><br />
the gaps <strong>in</strong> an exist<strong>in</strong>g conservation portfolio. Simple spatial analyses applied to habitat maps<br />
can calculate how many <strong>and</strong> how much <strong>of</strong> a seascape type, biotope or geomorphological feature<br />
is <strong>in</strong>cluded with<strong>in</strong> a system <strong>of</strong> mar<strong>in</strong>e protected areas <strong>and</strong> quantify that which falls outside. For<br />
example, Geoscience Australia used the seascape classification <strong>and</strong> location <strong>of</strong> exist<strong>in</strong>g protected<br />
areas to assess efficacy for the Mar<strong>in</strong>e National Park (Green Zones) <strong>of</strong> the Great Barrier Reef<br />
Mar<strong>in</strong>e Park through measures <strong>of</strong> CAR: Comprehensiveness (full range <strong>of</strong> ecosystems),<br />
Adequacy (viability <strong>and</strong> replication <strong>of</strong> ecosystems) <strong>and</strong> Representativeness (biotic diversity<br />
<strong>in</strong>cluded represents each area protected). Analysis <strong>of</strong> the seascapes conta<strong>in</strong>ed <strong>in</strong> the Green Zones<br />
revealed a good level <strong>of</strong> comprehensiveness <strong>and</strong> representativeness, with the full range <strong>of</strong><br />
ecosystems <strong>in</strong>cluded <strong>and</strong> high adequacy, with seven <strong>of</strong> the n<strong>in</strong>e seascapes hav<strong>in</strong>g more than 20%<br />
<strong>of</strong> their area protected (Figure 9).<br />
In New Zeal<strong>and</strong>, Shears et al. (2008) evaluated exist<strong>in</strong>g biogeographic <strong>classifications</strong><br />
us<strong>in</strong>g systematically collected <strong>in</strong> situ mar<strong>in</strong>e community data <strong>and</strong> then developed a new<br />
<strong>in</strong>dependent biogeographic classification. The classification was then used to evaluate the<br />
exist<strong>in</strong>g no-take MPAs to determ<strong>in</strong>e the extent to which bioregions were represented with<strong>in</strong><br />
protected areas. The analysis revealed that ad hoc reserves encompassed only 0.22% <strong>of</strong><br />
territorial waters <strong>and</strong> < 1.5% <strong>of</strong> each bioregion was represented <strong>in</strong> the Nation’s mar<strong>in</strong>e reserves<br />
at the time <strong>of</strong> analysis.<br />
26
<strong>1.10</strong>.3.1 Identify<strong>in</strong>g Priority Conservation Areas <strong>in</strong> the Northwest Atlantic<br />
The mar<strong>in</strong>e waters <strong>of</strong> the Gulf <strong>of</strong> Ma<strong>in</strong>e <strong>and</strong> the Scotian Shelf that span the US <strong>and</strong><br />
Canadian maritime jurisdictions are some <strong>of</strong> the most heavily utilized mar<strong>in</strong>e resources <strong>in</strong> the<br />
world. Management efforts are underway to identify<strong>in</strong>g a network <strong>of</strong> priority areas for<br />
conservation to help balance use, restore mar<strong>in</strong>e ecosystems <strong>and</strong> conserve biodiversity<br />
(WWF/Conservation Law Foundation 2006). To support a comprehensive <strong>and</strong> spatially explicit<br />
approach to site prioritization, maps depict<strong>in</strong>g classes <strong>of</strong> seascapes were developed for both<br />
pelagic <strong>and</strong> benthic realms build<strong>in</strong>g on the approach <strong>of</strong> R<strong>of</strong>f et al. (2003). This classification <strong>and</strong><br />
mapp<strong>in</strong>g work was conducted as a “pro<strong>of</strong> <strong>of</strong> concept” to demonstrate that sufficient data existed<br />
to implement a representative mar<strong>in</strong>e conservation strategy <strong>in</strong> the region. The specific goal was<br />
to identify a network <strong>of</strong> sites that would protect the full range <strong>of</strong> mar<strong>in</strong>e biodiversity by<br />
<strong>in</strong>corporat<strong>in</strong>g representation <strong>of</strong> seascapes as a design criterion. Physical seascapes were<br />
characterized based on a suite <strong>of</strong> endur<strong>in</strong>g <strong>and</strong> recurrent characteristics known to <strong>in</strong>fluence the<br />
distribution <strong>of</strong> species <strong>and</strong> biological communities <strong>in</strong>clud<strong>in</strong>g characteristics <strong>of</strong> the seawater,<br />
composition <strong>of</strong> the seafloor, <strong>and</strong> depth. The use <strong>of</strong> abiotic surrogates was considered to add<br />
stability to the classification through time. In this classification system, each pelagic <strong>and</strong> benthic<br />
seascape was def<strong>in</strong>ed by a unique comb<strong>in</strong>ation <strong>of</strong> characteristics: surface water temperaturesal<strong>in</strong>ity<br />
zone, depth class <strong>and</strong> degree <strong>of</strong> stratification with<strong>in</strong> the pelagic realm, <strong>and</strong> bottom<br />
temperature-sal<strong>in</strong>ity zone, depth class, <strong>and</strong> substrate type <strong>in</strong> the benthic realm. The classes for<br />
each abiotic variable were def<strong>in</strong>ed through a review <strong>of</strong> the literature <strong>and</strong> analysis <strong>of</strong> the data <strong>and</strong><br />
mapped to a grid with 5-m<strong>in</strong>ute (66 km 2 ) cells to create a separate layer for each characteristic. A<br />
multivariate cluster analysis identified zones <strong>of</strong> similar conditions <strong>in</strong> both the benthic <strong>and</strong> pelagic<br />
27
ealms (e.g., temperature-sal<strong>in</strong>ity zones). Each class with<strong>in</strong> a data layer was assigned a unique<br />
code <strong>and</strong> layers were comb<strong>in</strong>ed to create unique seascape types for the benthic <strong>and</strong> pelagic<br />
realms. A total <strong>of</strong> 118 classes <strong>of</strong> benthic seascape <strong>and</strong> 47 classes <strong>of</strong> pelagic seascape were<br />
def<strong>in</strong>ed for the Gulf <strong>of</strong> Ma<strong>in</strong>e (benthic 29, pelagic 14), Scotian Shelf (22 benthic, 14 pelagic) <strong>and</strong><br />
Georges Bank (57 benthic, 19 pelagic). A spatial prioritization analysis was conducted us<strong>in</strong>g<br />
MARXAN (Ball <strong>and</strong> Poss<strong>in</strong>gham 2000) applied to benthic seascapes, pelagic seascapes <strong>and</strong> the<br />
comb<strong>in</strong>ed benthic-pelagic seascapes. The best representative network for benthic seascapes<br />
consisted <strong>of</strong> 29 areas distributed throughout the analysis region cover<strong>in</strong>g approximately 20% <strong>of</strong><br />
each <strong>of</strong> the biogeographic areas. Substrate type had an important <strong>in</strong>fluence on the nature <strong>of</strong> the<br />
benthic seascape layer <strong>and</strong> on the configuration <strong>of</strong> the networks selected by MARXAN. Without<br />
substrate data, the number <strong>of</strong> seascape conservation features decreased from 108 to only 32. Site<br />
prioritization based on both benthic <strong>and</strong> pelagic seascapes was performed to obta<strong>in</strong> a network<br />
that was fully representative <strong>of</strong> mar<strong>in</strong>e habitats. The representative network developed from<br />
seascapes alone was similar to the best network <strong>of</strong> priority areas for conservation based on a far<br />
broader range <strong>of</strong> features <strong>in</strong>clud<strong>in</strong>g exist<strong>in</strong>g conservation priorities, highlight<strong>in</strong>g the value <strong>of</strong> the<br />
abiotic variables as surrogates for biodiversity <strong>and</strong> a cost-effective tool for mar<strong>in</strong>e spatial<br />
management.<br />
<strong>1.10</strong>.3.2 Ecological Valuation Index for the Massachusetts Ocean Plan, USA<br />
Members <strong>of</strong> the Habitat <strong>and</strong> Fisheries Work Groups <strong>of</strong> the Massachussets Ocean<br />
Management Plan developed the concept, methodology, <strong>and</strong> data for an ecological valuation<br />
<strong>in</strong>dex (EVI) to assist <strong>in</strong> identify<strong>in</strong>g <strong>and</strong> protect<strong>in</strong>g special, sensitive, or unique areas as directed<br />
28
y the Massachusetts Oceans Act (2008). The Ecological Valuation Index (EVI) is a numerical <strong>and</strong><br />
spatial representation <strong>of</strong> the <strong>in</strong>tr<strong>in</strong>sic ecological value <strong>of</strong> a particular area, exclud<strong>in</strong>g social <strong>and</strong><br />
economic <strong>in</strong>terests. It was envisioned that the EVI would highlight ecosystem components that<br />
have a particularly high ecological or biological significance <strong>and</strong> play a particular role <strong>in</strong> the<br />
mar<strong>in</strong>e environment, thereby facilitat<strong>in</strong>g comparison between sub-areas <strong>and</strong> provision <strong>of</strong> a<br />
greater-than-usual degree <strong>of</strong> risk aversion <strong>in</strong> spatial plann<strong>in</strong>g activities. Data for four mar<strong>in</strong>e<br />
mammal species, five bird species, five crustacean species, eight mollusk species, <strong>and</strong> 22 fish<br />
species were <strong>in</strong>corporated <strong>in</strong>to the EVI (http://www.env.state.ma.us/eea/mop/draft-v2/draft-v2-<br />
evi.pdf). Individual datasets were then rated accord<strong>in</strong>g to a st<strong>and</strong>ard set <strong>of</strong> ecological criteria<br />
(major contribution to survival/health <strong>of</strong> population, spatial rarity, <strong>and</strong> global <strong>and</strong> regional<br />
importance) (Figure 10). The EVI work group used a score based on a simple scale, creat<strong>in</strong>g a<br />
semi-quantitative scor<strong>in</strong>g system that can be used when data are <strong>in</strong>complete <strong>and</strong> expert judgment<br />
is used. Scor<strong>in</strong>g was b<strong>in</strong>ary with a 1 given if the criterion was met <strong>and</strong> a zero if not <strong>and</strong> all<br />
criteria received equal weight. A data set for each species was given a score for each criterion<br />
<strong>and</strong> the sum <strong>of</strong> the scores was then attributed to the appropriate 250 by 250 m grid cells. Us<strong>in</strong>g<br />
fish <strong>and</strong> <strong>in</strong>vertebrates as an example the follow<strong>in</strong>g species are scored accord<strong>in</strong>g to the ecological<br />
criteria (http://www.env.state.ma.us/eea/mop/draft-v2/draft-v2-evi.pdf ):<br />
1.) Species abundant with<strong>in</strong> the plann<strong>in</strong>g area for which the plann<strong>in</strong>g area plays a<br />
significant role <strong>in</strong> support<strong>in</strong>g the regional population. Atlantic cod populations have<br />
decreased <strong>in</strong> many areas, but they are abundant <strong>in</strong> Massachusetts waters (spatial<br />
distribution = “0”). Waters are vital habitat that support breed<strong>in</strong>g <strong>and</strong> juvenile stages<br />
(major contribution to fitness = “1”).<br />
2.) Species with limited spatial distribution, <strong>in</strong>clud<strong>in</strong>g both numerically rare <strong>and</strong> abundant<br />
species. Octopus are at the edge <strong>of</strong> their critical habitat (spatial distribution criterion =<br />
29
“1”), but the plann<strong>in</strong>g area is not considered <strong>of</strong> vital importance to population viability<br />
<strong>and</strong> the plann<strong>in</strong>g area does not support a major proportion <strong>of</strong> the global or regional<br />
population (major contribution to fitness = “0”).<br />
3.) State listed species <strong>of</strong> concern. Atlantic wolffish is a c<strong>and</strong>idate for the Endangered<br />
Species List. It prefers hard bottom substrata where it guards its nest <strong>and</strong> occurs mostly<br />
along the northern shores <strong>of</strong> Massachusetts. Due to its vulnerability <strong>and</strong> rarity, this<br />
species scored positively for all criteria.<br />
<strong>1.10</strong>.4 OCEAN ZONING AND MARINE SPATIAL PLANNING<br />
Zon<strong>in</strong>g is an important process with<strong>in</strong> mar<strong>in</strong>e spatial plann<strong>in</strong>g (MSP) that has been<br />
greatly facilitated through application <strong>of</strong> a wide range <strong>of</strong> spatial <strong>classifications</strong>. Day (2002)<br />
def<strong>in</strong>ed zon<strong>in</strong>g as “a spatial plann<strong>in</strong>g tool that acts like a town plann<strong>in</strong>g scheme” that “allows<br />
certa<strong>in</strong> activities to occur <strong>in</strong> specified areas but recognises that other <strong>in</strong>compatible activities<br />
should only occur <strong>in</strong> other specially designated areas <strong>and</strong> <strong>in</strong> this way zon<strong>in</strong>g provides areabased<br />
controls <strong>and</strong> separates conflict<strong>in</strong>g uses”. Thus, a zon<strong>in</strong>g plan facilitates the mar<strong>in</strong>e spatial<br />
plann<strong>in</strong>g process by provid<strong>in</strong>g an easily comprehensible way to manage human activities <strong>in</strong><br />
mar<strong>in</strong>e areas. The overarch<strong>in</strong>g goal for both MSP <strong>and</strong> zon<strong>in</strong>g is to ensure that the objectives <strong>of</strong><br />
mar<strong>in</strong>e areas, resources, ecosystem services <strong>and</strong> nature conservation are met. The Great Barrier<br />
Reef Mar<strong>in</strong>e Park (GBRMP) Zon<strong>in</strong>g represents the largest <strong>and</strong> most complex application <strong>of</strong><br />
systematic conservation plann<strong>in</strong>g pr<strong>in</strong>ciples (Fern<strong>and</strong>es et al. 2005) <strong>and</strong> has a bioregions<br />
classification at its core. In fact, the GBRMP zon<strong>in</strong>g plan itself is a spatial classification us<strong>in</strong>g<br />
30
eight color coded zones to provide multiple levels <strong>of</strong> protection <strong>and</strong> conservation rang<strong>in</strong>g from a<br />
general use zone to a no-take preservation zone (Figure 9).<br />
In the Baltic Sea region <strong>of</strong> northern Europe, the BALANCE project (Baltic Sea<br />
Management – Nature Conservation <strong>and</strong> Susta<strong>in</strong>able Development <strong>of</strong> the Ecosystem through<br />
Spatial Plann<strong>in</strong>g) for the Baltic Sea MSP <strong>in</strong>itiative states that coherent ecological <strong>in</strong>formation is<br />
<strong>in</strong>cluded as a basic layer along with human use <strong>and</strong> activities, <strong>and</strong> thus helps to m<strong>in</strong>imize the<br />
impact on the environment (BALANCE, 2008). The BALANCE project recognizes that no<br />
mar<strong>in</strong>e zon<strong>in</strong>g or spatial plann<strong>in</strong>g should be done on a “blue background” or with a simple<br />
navigational chart for guidance. Instead, bathymetry <strong>and</strong> biotope maps should be considered as<br />
the “aerial photographs <strong>of</strong> the sea”.<br />
<strong>1.10</strong>.4.1 Mar<strong>in</strong>e Spatial Plann<strong>in</strong>g <strong>in</strong> the Baltic<br />
The Baltic Sea supports many human uses <strong>in</strong>clud<strong>in</strong>g commercial <strong>and</strong> leisure activities<br />
such as dredg<strong>in</strong>g, fisheries, tourism, <strong>coastal</strong> development plac<strong>in</strong>g <strong>in</strong>creas<strong>in</strong>g pressures on<br />
vulnerable mar<strong>in</strong>e habitats <strong>and</strong> resources. To resolve resource conflicts <strong>and</strong> address the lack <strong>of</strong><br />
<strong>in</strong>tegrated management plann<strong>in</strong>g, an ecosystem-based approach to management, based on<br />
transnational spatial plann<strong>in</strong>g is be<strong>in</strong>g implemented. An EC funded project BALANCE (Baltic<br />
Sea Management – Nature Conservation <strong>and</strong> Susta<strong>in</strong>able Development <strong>of</strong> the Ecosystem through<br />
Spatial Plann<strong>in</strong>g) developed a pilot zon<strong>in</strong>g plan for the densely populated <strong>coastal</strong> areas near<br />
Stockholm <strong>in</strong> Sweden. The area is important for navigational <strong>and</strong> recreational activities, near<br />
shore fish<strong>in</strong>g, s<strong>and</strong> extraction activities <strong>and</strong> <strong>of</strong>fshore w<strong>in</strong>d-farms. The objective <strong>of</strong> the draft<br />
zon<strong>in</strong>g map was primarily to document present uses <strong>and</strong> regulations <strong>in</strong> a spatially explicit format,<br />
31
<strong>in</strong>clud<strong>in</strong>g important shipp<strong>in</strong>g channels, restricted military zones <strong>and</strong> exclusive uses (e.g., w<strong>in</strong>d<br />
farms) <strong>and</strong> nature conservation areas (Natura 2000 sites, national parks, seal sanctuaries etc.).<br />
Potential sites for future fish farms, <strong>of</strong>fshore w<strong>in</strong>d-farms <strong>and</strong> nature conservation areas were<br />
selected us<strong>in</strong>g the decision support tool Marxan <strong>and</strong> <strong>in</strong>corporated <strong>in</strong>to the zon<strong>in</strong>g plan. The<br />
selected sites were complementary to the already designated Natura 2000 SACs (“locked <strong>in</strong>”<br />
plann<strong>in</strong>g units), <strong>and</strong> together formed a representative sample <strong>of</strong> all the mar<strong>in</strong>e l<strong>and</strong>scape types<br />
<strong>and</strong> important habitats. Sites that were found unsuitable for MPA designation, such as areas with<br />
a high level <strong>of</strong> threat or several conflict<strong>in</strong>g <strong>in</strong>terests, were avoided when equal conservation<br />
values could be found elsewhere. Comb<strong>in</strong><strong>in</strong>g classified maps with a decision support tool such as<br />
Marxan <strong>in</strong> the selection <strong>of</strong> c<strong>and</strong>idate sites for conservation will <strong>in</strong>crease the likelihood that the<br />
selected sites fulfill the whole range <strong>of</strong> predef<strong>in</strong>ed ecological <strong>and</strong> socio-economic targets <strong>in</strong> the<br />
most suitable locations while simultaneously secur<strong>in</strong>g a spatially efficient design <strong>of</strong> the network<br />
(Ekebom et al. 2008). The orig<strong>in</strong>al zon<strong>in</strong>g map was improved by <strong>in</strong>clud<strong>in</strong>g some <strong>of</strong> the Marxan<br />
suggestions to the map, lead<strong>in</strong>g to a more efficient <strong>and</strong> consistent zon<strong>in</strong>g scheme (Figure 11). As<br />
a result, some targeted management zone areas were exp<strong>and</strong>ed by <strong>in</strong>clud<strong>in</strong>g new “selected<br />
plann<strong>in</strong>g unit” sites. Also, a potential fish spawn<strong>in</strong>g area, <strong>in</strong>itially def<strong>in</strong>ed as a targeted<br />
management zone, was relocated to an area which also was selected as a potential c<strong>and</strong>idate for<br />
protection by Marxan.<br />
<strong>1.10</strong>.4.2 Multiple-Use Zon<strong>in</strong>g <strong>in</strong> the Irish Sea, UK<br />
In 1999, the Irish Sea Pilot was <strong>in</strong>itiated to exam<strong>in</strong>e the feasibility <strong>of</strong> beg<strong>in</strong>n<strong>in</strong>g<br />
systematic <strong>and</strong> coord<strong>in</strong>ated mar<strong>in</strong>e spatial plann<strong>in</strong>g <strong>in</strong> the UK. The Irish Sea was selected as an<br />
32
appropriate place to <strong>in</strong>vestigate feasibility <strong>of</strong> MSP as it experiences a wide range <strong>of</strong> human uses<br />
that compete for space <strong>and</strong> exhibits a very complex mosaic <strong>of</strong> management activities,<br />
jurisdictions <strong>and</strong> legal mechanisms (Boyes et al. 2007). Uses <strong>in</strong>cluded aggregate extraction,<br />
archaeology, dredg<strong>in</strong>g <strong>and</strong> dredge disposal, military activities, nature conservation, oil <strong>and</strong> gas<br />
exploration, ports <strong>and</strong> harbors, recreation, sea fisheries, shipp<strong>in</strong>g, submar<strong>in</strong>e cables <strong>and</strong><br />
pipel<strong>in</strong>es, <strong>and</strong> w<strong>in</strong>d farm developments.<br />
Based on the jurisdictional area, a zon<strong>in</strong>g map <strong>of</strong> the Irish Sea was proposed which<br />
def<strong>in</strong>ed zones where types <strong>of</strong> multiple-use, exclusive use or partial use policies applied. As a<br />
feasibility study, the zon<strong>in</strong>g scheme was not <strong>in</strong>tended to be an objective-based comprehensive<br />
multiple-use zon<strong>in</strong>g scheme for this regional sea. The proposed zones (Figure 12) from the least<br />
to highest protection were: Zone 1. General use zone with two subzones: Zone 1A. M<strong>in</strong>imal<br />
Management (MM) <strong>and</strong> Zone 1B. Targeted Management (TM); Zone 2. Conservation Priority<br />
Zone (CPZ); Zone 3. Exclusion Zone (EZ) with sub-zones <strong>of</strong> Zone 3A. Limited Exclusion (LE)<br />
<strong>and</strong> Zone 3B. Significant Exclusion (SE) <strong>and</strong> Zone 4. Protected Zone (PZ) (def<strong>in</strong>ed <strong>in</strong> Boyes et<br />
al. 2007). The proposed zon<strong>in</strong>g scheme was then tested aga<strong>in</strong>st the Irish Sea Pilot’s collated data<br />
on protected areas, seascapes <strong>and</strong> features (habitats <strong>and</strong> species) <strong>of</strong> national importance. The<br />
extent <strong>of</strong> exist<strong>in</strong>g protected areas designated <strong>in</strong> the UK under the Habitats <strong>and</strong> Species Directive<br />
(SACs) <strong>and</strong> Wild Birds Directive (SPAs) <strong>and</strong> Mar<strong>in</strong>e Nature Reserves (mostly nearshore sites)<br />
have been used to identify the location <strong>of</strong> important natural resources that are priorities for<br />
protection. The mar<strong>in</strong>e mapp<strong>in</strong>g project is a partnership <strong>in</strong>itiative <strong>of</strong> the Jo<strong>in</strong>t Nature<br />
Conservation Committee (JNCC) to provide seascape maps for the UK Sea area (Connor et al.<br />
2006), <strong>in</strong>clud<strong>in</strong>g all waters out to 200 nm. Seascapes <strong>in</strong>cluded benthic <strong>and</strong> pelagic classes <strong>and</strong><br />
the five rarest seascapes were used to evaluate the proposed zon<strong>in</strong>g scheme. These <strong>in</strong>cluded gas<br />
33
structures, photic reefs, aphotic reefs, sea mounds <strong>and</strong> deep-water channels. The study<br />
demonstrated that exist<strong>in</strong>g legal mechanisms on which the proposed zon<strong>in</strong>g scheme was based<br />
do not provide adequate protection to important nature conservation features, particularly the<br />
rare seascapes with<strong>in</strong> the Irish Sea. In fact, most nature conservation sites actually function as<br />
multi-use areas <strong>and</strong> the highest levels <strong>of</strong> protection occur <strong>in</strong> sites designated for sectoral use, but<br />
with str<strong>in</strong>gent regulatory measures (e.g., Military areas). Us<strong>in</strong>g the seascape maps, the analysis<br />
highlighted visually <strong>and</strong> descriptively the extent to which the exist<strong>in</strong>g plann<strong>in</strong>g <strong>and</strong> governance<br />
framework is able, or unable, to meet the <strong>in</strong>creas<strong>in</strong>g pressures <strong>of</strong> activities <strong>and</strong> developments<br />
with<strong>in</strong> the mar<strong>in</strong>e environment. The study recommended, a network <strong>of</strong> areas be designed that<br />
<strong>in</strong>clude representation <strong>of</strong> all seascape types, <strong>and</strong> <strong>in</strong> which the conservation requirements <strong>of</strong> the<br />
important features <strong>in</strong>form the decision mak<strong>in</strong>g. This study highlighted the need for <strong>in</strong>formationbased<br />
del<strong>in</strong>eation <strong>of</strong> conservation priority areas needs to be an <strong>in</strong>tegral component <strong>of</strong> mar<strong>in</strong>e<br />
spatial plann<strong>in</strong>g.<br />
Mar<strong>in</strong>e Spatial Plann<strong>in</strong>g will be <strong>in</strong>troduced nationally across UK waters under the Mar<strong>in</strong>e<br />
<strong>and</strong> Coastal Access Act which came <strong>in</strong>to force <strong>in</strong> 2009. The Act (<strong>and</strong> similar legislation <strong>in</strong><br />
Scotl<strong>and</strong>) additionally requires the development <strong>of</strong> a network <strong>of</strong> mar<strong>in</strong>e protected areas. To<br />
support both <strong>of</strong> these <strong>in</strong>itiatives, the mar<strong>in</strong>e maps prepared <strong>in</strong> 2006 for UKSeaMap (Connor et al.<br />
2006) have been updated, us<strong>in</strong>g improved data sets <strong>and</strong> model<strong>in</strong>g techniques creat<strong>in</strong>g two maps<br />
cover<strong>in</strong>g all UK waters:<br />
• A modeled map <strong>of</strong> EUNIS habitats (at EUNIS level 3 or 4), based on substratum,<br />
bathymetry, light penetration, wave <strong>and</strong> current energy, temperature data layers<br />
• A seascapes map (sensu stricto), encompass<strong>in</strong>g <strong>coastal</strong> features, <strong>of</strong>fshore topographic<br />
features <strong>and</strong> pla<strong>in</strong>s.<br />
34
<strong>1.10</strong>.4.3 Massachusetts Ocean Plan<br />
The State <strong>of</strong> Massachusetts directed by The Massachusetts Oceans Act <strong>of</strong> 2008 has<br />
developed a comprehensive mar<strong>in</strong>e spatial management plan to serve as the basis for the<br />
protection <strong>and</strong> susta<strong>in</strong>able use <strong>of</strong> the State’s ocean <strong>and</strong> <strong>coastal</strong> waters (Massachusetts Ocean<br />
Management Plan, 2009). The ocean plan addresses four goals: 1.) balance <strong>and</strong> protect the<br />
natural, social, cultural, historic, <strong>and</strong> economic <strong>in</strong>terests <strong>of</strong> the mar<strong>in</strong>e ecosystem through<br />
<strong>in</strong>tegrated management; 2.) recognize <strong>and</strong> protect biodiversity, ecosystem health, <strong>and</strong> the<br />
<strong>in</strong>terdependence <strong>of</strong> ecosystems; 3.) support wise use <strong>of</strong> mar<strong>in</strong>e resources, <strong>in</strong>clud<strong>in</strong>g renewable<br />
energy, susta<strong>in</strong>able uses, <strong>and</strong> <strong>in</strong>frastructure; <strong>and</strong> 4.) <strong>in</strong>corporate new knowledge as the basis for<br />
management that adapts over time to address chang<strong>in</strong>g social, technological, <strong>and</strong> environmental<br />
conditions (Massachusetts Ocean Management Plan, 2009). The ocean plan established three<br />
categories <strong>of</strong> management area: 1.) Prohibited, 2.) Regional Energy, <strong>and</strong> 3.) Multi-Use. The<br />
Prohibited Area is a specific area where most uses, activities <strong>and</strong> facilities are expressly<br />
prohibited by the Ocean Sanctuaries Act, as amended by the Oceans Act. Renewable Energy<br />
Areas are places specifically designated for commercial w<strong>in</strong>d energy facilities, <strong>in</strong> recognition <strong>of</strong><br />
the need to provide opportunity for renewable energy generation at a mean<strong>in</strong>gful scale, but to do<br />
so with careful regard for potential environmental impacts. The Multi-use Area is the rema<strong>in</strong>der<br />
(<strong>and</strong> majority) <strong>of</strong> the ocean plann<strong>in</strong>g area, where uses, activities <strong>and</strong> facilities allowed by the<br />
Ocean Sanctuaries Act are managed based on sit<strong>in</strong>g <strong>and</strong> performance st<strong>and</strong>ards (associated with<br />
specific mapped resources <strong>and</strong> uses) that direct development away from high value resources <strong>and</strong><br />
concentrations <strong>of</strong> exist<strong>in</strong>g water-dependent uses.<br />
35
To support plan development, best available spatial data were reviewed <strong>and</strong> compiled by<br />
work<strong>in</strong>g groups under six major themes <strong>in</strong>clud<strong>in</strong>g habitat; fisheries; transportation, navigation<br />
<strong>and</strong> <strong>in</strong>frastructure; sediment; recreation <strong>and</strong> cultural services <strong>and</strong> renewable energy. The data<br />
layers used are catalogued <strong>in</strong> MORIS, the Massachusetts Ocean Resource Information System<br />
(available at www.mass.gov/czm/mapp<strong>in</strong>g/<strong>in</strong>dex.htm). The work<strong>in</strong>g groups compiled a basel<strong>in</strong>e<br />
assessment to <strong>in</strong>ventory <strong>and</strong> spatially describe the physical characteristics, natural communities,<br />
<strong>and</strong> human <strong>in</strong>teractions with<strong>in</strong> the plann<strong>in</strong>g area. Special, sensitive or unique areas (SSU) were<br />
del<strong>in</strong>eated based on endangered species <strong>of</strong> cetacean <strong>and</strong> seabirds, areas <strong>of</strong> topographically<br />
complex seafloor, important areas for commercial <strong>and</strong> recreational fisheries, <strong>in</strong>tertidal flats <strong>and</strong><br />
seagrass beds. For large cetaceans, core habitat was classified for North Atlantic right whale, f<strong>in</strong><br />
whale <strong>and</strong> humpback whale. Areas <strong>of</strong> core whale habitat were represented as concentrations <strong>in</strong><br />
abundance based on sight<strong>in</strong>gs datasets compiled <strong>and</strong> analyzed by NOAA’s National Centers for<br />
Coastal Ocean Science report for the years 1970-2005 <strong>in</strong> the southern Gulf <strong>of</strong> Ma<strong>in</strong>e (NCCOS<br />
2006, Pittman <strong>and</strong> Costa 2010). Bias from uneven allocation <strong>of</strong> survey effort (temporally or<br />
spatially) was corrected us<strong>in</strong>g a sight<strong>in</strong>g-per-unit-effort (SPUE) algorithm. SPUE values for each<br />
5 x 5 m<strong>in</strong>ute grid cell were then <strong>in</strong>terpolated spatially <strong>and</strong> classified <strong>in</strong>to five relative abundance<br />
classes, <strong>and</strong> the top two classes were extracted by the Massachusetts Ocean Management Plan<br />
team to represent “core” habitat for each <strong>of</strong> these three species. The core areas where then used<br />
to determ<strong>in</strong>e potential conflicts (via spatial overlap) with other uses such as pipel<strong>in</strong>es, cables,<br />
renewable energy, s<strong>and</strong> <strong>and</strong> gravel extraction, boat<strong>in</strong>g <strong>and</strong> shipp<strong>in</strong>g <strong>and</strong> recreational <strong>and</strong><br />
commercial fisheries.<br />
<strong>1.10</strong>.5 ECOSYSTEM-BASED FISHERIES MANAGEMENT<br />
36
One <strong>of</strong> the foundational concepts underly<strong>in</strong>g the ecosystem approach to fisheries<br />
management is that different geographic areas have different biological production capacities<br />
<strong>and</strong> these are <strong>in</strong>terl<strong>in</strong>ked with the spatial heterogeneity <strong>of</strong> ecological patterns <strong>and</strong> processes<br />
<strong>in</strong>clud<strong>in</strong>g human activity. This requires management strategies that can <strong>in</strong>corporate the<br />
ecological dynamics <strong>in</strong> a spatially explicit framework. One <strong>of</strong> the first steps follow<strong>in</strong>g the<br />
establishment <strong>of</strong> ecosystem-based management (EBM) goals is to characterize the biophysical<br />
habitat features <strong>of</strong> the management area (Cogan et al. 2009). In fisheries management, habitat<br />
mapp<strong>in</strong>g is <strong>in</strong>creas<strong>in</strong>gly utilized to <strong>in</strong>form management with regard to assess<strong>in</strong>g the relative<br />
sensitivity <strong>of</strong> seabed features to the impacts <strong>of</strong> fish<strong>in</strong>g (e.g., bottom trawl<strong>in</strong>g), identify<strong>in</strong>g,<br />
mapp<strong>in</strong>g <strong>and</strong> model<strong>in</strong>g Essential Fish Habitat (EFH) <strong>and</strong> species distributions. In the United<br />
States, the importance <strong>of</strong> classified maps <strong>in</strong> susta<strong>in</strong>able fisheries management was emphasized<br />
by the implementation <strong>of</strong> the National Fish Habitat Action Plan (Association <strong>of</strong> Fish <strong>and</strong><br />
Wildlife Agencies, 2006) which requested habitat mapp<strong>in</strong>g <strong>and</strong> classification as a primary<br />
priority <strong>in</strong> its research plan. In addition, the classification <strong>of</strong> complex spatio-temporal behavioral<br />
patterns <strong>in</strong> fish<strong>in</strong>g activity are required to support a wide range <strong>of</strong> spatial management activities<br />
<strong>in</strong>clud<strong>in</strong>g impact assessment, fleet management, enforcement, spatial characterizations <strong>and</strong><br />
monitor<strong>in</strong>g that are crucial for implementation <strong>of</strong> ecosystem-based fisheries management, MPA<br />
site selection <strong>and</strong> mar<strong>in</strong>e spatial plann<strong>in</strong>g.<br />
<strong>1.10</strong>.5.1 Mapp<strong>in</strong>g Essential Fish Habitat (EFH)<br />
37
In 1996, the U.S. Magnuson-Stevens Act (reauthorized 2006) m<strong>and</strong>ated the identification<br />
<strong>of</strong> essential fish habitat (EFH) for ‘quota’ species. The U.S. Congress def<strong>in</strong>ed EFH as ‘those<br />
waters <strong>and</strong> substrate necessary to fish for spawn<strong>in</strong>g, breed<strong>in</strong>g, feed<strong>in</strong>g, or growth to maturity’, a<br />
def<strong>in</strong>ition that <strong>in</strong>cludes the physical, chemical <strong>and</strong> biological properties <strong>of</strong> mar<strong>in</strong>e areas <strong>and</strong> the<br />
associated sediment <strong>and</strong> biological assemblages that susta<strong>in</strong> fish populations throughout their full<br />
life cycle (DOC, 1997). Habitat Areas <strong>of</strong> Particular Concern (HAPC) are discrete subsets <strong>of</strong> EFH<br />
that provide extremely important ecological functions or are especially vulnerable to degradation<br />
<strong>and</strong> HAPCs can be designated based on: 1) importance <strong>of</strong> the ecological function provided by<br />
the habitat; 2) extent to which the habitat is sensitive to human-<strong>in</strong>duced environmental<br />
degradation; 3) whether, <strong>and</strong> to what extent, development activities are, or will be, stress<strong>in</strong>g the<br />
habitat type, <strong>and</strong> 4) rarity <strong>of</strong> the habitat type. The HAPC <strong>and</strong> EFH designations are classes <strong>of</strong><br />
habitat required to help prioritize conservation efforts <strong>and</strong> more effectively target management<br />
activities. The identification <strong>and</strong> mapp<strong>in</strong>g <strong>of</strong> ecologically mean<strong>in</strong>gful EFH <strong>and</strong> HAPC provides<br />
important spatial <strong>in</strong>formation to support ecosystem-based fisheries management <strong>and</strong> mar<strong>in</strong>e<br />
spatial plann<strong>in</strong>g. Fisheries Management Councils are m<strong>and</strong>ated to <strong>in</strong>clude maps show<strong>in</strong>g the<br />
geographical location <strong>and</strong> extent <strong>of</strong> EFH <strong>and</strong> HAPC <strong>in</strong> management plans <strong>and</strong> identify the<br />
different habitat types designated as EFH. Most mapp<strong>in</strong>g data is unlikely to be able to fully<br />
capture the spatial complexity <strong>of</strong> EFH for most species, particularly for the highly mobile species<br />
typical <strong>of</strong> the commercial fisheries. The conventional approach has been to determ<strong>in</strong>e habitat<br />
associations <strong>and</strong> then to assign equal value to all such habitat types <strong>in</strong> the region. While this<br />
implements a precautionary approach, it does not, however, represent the actual faunal<br />
distribution s<strong>in</strong>ce much <strong>of</strong> the functionally important spatial heterogeneity is rarely <strong>in</strong>corporated<br />
<strong>in</strong> broad scale mapp<strong>in</strong>g used to del<strong>in</strong>eate EFH. Recent work for fish associated with coral reef<br />
38
ecosystems has shown that considerable variability exists with<strong>in</strong> an <strong>in</strong>dividual habitat class<br />
(Harborne et al. 2008). Another approach to mapp<strong>in</strong>g EFH <strong>in</strong>volves quantitative spatial<br />
predictive model<strong>in</strong>g us<strong>in</strong>g the statistical relationship between species <strong>and</strong> a suite <strong>of</strong><br />
environmental variables to extrapolate distributions across space. Benthic habitat data <strong>and</strong><br />
suitability <strong>in</strong>dices <strong>of</strong> relative abundance across environmental gradients are commonly used<br />
with<strong>in</strong> GIS <strong>in</strong> order to develop Habitat Suitability Index (HSI) models (e.g., Rubec et al.,<br />
1998a,b; Brown et al., 2000). HSI models may help predict optimal habitat <strong>and</strong> abundance zones<br />
for various species, therefore aid<strong>in</strong>g managers <strong>in</strong> designat<strong>in</strong>g EFH. Recent advances <strong>in</strong> the field<br />
<strong>of</strong> predictive model<strong>in</strong>g <strong>in</strong>clud<strong>in</strong>g application <strong>of</strong> mach<strong>in</strong>e-learn<strong>in</strong>g algorithms, comb<strong>in</strong>ed with an<br />
<strong>in</strong>crease <strong>in</strong> mapped environmental data <strong>and</strong> GIS has facilitated a boom <strong>in</strong> the development <strong>of</strong><br />
accurate spatial predictions that <strong>of</strong>fer great utility <strong>in</strong> fil<strong>in</strong>g data gaps <strong>and</strong> provid<strong>in</strong>g fundamental<br />
ecological <strong>in</strong>formation to support management (Elith et al. 2006, Leathwick et al. 2008).<br />
Although spatial predictive techniques are more frequently applied to terrestrial ecosystems,<br />
examples have recently emerged for mar<strong>in</strong>e ecosystems primarily focused on species<br />
distributions (Valavanis et al. 2008, Maxwell et al. 2009, Pittman et al. 2009) <strong>and</strong> biodiversity<br />
(Pittman et al. 2007a, Purkis et al. 2008), although they can also equally be used to predict the<br />
distribution <strong>of</strong> abiotic variables <strong>and</strong> biological habitat types.<br />
<strong>1.10</strong>.5.2 Mapp<strong>in</strong>g <strong>and</strong> Classify<strong>in</strong>g Fish<strong>in</strong>g Effort <strong>in</strong> the UK<br />
Fish<strong>in</strong>g is widely considered as one <strong>of</strong> the highest impact <strong>in</strong>dustries on the UK mar<strong>in</strong>e<br />
environment <strong>in</strong> terms <strong>of</strong> its magnitude <strong>and</strong> spatial extent (Jenn<strong>in</strong>gs et al. 2001, D<strong>in</strong>more et al.,<br />
2003; Eastwood et al., 2007). In addition to the removal <strong>of</strong> target-species biomass, ecosystem<br />
39
effects <strong>of</strong> fish<strong>in</strong>g may <strong>in</strong>clude bycatch <strong>and</strong> discard<strong>in</strong>g <strong>of</strong> nontarget fish species, bycatch <strong>of</strong><br />
mar<strong>in</strong>e mammals <strong>and</strong> seabirds, <strong>and</strong> particularly with bottom trawl<strong>in</strong>g, mechanical disturbance<br />
<strong>and</strong> damage to benthic communities. Broad scale assessment <strong>of</strong> fish<strong>in</strong>g impacts requires a<br />
detailed underst<strong>and</strong><strong>in</strong>g <strong>of</strong> the spatial <strong>and</strong> temporal variability <strong>in</strong> fish<strong>in</strong>g pressure across multiple<br />
spatial scales (Jenn<strong>in</strong>gs <strong>and</strong> Cotter 1999, Stelzenmüller et al. 2008, Pederson et al 2009) (Figure<br />
13). Spatial data represent<strong>in</strong>g fish<strong>in</strong>g pressure <strong>and</strong> impacts play a critical role when objectives<br />
are to m<strong>in</strong>imiz<strong>in</strong>g conflict with compet<strong>in</strong>g sectors <strong>and</strong> reduc<strong>in</strong>g the overall economic cost to<br />
fishers <strong>of</strong> any MPA network configuration (Lynch, 2006, Leathwick et al. 2008).<br />
Rarely are the spatial patterns <strong>of</strong> fish<strong>in</strong>g pressure quantitatively mapped <strong>and</strong> analyzed <strong>in</strong><br />
relation to mar<strong>in</strong>e benthic habitats, yet the newly available mar<strong>in</strong>e <strong>classifications</strong> now facilitate<br />
such an approach. For example, Stelzenmüller et al. (2008) calculated the proportion <strong>of</strong> each<br />
seascape class fished, us<strong>in</strong>g a classified seascape map together with fish<strong>in</strong>g vessel locations over<br />
time acquired with a long-term vessel monitor<strong>in</strong>g system (VMS). The results revealed that<br />
seascapes with coarse or mixed sediments <strong>and</strong> weak or moderate tide stress were heavily fished.<br />
Seascapes experienced different <strong>in</strong>tensities <strong>of</strong> fish<strong>in</strong>g pressure depend<strong>in</strong>g on their spatial location<br />
<strong>in</strong> UK <strong>of</strong>fshore waters <strong>and</strong> the regional heterogeneity <strong>of</strong> seascape types (Figure 14). Descriptions<br />
<strong>of</strong> the spatial distribution <strong>of</strong> fish<strong>in</strong>g pressures can also be l<strong>in</strong>ked to the sensitivity <strong>of</strong> the benthic<br />
environments. The patch<strong>in</strong>ess <strong>of</strong> fish<strong>in</strong>g activity, <strong>and</strong> the consistency with which fish<strong>in</strong>g<br />
occurred <strong>in</strong> the same regions year on year provides valuable <strong>in</strong>formation for the selection <strong>of</strong> the<br />
spatial extent <strong>of</strong> mar<strong>in</strong>e plann<strong>in</strong>g units.<br />
<strong>1.10</strong>.5.3 Exam<strong>in</strong><strong>in</strong>g Conflicts between Fish<strong>in</strong>g <strong>and</strong> Conservation <strong>in</strong> the German North Sea<br />
40
In May 2004, Germany was the first EU Member State to nom<strong>in</strong>ate a comprehensive set<br />
<strong>of</strong> 10 Natura 2000 mar<strong>in</strong>e sites to the European Commission, cover<strong>in</strong>g 31.5% <strong>of</strong> its <strong>of</strong>fshore<br />
EEZs <strong>in</strong> the Baltic <strong>and</strong> North Sea (Kraus et al. 2006) (Figure 15). The pr<strong>in</strong>cipal objective <strong>of</strong> sites<br />
selected as part <strong>of</strong> Natura 2000 is to protect biodiversity <strong>and</strong> achieve or ma<strong>in</strong>ta<strong>in</strong> a ‘favourable<br />
conservation status’ <strong>of</strong> habitats <strong>and</strong> species named <strong>in</strong> the EU Birds <strong>and</strong> Habitats directives <strong>and</strong> to<br />
contribute to the implementation <strong>of</strong> the 1992 UN Convention on Biological Diversity. Several <strong>of</strong><br />
the conservation areas overlapped with commercial fish<strong>in</strong>g <strong>in</strong>terests. To exam<strong>in</strong>e the extent <strong>of</strong><br />
potential conflicts between fish<strong>in</strong>g activities <strong>and</strong> nature conservation objectives, Pedersen et al.<br />
(2008) <strong>in</strong>tegrated habitat <strong>classifications</strong>, vessel monitor<strong>in</strong>g data classified by gear type <strong>and</strong><br />
exist<strong>in</strong>g MPA boundaries to support development <strong>of</strong> fishery-management plans for each Natura<br />
2000 (Figure 15). In the German EEZ, only two benthic habitat types, s<strong>and</strong>banks <strong>and</strong> reefs, have<br />
been relevant to the designation process <strong>of</strong> Natura 2000 mar<strong>in</strong>e sites. S<strong>and</strong>banks <strong>and</strong> reefs<br />
perform several important ecological functions, such as <strong>of</strong>fer<strong>in</strong>g protection for rare <strong>and</strong><br />
threatened species, support<strong>in</strong>g unique communities <strong>and</strong> provid<strong>in</strong>g breed<strong>in</strong>g, nursery, feed<strong>in</strong>g, <strong>and</strong><br />
rest<strong>in</strong>g habitats for mar<strong>in</strong>e organism (listed <strong>in</strong> Pedersen et al. 2008). In addition to benthic habitat<br />
<strong>in</strong>formation, fishers behavior was classified <strong>and</strong> mapped us<strong>in</strong>g data from a vessel monitor<strong>in</strong>g<br />
system (VMS). With<strong>in</strong> European seas, fish<strong>in</strong>g vessels >15 m length are required to operate a<br />
satellite-based VMS provid<strong>in</strong>g detailed <strong>in</strong>formation on where fish<strong>in</strong>g vessels operate (every 1-2<br />
hours) <strong>and</strong> effort <strong>and</strong> gear used that can then be l<strong>in</strong>ked to reported catch data. Effort was<br />
classified by boat <strong>and</strong> gear type for registered vessels from Belgium, Denmark, Estonia,<br />
Germany, Latvia, the Netherl<strong>and</strong>s, Pol<strong>and</strong>, Sweden, <strong>and</strong> the United K<strong>in</strong>gdom. Trawlers with<br />
trawl<strong>in</strong>g speeds <strong>of</strong> 5-7 knots (eng<strong>in</strong>e power > 221 kW) were classified as large beam trawlers,<br />
mostly target<strong>in</strong>g sole <strong>and</strong> plaice. Small beam trawlers (≤ 221 kW) known as “Eurocutters”,<br />
41
ma<strong>in</strong>ly target<strong>in</strong>g shrimp, but also sole <strong>and</strong> plaice <strong>in</strong> <strong>of</strong>fshore areas. A third class <strong>of</strong> vessel were<br />
the extra-heavy beam trawlers, documented as vessels that operated on stony ground with heavy<br />
gear <strong>and</strong> an average trawl<strong>in</strong>g speed <strong>of</strong> 4-5 knots. Spatial effort is determ<strong>in</strong>ed largely by gear type<br />
<strong>and</strong> therefore the <strong>in</strong>tensity <strong>of</strong> impacts to Natura 2000 sites <strong>and</strong> associated habitat types are<br />
affected differently by different fish<strong>in</strong>g techniques. For example, <strong>in</strong>tegrat<strong>in</strong>g the habitat map with<br />
VMS data revealed that large beam trawlers avoid operat<strong>in</strong>g <strong>in</strong> reef areas, small beam trawlers<br />
utilize all bottom types (Figure 15), while reefs are targeted by beam trawlers with heavy gear<br />
along with potters <strong>and</strong> whelkers. The f<strong>in</strong>e-scale, spatio-temporal distribution data for the<br />
<strong>in</strong>ternational fish<strong>in</strong>g effort together with spatial <strong>in</strong>formation on the distribution <strong>of</strong> conservation<br />
features <strong>and</strong> MPA boundaries provided a spatially explicit underst<strong>and</strong><strong>in</strong>g <strong>of</strong> potential conflicts<br />
between the fishery <strong>in</strong>dustry <strong>and</strong> conservation. Such <strong>in</strong>formation <strong>of</strong>fered a cost-effective <strong>and</strong><br />
fisheries <strong>in</strong>dependent approach to assess threats <strong>and</strong> design measures to reduce any negative<br />
impacts that could reduce the efficacy <strong>of</strong> conservation strategies.<br />
<strong>1.10</strong>.6 OPTIMIZING ENVIRONMENTAL MONITORING<br />
Classifications <strong>and</strong> associated thematic maps provide a spatial framework with which to<br />
collect, organize, analyze <strong>and</strong> report on chang<strong>in</strong>g environmental conditions. There are several<br />
practical difficulties <strong>in</strong> compar<strong>in</strong>g variables such as biodiversity across different habitats <strong>and</strong><br />
species <strong>in</strong> ecosystems, <strong>and</strong> therefore many ecological studies are conf<strong>in</strong>ed to a limited group <strong>of</strong><br />
species, <strong>in</strong> a restricted habitat, us<strong>in</strong>g a s<strong>in</strong>gle sampl<strong>in</strong>g method. Such narrow approaches are not<br />
satisfactory for environmental management, particularly where there is a need to monitor <strong>and</strong><br />
assess conditions across a broad heterogeneous region. Identification <strong>of</strong> sampl<strong>in</strong>g strata can<br />
42
improve the design <strong>and</strong> <strong>in</strong>terpretation <strong>of</strong> surveys <strong>and</strong> experimental studies. A <strong>coastal</strong><br />
classification <strong>in</strong> the form <strong>of</strong> a map facilitates sampl<strong>in</strong>g across multiple classes, regardless <strong>of</strong><br />
whether classes are habitat types, socio-economic categories or management strata. One <strong>of</strong> the<br />
greatest benefits <strong>of</strong> us<strong>in</strong>g a consistent classification is that the results from surveys <strong>of</strong> one or<br />
more sites can be directly compared with other studies. A classification can thus be an important<br />
st<strong>and</strong>ard <strong>in</strong> environmental assessment, for <strong>in</strong>stance, where an evaluation <strong>of</strong> the nature<br />
conservation status or long-term monitor<strong>in</strong>g <strong>of</strong> sites is required.<br />
The ma<strong>in</strong> goal <strong>of</strong> sample surveys is to obta<strong>in</strong> accurate, high-precision estimates <strong>of</strong><br />
population <strong>and</strong> community metrics at a m<strong>in</strong>imum <strong>of</strong> cost. Maps <strong>of</strong> environmental covariates,<br />
such as benthic habitat, at the appropriate spatial scales <strong>and</strong> spatial extent can be used to<br />
effectively divide the sampled population <strong>in</strong>to strata. Stratified <strong>and</strong> stratified-r<strong>and</strong>om designs can<br />
use mar<strong>in</strong>e habitat <strong>classifications</strong> to optimize sampl<strong>in</strong>g <strong>and</strong> to target priority areas <strong>and</strong> design<br />
comparative monitor<strong>in</strong>g protocols. A stratified-r<strong>and</strong>om design may divide the survey doma<strong>in</strong><br />
<strong>in</strong>to regions <strong>of</strong> relatively homogenous variance called strata <strong>and</strong> then allocate sampl<strong>in</strong>g more<br />
<strong>in</strong>tensively <strong>in</strong> the highly-variable to achieve better estimates than a simple r<strong>and</strong>om design us<strong>in</strong>g<br />
the same sample size. Better estimates <strong>of</strong> a target variable derived from stratified sampl<strong>in</strong>g can<br />
improve model results considerably when survey data are applied <strong>in</strong> species distribution<br />
model<strong>in</strong>g (Hirzel <strong>and</strong> Guisan 2002).<br />
GIS-based tools for allocat<strong>in</strong>g samples can provide a statistically robust, ecologically<br />
mean<strong>in</strong>gful <strong>and</strong> cost-effective approach to design<strong>in</strong>g a sampl<strong>in</strong>g strategy. For example, NOAA’s<br />
Sampl<strong>in</strong>g Design Tool for ArcGIS (Menza <strong>and</strong> F<strong>in</strong>nen 2007) provides a user-friendly process to<br />
develop sampl<strong>in</strong>g strategies with three ways to generate po<strong>in</strong>t samples: simple r<strong>and</strong>om, stratified<br />
43
<strong>and</strong>om <strong>and</strong> multi-stage r<strong>and</strong>om (Figure 16). Ultimately, the choice <strong>of</strong> which method to use<br />
depends on survey objectives <strong>and</strong> the types <strong>of</strong> data available.<br />
<strong>1.10</strong>.7 SPATIAL CHANGE ANALYSIS<br />
The analysis <strong>of</strong> spatial <strong>and</strong> thematic changes based on a comparison <strong>of</strong> classified maps<br />
over time is a logical <strong>and</strong> efficient part <strong>of</strong> ecosystem-based management. A wide range <strong>of</strong> remote<br />
sens<strong>in</strong>g technologies are applied to quantify environmental change, with many applications us<strong>in</strong>g<br />
satellite data due to a high frequency <strong>of</strong> repetitive coverage <strong>and</strong> consistency <strong>in</strong> image<br />
characteristics <strong>and</strong> process<strong>in</strong>g techniques. Coastal change detection studies have <strong>in</strong>volved the use<br />
<strong>of</strong> time series data from a wide range <strong>of</strong> sensors <strong>in</strong>clud<strong>in</strong>g Advanced Very High Resolution<br />
Radiometer (AVHRR), L<strong>and</strong>sat Thematic Mapper (TM), Multispectral Scanner (MSS), SPOT<br />
data, aerial photography <strong>and</strong> airborne laser altimetry. At f<strong>in</strong>er spatial scales, subaquatic change<br />
detection has also been performed us<strong>in</strong>g underwater photography <strong>and</strong> video mosaick<strong>in</strong>g. In<br />
addition to remote sens<strong>in</strong>g techniques, a suite <strong>of</strong> pattern metrics <strong>and</strong> spatial statistics commonly<br />
applied <strong>in</strong> l<strong>and</strong>scape ecology provide techniques to quantify the change <strong>in</strong> l<strong>and</strong>scape or seascape<br />
composition <strong>and</strong> spatial configuration. Whatever the technique used for image acquisition, it is<br />
important that a st<strong>and</strong>ardized classification schema is applied <strong>in</strong> comparative analyses to<br />
ma<strong>in</strong>ta<strong>in</strong> consistency <strong>in</strong> the types <strong>of</strong> classes discrim<strong>in</strong>ated.<br />
<strong>1.10</strong>.7.1 NOAA C-CAP Change Detection<br />
44
NOAA’s CoastWatch Change Analysis Program (C-CAP) uses digital remote sens<strong>in</strong>g<br />
data from L<strong>and</strong>satTM <strong>and</strong> aerial photography together with georeferenced <strong>in</strong> situ measurements<br />
to monitor change <strong>in</strong> <strong>coastal</strong> <strong>in</strong>tertidal areas, wetl<strong>and</strong>s, <strong>and</strong> adjacent upl<strong>and</strong>s at five year<br />
<strong>in</strong>tervals. C-CAP has developed a relatively coarse thematic resolution hierarchical classification<br />
scheme with 15 upl<strong>and</strong> classes <strong>and</strong> 14 wetl<strong>and</strong> classes, primarily to <strong>in</strong>clude key classes that can<br />
be accurately discrim<strong>in</strong>ated from multispectral satellite data (Dobson et al. 1995;<br />
http://www.csc.noaa.gov/crs/lca/tech_cls.html). The <strong>coastal</strong> classification system is a component<br />
<strong>of</strong> the National L<strong>and</strong> Cover Database (NLCD) <strong>and</strong> was designed to be compatible with the U.S.<br />
Geological Survey “L<strong>and</strong> Use <strong>and</strong> L<strong>and</strong> Cover Classification for use with remote sens<strong>in</strong>g data”;<br />
2) the U.S. Fish <strong>and</strong> Wildlife Service “Classification <strong>of</strong> Wetl<strong>and</strong>s <strong>and</strong> Deepwater Habitats <strong>of</strong> the<br />
United States <strong>and</strong> 3) the U.S. Environmental Protection Agency Environmental Monitor<strong>in</strong>g <strong>and</strong><br />
Assessment Program (EMAP) classification system. In addition to depict<strong>in</strong>g the l<strong>and</strong> cover status<br />
for a given po<strong>in</strong>t <strong>in</strong> time, compar<strong>in</strong>g maps from various years documents how l<strong>and</strong> cover<br />
changes over time. With these maps users can exam<strong>in</strong>e how the l<strong>and</strong> cover has changed (e.g.,<br />
from forests to shrubs) <strong>and</strong> the amount <strong>of</strong> change can be easily quantified, as well as the change<br />
<strong>in</strong> spatial pattern<strong>in</strong>g (e.g., fragmentation) <strong>of</strong> <strong>in</strong>dividual l<strong>and</strong> cover classes or entire l<strong>and</strong>scape<br />
units. This <strong>in</strong>formation can be used to better underst<strong>and</strong> the cumulative effects <strong>of</strong> environmental<br />
change, <strong>in</strong>clud<strong>in</strong>g the impacts <strong>of</strong> urban development <strong>and</strong> agriculture on the losses, ga<strong>in</strong>s <strong>and</strong><br />
quality <strong>of</strong> wildlife habitat <strong>and</strong> <strong>in</strong>dicators that l<strong>in</strong>k l<strong>and</strong> cover change with ecosystem health can<br />
be developed <strong>and</strong> evaluated.<br />
<strong>1.10</strong>.7.2 Track<strong>in</strong>g Coastal Habitat Change <strong>in</strong> New Jersey, USA<br />
45
Dur<strong>in</strong>g the last 50 years, development has <strong>in</strong>creased dramatically along Barnegat Bay, a<br />
shallow, lagoon-type estuary located on the coast <strong>of</strong> central New Jersey. The bay <strong>and</strong> its 42 miles<br />
<strong>of</strong> shorel<strong>in</strong>e <strong>of</strong>fer many recreational activities such as boat<strong>in</strong>g, fish<strong>in</strong>g, <strong>and</strong> swimm<strong>in</strong>g. In<br />
addition, the estuary is ecologically important as a breed<strong>in</strong>g ground for oysters, clams, blue<br />
crabs, <strong>and</strong> many other commercially important fish. Increased nutrient load<strong>in</strong>g due to surface<br />
water run<strong>of</strong>f <strong>in</strong> the watershed has occurred as a consequence <strong>of</strong> dramatic l<strong>and</strong>use alteration <strong>and</strong><br />
has impacted the <strong>coastal</strong> ecosystem structure <strong>and</strong> function (Kennish et al. 2007). Change<br />
detection applied to a satellite derived l<strong>and</strong> cover classification from 1972 <strong>and</strong> 1995 (Figure 17)<br />
<strong>and</strong> from 1995 to 2006 quantified the recent rapid conversion <strong>of</strong> forested <strong>and</strong> wetl<strong>and</strong> habitats to<br />
urban l<strong>and</strong> cover ‘developed l<strong>and</strong>’, with riparian zones altered by an average <strong>of</strong> 16% (m<strong>in</strong> 4%<br />
<strong>and</strong> max. 50%) by 2006 (Figure 17) (Lathrop <strong>and</strong> Bognar 2001). L<strong>and</strong>sat Thematic Mapper data<br />
were classified us<strong>in</strong>g an adaptation <strong>of</strong> the NOAA C-CAP protocol (Dobson et al. 1995). The<br />
classification <strong>in</strong>corporated 38 different l<strong>and</strong> cover classes which were <strong>in</strong>tegrated with U.S. Fish<br />
<strong>and</strong> Wildlife Service National Wetl<strong>and</strong> Inventory maps, submerged aquatic vegetation (SAV)<br />
maps, <strong>and</strong> bathymetry derived from the NOAA nautical chart <strong>of</strong> Barnegat Bay to produce a<br />
seamless l<strong>and</strong>-sea habitat map. The result<strong>in</strong>g comprehensive synthesis map comb<strong>in</strong>ed upl<strong>and</strong>,<br />
wetl<strong>and</strong>, <strong>and</strong> the benthic habitats <strong>of</strong> the Barnegat Bay watershed (Lathrop et al. 1999).<br />
<strong>1.10</strong>.7.3 Track<strong>in</strong>g Coastal Habitat Change <strong>in</strong> Louisiana, USA<br />
Change detection for the Louisiana coast us<strong>in</strong>g L<strong>and</strong>sat TM data was conducted for the<br />
Louisiana Coastal Area Comprehensive Coastwide Ecosystem Restoration Study (Barras et al.<br />
2003). Each L<strong>and</strong>sat TM scene covered approximately 185 km by 180 km <strong>and</strong> had a m<strong>in</strong>imum<br />
46
ground resolution <strong>of</strong> 30 m. Each classified pixel <strong>in</strong> the source l<strong>and</strong> <strong>and</strong> water data sets were<br />
compared on a pixel-by-pixel basis to identify the spatial trend <strong>in</strong> the changes. A change pixel<br />
was classified as: (1) l<strong>and</strong> to l<strong>and</strong> = no change, (2) water to water = no change, (3) l<strong>and</strong> to water<br />
= change (loss), or (4) water to l<strong>and</strong> = change (ga<strong>in</strong>) (Barras et al. 2003). The f<strong>in</strong>al classification<br />
showed a net loss <strong>of</strong> wetl<strong>and</strong> <strong>and</strong> significant shorel<strong>in</strong>e erosion between 1990 <strong>and</strong> 2000. Figure 18<br />
shows that the Gulf <strong>of</strong> Mexico shorel<strong>in</strong>e experienced significant loss (150 to 200 m) south <strong>of</strong><br />
Rockefeller Wildlife Refuge due to erosion, but some ga<strong>in</strong>s were detected west <strong>of</strong> Freshwater<br />
Bayou. Analysis <strong>of</strong> a L<strong>and</strong>sat TM scene acquired on October 16, 2002, after the central<br />
Louisiana coast was struck by Hurricane Lili on October 3, 2002, revealed creation <strong>of</strong> over 256.6<br />
ha <strong>of</strong> new ponds <strong>in</strong> a formerly dense healthy marsh that had shown no significant loss s<strong>in</strong>ce the<br />
late 1970s (Barras et al. 2003).<br />
<strong>1.10</strong>.7.4 Mangrove Change Detection <strong>in</strong> Southeast Asia<br />
Mangrove forests are a unique tropical <strong>and</strong> subtropical plant community grow<strong>in</strong>g at the<br />
<strong>in</strong>terface between l<strong>and</strong> <strong>and</strong> sea. Mangrove forests <strong>and</strong> their associated ecosystems are an<br />
important natural resource for people (Barbier et al. 2008) <strong>and</strong> provide critical habitat for a wide<br />
diversity <strong>of</strong> organisms both above <strong>and</strong> below the water (Nagelkerken et al. 2008). The wide<br />
range <strong>of</strong> goods <strong>and</strong> services provided by mangrove forests has been valued at USD 200,000-<br />
900,000 ha -1 annually (Wells et al. 2006). Nevertheless, <strong>in</strong> the two decades between 1980 <strong>and</strong><br />
2000 an estimated 35% <strong>of</strong> the world’s mangroves were lost due to human <strong>and</strong> non-human<br />
processes. The rates <strong>of</strong> loss cont<strong>in</strong>ue to rise more rapidly <strong>in</strong> develop<strong>in</strong>g countries, where the<br />
majority (>90%) <strong>of</strong> the world’s mangroves are located (Duke et al. 2007). The primary causes<br />
47
<strong>of</strong> loss are through urbanization, conversion to agriculture <strong>and</strong> mariculture, human modifications<br />
to <strong>coastal</strong> hydrology, pollution, l<strong>and</strong>fill, salt production <strong>and</strong> direct use <strong>of</strong> trees for timber, fuel<br />
<strong>and</strong> medic<strong>in</strong>es (Valiela et al. 2001, Walters et al. 2008). Mangroves have also been destroyed<br />
<strong>and</strong> degraded by hurricanes <strong>and</strong> tsunamis (Alongi 2008, Giri et al. 2008) <strong>and</strong> now sea-level rise<br />
has been identified as a substantial cause <strong>of</strong> recent <strong>and</strong> predicted future reductions <strong>in</strong> the area <strong>and</strong><br />
health <strong>of</strong> mangroves (Gilman et al. 2008).<br />
Classified remote sens<strong>in</strong>g imagery such as generated from spectral <strong>in</strong>terpretation <strong>of</strong><br />
L<strong>and</strong>sat TM data provides a time series appropriate for a quantitative synoptic change detection<br />
to assess the distribution <strong>of</strong> mangroves <strong>and</strong> to document quantitatively how the spatial pattern<strong>in</strong>g<br />
<strong>of</strong> mangroves (losses, ga<strong>in</strong>s, contiguity/fragmentation) have changed. Comb<strong>in</strong><strong>in</strong>g map products<br />
with spatial analyses <strong>and</strong> data from <strong>in</strong>vestigation <strong>of</strong> the causal mechanisms that have led to<br />
changes <strong>and</strong> characterization <strong>of</strong> areas that have experienced most change will provide valuable<br />
<strong>in</strong>formation to support resource management decision-mak<strong>in</strong>g, policy formulation <strong>and</strong> public<br />
education. Giri et al. (2008) <strong>in</strong>terpreted a L<strong>and</strong>sat time series to estimate the extent <strong>of</strong> tsunamiaffected<br />
mangrove forests <strong>in</strong> SE Asia <strong>and</strong> to determ<strong>in</strong>e the rates <strong>and</strong> causes <strong>of</strong> deforestation from<br />
1975 to 2005. Us<strong>in</strong>g a post classification change detection approach for <strong>coastal</strong> areas <strong>of</strong><br />
Indonesia, Malaysia, Thail<strong>and</strong>, Burma (Myanmar), Bangladesh, India <strong>and</strong> Sri Lanka, the<br />
analyses determ<strong>in</strong>ed that the region had lost 12% <strong>of</strong> its mangrove forests from 1975 to 2005<br />
(Figure 19). Rates <strong>and</strong> causes <strong>of</strong> deforestation varied both spatially <strong>and</strong> temporally. Annual<br />
deforestation was highest <strong>in</strong> Burma (c. 1%) <strong>and</strong> lowest <strong>in</strong> Sri Lanka (0.1%). In contrast,<br />
mangrove forests <strong>in</strong> India <strong>and</strong> Bangladesh rema<strong>in</strong>ed unchanged or ga<strong>in</strong>ed a small percentage.<br />
Change detection revealed that the major causes <strong>of</strong> deforestation were agricultural expansion<br />
(81%), aquaculture (12%) <strong>and</strong> urban development (2%) (Figure 19). This type <strong>of</strong> application can<br />
48
also be used to assess the role <strong>of</strong> mangroves <strong>in</strong> protect<strong>in</strong>g the coastl<strong>in</strong>e from tsunamis <strong>and</strong> to<br />
identify possible areas for conservation, restoration <strong>and</strong> rehabilitation.<br />
<strong>1.10</strong>.8 ENVIRONMENTAL RISK ASSESSMENT AND HUMAN IMPACTS<br />
Knowledge <strong>of</strong> the distribution <strong>of</strong> habitats, communities, <strong>and</strong> species <strong>and</strong> how they<br />
respond to the effects <strong>of</strong> human <strong>and</strong> non-human processes is fundamental to effective<br />
management <strong>of</strong> the mar<strong>in</strong>e environment. Spatially explicit risk assessments that l<strong>in</strong>k <strong>in</strong>formation<br />
on the sensitivity <strong>of</strong> the environment to the occurrence <strong>of</strong> a pressure are fundamental to the<br />
implementation <strong>of</strong> spatial management (Hope, 2006). In fact, the spatial distribution <strong>of</strong> habitats<br />
<strong>and</strong> the spatial distribution <strong>of</strong> human activities are <strong>in</strong> many cases <strong>in</strong>terrelated. Many directives<br />
<strong>and</strong> strategies such as the EC Water Framework Directive <strong>and</strong> the EC Mar<strong>in</strong>e Strategy<br />
Framework Directive state that efficient management must identify anthropogenic pressures on<br />
the mar<strong>in</strong>e environment <strong>and</strong> assess their potential effects. Methods for assess<strong>in</strong>g habitat<br />
sensitivity to human impacts are now urgently needed to measure impact susta<strong>in</strong>ability, develop<br />
spatial management plans, <strong>and</strong> support sound environmental impact assessments. These<br />
procedures should be quantitative, validated, repeatable, <strong>and</strong> applicable at multiple spatial scales<br />
relevant to both the impact <strong>and</strong> management (Hidd<strong>in</strong>k et al., 2007, Fraschetti et al. 2008).<br />
Mar<strong>in</strong>e species <strong>and</strong> habitats vary <strong>in</strong> their response to stressors (both anthropogenic <strong>and</strong><br />
non-anthropogenic) <strong>and</strong> del<strong>in</strong>eat<strong>in</strong>g <strong>and</strong> classify<strong>in</strong>g areas or habitat classes based on their<br />
relative sensitivity <strong>and</strong> vulnerability to stressors is a valuable tool <strong>in</strong> manag<strong>in</strong>g <strong>and</strong> predict<strong>in</strong>g<br />
disturbances to the mar<strong>in</strong>e environment. Zacharias <strong>and</strong> Gregr (2005) def<strong>in</strong>e “sensitivity” as the<br />
degree to which mar<strong>in</strong>e features respond to stresses, which are considered as deviations <strong>of</strong><br />
49
environmental conditions beyond the expected range, <strong>and</strong> “vulnerability” as the probability that a<br />
feature will be exposed to a stress to which it is sensitive. Another related term is<br />
“recoverability”, def<strong>in</strong>ed as the ability <strong>of</strong> a habitat, community or species to return to a state<br />
close to that which existed before the activity or event caused change.<br />
With appropriate spatial <strong>in</strong>formation these def<strong>in</strong>itions can be represented spatially as<br />
classes with<strong>in</strong> a thematic map. The identification <strong>and</strong> classification <strong>of</strong> areas based on the<br />
sensitivity <strong>of</strong> species <strong>and</strong> habitats for use <strong>in</strong> management plann<strong>in</strong>g requires access to extensive<br />
biophysical <strong>and</strong> socio-economic data usually for both l<strong>and</strong> <strong>and</strong> sea together with <strong>in</strong>terpretation <strong>of</strong><br />
data <strong>in</strong> a comprehensive, consistent <strong>and</strong> structured way (Tyler-Walters <strong>and</strong> Jackson 1999,<br />
Hiscock <strong>and</strong> Tyler-Walters 2006). Thus, the process <strong>of</strong> classify<strong>in</strong>g risk is cont<strong>in</strong>ually evolv<strong>in</strong>g to<br />
<strong>in</strong>corporate best available <strong>in</strong>formation on the biological responses to disturbance. In Europe,<br />
work is underway to determ<strong>in</strong>e the most suitable <strong>in</strong>dicator species to represent community level<br />
sensitivity to specific types <strong>of</strong> human activities occurr<strong>in</strong>g <strong>in</strong> specific mar<strong>in</strong>e biotopes (Tyler-<br />
Walters et al. 2009). Sensitivity analysis has been implemented with various qualitative, semiquantitative<br />
<strong>and</strong> quantitative approaches. Here we show examples <strong>of</strong> a selection <strong>of</strong> both<br />
qualitative <strong>and</strong> quantitative models that also <strong>in</strong>tegrate expert op<strong>in</strong>ion <strong>in</strong> the development <strong>of</strong><br />
sensitivity maps.<br />
<strong>1.10</strong>.8.1 Environmental Sensitivity Index Mapp<strong>in</strong>g<br />
NOAA’s Environmental Sensitivity Index (ESI) Mapp<strong>in</strong>g, first developed <strong>in</strong> the 1970’s is<br />
an <strong>in</strong>ter-agency map product coord<strong>in</strong>ated by the Office <strong>of</strong> Response <strong>and</strong> Restoration that has<br />
become the most widely used approach to mapp<strong>in</strong>g environmental sensitivity <strong>in</strong> the United<br />
50
States (Gundlach <strong>and</strong> Hayes 1978). The approach systematically compiles best-available<br />
<strong>in</strong>formation on: 1.) Shorel<strong>in</strong>e type (substrate, gra<strong>in</strong> size, tidal elevation, orig<strong>in</strong>); 2.) Exposure to<br />
wave <strong>and</strong> tidal energy; 3.) Biological productivity <strong>and</strong> sensitivity; 4.) Human uses; <strong>and</strong> 5.) Ease<br />
<strong>of</strong> cleanup <strong>in</strong> the event <strong>of</strong> a chemical spill. The classified maps are provided as atlases for each<br />
state <strong>and</strong> jurisdiction <strong>in</strong> hard copy <strong>and</strong> digital form to be used by federal <strong>and</strong> state agencies as a<br />
start<strong>in</strong>g po<strong>in</strong>t for prevention, plann<strong>in</strong>g <strong>and</strong> response actions <strong>and</strong> are considered to provide the<br />
essential <strong>in</strong>formation needed for effective site-specific plann<strong>in</strong>g, particularly <strong>in</strong> the event <strong>of</strong> a<br />
chemical spill (NOAA 1996 – ESI guidel<strong>in</strong>es). Electronic versions <strong>of</strong> the ESI maps <strong>and</strong><br />
associated descriptive <strong>in</strong>formation are utilized by the U.S. Coast Guard as a first phase <strong>in</strong><br />
assess<strong>in</strong>g the course <strong>of</strong> action relative to priority areas when an oil spill occurs.<br />
Some <strong>of</strong> the first ESI maps were produced for The State <strong>of</strong> Alabama <strong>in</strong> 1996 <strong>and</strong> then<br />
updated <strong>in</strong> 2007 (Figure 20). The maps <strong>in</strong>corporated dynamic characteristics <strong>of</strong> the <strong>coastal</strong><br />
system <strong>in</strong> the prediction <strong>of</strong> the behavior <strong>and</strong> persistence <strong>of</strong> oil s<strong>in</strong>ce the <strong>in</strong>tensity <strong>of</strong> energy<br />
expended upon a shorel<strong>in</strong>e by wave action, tidal currents, <strong>and</strong> river currents directly affect the<br />
persistence <strong>of</strong> str<strong>and</strong>ed oil <strong>in</strong> addition to substrate type <strong>and</strong> gra<strong>in</strong> size. The potential for<br />
biological <strong>in</strong>jury <strong>and</strong> ease <strong>of</strong> cleanup <strong>of</strong> spilled oil are also important factors <strong>in</strong> the ESI rank<strong>in</strong>g.<br />
In general, areas exposed to high levels <strong>of</strong> physical energy, such as wave action <strong>and</strong> tidal<br />
currents, <strong>and</strong> low biological activity rank low on the scale, whereas sheltered areas with<br />
associated high biological activity have the highest rank<strong>in</strong>g.<br />
The “shorel<strong>in</strong>e,” represent<strong>in</strong>g the boundary between l<strong>and</strong> <strong>and</strong> water, is color-coded with<br />
the ESI classification. The distribution <strong>of</strong> biological resources is shown us<strong>in</strong>g many different<br />
conventions (Figure 20). The major convention is an icon associated with a po<strong>in</strong>t, l<strong>in</strong>e, or<br />
polygon that shows the species’ areal distribution. The icon’s reference number corresponds to a<br />
51
data table with details on species <strong>and</strong> life history. Biological resource data are organized <strong>in</strong>to six<br />
major groups, each with a reference color: birds (green), mammals (brown), fish (blue), shellfish<br />
(orange), reptiles (red), <strong>and</strong> rare/endangered plants <strong>and</strong> special habitats (purple). Most <strong>of</strong> the<br />
human-use resources are po<strong>in</strong>t features <strong>in</strong>dicated by a black-<strong>and</strong>-white icon. Managed l<strong>and</strong>s,<br />
such as refuges <strong>and</strong> sanctuaries, have their boundaries shown as a dot-dash l<strong>in</strong>e with an icon <strong>and</strong><br />
name placed <strong>in</strong>side. Where the feature is a known po<strong>in</strong>t location (e.g., a dr<strong>in</strong>k<strong>in</strong>g water <strong>in</strong>take,<br />
boat ramp, mar<strong>in</strong>a) the exact location is shown as a small black dot <strong>and</strong> a l<strong>in</strong>e is drawn from it to<br />
the icon. Activities such as commercial <strong>and</strong> recreational fish<strong>in</strong>g <strong>and</strong> areas such as recreational<br />
beaches are also <strong>in</strong>dicated by an icon placed <strong>in</strong> the general area without any l<strong>in</strong>es to po<strong>in</strong>ts or<br />
polygons s<strong>in</strong>ce the boundaries are not readily def<strong>in</strong>ed. Some features, like historic <strong>and</strong><br />
archaeological sites, are location-sensitive: the agency manag<strong>in</strong>g the resource believes the exact<br />
location should not be shown <strong>in</strong> order to protect the site. In these cases, the icon is placed <strong>in</strong> the<br />
general area <strong>of</strong> the resource, but the exact location is not shown (Text adapted from Sample ESI<br />
Map 21 http://response.restoration.noaa.gov/).<br />
<strong>1.10</strong>.8.2 Mar<strong>in</strong>e Sensitivity Mapp<strong>in</strong>g <strong>in</strong> the UK<br />
In the UK, the European Union Nature Information System (EUNIS) (Davies <strong>and</strong> Moss<br />
2004) based on a modified seabed biotope classification first developed for the UK has been<br />
<strong>in</strong>tegrated with a database on species <strong>and</strong> biotope sensitivities to human activity us<strong>in</strong>g a GIS to<br />
provide sensitivity maps (Hiscock <strong>and</strong> Tyler-Walters 2006). This assessment developed by the<br />
Mar<strong>in</strong>e Life Information Network (MarLIN) estimates the sensitivity <strong>of</strong> a mar<strong>in</strong>e biotope, based<br />
on the response <strong>of</strong> some component species to disturbance, thus requir<strong>in</strong>g relatively detailed<br />
52
<strong>in</strong>formation at the species level. It was first commissioned <strong>in</strong> 1999 to support implementation <strong>of</strong><br />
the EC Habitats Directive <strong>and</strong> the UK Biodiversity Action Plan <strong>in</strong> the seas around Engl<strong>and</strong> <strong>and</strong><br />
Scotl<strong>and</strong>. The MarLIN def<strong>in</strong>ition recognizes that sensitivity is dependent on the <strong>in</strong>tolerance <strong>of</strong> a<br />
species or habitat to damage from an external factor <strong>and</strong> the time taken for its subsequent<br />
recovery. For example, a very sensitive species or habitat is one that is very adversely affected<br />
by an external factor aris<strong>in</strong>g from human activities or natural events (killed/destroyed, 'high'<br />
<strong>in</strong>tolerance) <strong>and</strong> is expected to recover over a very long period <strong>of</strong> time, i.e. >10 or up to 25 years<br />
('low'; recoverability) (Figure 21). MarLIN have developed st<strong>and</strong>ard benchmarks to enable<br />
comparative assessment <strong>of</strong> sensitivity relative to a specified change <strong>in</strong> the environment based on<br />
best available <strong>in</strong>formation from scientific studies<br />
(http://www.marl<strong>in</strong>.ac.uk/sensitivityrationale.php). Where there is <strong>in</strong>sufficient <strong>in</strong>formation to<br />
assess the recoverability <strong>of</strong> a habitat or species the ‘precautionary pr<strong>in</strong>ciple’ is adopted <strong>and</strong> the<br />
recovery will be assumed to take a very long time i.e. ‘low’ recoverability <strong>in</strong> the derivation <strong>of</strong> a<br />
sensitivity rank.<br />
There are a number <strong>of</strong> other approaches to sensitivity assessment, such as that developed<br />
for fish<strong>in</strong>g activities by Hall et al. (2008). Stelzenmüller et al. (2010) developed a mar<strong>in</strong>e spatial<br />
risk assessment framework for the UK cont<strong>in</strong>ental shelf assess<strong>in</strong>g the vulnerability <strong>of</strong> 11 fish <strong>and</strong><br />
shellfish species to aggregate extraction. The authors calculated a sensitivity <strong>in</strong>dex (SI) us<strong>in</strong>g<br />
species life-history characteristics <strong>and</strong> modeled the spatial distributions <strong>of</strong> species us<strong>in</strong>g<br />
geostatistical techniques applied to long-term monitor<strong>in</strong>g data. Sensitivity maps were produced<br />
by merg<strong>in</strong>g sensitivity <strong>in</strong>dices <strong>and</strong> predicted species distributions which were then overlayed<br />
with the occurrence <strong>of</strong> aggregate extraction activity <strong>in</strong> <strong>in</strong>shore waters, <strong>in</strong>clud<strong>in</strong>g sediment plume<br />
estimations, to describe species vulnerability to dredg<strong>in</strong>g (Figure 22).<br />
53
<strong>1.10</strong>.8.3 USGS Coastal Hazards Maps<br />
The rapidly grow<strong>in</strong>g population <strong>of</strong> <strong>coastal</strong> residents <strong>and</strong> their dem<strong>and</strong> for reliable<br />
<strong>in</strong>formation regard<strong>in</strong>g the vulnerability <strong>of</strong> <strong>coastal</strong> regions to storm impacts have created a need<br />
for classify<strong>in</strong>g <strong>coastal</strong> l<strong>and</strong>s <strong>and</strong> evaluat<strong>in</strong>g storm hazard vulnerability. Government <strong>of</strong>ficials <strong>and</strong><br />
resource managers responsible for deal<strong>in</strong>g with natural hazards also need accurate assessments <strong>of</strong><br />
potential storm impacts <strong>in</strong> order to make <strong>in</strong>formed decisions before, dur<strong>in</strong>g, <strong>and</strong> after major<br />
storm events. Mitigat<strong>in</strong>g damage to natural <strong>coastal</strong> resources <strong>and</strong> economic development depend<br />
on <strong>in</strong>tegrat<strong>in</strong>g models <strong>of</strong> storm parameters, hazard vulnerability, <strong>and</strong> expected <strong>coastal</strong> responses.<br />
Thus, storm hazard vulnerability assessments constitute one <strong>of</strong> the fundamental components <strong>of</strong><br />
forecast<strong>in</strong>g storm impacts. The primary purpose <strong>of</strong> the USGS National Assessment <strong>of</strong> Coastal<br />
Change Project is to provide accurate representations <strong>of</strong> pre-storm ground conditions for areas<br />
that are designated high-priority because they have dense populations or valuable resources that<br />
are at risk from storm waves. Another purpose <strong>of</strong> the project is to develop a geomorphic (l<strong>and</strong><br />
feature) <strong>coastal</strong> classification that, with only m<strong>in</strong>or modification, can be applied to most <strong>coastal</strong><br />
regions <strong>in</strong> the United States. A <strong>coastal</strong> classification map (Figure 23) describ<strong>in</strong>g local<br />
geomorphic features is the first step toward determ<strong>in</strong><strong>in</strong>g the hazard vulnerability <strong>of</strong> an area. The<br />
National Assessment <strong>of</strong> Coastal Change Project's Coastal Classification Maps present ground<br />
conditions such as beach width, dune elevations, overwash potential, <strong>and</strong> density <strong>of</strong><br />
development. In order to complete a hazard vulnerability assessment, that <strong>in</strong>formation must be<br />
<strong>in</strong>tegrated with other <strong>in</strong>formation, such as prior storm impacts <strong>and</strong> beach stability. The <strong>coastal</strong><br />
classification maps provide much <strong>of</strong> the basic <strong>in</strong>formation for such an assessment <strong>and</strong> represent a<br />
critical component <strong>of</strong> a storm-impact forecast<strong>in</strong>g capability.<br />
54
<strong>1.10</strong>.8.4 Classify<strong>in</strong>g <strong>and</strong> Mapp<strong>in</strong>g Human Impacts <strong>in</strong> Hawaii<br />
Conventional approaches to evaluat<strong>in</strong>g the distribution <strong>and</strong> ecological impacts <strong>of</strong> human<br />
activities to the mar<strong>in</strong>e environment have used expert op<strong>in</strong>ion to evaluate or rank impacts, for<br />
example, the Reefs at Risk (Bryant et al. 1998) used expert op<strong>in</strong>ion to classify the world’s coral<br />
reefs <strong>in</strong>to low, medium <strong>and</strong> high threat categories. Although widely used, these techniques are<br />
sometimes considered lack<strong>in</strong>g <strong>in</strong> objectivity due to bias <strong>in</strong> perceived threats <strong>and</strong> are usually not<br />
spatially articulated <strong>in</strong> a consistent framework. More recently, Halpern et al. (2007, 2008)<br />
developed an analytical grid-based framework for calculat<strong>in</strong>g <strong>and</strong> mapp<strong>in</strong>g the cumulative<br />
impact <strong>of</strong> human activities at a spatial resolution <strong>of</strong> 1 km 2 based on <strong>in</strong>dividually weighted<br />
stressor layers. The cumulative impact mapp<strong>in</strong>g framework has great versatility <strong>and</strong> can be<br />
conducted at a range <strong>of</strong> scales <strong>and</strong> is now be<strong>in</strong>g applied at f<strong>in</strong>er resolution to map smaller<br />
geographical areas around the world. A cumulative impacts approach was applied <strong>and</strong> locally<br />
ref<strong>in</strong>ed for the Papahãnaumokuãkea Mar<strong>in</strong>e National Monument <strong>in</strong> Hawaii to focus more on<br />
locally relevant threats <strong>in</strong>clud<strong>in</strong>g mar<strong>in</strong>e debris, ship strike risk, <strong>in</strong>vasive species, fish<strong>in</strong>g <strong>and</strong><br />
several climate change parameters (Selkoe et al. 2009). These data were comb<strong>in</strong>ed with habitat<br />
maps <strong>and</strong> expert judgment on the vulnerability <strong>of</strong> different habitat types <strong>in</strong> the Monument to<br />
estimate spatial patterns <strong>of</strong> current cumulative impact at 1 ha (0.01 km 2 ) resolution (Figure 24).<br />
Halpern et al. (2007) developed a suite <strong>of</strong> five criteria related to vulnerability to make basic<br />
characterizations <strong>of</strong> how activities impact ecosystems or ecozones differently: (1) the spatial<br />
scale at which the threat acts, (2) the frequency with which it acts, (3) the number <strong>of</strong> trophic<br />
levels impacted, (4) the resistance <strong>of</strong> the ecosystem to impact, <strong>and</strong> (5) the recovery time needed<br />
55
to return to an un-impacted state. Quantitative values for the five criteria were estimated from the<br />
mean <strong>of</strong> survey responses by 25 scientific experts on the NWHI <strong>and</strong> comb<strong>in</strong>ed <strong>in</strong>to a s<strong>in</strong>gle<br />
‘‘vulnerability score’’ for every ecozone-threat comb<strong>in</strong>ation. Ecozones were classified from the<br />
exist<strong>in</strong>g digital benthic habitat maps created by the Biogeography Branch <strong>of</strong> the U.S. National<br />
Oceanic <strong>and</strong> Atmospheric Adm<strong>in</strong>istration<br />
(http://ccma.nos.noaa.gov/ecosystems/coralreef/nwhi_mapp<strong>in</strong>g.html).<br />
In contrast to the global impacts model, the local model revealed that cumulative impact<br />
was greater for shallow reef areas than deeper <strong>of</strong>fshore areas, which corroborated expert op<strong>in</strong>ion.<br />
One specific location experienced 13 <strong>of</strong> the total 14 threats used <strong>in</strong> the model. Ocean temperature<br />
variation associated with disease outbreaks was found to have the highest predicted impact<br />
overall, however, ship traffic was identified as a high threat that could be more easily mitigated<br />
via management action. Managers can make use <strong>of</strong> these maps to prioritize management actions,<br />
guide permitt<strong>in</strong>g decisions <strong>and</strong> to design targeted monitor<strong>in</strong>g programs.<br />
<strong>1.10</strong>.8.5 Classify<strong>in</strong>g <strong>and</strong> Mapp<strong>in</strong>g Coastal Vulnerability to Climate Change <strong>in</strong> Australia<br />
The Department <strong>of</strong> Climate Change <strong>and</strong> the Department <strong>of</strong> Environment, Water, Heritage<br />
<strong>and</strong> the Arts (DEWHA) are work<strong>in</strong>g with the states <strong>and</strong> territories through the Intergovernmental<br />
Coastal Advisory Group to assess Australia’s <strong>coastal</strong> vulnerability to climate change, <strong>in</strong>clud<strong>in</strong>g<br />
impacts on <strong>coastal</strong> habitats <strong>and</strong> <strong>in</strong>frastructure. The Coastal Vulnerability Assessment Project<br />
(Sharples 2009) will provide fundamental datasets to support decision makers <strong>in</strong> identify<strong>in</strong>g<br />
those areas <strong>in</strong> Australia’s <strong>coastal</strong> zone where potential climate change impacts may be rated as<br />
high, medium <strong>and</strong> low. This assessment is based on data from a nationally consistent geomorphic<br />
56
map <strong>of</strong> the entire Australian shorel<strong>in</strong>e <strong>in</strong> a GIS-based segmented l<strong>in</strong>e format (Figure 25). Each<br />
l<strong>in</strong>e segment conta<strong>in</strong>s multiple attribute fields that describe important aspects <strong>of</strong> the shorel<strong>in</strong>e<br />
geomorphology <strong>and</strong> potential impacts <strong>of</strong> climate change <strong>and</strong> sea level rise, <strong>in</strong>clud<strong>in</strong>g shorel<strong>in</strong>e<br />
erosion. This data format has been termed a ‘Smartl<strong>in</strong>e’ (Sharples 2006). The Smartl<strong>in</strong>e maps are<br />
also l<strong>in</strong>ked to a comprehensive database called ABSAMP (Australian Beach Safety &<br />
Management Program) which conta<strong>in</strong>s <strong>in</strong>formation on every beach <strong>in</strong> Australia.<br />
<strong>1.10</strong>.9 CLASSIFYING WATER QUALITY<br />
<strong>1.10</strong>.9.1 Australian Environmental Condition Assessment Framework<br />
The National L<strong>and</strong> <strong>and</strong> Water Resources Audit <strong>of</strong> the Department <strong>of</strong> Water is develop<strong>in</strong>g<br />
an assessment <strong>of</strong> the condition <strong>of</strong> Australian estuaries through an <strong>estuar<strong>in</strong>e</strong> condition statement<br />
that summarizes all available <strong>in</strong>formation <strong>and</strong> a report card that identifies pressures,<br />
vulnerabilities <strong>and</strong> management objectives. A national condition assessment framework provides<br />
a practical <strong>and</strong> logical structure for regional <strong>and</strong> national report<strong>in</strong>g, direct<strong>in</strong>g research, enhanc<strong>in</strong>g<br />
communication, facilitat<strong>in</strong>g coord<strong>in</strong>ation between jurisdictions <strong>and</strong> guid<strong>in</strong>g identification <strong>of</strong><br />
<strong>in</strong>dicators (Arundel <strong>and</strong> Mount 2007). The condition <strong>classifications</strong> <strong>of</strong> 971 estuaries (i.e., nearprist<strong>in</strong>e,<br />
largely unmodified, modified <strong>and</strong> extensively modified) relied ma<strong>in</strong>ly on qualitative<br />
<strong>in</strong>formation <strong>and</strong> expert op<strong>in</strong>ion on a range <strong>of</strong> criteria (Heap et al. 2001). Subsequent studies have<br />
demonstrated systematic changes <strong>in</strong> geomorphic <strong>in</strong>dicators with dim<strong>in</strong>ish<strong>in</strong>g condition status (i.e.<br />
from near-prist<strong>in</strong>e, through modified to severely modified) po<strong>in</strong>t<strong>in</strong>g to changes <strong>in</strong> the surface<br />
area <strong>of</strong> sediment facies (habitats) between modified <strong>and</strong> prist<strong>in</strong>e estuaries (Heap et al., 2004) <strong>and</strong><br />
57
larger sediment loads <strong>and</strong> higher levels <strong>of</strong> maturity <strong>in</strong> the more modified systems (Radke et al.,<br />
2006). This was evident <strong>in</strong> larger areas <strong>of</strong> tidal s<strong>and</strong> banks, <strong>in</strong>tertidal flats <strong>and</strong> mangroves <strong>in</strong> tidedom<strong>in</strong>ated<br />
estuaries, <strong>and</strong> larger <strong>in</strong>tertidal flats <strong>in</strong> wave-dom<strong>in</strong>ated systems. Metal concentrations<br />
also have been found to cont<strong>in</strong>ue to <strong>in</strong>crease above background concentrations <strong>in</strong> correspondence<br />
with dim<strong>in</strong>ish<strong>in</strong>g condition status <strong>in</strong> the NLWRA framework (Birch <strong>and</strong> Olmos, 2008; Olmos<br />
<strong>and</strong> Birch, 2008).<br />
OzCoasts onl<strong>in</strong>e database provides classified maps to assist <strong>in</strong> deliver<strong>in</strong>g national level<br />
assessments on the broad ecological <strong>in</strong>tegrity <strong>of</strong> estuaries based on the National Monitor<strong>in</strong>g <strong>and</strong><br />
Evaluation Framework (Figure 26). The Report Card Report<strong>in</strong>g tool <strong>of</strong> the national Estuary<br />
Coastal <strong>and</strong> Mar<strong>in</strong>e (ECM) <strong>in</strong>dicator protocols <strong>in</strong>itiative allows users to view aggregated report<br />
scores <strong>and</strong> trends on an annual basis at a range <strong>of</strong> different spatial scales <strong>in</strong>clud<strong>in</strong>g national,<br />
state/territory, regional <strong>and</strong> bioregional. The onl<strong>in</strong>e map <strong>in</strong>terface shows the report<strong>in</strong>g regions<br />
(estuaries) as dots, with a color cod<strong>in</strong>g that matches that <strong>of</strong> the condition assessment <strong>in</strong> an<br />
accompany<strong>in</strong>g pie chart.<br />
<strong>1.10</strong>.9.2 European Community Mar<strong>in</strong>e Strategy Framework Directive<br />
In Europe, the EC Mar<strong>in</strong>e Strategy Framework Directive, adopted <strong>in</strong> 2008, requires EU<br />
Member States to achieve ‘Good Environmental Status’ <strong>in</strong> all their mar<strong>in</strong>e waters out to 200 nm<br />
(<strong>and</strong> on extended Cont<strong>in</strong>ental Shelf areas up to 350 nm, where claimed under UNCLOS), by<br />
2020. To develop biodiversity assessments suitable for such large sea areas, new <strong>in</strong>tegrated<br />
assessment techniques have been trialled for the first time <strong>in</strong> the UK <strong>and</strong> by OSPAR (Connor<br />
2009). For UK waters, the extent <strong>of</strong> impact on habitats from a set <strong>of</strong> 22 pressures was assessed<br />
58
with<strong>in</strong> 11 regions, lead<strong>in</strong>g to an overall assessment <strong>of</strong> status <strong>of</strong> each habitat <strong>in</strong> each region. Due<br />
to the large sea areas be<strong>in</strong>g assessed, modeled EUNIS habitat maps (from MESH;<br />
www.seachMESH.net) were aggregated <strong>in</strong>to six broad habitat types <strong>and</strong> spatial data on the<br />
distribution <strong>of</strong> human activities <strong>and</strong> their pressures were compiled. As monitor<strong>in</strong>g data on<br />
impacts is spatially restricted (mostly <strong>coastal</strong>), the trial relied on the expert judgment <strong>of</strong> about 40<br />
scientists to follow a systematic methodology for mak<strong>in</strong>g the assessments (Connor 2009). Figure<br />
27 illustrates the broad habitat categories assessed, <strong>and</strong> the accompany<strong>in</strong>g table (Figure 28)<br />
provides a summary <strong>of</strong> the impacts by pressure for each <strong>of</strong> the 11 regions (regional seas). The<br />
results <strong>of</strong> the UK assessment contribute to the UK’s second state <strong>of</strong> the seas report (Chart<strong>in</strong>g<br />
Progress 2). Similarly, the results <strong>of</strong> the OSPAR assessment are published <strong>in</strong> the OSPAR Quality<br />
Status Report 2010.<br />
<strong>1.10</strong>.10 DESIGN OF RESTORATION STRATEGIES<br />
Decid<strong>in</strong>g which restoration project to undertake can <strong>of</strong>ten be a daunt<strong>in</strong>g task for resource<br />
managers. The decision process, however, can be simplified <strong>in</strong>to three steps: 1.) assessment <strong>and</strong><br />
characterization <strong>of</strong> the study area; 2.) development <strong>of</strong> site selection criteria, <strong>and</strong> 3.) prioritization<br />
<strong>of</strong> potential sites. A wide range <strong>of</strong> mapped <strong>in</strong>formation can be used at all stages <strong>in</strong>clud<strong>in</strong>g<br />
monitor<strong>in</strong>g <strong>and</strong> assessment <strong>of</strong> restoration effectiveness.<br />
Classifications can support restoration activities through site selection (i.e., f<strong>in</strong>d<strong>in</strong>g the<br />
optimal or most suitable sites for restoration) based on biophysical features <strong>and</strong> socioeconomic<br />
factors. In addition, application <strong>of</strong> l<strong>and</strong>scape ecology concepts <strong>and</strong> tools can support both site<br />
selection <strong>and</strong> design <strong>of</strong> the restoration activity. Consideration <strong>of</strong> the site context or surround<strong>in</strong>gs<br />
59
can be achieved cost-effectively us<strong>in</strong>g thematic map products to describe the elements <strong>of</strong> the<br />
l<strong>and</strong>scape, such as the type <strong>and</strong> impact <strong>of</strong> l<strong>and</strong> uses adjacent to the site <strong>and</strong> if historical maps or a<br />
time series is available then an underst<strong>and</strong><strong>in</strong>g <strong>of</strong> the historical ecology <strong>of</strong> the site can be<br />
immensely useful. From a design po<strong>in</strong>t <strong>of</strong> view, l<strong>and</strong>scape ecology can provide <strong>in</strong>sight <strong>in</strong>to<br />
important ecological relationships at scales relevant to restoration decision mak<strong>in</strong>g. For<br />
example, if restor<strong>in</strong>g mangroves as fish habitat then an optimal location for restoration may<br />
<strong>in</strong>clude mangroves that are <strong>in</strong> close proximity to seagrasses that comb<strong>in</strong>e to <strong>of</strong>fer complementary<br />
<strong>and</strong> supplementary resources thus capable <strong>of</strong> support<strong>in</strong>g elevated fish diversity <strong>and</strong> abundance <strong>in</strong><br />
the region (Dunn<strong>in</strong>g et al. 1992, Pittman et al. 2007b). Furthermore, restoration site plann<strong>in</strong>g that<br />
<strong>in</strong>creases connectivity between degraded fragmented habitats may result <strong>in</strong> greater benefits <strong>in</strong><br />
terms <strong>of</strong> the persistence <strong>and</strong> resiliency <strong>of</strong> restored habitats. Given the uncerta<strong>in</strong>ty <strong>of</strong> climate<br />
change effects, greater attention on ecological processes <strong>in</strong> site selection will become<br />
<strong>in</strong>creas<strong>in</strong>gly important.<br />
The best methods appear to be those that rely on a scientific underst<strong>and</strong><strong>in</strong>g <strong>of</strong> the<br />
requirements (e.g., elevation, hydrology) <strong>of</strong> species <strong>and</strong> communities, <strong>and</strong> what must be done to<br />
a site to make these conditions correct for the <strong>in</strong>tended purpose.<br />
<strong>1.10</strong>.10.1 Target<strong>in</strong>g Wetl<strong>and</strong>s for Restoration <strong>in</strong> North Carol<strong>in</strong>a, USA<br />
Approximately 50 percent <strong>of</strong> the orig<strong>in</strong>al wetl<strong>and</strong>s <strong>of</strong> <strong>coastal</strong> North Carol<strong>in</strong>a have been<br />
dra<strong>in</strong>ed <strong>and</strong> converted primarily to agriculture <strong>and</strong> other l<strong>and</strong> uses (Hefner <strong>and</strong> Brown, 1985,<br />
Dahl <strong>and</strong> Johnson 1991). Cont<strong>in</strong>ued alteration <strong>of</strong> wetl<strong>and</strong>s typically results <strong>in</strong> compensatory<br />
mitigation that usually <strong>in</strong>volves the restoration <strong>of</strong> former wetl<strong>and</strong>s, creation <strong>of</strong> new wetl<strong>and</strong>s,<br />
60
enhancement <strong>of</strong> certa<strong>in</strong> functions <strong>in</strong> degraded wetl<strong>and</strong>s, or preservation <strong>of</strong> highly functional<br />
wetl<strong>and</strong>s <strong>and</strong> rare or endangered wetl<strong>and</strong> types. Success rates <strong>in</strong> mitigatory restoration are<br />
relatively low due largely to <strong>in</strong>appropriate site selection. Sites have been guided by convenience,<br />
cost, <strong>and</strong> time rather than by the consideration <strong>of</strong> wetl<strong>and</strong> functions <strong>and</strong> watershed conditions<br />
<strong>and</strong> this can result <strong>in</strong> the selection <strong>of</strong> a mitigation site lack<strong>in</strong>g the potential to support the wetl<strong>and</strong><br />
functions that it is designed to replace.<br />
To improve decision mak<strong>in</strong>g <strong>in</strong> site selection, the North Carol<strong>in</strong>a Department <strong>of</strong><br />
Environment <strong>and</strong> Natural Resources, Division <strong>of</strong> Coastal Management (DCM) developed a<br />
method for identify<strong>in</strong>g <strong>and</strong> rank<strong>in</strong>g potential restoration <strong>and</strong> enhancement sites us<strong>in</strong>g spatial data<br />
on wetl<strong>and</strong> type, soils, hydrography, l<strong>and</strong> use, <strong>and</strong> l<strong>and</strong> cover.<br />
(http://dcm2.enr.state.nc.us/Wetl<strong>and</strong>s/wetl<strong>and</strong>s.htm) The watershed-based data is used by<br />
restoration project teams as a plann<strong>in</strong>g tool to assess potential site conditions <strong>and</strong> to evaluate the<br />
potential for success. The four GIS-based mapp<strong>in</strong>g procedures developed by North Carol<strong>in</strong>a are:<br />
1.) wetl<strong>and</strong> type mapp<strong>in</strong>g, 2.) wetl<strong>and</strong> functional assessment mapp<strong>in</strong>g, 3.) potential wetl<strong>and</strong><br />
restoration <strong>and</strong> enhancement mapp<strong>in</strong>g, <strong>and</strong> 4.) the restoration functional assessment, which<br />
estimates the levels <strong>and</strong> types <strong>of</strong> functions a wetl<strong>and</strong> restoration site could perform if restored.<br />
These procedures are based on function, therefore they help to locate potential restoration sites<br />
that replace a wetl<strong>and</strong>'s function <strong>in</strong> its watershed, not just lost wetl<strong>and</strong> area. The identification<br />
<strong>and</strong> mapp<strong>in</strong>g <strong>of</strong> potential wetl<strong>and</strong> restoration <strong>and</strong> enhancement sites beg<strong>in</strong>s with the<br />
identification <strong>of</strong> areas with hydric soils that were once wetl<strong>and</strong>s <strong>and</strong> are potential restoration sites<br />
<strong>and</strong> secondly areas that have been degraded or converted to a different wetl<strong>and</strong> type that are<br />
classified as enhancement sites (Williams 2002).<br />
61
Sites are first classified <strong>in</strong>to one <strong>of</strong> n<strong>in</strong>e wetl<strong>and</strong> disturbance classes accord<strong>in</strong>g to a set <strong>of</strong><br />
criteria based on site conditions <strong>and</strong> disturbance types. Based on the soil type, each site is then<br />
classified as one <strong>of</strong> six restoration types that refer to the wetl<strong>and</strong> type that could be restored or<br />
enhanced. DCM classifies potential wetl<strong>and</strong> restoration <strong>and</strong> enhancement sites accord<strong>in</strong>g to the<br />
wetl<strong>and</strong> plant community types that they are likely to support once they are restored or enhanced<br />
(Figure 29). The development <strong>of</strong> the classification scheme for potential wetl<strong>and</strong> restoration <strong>and</strong><br />
enhancement sites is based on soil taxonomy, a frequency analysis <strong>of</strong> DCM’s wetl<strong>and</strong> type<br />
mapp<strong>in</strong>g results (wetl<strong>and</strong> type vs. soil mapp<strong>in</strong>g unit), l<strong>and</strong>scape position, <strong>and</strong> best pr<strong>of</strong>essional<br />
judgment from wetl<strong>and</strong> scientists <strong>and</strong> soil scientists.<br />
<strong>1.10</strong>.10.2 Identify<strong>in</strong>g <strong>and</strong> Prioritiz<strong>in</strong>g Restoration Sites <strong>in</strong> Puget Sound, Oregon USA<br />
The sub-estuaries <strong>of</strong> Puget Sound have lost more than 80% <strong>of</strong> tidal marsh habitats <strong>in</strong><br />
the past 150 years <strong>and</strong> efforts are underway to restore priority areas. Dean et al. (2000) used<br />
spatial data <strong>and</strong> GIS techniques to calculate the extent <strong>of</strong> loss <strong>in</strong> the Skagit River estuary <strong>and</strong><br />
to identify <strong>and</strong> rank areas that would be appropriate for restor<strong>in</strong>g <strong>estuar<strong>in</strong>e</strong> habitat for the<br />
benefit <strong>of</strong> ch<strong>in</strong>ook salmon (Oncorhynchus tshawytscha) <strong>and</strong> other threatened or endangered<br />
species. Selection criteria were based on ecologically mean<strong>in</strong>gful characteristics <strong>of</strong> the<br />
l<strong>and</strong>scape (follow<strong>in</strong>g Shreffler <strong>and</strong> Thom 1993), balanced with criteria rank<strong>in</strong>g ease <strong>of</strong><br />
restoration. L<strong>and</strong>scape variables <strong>in</strong>cluded areas <strong>of</strong> tidal <strong>and</strong> seasonal flood<strong>in</strong>g, hydrological<br />
connectivity <strong>and</strong> ecological susta<strong>in</strong>ability with the f<strong>in</strong>al site prioritization classification<br />
developed with a tally <strong>of</strong> scores from each criterion (i.e., 0= outside flood corridor; 4=<br />
<strong>in</strong>side flood corridor). Hydrology was the basis for classify<strong>in</strong>g connectivity <strong>and</strong> this was<br />
62
achieved by identify<strong>in</strong>g barriers to the flow <strong>of</strong> water (i.e. major roads, levees or dikes)<br />
relative to known salmon movement corridors such as barriers to juvenile-bear<strong>in</strong>g fresh<br />
water (Skagit River), salt water (Skagit Bay, Padilla Bay, Sw<strong>in</strong>omish Channel) or adjacent<br />
to both. For susta<strong>in</strong>ability, a higher score was assigned to larger areas <strong>of</strong> wetl<strong>and</strong> with the<br />
assumption that a larger area is more susta<strong>in</strong>able than a smaller area. For ease <strong>of</strong> restoration,<br />
public l<strong>and</strong> was scored more highly than private <strong>and</strong> natural vegetation (forest, marsh)<br />
scored more highly than agriculture <strong>and</strong> impervious surfaces <strong>and</strong> plots with fewer owners<br />
received higher scores than many owners. To def<strong>in</strong>e the priority rank<strong>in</strong>g classes, scores<br />
were summed for every quarter-acre cell, <strong>and</strong> the scores were divided <strong>in</strong>to four priority<br />
ranges with Priority 1 be<strong>in</strong>g the highest priority <strong>and</strong> 4 the lowest (Figure 30).<br />
<strong>1.10</strong>.11 CLASSIFYING AND MAPPING SOCIO-ECONOMIC PATTERNS<br />
Human use patterns, anthropogenic stressors/pressures <strong>and</strong> economic evaluations <strong>of</strong><br />
goods <strong>and</strong> services are some <strong>of</strong> the human dimensions data that are <strong>in</strong>creas<strong>in</strong>gly be<strong>in</strong>g<br />
represented by <strong>classifications</strong> that play an important role <strong>in</strong> mar<strong>in</strong>e spatial plann<strong>in</strong>g <strong>and</strong> the<br />
evaluation <strong>of</strong> potential threats. Not only do these data help <strong>in</strong> plann<strong>in</strong>g, but also provide an<br />
effective way to evaluate the likely economic impact <strong>of</strong> mar<strong>in</strong>e spatial plann<strong>in</strong>g decisions.<br />
Human dimensions data are complex to depict spatially <strong>and</strong> very diverse, but significant<br />
advances have been made to map social data <strong>in</strong>clud<strong>in</strong>g ecosystem valuations that can help<br />
prioritize management activities.<br />
Economic value can be shown <strong>in</strong> various ways, Figure 31 shows a section <strong>of</strong> the Baltic<br />
Sea that has been classified accord<strong>in</strong>g to its tourism value represented by recreational boat<strong>in</strong>g<br />
63
<strong>and</strong> cottages, <strong>and</strong> tourism related companies. This <strong>in</strong>formation is useful <strong>in</strong> assess<strong>in</strong>g the impact<br />
<strong>of</strong> different zon<strong>in</strong>g scenarios on the mar<strong>in</strong>e <strong>and</strong> <strong>coastal</strong> tourism associated economy. For<br />
example, if a zon<strong>in</strong>g regulation prohibits development <strong>of</strong> docks, hotels or boat<strong>in</strong>g then the cost<br />
can be calculated for specific regions. Furthermore, the <strong>in</strong>formation can be comb<strong>in</strong>ed to show the<br />
overall picture <strong>of</strong> the economy geographically<br />
<strong>1.10</strong>.11.1 Classify<strong>in</strong>g <strong>and</strong> Mapp<strong>in</strong>g Ecosystem Services<br />
Ecosystem services are the benefits people obta<strong>in</strong> either directly or <strong>in</strong>directly from<br />
ecological systems (Millenium Ecosystem Assessment 2003) <strong>and</strong> are a critical component <strong>of</strong><br />
comprehensive mar<strong>in</strong>e spatial plann<strong>in</strong>g. An ecosystems services approach to valu<strong>in</strong>g mar<strong>in</strong>e<br />
biodiversity is recognized as a framework by which economic, ecological <strong>and</strong> social values can<br />
be <strong>in</strong>corporated <strong>in</strong>to the decision mak<strong>in</strong>g process (Rees et al. 2010) <strong>and</strong> <strong>in</strong>clusion can help to<br />
promote efficient strategies for biodiversity conservation <strong>and</strong> anticipate stakeholder conflicts<br />
(Beaumont et al. 2007). Naidoo et al. (2008) argued that to underst<strong>and</strong> the <strong>in</strong>teraction between<br />
biodiversity <strong>and</strong> ecosystem services, values must be quantified <strong>and</strong> their areas <strong>of</strong> production<br />
mapped. An <strong>in</strong>creas<strong>in</strong>g amount <strong>of</strong> spatially-explicit <strong>in</strong>formation is be<strong>in</strong>g collected on the<br />
ecological <strong>and</strong> socio-economic value <strong>of</strong> goods <strong>and</strong> services associated with <strong>coastal</strong> ecosystems<br />
(Chan et al. 2006). De Groot et al. (2002) def<strong>in</strong>ed 23 ecosystem functions with a wide range <strong>of</strong><br />
examples <strong>of</strong> goods <strong>and</strong> services provided by these functions that can be classified <strong>in</strong>to three<br />
groups: 1.) ecological, 2.) socio-cultural, <strong>and</strong> 3.) economic value. Troy <strong>and</strong> Wilson (2006)<br />
developed a spatial framework for the analysis <strong>of</strong> ecosystem service values (ESVs) through<br />
<strong>in</strong>tegration <strong>of</strong> biophysical l<strong>and</strong> use units classified from remotely sensed data with estimates <strong>of</strong><br />
64
ecosystem service values extracted from exist<strong>in</strong>g studies. Each mapp<strong>in</strong>g unit <strong>in</strong> the study areas<br />
was assigned a l<strong>and</strong> cover class <strong>and</strong> an ESV multiplier, allow<strong>in</strong>g values to be summed <strong>and</strong> crosstabulated<br />
by service type <strong>and</strong> l<strong>and</strong> cover type. Total ESV flow <strong>of</strong> a given cover type can be<br />
summed by add<strong>in</strong>g up the <strong>in</strong>dividual, non-substitutable ESV associated with a cover type <strong>and</strong><br />
multiply<strong>in</strong>g by area. Scenarios can be modeled by chang<strong>in</strong>g the <strong>in</strong>puts <strong>and</strong> carry<strong>in</strong>g out a change<br />
detection analysis to <strong>in</strong>vestigate the effect <strong>of</strong> a proposed plann<strong>in</strong>g decision or alternatively by<br />
recreat<strong>in</strong>g historical conditions for comparison with present day <strong>and</strong> future anticipated change.<br />
In 2004, Fisheries <strong>and</strong> Oceans Canada (DFO) developed an approach to identify Ecologically<br />
<strong>and</strong> Biologically Significant Areas (EBSAs) based on five criteria: uniqueness, aggregation,<br />
fitness consequences, resilience <strong>and</strong> naturalness (Jamieson <strong>and</strong> Lev<strong>in</strong>gs 2001). The DFO<br />
approach was adapted for application to the Belgian part <strong>of</strong> the North Sea (BPNS) <strong>and</strong> resulted <strong>in</strong><br />
the development <strong>of</strong> biological valuation maps (BVMs). BVMs serve as a tool to identify areas <strong>of</strong><br />
particular high biological significance <strong>and</strong> facilitate management <strong>of</strong> human activities, mak<strong>in</strong>g<br />
best use <strong>of</strong> available data sets us<strong>in</strong>g criteria for biological valuation: rarity, aggregation/fitness<br />
consequences, naturalness <strong>and</strong> proportional importance (Derous et al. 2007).<br />
<strong>1.10</strong>.11.1.1 Mapp<strong>in</strong>g ecosystem services for systematic plann<strong>in</strong>g, California, USA<br />
For the Central Coast ecoregion <strong>of</strong> California, Chan et al. (2006) developed a systematic<br />
plann<strong>in</strong>g framework <strong>of</strong> site prioritization us<strong>in</strong>g Marxan (Ball <strong>and</strong> Poss<strong>in</strong>gham 2001) that<br />
<strong>in</strong>tegrated biodiversity <strong>and</strong> ecosystem services. Six ecosystem services were chosen based on the<br />
availability <strong>of</strong> spatial data <strong>and</strong> knowledge <strong>of</strong> ecosystem functions <strong>in</strong>clud<strong>in</strong>g carbon storage, crop<br />
poll<strong>in</strong>ation, flood control, forage production, outdoor recreation <strong>and</strong> freshwater provision (Figure<br />
65
32). Results show that sites selected us<strong>in</strong>g ecosystem services alone did not protect sufficient<br />
proportions <strong>of</strong> biodiversity, but biodiversity alone did protect substantial amounts <strong>of</strong> ecosystem<br />
services. The authors found that strategically target<strong>in</strong>g biodiversity <strong>and</strong> only four <strong>of</strong> the<br />
ecosystem services that were positively correlated with biodiversity <strong>of</strong>fered an acceptable overall<br />
result with several areas identified where both high biodiversity <strong>and</strong> high ecosystem services<br />
co<strong>in</strong>cide. Areas <strong>of</strong> concordance also were identified <strong>in</strong> a global analysis (Naidoo et al. 2008), but<br />
better assessment <strong>of</strong> synergies <strong>and</strong> trade-<strong>of</strong>fs <strong>in</strong> conserv<strong>in</strong>g biodiversity <strong>and</strong> ecosystem services<br />
are needed to support optimal strategies <strong>in</strong> an ecosystem-based approach to management.<br />
<strong>1.10</strong>.11.1.2 Mapp<strong>in</strong>g change <strong>in</strong> ecosystem service values, Puget Sound, Wash<strong>in</strong>gton State, USA<br />
For Maury Isl<strong>and</strong>, a small isl<strong>and</strong> located <strong>in</strong> Puget Sound, Wash<strong>in</strong>gton State, USA,<br />
changes <strong>in</strong> ecosystem service value flows were estimated under two alternative development<br />
scenarios: 1) enlargement <strong>of</strong> a gravel m<strong>in</strong>e <strong>and</strong> associated dock <strong>and</strong> 2) fully build<strong>in</strong>g <strong>in</strong> the<br />
allowable residential zone over 20 years (Figure 33) (Troy <strong>and</strong> Wilson 2006). The unique l<strong>and</strong><br />
cover classification <strong>in</strong>cluded disturbed l<strong>and</strong> (urban, barren, unvalued); saltwater wetl<strong>and</strong>;<br />
freshwater wetl<strong>and</strong>; nearshore habitat (<strong>in</strong>tertidal salt estuaries, <strong>estuar<strong>in</strong>e</strong> <strong>in</strong>tertidal aquatic beds,<br />
stream mouths, sea cucumber habitat, geoduck habitat <strong>and</strong> herr<strong>in</strong>g <strong>and</strong> salmon spawn<strong>in</strong>g<br />
grounds); <strong>coastal</strong> open water; grassl<strong>and</strong>; stream buffers (50ft); <strong>coastal</strong> riparian; beach; beach near<br />
dwell<strong>in</strong>g <strong>and</strong> forest). The Maury Isl<strong>and</strong> scenario analyses estimated that the m<strong>in</strong>e development<br />
would result <strong>in</strong> loss <strong>of</strong> $703,000 <strong>in</strong> yearly ecosystem services the follow<strong>in</strong>g year <strong>and</strong> the<br />
residential development scenario would result <strong>in</strong> a loss <strong>of</strong> $548,000.<br />
66
<strong>1.10</strong>.12 FUTURE DIRECTIONS AND PRIORITY MANAGEMENT NEEDS<br />
Increas<strong>in</strong>g dem<strong>and</strong> for spatial representations <strong>of</strong> ecosystem attributes (both human <strong>and</strong><br />
non-human characteristics) to support environmental characterizations, assessment <strong>and</strong><br />
management plann<strong>in</strong>g <strong>in</strong>clud<strong>in</strong>g mar<strong>in</strong>e spatial plann<strong>in</strong>g are expected to lead to more<br />
comprehensive mapp<strong>in</strong>g programs. In Europe, the European Commission is develop<strong>in</strong>g broadscale<br />
maps for the Baltic, North, Celtic <strong>and</strong> western Mediterranean Seas. This project<br />
(EUSeaMap) builds upon the outputs <strong>of</strong> previous mapp<strong>in</strong>g efforts as presented <strong>in</strong> this chapter to<br />
produce harmonized EUNIS maps across the four regions. In the U.S., President Obama’s Ocean<br />
Policy Task Force released its Interim Framework for Effective Coastal <strong>and</strong> Mar<strong>in</strong>e Spatial<br />
Plann<strong>in</strong>g <strong>in</strong> 2009. The framework recommends a comprehensive, <strong>in</strong>tegrated approach to<br />
plann<strong>in</strong>g <strong>and</strong> manag<strong>in</strong>g uses <strong>and</strong> activities us<strong>in</strong>g the Large Mar<strong>in</strong>e Ecosystem or sub-divisions <strong>of</strong><br />
LME’s as management units. This major <strong>in</strong>itiative will require significant spatial data gather<strong>in</strong>g,<br />
<strong>in</strong>tegration <strong>and</strong> analyses to support the work <strong>of</strong> regional plann<strong>in</strong>g teams to provide <strong>in</strong>formation<br />
on:<br />
1.) important physical <strong>and</strong> ecological patterns <strong>and</strong> processes (e.g., basic habitat distributions<br />
<strong>and</strong> critical habitat functions) that occur <strong>in</strong> the plann<strong>in</strong>g area, <strong>in</strong>clud<strong>in</strong>g their response to<br />
chang<strong>in</strong>g conditions;<br />
2.) the ecological condition <strong>and</strong> relative ecological importance or values <strong>of</strong> areas with<strong>in</strong> the<br />
plann<strong>in</strong>g area, us<strong>in</strong>g regionally-developed evaluation <strong>and</strong> prioritization schemes;<br />
3.) the relationships <strong>and</strong> l<strong>in</strong>kages with<strong>in</strong> <strong>and</strong> among regional ecosystems <strong>and</strong> the impacts <strong>of</strong><br />
anticipated human uses on those connections;<br />
67
4.) the spatial distribution <strong>of</strong>, <strong>and</strong> conflicts <strong>and</strong> compatibilities among, current <strong>and</strong> emerg<strong>in</strong>g<br />
ocean uses <strong>in</strong> the area <strong>and</strong>:<br />
5.) important ecosystem services <strong>in</strong> the area, <strong>and</strong> their vulnerability or resilience to the<br />
effects <strong>of</strong> human uses, natural hazards, <strong>and</strong> global climate change;<br />
Examples <strong>of</strong> many <strong>of</strong> these themes are documented here <strong>in</strong> this chapter, yet new spatial<br />
data acquisitions will also be required to support effective decision mak<strong>in</strong>g <strong>in</strong> CMSP.<br />
Furthermore, <strong>in</strong> the U.S. the Ecosystem Services Research Program <strong>of</strong> the Environmental<br />
Protection Agency (EPA) is develop<strong>in</strong>g a national atlas <strong>of</strong> ecosystem services for the United<br />
States to enable decision makers to consider ecosystem services <strong>in</strong> the plann<strong>in</strong>g process (Neale<br />
<strong>and</strong> Lopez 2009). The focus is primarily terrestrial due to the availability <strong>of</strong> satellite data, but<br />
will <strong>in</strong>clude <strong>estuar<strong>in</strong>e</strong> <strong>and</strong> <strong>coastal</strong> regions with ecosystem services classified <strong>in</strong>to broad<br />
categories <strong>of</strong> water quality, quantity, <strong>and</strong> tim<strong>in</strong>g; climate regulation; food, fiber, <strong>and</strong> fuel; storm<br />
surge <strong>and</strong> wave/tidal energy protection; aquatic <strong>and</strong> terrestrial habitat; <strong>and</strong> human health, cultural<br />
values, <strong>and</strong> recreation. The atlas will be an <strong>in</strong>ternet-based product that provides data at multiple<br />
spatial scales <strong>and</strong> will <strong>in</strong>clude historical data, as well as future scenarios.<br />
NOAA’s Coastal Services Center (CSC) <strong>and</strong> the U.S. M<strong>in</strong>erals Management Service<br />
have recently developed an onl<strong>in</strong>e Multipurpose Mar<strong>in</strong>e Cadastre (MMC) to allow users to<br />
visually analyze <strong>and</strong> explore geospatial data for mar<strong>in</strong>e spatial plann<strong>in</strong>g activities. CSC has also<br />
developed an onl<strong>in</strong>e legislative atlas “georegulation” which depicts the spatial "footpr<strong>in</strong>t" <strong>of</strong> the<br />
state <strong>and</strong> federal legislation. In Australia <strong>and</strong> other countries around the world too, mar<strong>in</strong>e<br />
cadastres are be<strong>in</strong>g developed.<br />
68
<strong>1.10</strong>.12.1 L<strong>in</strong>k<strong>in</strong>g Patterns <strong>and</strong> Processes <strong>in</strong> Ecological Classifications<br />
Although considerable progress has been made to develop harmonized hierarchical <strong>and</strong><br />
practical <strong>classifications</strong> at national <strong>and</strong> multi-national levels, our underst<strong>and</strong><strong>in</strong>g <strong>of</strong> the<br />
relationship between the classes del<strong>in</strong>eated <strong>and</strong> the physical environment, especially <strong>in</strong> <strong>of</strong>fshore<br />
<strong>and</strong> deep waters, is still <strong>of</strong>ten limited. A key challenge <strong>in</strong> support <strong>of</strong> EBM is to develop mar<strong>in</strong>e<br />
<strong>and</strong> <strong>coastal</strong> <strong>classifications</strong> that <strong>in</strong>corporate functional characteristics <strong>of</strong> the environment that can<br />
be used to assess the health <strong>of</strong> the ecosystem <strong>and</strong> its response to disturbance. This can be<br />
challeng<strong>in</strong>g, for example, classify<strong>in</strong>g <strong>and</strong> mapp<strong>in</strong>g dynamic water circulation patterns presents<br />
certa<strong>in</strong> problems when represent<strong>in</strong>g spatial dynamics unless spatially persistent features exist at<br />
discrete locations. Likewise, the direct spatial characterization <strong>of</strong> ecological processes such as<br />
predator-prey dynamics can also be challeng<strong>in</strong>g unless more structurally obvious surrogates can<br />
be identified.<br />
In the mapp<strong>in</strong>g <strong>of</strong> seascape types, further research is needed to guide the <strong>in</strong>tegration <strong>of</strong><br />
biotic <strong>and</strong> abiotic data <strong>and</strong> the comb<strong>in</strong><strong>in</strong>g <strong>of</strong> pelagic <strong>and</strong> benthic seascapes, s<strong>in</strong>ce <strong>of</strong>ten very little<br />
is known about pelagic-benthic coupl<strong>in</strong>g <strong>and</strong> the relative importance <strong>of</strong> the measured variables<br />
that are <strong>in</strong>cluded <strong>in</strong> the classification. Often variable <strong>in</strong>clusion is based on data availability rather<br />
than the ecological significance <strong>in</strong> describ<strong>in</strong>g the system. It is crucial to characterize seascapes <strong>in</strong><br />
an ecologically mean<strong>in</strong>gful way that will <strong>in</strong>crease the efficacy <strong>of</strong> decision mak<strong>in</strong>g <strong>and</strong> better<br />
underst<strong>and</strong> the environmental drivers <strong>of</strong> change, identify rare <strong>and</strong> special <strong>in</strong>terest areas, predict<br />
the distribution <strong>of</strong> biodiversity <strong>and</strong> establish appropriate levels <strong>of</strong> protection. Clearly, the data<br />
needs for effective MSP are extensive, the Massachusetts Ocean Management Plann<strong>in</strong>g process<br />
identified key <strong>in</strong>formation needs for development <strong>of</strong> <strong>classifications</strong> that <strong>in</strong>cluded the<br />
69
cont<strong>in</strong>uation <strong>of</strong> high resolution seafloor bathymetric mapp<strong>in</strong>g <strong>and</strong> benthic habitat mapp<strong>in</strong>g to<br />
ensure that special, sensitive, or unique <strong>estuar<strong>in</strong>e</strong> <strong>and</strong> mar<strong>in</strong>e life <strong>and</strong> habitats could be identified<br />
<strong>and</strong> protected, habitat evaluation methodology can be ref<strong>in</strong>ed <strong>and</strong> ecosystem values <strong>and</strong> services<br />
can be evaluated <strong>and</strong> mapped. Where data is available <strong>in</strong>creased data shar<strong>in</strong>g <strong>and</strong> development <strong>of</strong><br />
data portals with detailed metadata will facilitate the effective application <strong>of</strong> spatial data <strong>in</strong><br />
mar<strong>in</strong>e spatial management. In addition, more <strong>in</strong>formation is needed to better underst<strong>and</strong> the<br />
temporal variability <strong>of</strong> seascape characteristics <strong>and</strong> to assess their vulnerability to perturbations,<br />
resilience <strong>and</strong> recovery times.<br />
Where spatial data gaps exist, spatial predictive model<strong>in</strong>g is emerg<strong>in</strong>g as an accurate <strong>and</strong><br />
cost-effective tool to fill spatial <strong>in</strong>formation gaps <strong>and</strong> help elucidate on macroecological drivers<br />
<strong>in</strong> support <strong>of</strong> decision mak<strong>in</strong>g <strong>in</strong> mar<strong>in</strong>e <strong>and</strong> <strong>coastal</strong> management (Leathwick et al. 2008, Pittman<br />
et al. 2009, Valavanis et al. 2008). L<strong>and</strong>scape ecology concepts <strong>and</strong> tools <strong>of</strong>fer great promise <strong>in</strong><br />
determ<strong>in</strong><strong>in</strong>g the ecological relevance <strong>of</strong> the spatial pattern<strong>in</strong>g depicted <strong>in</strong> seascape maps<br />
<strong>in</strong>clud<strong>in</strong>g functional connectivity, synergistic <strong>in</strong>teractions among adjacent seascape types such as<br />
complementation effects <strong>and</strong> other functions <strong>of</strong> multiple seascape types. L<strong>and</strong>scape ecology has<br />
developed analytical techniques such as pattern metrics specifically for quantify<strong>in</strong>g the spatial<br />
complexity <strong>in</strong> l<strong>and</strong>scape or seascape composition, spatial configuration (Robb<strong>in</strong>s <strong>and</strong> Bell 1994,<br />
Wedd<strong>in</strong>g et al. <strong>in</strong> press). Furthermore, a new generation <strong>of</strong> surface metrics can be applied to<br />
exam<strong>in</strong>e the three-dimensional spatial gradients <strong>in</strong> surface morphology <strong>of</strong> the environment<br />
(Pittman et al. 2009; Pittman & Brown <strong>in</strong> press). Mar<strong>in</strong>e <strong>and</strong> terrestrial regions are typically<br />
<strong>in</strong>terl<strong>in</strong>ked through ecosystem flows such as run-<strong>of</strong>f, fish<strong>in</strong>g pressure <strong>and</strong> other direct human<br />
activity that can be a function <strong>of</strong> population density, therefore <strong>classifications</strong> <strong>and</strong> data products<br />
<strong>in</strong>clud<strong>in</strong>g decision mak<strong>in</strong>g must rapidly move toward an <strong>in</strong>tegrated l<strong>and</strong>-sea spatial plann<strong>in</strong>g<br />
70
approach. New <strong>classifications</strong> will be required that represent l<strong>and</strong>-sea <strong>in</strong>teractions <strong>and</strong> are<br />
spatially seamless between l<strong>and</strong>scapes <strong>and</strong> seascapes.<br />
<strong>1.10</strong>.12.2 Underst<strong>and</strong><strong>in</strong>g <strong>and</strong> Communicat<strong>in</strong>g Errors <strong>and</strong> Uncerta<strong>in</strong>ty<br />
An important challenge for management is to ensure that decision mak<strong>in</strong>g where<br />
ecological goals <strong>and</strong> objectives are central, such as conservation prioritization, are objective <strong>and</strong><br />
science driven <strong>and</strong> not driven primarily by data availability or technological advancement. In<br />
reality the desire for a rapid, quantitative <strong>and</strong> defensible approach can sometimes override<br />
uncerta<strong>in</strong>ty <strong>in</strong> the data. Very rarely are the uncerta<strong>in</strong>ties quantified <strong>and</strong> communicated <strong>in</strong> a<br />
spatially explicit way before mar<strong>in</strong>e <strong>classifications</strong> are applied <strong>in</strong> management. For robust<br />
decision mak<strong>in</strong>g to take place, more effort must be focused on evaluat<strong>in</strong>g data errors, bias <strong>and</strong><br />
uncerta<strong>in</strong>ty <strong>and</strong> this will become very important <strong>in</strong> MSP where a diverse array <strong>of</strong> spatial datasets<br />
are be<strong>in</strong>g assembled together with novel untested procedures for develop<strong>in</strong>g classified maps.<br />
Uncerta<strong>in</strong>ty comes <strong>in</strong> a variety <strong>of</strong> forms <strong>and</strong> representations <strong>and</strong> requires different techniques for<br />
presentation. It is important to acknowledge that a classification scheme is a model <strong>of</strong> reality <strong>and</strong><br />
<strong>in</strong> many cases is a 2 nd or even 3 rd derivative <strong>of</strong> the orig<strong>in</strong>al data. Mis<strong>classifications</strong> occur <strong>and</strong> can<br />
be due to spatial accuracy, observer bias, environmental variability, process<strong>in</strong>g techniques,<br />
thematic, temporal <strong>and</strong> spatial resolution, etc. Some will say that all maps are a “lie” <strong>and</strong> that<br />
decisions can be made at various stages to make maps “lie” (Monmonier 1996). Inevitably some<br />
maps represent more <strong>of</strong> the true reality than others. Error is particularly problematic when a<br />
highly dynamic system is represented by a static map, yet management decisions will <strong>and</strong> must<br />
be made on best-available data. As noted by Alfred Russell Wallace <strong>in</strong> 1876 “noth<strong>in</strong>g like a<br />
71
perfect zoological division <strong>of</strong> the earth is possible. The causes that have led to the present<br />
distribution <strong>of</strong> animal life are so varied, their action <strong>and</strong> reaction have been so complex, that<br />
anomalies <strong>and</strong> irregularities are sure to exist which will mar the symmetry <strong>of</strong> any rigid system”.<br />
Acknowledgements<br />
We thank the editors <strong>of</strong> this Treatise for <strong>in</strong>vit<strong>in</strong>g this contribution. We are grateful to the<br />
progressive work <strong>of</strong> government agencies around the world for provid<strong>in</strong>g such a wealth <strong>of</strong><br />
examples from which to demonstrate the applications <strong>of</strong> <strong>coastal</strong> <strong>and</strong> mar<strong>in</strong>e <strong>classifications</strong>. We<br />
thank the many people who have provided permission for us to present their products <strong>in</strong> our<br />
chapter.<br />
References<br />
Al-Hamdani, Z.K., <strong>and</strong> Reker, J. (eds.). 2007. Towards mar<strong>in</strong>e l<strong>and</strong>scapes <strong>in</strong> the Baltic Sea.<br />
BALANCE <strong>in</strong>terim report 10, 116 pp. http://balance-eu.org/<br />
Al-Hamdani, Z.K., Reker, J., Leth, J.O., Reijonen, A., Kotila<strong>in</strong>en, A.T., D<strong>in</strong>esen, G.E. 2007.<br />
Development <strong>of</strong> mar<strong>in</strong>e l<strong>and</strong>scape maps for the Baltic Sea <strong>and</strong> the Kattegat us<strong>in</strong>g geophysical<br />
<strong>and</strong> hydrographical parameters. Review <strong>of</strong> Survey activities 2006. Geological Survey <strong>of</strong><br />
Denmark <strong>and</strong> Greenl<strong>and</strong> Bullet<strong>in</strong> 13, 61-64.<br />
Alongi, D.M. 2008. Mangrove forests: Resilience, protection from tsunamis <strong>and</strong> responses to<br />
global climate change. Estuar<strong>in</strong>e, Coastal <strong>and</strong> Shelf Science 76(1), 1-13.<br />
72
Arundel, H. <strong>and</strong> Mount, R. 2007. National Estuar<strong>in</strong>e Environmental Condition Assessment<br />
Framework Round Table Report, Deak<strong>in</strong> University <strong>and</strong> University <strong>of</strong> Tasmania, prepared for<br />
the National L<strong>and</strong> & Water Resources Audit, Canberra, 55 pp.<br />
Ball, I.R., Poss<strong>in</strong>gham, H.P. 2000. MARXAN (V1.8.2): Mar<strong>in</strong>e Reserve Design Us<strong>in</strong>g<br />
Spatially Explicit Anneal<strong>in</strong>g, a manual prepared for the Great Barrier Reef Mar<strong>in</strong>e Park<br />
Authority. http://www.uq.edu.au/marxan/docs/marxan_manual_1_8_2.pdf, 70 pp.<br />
Barras, J., Beville, S., Britsch, D., Hartley, S., Hawes, S., Johnston, J., Kemp, P., K<strong>in</strong>ler, Q.,<br />
Martucci, A., Porthouse, J., Reed, D., Roy, K., Sapkota, S., Suhayda, J. 2003. Historical <strong>and</strong><br />
projected <strong>coastal</strong> Louisiana l<strong>and</strong> changes: 1978-2050: USGS Open File Report 03-334, 39 p.<br />
(Revised January 2004).<br />
Barbier, E.P., Koch, E.W., Silliman, B.R., Hacker, S.D., Wolanski, E., Primavera, J.H., Granek,<br />
E.F., Polasky, S., Aswani, S., Cramer, L.A., Stoms, D.M., Kennedy, C.J., Bael, D., Kappel, C.V.,<br />
Perillo, G. M. E., Reed, D.J. 2008. Coastal ecosystem-based management with nonl<strong>in</strong>ear<br />
ecological functions <strong>and</strong> values. Science 320, 321-323.<br />
Beaumont, N.J., Austen, M.C., Atk<strong>in</strong>s, J., Burdon, D., Degraer, S. Dent<strong>in</strong>ho, T.P., Derous, S.,<br />
Holm, P., Horton, T., vanIerl<strong>and</strong>, E., Marboe, A.H., Starkey, D.J., Townsend, M., Zarzycki, T.,<br />
2007. Identification, def<strong>in</strong>ition <strong>and</strong> quantification <strong>of</strong> goods <strong>and</strong> services provided by mar<strong>in</strong>e<br />
biodiversity: Implications for the ecosystem approach. Mar<strong>in</strong>e Pollution Bullet<strong>in</strong> 54, 253–265.<br />
Birch, G. F., Olmos, M. 2008. Sediment-bound heavy metals as <strong>in</strong>dicators <strong>of</strong> human <strong>in</strong>fluence<br />
<strong>and</strong> biological risk <strong>in</strong> <strong>coastal</strong> water bodies. Journal <strong>of</strong> Mar<strong>in</strong>e Science 65, 1407-1413.<br />
Boyes, S., Elliott, M., Thomson, S.M., Atk<strong>in</strong>s, S., Gillil<strong>and</strong>, P. 2007. A proposed multiple-use<br />
zon<strong>in</strong>g scheme for the Irish Sea. An <strong>in</strong>terpretation <strong>of</strong> current legislation through the use <strong>of</strong> GIS<br />
based zon<strong>in</strong>g approaches <strong>and</strong> effectiveness for the protection <strong>of</strong> nature conservation <strong>in</strong>terests.<br />
Mar<strong>in</strong>e Policy 31, 287-298.<br />
73
Bra<strong>in</strong>ard, R., Asher, J., Grove, J., Helyer, J., Kenyon, J., Manc<strong>in</strong>i, F., Miller, J., Myhre, S.,<br />
Nadon, M., Rooney, J., Schroeder, R., Smith, E., Vargas-Angel, B., Vogt, S., Vroom, P.,<br />
Balwa<strong>in</strong>, S., Craig, P., DesRochers, A., Ferguson, S., Hoeke, R., Lammers, M., Lundblad, E.,<br />
Maragos, J., M<strong>of</strong>fitt, R., Timmers, M., Vetter, O. 2008. Coral Reef Ecosystem Monitor<strong>in</strong>g<br />
Report for American Samoa: 2002-2006: Honolulu, HI, NOAA Pacific Isl<strong>and</strong>s Fisheries Science<br />
Center, Coral Reef Ecosystem Division, p. 495.<br />
Brown, S.K., Buja K.R., Jury, S.H., Monaco, M.E., Banner, A. 2000. Habitat suitability <strong>in</strong>dex<br />
models for eight fish <strong>and</strong> <strong>in</strong>vertebrate species <strong>in</strong> Casco <strong>and</strong> Sheepscot Bays, Ma<strong>in</strong>e. North<br />
American Journal <strong>of</strong> Fisheries Management 20(2), 408-435.<br />
Bryant, D., Burke, L., McManus, J., Spald<strong>in</strong>g, M. 1998. Reefs at Risk: A map-based <strong>in</strong>dicator <strong>of</strong><br />
threats to the world’s coral reefs. World Resources Institute. 56p.<br />
Chan, K. M. A., Shaw, M.R., Cameron, D.R., Underwood, E.C., Daily, G.C. 2006 Conservation<br />
Plann<strong>in</strong>g for Ecosystem Services. PLoS Biol 4 (11: e379). doi:10.1371/journal.pbio.0040379<br />
Chart<strong>in</strong>g Progress 2: The state <strong>of</strong> UK seas. 2010. Department for Environment Food <strong>and</strong> Rural<br />
Affairs, on behalf <strong>of</strong> the UK Mar<strong>in</strong>e Monitor<strong>in</strong>g <strong>and</strong> Assessment Strategy community, London,<br />
UK. http://chart<strong>in</strong>gprogress.defra.gov.uk/<br />
Christensen, J.D., Jeffrey, C.F.G., Caldow, C., Monaco, M.E., Kendall, M.S., Appledoorn, R.S.,<br />
2003. Cross-shelf habitat utilization patterns <strong>of</strong> reef fishes <strong>in</strong> southwestern Puerto Rico. Gulf <strong>and</strong><br />
Caribbean Research. 14, 9–27.<br />
Cogan, C. B., Todd, B. J., Lawton, P., Noji, T. T. 2009. The role <strong>of</strong> mar<strong>in</strong>e habitat mapp<strong>in</strong>g <strong>in</strong><br />
ecosystem-based management. ICES Journal <strong>of</strong> Mar<strong>in</strong>e Science 66, 2033–2042.<br />
Coltman, N., Gold<strong>in</strong>g, N., Verl<strong>in</strong>g, E. 2008. Develop<strong>in</strong>g a broad scale predictive EUNIS habitat<br />
map for the MESH study area. Jo<strong>in</strong>t Nature Conservation Committee, Peterborough.<br />
74
Connell, J. H. 1978. Diversity <strong>in</strong> tropical ra<strong>in</strong> forests <strong>and</strong> coral reefs. Science 199, 1302–1310.<br />
Connor, D.W., Allen, J.H., Gold<strong>in</strong>g, N., Howell, K.L., Lieberknecht, L.M., Northern, K.O.,<br />
Reker, J.B. 2004. The national mar<strong>in</strong>e habitat classification for Brita<strong>in</strong> <strong>and</strong> Irel<strong>and</strong>. Version<br />
04.05. Jo<strong>in</strong>t Nature Conservation Committee, Peterborough. (<strong>in</strong>ternet version:<br />
www.jncc.gov.uk/Mar<strong>in</strong>eHabitatClassification).<br />
Connor, D.W., Gillil<strong>and</strong>, P.M., Gold<strong>in</strong>g, N, Rob<strong>in</strong>son, P., Todd, D., Verl<strong>in</strong>g, E. 2006.<br />
UKSeaMap: the mapp<strong>in</strong>g <strong>of</strong> seabed <strong>and</strong> water column features <strong>of</strong> UK seas. Jo<strong>in</strong>t Nature<br />
Conservation Committee, Peterborough.<br />
Connor, D.W. 2009. A regional assessment process for assess<strong>in</strong>g the state <strong>of</strong> the mar<strong>in</strong>e<br />
environment. Jo<strong>in</strong>t Nature Conservation Committee, Peterborough.<br />
Craig, P., 1998. Temporal spawn<strong>in</strong>g patterns for several surgeonfishes <strong>and</strong> grasses <strong>in</strong> American<br />
Samoa. Pacific Science, 52, 35-39.<br />
Crowder, L.B., Norse, E.A. 2008. Essential ecological <strong>in</strong>sights for mar<strong>in</strong>e ecosystem-based<br />
management. Mar<strong>in</strong>e Policy 32, 772-778.<br />
Davies, C.E., Moss, D., Hill, M.O. 2004. EUNIS Habitat Classification Revised 2004. European<br />
Topic Centre on Nature Protection <strong>and</strong> Biodiversity, Paris. 310 pp.<br />
Dahl, T.E., Johnson, C.E. 1991. Wetl<strong>and</strong>s--Status <strong>and</strong> trends <strong>in</strong> the conterm<strong>in</strong>ous United States,<br />
mid-1970's to mid-1980's. U.S. Department <strong>of</strong> the Interior, U.S. Fish <strong>and</strong> Wildlife Service,<br />
Wash<strong>in</strong>gton, D.C., 28 p.<br />
Dalrymple, R. W., Zaitl<strong>in</strong>, B. A., Boyd, R. 1992. Estuar<strong>in</strong>e facies models--Conceptual basis <strong>and</strong><br />
stratigraphic implications. Journal <strong>of</strong> Sedimentary Petrology 62, 1130-1146.<br />
75
Day, J.C. 2002. Zon<strong>in</strong>g – lessons from the Great Barrier Reef Mar<strong>in</strong>e Park. Ocean Coast Manage<br />
41, 139–56.<br />
Davies, C.E., Moss, D. 2004. EUNIS Habitat Classification Mar<strong>in</strong>e Habitat Types: Revised<br />
Classification <strong>and</strong> Criteria. Report to the European Topic Centre on Nature Protection <strong>and</strong><br />
Biodiversity/European Environment Agency.<br />
Dean T., Ferdana Z., White J., Tanner, C. 2000. Skagit Estuary Restoration Assessment.<br />
Identify<strong>in</strong>g <strong>and</strong> prioritiz<strong>in</strong>g areas for habitat restoration <strong>in</strong> Puget Sound's largest rural estuary.<br />
http://www.erf.org/news/skagit-estuary-restoration-assessment<br />
De Groot, R.S., Wilson M.A., Boumans R.M.J. 2002. A typology for the classification,<br />
description <strong>and</strong> valuation <strong>of</strong> ecosystem functions, goods <strong>and</strong> services. Ecological Economics 41,<br />
393-408.<br />
Derous, S., Agardy, T., Hillewaert, H., Hostens, K., Jamieson, G., Lieberknecht, L., Mees, J.,<br />
Mouleart, I., Olen<strong>in</strong>, S., Pael<strong>in</strong>ckx, D., Rabaut, M., Rachor, E., R<strong>of</strong>f, J., Stienen, E.W.M., Van<br />
der Wal, J.T., Van Lancker, V., Verfaillie, E., V<strong>in</strong>cx, M., Weslawski, J.M., Degraer, S., 2007. A<br />
concept for biological valuation <strong>in</strong> the mar<strong>in</strong>e environment. Oceanologia 49(1), 99-128.<br />
DOC, 1997. Department <strong>of</strong> Commerce. Magnuson–Stevens Act Provisions: Essential Fish<br />
Habitat (EFH). Federal Register, vol. 62, issue 244, pp. 66531–66559.<br />
Dobson, J. E., Bright, E. A., Ferguson, R. L., Field, D. W., Wood, L. L., Haddad, K. D., Iredale,<br />
III, H., Jensen, J. R., Klemas, V. V., Orth, R. J., Thomas, J. P. 1995. NOAA Coastal Change<br />
Analysis Program (C-CAP): Guidance for Regional Implementation. NOAA/National Mar<strong>in</strong>e<br />
Fisheries Service. NOAA Technical Report NMFS 123.<br />
Duda, A., Sherman, K. 2002. A new imperative for improv<strong>in</strong>g management <strong>of</strong> large mar<strong>in</strong>e<br />
ecosystems. Ocean <strong>and</strong> Coastal Management 45, 797-833.<br />
76
Duke. N.C., Meynecke, J.O., Dittmann, S., Ellison, A.M., Anger, K., Berger, U., Cannicci, S.,<br />
Diele, K., Ewel, K.C., Field, C.D., Koedam, N., Lee, S.Y., March<strong>and</strong>, C., Nordhaus, I.,<br />
Dahdouh-Guebas, F. 2007. A world without mangroves? Science 317 (5834), 41-2.<br />
Dunn<strong>in</strong>g, J.B., Danielson, B.J., Pulliam, H.R. 1992. Ecological processes that affect populations<br />
<strong>in</strong> complex l<strong>and</strong>scapes. Oikos 65, 169-175.<br />
Eastwood, P.D., Souissi, S., Rogers S,I., Coggan, R.A, Brown C.J. 2006. Mapp<strong>in</strong>g seabed<br />
assemblages us<strong>in</strong>g comparative top-down <strong>and</strong> bottom-up classification approaches. Canadian<br />
Journal <strong>of</strong> Fisheries <strong>and</strong> Aquatic Sciences 63(7), 1536-1548.<br />
Eastwood, P. D., Mills, C. M., Aldridge, J. N., Houghton, C. A., Rogers, S. I. 2007. Human<br />
activities <strong>in</strong> UK <strong>of</strong>fshore waters: an assessment <strong>of</strong> direct, physical pressure on the seabed. ICES<br />
Journal <strong>of</strong> Mar<strong>in</strong>e Science 64, 453–463.<br />
Ekebom, J., Jäänheimo, Reker J. (editors). 2008. Towards mar<strong>in</strong>e spatial plann<strong>in</strong>g <strong>in</strong> the Baltic<br />
Sea. Balance Technical Summary Report 4/4. Geological Survey <strong>of</strong> Denmark <strong>and</strong> Greenl<strong>and</strong>.<br />
Copenhagen, Denmark, 34 pp.<br />
Elith, J., Graham, C.H., Anderson, R.P., Dudík, M., Ferrier, S., Guisan, A., Hijmans, R.J.,<br />
Huettmann, F., Leathwick, J.R., Lehmann, A., Li, J., Lohmann, L.G., Loiselle, B.A., Manion, G.,<br />
Moritz, C., Nakamura, M., Nakazawa, Y., Overton, J. McC. M., Peterson, A.T., Phillips, S.J.,<br />
Richardson, K., Scachetti-Pereira, R., Schapire, R.E., Soberón, J., Williams, S., Wisz, M.S.,<br />
Zimmermann, N.E. 2006 Novel methods improve prediction <strong>of</strong> species’ distributions from<br />
occurrence data. Ecography 29, 129–151.<br />
Fassnacht, K.S., Cohen, W.B., Spies, T.A. 2006. Key issues <strong>in</strong> mak<strong>in</strong>g <strong>and</strong> us<strong>in</strong>g satellite-based<br />
maps <strong>in</strong> ecology: A primer. Forest Ecology <strong>and</strong> Management 222, 167-181.<br />
Fenner, D., Speicher, M., Gulick, S., Aeby, G., Aletto, S.C., Anderson, P., Carroll, B., DiDonato, E.,<br />
DiDonato, G., Farmer, V., Gove, J., Houk, P., Lundblad, E., Nadon, M., Riolo, F., Sabater, M.,<br />
77
Schroeder, R., Smith, E., Tuitele, C., Tagar<strong>in</strong>o, A., Vaitautolu, S., Vaoli, E., Vargas-Angel, B., Vroom,<br />
P. 2008. The state <strong>of</strong> coral reef ecosystems <strong>of</strong> American Samoa. In (eds.), The State <strong>of</strong> Coral Reef<br />
Ecosystems <strong>of</strong> the United States <strong>and</strong> Pacific Freely Associated States: 2008, ed. J.M. Wadell <strong>and</strong> A.M.<br />
Clark. NOAA Technical Memor<strong>and</strong>um NOS NCCOS 73. NOAA/NCCOS Center for Coastal<br />
Monitor<strong>in</strong>g <strong>and</strong> Assessment’s Biogeography Team. Silver Spr<strong>in</strong>g, MD, pp 307-351.<br />
Ferrier, S., B. A. W<strong>in</strong>tle. 2009. Quantitative approaches to spatial conservation prioritization: match<strong>in</strong>g<br />
the solution to the need. In Spatial Conservation Prioritization, Quantitative Methods <strong>and</strong> Computational<br />
Tools, ed. A. Moilanen, K. A. Wilson <strong>and</strong> H. P. Poss<strong>in</strong>gham, 1-15. Oxford, UK: Oxford University<br />
Press.<br />
Fisheries <strong>and</strong> Ocean Canada (DFO). 2004. Identification <strong>of</strong> ecologically <strong>and</strong> biologically sensitive areas.<br />
DFO Canada Science Advisory Section Ecosystem Status Report 2004/006.<br />
Fraschetti, S., Terlizzi, S. Boero, F. 2008. How many habitats are there <strong>in</strong> the sea (<strong>and</strong> where)? Journal<br />
<strong>of</strong> Experimental Mar<strong>in</strong>e Biology <strong>and</strong> Ecology 366(1-2), 109-115.<br />
Geselbracht, L., Torres, R., Cumm<strong>in</strong>g, G.S., Dorfman, D., Beck, M., Shaw, D. 2009.<br />
Identification <strong>of</strong> a spatially efficient portfolio <strong>of</strong> priority conservation sites <strong>in</strong> <strong>estuar<strong>in</strong>e</strong> areas <strong>of</strong><br />
Florida. Aquatic Conservation: Mar<strong>in</strong>e <strong>and</strong> Freshwater Ecosystems 19, 408-420.<br />
Gilman, E., Ellison, J.C., Duke N.C., Field, C. 2008. Threats to mangroves from climate change<br />
<strong>and</strong> adaptation options: A Review. Aquatic Botany 89 (2), 237-250.<br />
Gillil<strong>and</strong>, P.M. <strong>and</strong> Laffoley D. 2008. Key elements <strong>and</strong> steps <strong>in</strong> the process <strong>of</strong> develop<strong>in</strong>g<br />
ecosystem-based mar<strong>in</strong>e spatial plann<strong>in</strong>g. Mar<strong>in</strong>e Policy 32, 787-796.<br />
Giri, C.P., Zhu, Z., Tieszen, L.L., S<strong>in</strong>gh, A., Gillette, S., Kelmelis, J.A., 2008. Mangrove forest<br />
distributions <strong>and</strong> dynamics (1975-2005) <strong>of</strong> the tsunami-affected region <strong>of</strong> Asia. Journal <strong>of</strong><br />
Biogeography 35(3), 519-528.<br />
78
Green, A.L., C.E. Birkel<strong>and</strong>, R.H. R<strong>and</strong>all, 1999. Twenty years <strong>of</strong> disturbance <strong>and</strong> change <strong>in</strong><br />
Fagatele Bay National Mar<strong>in</strong>e Sanctuary, American Samoa. Pacific Science 53(4), 376-400.<br />
Grober-Dunsmore, R., Frazer, T.K., L<strong>in</strong>dberg, W.J., Beets, J.P. 2007. Reef fish <strong>and</strong> habitat<br />
relationships <strong>in</strong> a Caribbean seascape: the importance <strong>of</strong> reef context. Coral Reefs 26(1), 201–<br />
216.<br />
Grober-Dunsmore, R., Frazer, T.K., Beets, J.P., L<strong>in</strong>dberg, W.J., Zwick, P., Funicelli, N. 2008.<br />
Influence <strong>of</strong> l<strong>and</strong>scape structure on reef fish assemblages. L<strong>and</strong>scape Ecology 23, 37-53.<br />
Guisan, A., Weiss, S.B., Weiss, A.D. 1999. GLM versus CCA spatial model<strong>in</strong>g <strong>of</strong> plant species<br />
distribution. Plant Ecology 143, 107-122.<br />
Gundlach, E.R. <strong>and</strong> Hayes, M.O. 1978. Vulnerability <strong>of</strong> <strong>coastal</strong> environments to oil spill<br />
impacts. Mar<strong>in</strong>e Technology Society Journal 12(4), 18-27.<br />
Hall, K., Paramor, O.A.L., Rob<strong>in</strong>son, L.A., W<strong>in</strong>row-Giff<strong>in</strong>, A., Frid, C.L.J., Eno, N.C., Dernie,<br />
K.M., Sharp, R.A.M., Wyn, G.C., Ramsey, K. 2008. Mapp<strong>in</strong>g the sensitivity <strong>of</strong> benthic habitats<br />
to fish<strong>in</strong>g <strong>in</strong> Welsh waters – development <strong>of</strong> a protocol. University <strong>of</strong> Liverpool <strong>and</strong> Countryside<br />
Council for Wales (CCW Policy Research Report No. 08/12).<br />
Halpern, B.S., Selkoe, K.A., Micheli, F., Kappel, C.V. 2007. Evaluat<strong>in</strong>g <strong>and</strong> rank<strong>in</strong>g the<br />
vulnerability <strong>of</strong> mar<strong>in</strong>e ecosystems to anthropogenic threats. Conservation Biology 21, 1301–<br />
1315.<br />
Halpern, B.S., Walbridge, S., Selkoe, K.A., Kappel, C.V., Micheli, F., D’Agrosa, C., Bruno, J.F.,<br />
Casey, K.S., Ebert, C., Fox, H.E., Fujita, R., He<strong>in</strong>emann, D., Lenihan, H.S., Mad<strong>in</strong>, E.M.P.,<br />
Perry, M.T., Selig, E.R., Spald<strong>in</strong>g, M., Steneck, R., Watson, R. 2008. A global map <strong>of</strong> human<br />
impact on mar<strong>in</strong>e ecosystems. Science 319, 948–952.<br />
79
Harborne, A. R., Mumby, P.J., Kappel, C.V., Dahlgren, C.P., Micheli,F., Holmes, K.E.,<br />
Brumbaugh, D.R. 2008. Tropical <strong>coastal</strong> habitats as surrogates <strong>of</strong> fish community structure,<br />
graz<strong>in</strong>g <strong>and</strong> fisheries value. Ecological <strong>Application</strong>s 18, 1689–1701.<br />
Harris, P. T., Heap, A. D., Bryce, S. M., Porter-Smith, R., Ryan, D. A., Heggie, D. T. 2002.<br />
Classification <strong>of</strong> Australian clastic <strong>coastal</strong> depositional environments based on a quantitative<br />
analysis <strong>of</strong> wave, tide <strong>and</strong> river power. Journal <strong>of</strong> Sedimentary Research: 72, 858–870.<br />
Harris, P. T., Heap, A. D. 2003. Environmental management <strong>of</strong> clastic <strong>coastal</strong> depositional<br />
environments: <strong>in</strong>ferences from an Australian geomorphic database. Ocean <strong>and</strong> Coastal<br />
Management 46, 457-478.<br />
Harris, P.T., 2007, <strong>Application</strong>s <strong>of</strong> geophysical <strong>in</strong>formation to the design <strong>of</strong> a representative<br />
system <strong>of</strong> Mar<strong>in</strong>e Protected Areas <strong>in</strong> southeastern Australia, <strong>in</strong> Todd, B.J., <strong>and</strong> Greene, H.G.,<br />
eds., Mapp<strong>in</strong>g the Seafloor for Habitat Characterization: Geological Association <strong>of</strong> Canada,<br />
Special Paper 47, p. 463-482.<br />
Harris, P.T. (unpublished at time <strong>of</strong> writ<strong>in</strong>g) On seabed disturbance, mar<strong>in</strong>e ecological<br />
succession <strong>and</strong> applications for environmental management: a physical sedimentological<br />
perspective. Sedimentology.<br />
Heap, A., Bryce, S., Ryan, D., Radke, L., Smith, C., Harris, P., Heggie, D. 2001. Australian<br />
estuaries <strong>and</strong> <strong>coastal</strong> waterways: A geoscience perspective for improved resource management,<br />
Australian Geological Survey Organisation, Canberra.<br />
Hefner, J.M., Brown, J.D. 1985. Wetl<strong>and</strong> Trends <strong>in</strong> the Southeastern United States. Wetl<strong>and</strong>s 4,<br />
1-12.<br />
Heyman, W., Kjerfve, B. 1999. Hydrological <strong>and</strong> oceanographic considerations for <strong>in</strong>tegrated<br />
<strong>coastal</strong> zone management <strong>in</strong> southern Belize. Environmental Management 24(2), 229-245.<br />
80
Hidd<strong>in</strong>k, J. G., Jenn<strong>in</strong>gs, S., Kaiser, M. J. 2007. Assess<strong>in</strong>g <strong>and</strong> predict<strong>in</strong>g the relative ecological<br />
impacts <strong>of</strong> disturbance on habitats with different sensitivities. Journal <strong>of</strong> Applied Ecology 44,<br />
405–413.<br />
Hirzel, A.H., Guisan, A. 2002. “Which is the optimal sampl<strong>in</strong>g strategy for habitat suitability<br />
modell<strong>in</strong>g?” Ecological Modell<strong>in</strong>g 157, 331-341.<br />
Hiscock, K., Elliott, M., Laffoley, D., Rogers, S. 2003. Data use <strong>and</strong> <strong>in</strong>formation creation:<br />
challenges for mar<strong>in</strong>e scientists <strong>and</strong> for managers. Mar<strong>in</strong>e Pollution Bullet<strong>in</strong> 46(5), 534-541.<br />
Hiscock, K., Tyler-Walters, H. 2006. Assess<strong>in</strong>g the sensitivity <strong>of</strong> seabed species <strong>and</strong> biotopes –<br />
The Mar<strong>in</strong>e Life Information Network (MarLIN). Hydrobiologia 555, 309–320.<br />
Hobday, A.J., Okey, T.A., Poloczanska, E.S., Kunz, T.J., Richardson, A.J., (eds). 2006. Impacts<br />
<strong>of</strong> climate change on Australian mar<strong>in</strong>e life: Part A. Executive Summary. Report to the<br />
Australian Greenhouse Office, Canberra, Australia. September 2006, 36 pp.<br />
(http://www.climatechange.gov.au/impacts/publications/pubs/mar<strong>in</strong>elife-parta.pdf).<br />
Hogrefe, K.R. 2008. Derivation <strong>of</strong> Near-shore Bathymetry from Multispectral Satellite Imagery<br />
Used <strong>in</strong> a Coastal Terra<strong>in</strong> Model for the Topographic Analysis <strong>of</strong> Human Influence on Coral<br />
Reefs. M.S. Thesis, Oregon State University, Corvallis, OR. http://mar<strong>in</strong>e<strong>coastal</strong>gis.net/kyle08<br />
(Last accessed 7 September 2009).<br />
Hope, B.K. 2006. An exam<strong>in</strong>ation <strong>of</strong> ecological risk assessment <strong>and</strong> management practices.<br />
Environment International 32, 983–995.<br />
Jenn<strong>in</strong>gs, S., D<strong>in</strong>more, T. A., Duplisea, D. E., Warr, K. J., Lancaster, J. E. 2001. Trawl<strong>in</strong>g<br />
disturbance can modify benthic production processes. Journal <strong>of</strong> Animal Ecology 70, 459–475.<br />
81
Jenn<strong>in</strong>gs, S., Cotter, A. J. R. 1999. Fish<strong>in</strong>g effects <strong>in</strong> northeast Atlantic shelf seas: patterns <strong>in</strong><br />
fish<strong>in</strong>g effort, diversity <strong>and</strong> community structure. 1. Introduction. Fisheries Research 40, 103–<br />
106.<br />
Jones, K., Heggmem, D.T., Wade, T.G., Neale, A.C., Ebert, D.W., Nash, M.S., Mehaffey, M.H.,<br />
Hermann, K.A., Selle, A.R., August<strong>in</strong>e, S., Goodman, I.A., Pederson, J., Bolgrien, D., Viger,<br />
J.M., Chiang, D., L<strong>in</strong>, C.J., Zhong, Y., Baker, J., Van Remortel, R.D. 2000. Assess<strong>in</strong>g l<strong>and</strong>scape<br />
conditions relative to water resources <strong>in</strong> the western United States: A strategic approach,<br />
Environmental Monitor<strong>in</strong>g <strong>and</strong> Assessment 64, 227-245.<br />
Kendall, M.S., Kruer, C.R., Buja, K.R., Christensen, J.D., F<strong>in</strong>kbe<strong>in</strong>er, M., Warner, R.A.,<br />
Monaco, M.E., 2002. Methods used to map the benthic habitats <strong>of</strong> Puerto Rico <strong>and</strong> the U.S.<br />
Virg<strong>in</strong> Isl<strong>and</strong>s. In: NOAA Technical Memor<strong>and</strong>um, vol. 152. Silver Spr<strong>in</strong>g, Maryl<strong>and</strong>, p. 45.<br />
Kendall, M.S., Christensen, J., Hillis-Starr, J., 2003. Multi-scale data used to analyze the spatial<br />
distribution <strong>of</strong> French grunts, Haemulon flavol<strong>in</strong>eatum, relative to hard <strong>and</strong> s<strong>of</strong>t bottom <strong>in</strong> a<br />
benthic l<strong>and</strong>scape. Environmental Biology <strong>of</strong> Fishes 66, 19–26.<br />
Kendall, M.S., Thomas, M. 2008. The <strong>in</strong>fluence <strong>of</strong> thematic <strong>and</strong> spatial resolution on maps <strong>of</strong> a<br />
coral reef ecosystem. Mar<strong>in</strong>e Geodesy 31, 75-102.<br />
Kennish, M. J., Bricker, S.B., Dennison, W.C., Glibert, P.M., Liv<strong>in</strong>gston, R.J., Moore, K.A.,<br />
Noble, R.T., Paerl, H.W., Ramstack, J.M., Seitz<strong>in</strong>ger, S., Tomasko, D.A., I. Valiela. 2007.<br />
Barnegat Bay-Little Egg Harbor Estuary: case study <strong>of</strong> a highly eutrophic <strong>coastal</strong> bay system.<br />
Ecological <strong>Application</strong>s 17(5), Supplement: S3-S16.<br />
Knudby, A., LeDrew E., Brenn<strong>in</strong>g A. 2010. Predictive mapp<strong>in</strong>g <strong>of</strong> reef fish species richness,<br />
diversity <strong>and</strong> biomass <strong>in</strong> Zanzibar us<strong>in</strong>g IKONOS imagery <strong>and</strong> mach<strong>in</strong>e-learn<strong>in</strong>g techniques.<br />
Remote Sens<strong>in</strong>g <strong>of</strong> Environment 114 (6), 1230-1241.<br />
82
Kostylev, V., Todd, B.J., Fader, G.B.J., Courtney, R.C., Cameron, G.D.M., Pickrill, R.A. 2001.<br />
Benthic habitat mapp<strong>in</strong>g on the Scotian Shelf based on multibeam bathymetry, surficial geology<br />
<strong>and</strong> sea floor photographs. Mar<strong>in</strong>e Ecology Progress Series 219, 121-137.<br />
Krause, J. C., Boedeker, D., Backhausen, I., He<strong>in</strong>icke, K., Groß, A., von Nordheim, H. 2006.<br />
Rationale beh<strong>in</strong>d site selection for the NATURA 2000 network <strong>in</strong> the German EEZ. In Progress<br />
<strong>in</strong> Natura 2000 sites <strong>and</strong> fisheries <strong>in</strong> German <strong>of</strong>fshore waters. Mar<strong>in</strong>e Conservation <strong>in</strong> Europe:<br />
Natura, pp. 65–95. Ed. by H. von Nordheim, D. Boedeker, <strong>and</strong> J. C. Krause. Spr<strong>in</strong>ger Verlag,<br />
Heidelberg. 263 pp.<br />
Lathrop, R.G., Bognar, J.A., Hendrickson, A.C., P.D. Bowers. 1999. Data Synthesis Effort for<br />
the Barnegat Bay Estuary Program: Habitat Loss <strong>and</strong> Alteration <strong>in</strong> the Barnegat Bay Region.<br />
Center for Remote Sens<strong>in</strong>g & Spatial Analysis, Rutgers University, New Brunswick, NJ.<br />
http://www.crssa.rutgers.edu/projects/runj/datasnth.html<br />
Lathrop, R.G, Bognar, J.A. 2001. Habitat Loss <strong>and</strong> Alteration <strong>in</strong> the Barnegat Bay<br />
Region. Journal <strong>of</strong> Coastal Research SI 32, 212-228.<br />
Leathwick, J., Moilanen, A., Francis, M., Elith, J., Taylor, P., Julian, K., Hastie, T., Duffy, C.<br />
2008. Design <strong>and</strong> evaluation <strong>of</strong> large-scale mar<strong>in</strong>e protected areas. Conservation Letters 1, 92-<br />
101.<br />
Leslie, H., Ruckelshaus, M., Ball, I.R., Andelman, S., Poss<strong>in</strong>gham, H.P. 2003. Us<strong>in</strong>g sit<strong>in</strong>g<br />
algorithms <strong>in</strong> the design <strong>of</strong> mar<strong>in</strong>e reserve networks. Ecological <strong>Application</strong>s 13, 185–198.<br />
Jamieson, G.S., Lev<strong>in</strong>gs C.O. 2001. Mar<strong>in</strong>e protected areas <strong>in</strong> Canada – implications for both<br />
conservation <strong>and</strong> fisheries management. Canadian Journal <strong>of</strong> Fisheries <strong>and</strong> Aquatic Sciences<br />
58(1), 138–156.<br />
Lourie, S.A., V<strong>in</strong>cent, A.C.J. 2004. Us<strong>in</strong>g biogeography to help set priorities <strong>in</strong> mar<strong>in</strong>e<br />
conservation. Conservation Biology 18, 1004-1020.<br />
83
Lundblad, E., Wright, D.J., Miller, J., Lark<strong>in</strong>, E.M., R<strong>in</strong>ehart, R., Battista, T., Anderson, S.M.,<br />
Naar, D.F., Donahue, B.T. 2006. Classify<strong>in</strong>g benthic terra<strong>in</strong>s with multibeam bathymetry,<br />
bathymetric position <strong>and</strong> rugosity: Tutuila, American Samoa. Mar<strong>in</strong>e Geodesy 29(2), 89-111.<br />
Lynch, T. P. 2006. Incorporation <strong>of</strong> recreational fish<strong>in</strong>g effort <strong>in</strong>to design <strong>of</strong> mar<strong>in</strong>e protected<br />
areas. Conservation Biology 20, 1466–1476.<br />
Madden, C. J., Grossman, D.H. 2008. A framework for a <strong>coastal</strong>/mar<strong>in</strong>e ecological classification<br />
st<strong>and</strong>ard (CMECS). In Mapp<strong>in</strong>g the seafloor for habitat characterization, B. J. Todd <strong>and</strong> H. G.<br />
Greene (eds.), pp. 185–210. St. John’s, Newfoundl<strong>and</strong>, Canada: Geological Association <strong>of</strong><br />
Canada, Geological Association <strong>of</strong> Canada Special Paper 47.<br />
Madden, C. J., Grossman, D.H., Good<strong>in</strong>, K.L. 2005. Coastal <strong>and</strong> Mar<strong>in</strong>e Systems <strong>of</strong> North<br />
America: Framework for an Ecological Classification St<strong>and</strong>ard: Version II. NatureServe,<br />
Arl<strong>in</strong>gton, Virg<strong>in</strong>ia. Birkel<strong>and</strong>, C.E., R<strong>and</strong>all, R.H., Wass, R.C., Smith, B., <strong>and</strong> S. Wilk<strong>in</strong>s, 1987.<br />
Biological Assessment <strong>of</strong> the Fagatele Bay National Mar<strong>in</strong>e Sanctuary, NOAA Technical<br />
Memor<strong>and</strong>um, 232 pp.<br />
Maidment, D.R., ed., 2002. Arc Hydro: GIS for Water Resources. ESRI Press. Redl<strong>and</strong>s, CA.<br />
Nagelkerken, I., Blaber, S.J.M., Bouillon, S., Green, P., Haywood, M., Kirton, L.G., Meynecke,<br />
J.O., Pawlik, J., Penrose, H.M., Sasekumar, A., Somerfield, P.J. 2008. The habitat function <strong>of</strong><br />
mangroves for terrestrial <strong>and</strong> mar<strong>in</strong>e fauna: a review. Aquatic Botany 89, 155-185.<br />
Massachusetts Ocean Management Plan (Volume 2), Basel<strong>in</strong>e Assessment <strong>and</strong> Science<br />
Framework, December 2009. Commonwealth <strong>of</strong> Massachusetts, 227 pp.<br />
http://www.env.state.ma.us/eea/mop/f<strong>in</strong>al-v1/v1-front.pdf<br />
84
Maxwell, D.L., Stelzenmüller, V., Eastwood, P.D., Rogers S.I. 2009. Modell<strong>in</strong>g the spatial<br />
distribution <strong>of</strong> plaice (Pleuronectes platessa), sole (Solea solea) <strong>and</strong> thornback ray (Raja clavata)<br />
<strong>in</strong> UK waters for mar<strong>in</strong>e management <strong>and</strong> plann<strong>in</strong>g. Journal <strong>of</strong> Sea Research 61 (4), 258-267.<br />
Menza, C., F<strong>in</strong>nen, E. 2007. Manual for the sampl<strong>in</strong>g design tool for ArcGIS. NOAA Center for<br />
Coastal <strong>and</strong> Mar<strong>in</strong>e Monitor<strong>in</strong>g.<br />
http://ccma.nos.noaa.gov/products/biogeography/sampl<strong>in</strong>g/welcome.html<br />
Monmonier, M. 1996. How to lie with maps. University <strong>of</strong> Chicago Press. Chicago, 207 pp.<br />
Mount, R.E., Bricher, P.J. 2008. Estuar<strong>in</strong>e, Coastal <strong>and</strong> Mar<strong>in</strong>e (ECM) National Habitat<br />
Mapp<strong>in</strong>g Project, ECM National Habitat Map Series User Guide Version 1 February 2008.<br />
Spatial Science Group, School <strong>of</strong> Geography <strong>and</strong> Environmental Studies, University <strong>of</strong><br />
Tasmania. Report to the Department <strong>of</strong> Climate Change <strong>and</strong> the National L<strong>and</strong> <strong>and</strong> Water<br />
Resources Audit, Canberra, ACT. ECM National Habitat Map Series User Guide.<br />
(http://www.ozcoasts.org.au/nrm_rpt/acknowledgements.jsp)<br />
Mumby, P.J., Broad, K., Brumbaugh, D.R., Dahlgren, C.P., Harborne, A.R., Hast<strong>in</strong>gs, A.,<br />
Holmes, K.E., Kappel, C.V., Micheli, F., Sanchirico, J.N. 2008. Coral reef habitats as surrogates<br />
<strong>of</strong> species, ecological functions <strong>and</strong> ecosystem services. Conservation Biology 22, 941-951.<br />
Naidoo, R., Balmford, A., Costanza, R., Fisher, B., Green, R.E., Lehner, B., Malcolm, T.R.,<br />
Ricketts, T.H. 2008. Global mapp<strong>in</strong>g <strong>of</strong> ecosystem services <strong>and</strong> conservation priorities.<br />
Proceed<strong>in</strong>gs <strong>of</strong> the National Academy <strong>of</strong> Sciences 105, 9495–9500.<br />
NOAA National Centers for Coastal Ocean Science (NCCOS). 2006. An ecological<br />
characterization <strong>of</strong> the Stellwagen Bank National Mar<strong>in</strong>e Sanctuary Region: Oceanographic,<br />
Biogeographic <strong>and</strong> Contam<strong>in</strong>ants Assessment. Prepared by NCCOS’s Biogeography Team <strong>in</strong><br />
cooperation with the National Mar<strong>in</strong>e Sanctuary Program. Silver Spr<strong>in</strong>g, MD. NOAA Technical<br />
Memor<strong>and</strong>um NOS NCCOS 45.<br />
85
Neale, A. C., LOPEZ, R. D. 2009. The National Atlas <strong>of</strong> Ecosystem Services: Spatially Explicit<br />
Characterization <strong>of</strong> Ecosystem Services. 20th Biennial Conference, Estuaries <strong>and</strong> Coasts <strong>in</strong> a<br />
Chang<strong>in</strong>g World, Portl<strong>and</strong>, OR, November 01 - 05, 2009.<br />
Olmos, M.A., Birch, G.F., 2008. <strong>Application</strong> <strong>of</strong> sediment-bound heavy metals <strong>in</strong> studies <strong>of</strong><br />
<strong>estuar<strong>in</strong>e</strong> health: a case study <strong>of</strong> Brisbane Water estuary, New South Wales. Australian Journal<br />
<strong>of</strong> Earth Sciences 55, 641-654.<br />
Pedersen, S. A., Fock, H., Krause, J., Pusch, C., Sell, A. L., Böttcher, U., Rogers, S. I., Sköld,<br />
M., Skov, H., Podolska, M., Piet, G. J., Rice, J. C. 2009. Natura 2000 sites <strong>and</strong> fisheries <strong>in</strong><br />
German <strong>of</strong>fshore waters. ICES Journal <strong>of</strong> Mar<strong>in</strong>e Science 66, 155–169.<br />
Pickett, S.T.A., White, P.S. 1985. Patch dynamics: a synthesis. In: S.T.A. Pickett <strong>and</strong> P.S. White.<br />
The ecology <strong>of</strong> natural disturbance <strong>and</strong> patch dynamics. Academic Press, New York. 371-384.<br />
Pittman, S.J., Costa, B. 2010. Chapter 21: L<strong>in</strong>k<strong>in</strong>g cetaceans to their environment: spatially<br />
explicit data acquisition, digital data process<strong>in</strong>g <strong>and</strong> predictive model<strong>in</strong>g for mar<strong>in</strong>e spatial<br />
plann<strong>in</strong>g <strong>in</strong> the Northwest Atlantic. In: Cushman, S., Huettmann, F. (Eds.), Spatial Complexity,<br />
Informatics, <strong>and</strong> Wildlife Conservation. Spr<strong>in</strong>ger, Tokyo, pp. 387-408.<br />
Pittman, S.J., Brown, K.A. (<strong>in</strong> review). A multiscale approach for predict<strong>in</strong>g fish species<br />
distributions across coral reef seascapes. PLoS One.<br />
Pittman, S.J., McAlp<strong>in</strong>e, C.A. 2003. Movements <strong>of</strong> mar<strong>in</strong>e fish <strong>and</strong> decapod crustaceans:<br />
Process, theory <strong>and</strong> application. Advances <strong>in</strong> Mar<strong>in</strong>e Biology 44, 205-294.<br />
Pittman, S.J., Costa, B., Battista, T. 2009. Us<strong>in</strong>g Lidar bathymetry <strong>and</strong> boosted regression trees<br />
to predict the diversity <strong>and</strong> abundance <strong>of</strong> fish <strong>and</strong> corals. Journal <strong>of</strong> Coastal Research S53, 27-38.<br />
Pittman, S.J., Hile, S.D., Jeffrey, C.F.G., Caldow, C., Clark, R., Woody, K., Monaco, M.E.,<br />
Appeldoorn, R. 2010. Coral reef ecosystems <strong>of</strong> Reserva Natural de La Parguera (Puerto Rico):<br />
86
Spatial <strong>and</strong> temporal patterns <strong>in</strong> fish <strong>and</strong> benthic communities (2001-2007). NOAA Technical<br />
Memor<strong>and</strong>um 78.<br />
Pittman, S.J., Christensen, J., Caldow, C., Menza, C., Monaco, M. 2007a. Predictive mapp<strong>in</strong>g <strong>of</strong><br />
fish species richness across shallow-water seascapes <strong>of</strong> the U.S. Caribbean. Ecological<br />
Modell<strong>in</strong>g 204, 9-21.<br />
Pittman, S.J., Hile, S.D., Caldow, C., Monaco, M.E. 2007b. Us<strong>in</strong>g seascape types to expla<strong>in</strong> the<br />
spatial patterns <strong>of</strong> fish us<strong>in</strong>g mangroves <strong>in</strong> Puerto Rico. Mar<strong>in</strong>e Ecology Progress Series 348,<br />
273-284.<br />
Pittman, S.J., Hile, S.D., Jeffrey, C.F.G., Caldow, C., Clark, R,, Woody, K., Monaco, M.E.,<br />
Appeldoorn, R. 2010. Coral reef ecosystems <strong>of</strong> Reserva Natural de La Parguera (Puerto Rico):<br />
Spatial <strong>and</strong> temporal patterns <strong>in</strong> fish <strong>and</strong> benthic communities (2001-2007). NOAA Technical<br />
Memor<strong>and</strong>um 78, 207 pp.<br />
Post, A.L., Wassenberg, T.J., Passlow, V. 2006. Physical surrogates for macr<strong>of</strong>aunal<br />
distributions <strong>and</strong> abundance <strong>in</strong> a tropical gulf. Mar<strong>in</strong>e <strong>and</strong> Freshwater Research 57, 469-483.<br />
Puot<strong>in</strong>en, M. L. 2007. Modell<strong>in</strong>g the risk <strong>of</strong> cyclone wave damage to coral reefs us<strong>in</strong>g GIS: a<br />
case study <strong>of</strong> the Great Barrier Reef, 1969-2003, International Journal <strong>of</strong> Geographic<br />
Information Science 21(1), 97-120.<br />
Purkis, S.J., Graham, N.A.J., Riegl, B.M. 2008. Predictability <strong>of</strong> reef fish diversity <strong>and</strong><br />
abundance us<strong>in</strong>g remote sens<strong>in</strong>g data <strong>in</strong> Diego Garcia (Chagos Archipelago). Coral Reefs 27,<br />
167-178.<br />
Radke, L., Brooke, B., Ryan, D., Laht<strong>in</strong>en, A., Heap, A. 2006. An <strong>in</strong>itial assessment <strong>of</strong> <strong>estuar<strong>in</strong>e</strong><br />
geomorphic <strong>in</strong>dicators <strong>of</strong> <strong>coastal</strong> waterway health – F<strong>in</strong>al Report. Cooperative Research Centre<br />
for Coastal Zone, Estuary & Waterway Management Technical Report #66.<br />
(http://www.ozcoasts.org.au/pdf/CRC/66_SE_<strong>in</strong>dicators_screen.pdf).<br />
87
Rees, S. E., Rodwell, L.D., Attrill, M.J., Austen, M.C., Mangi, S.C. 2010. The value <strong>of</strong> mar<strong>in</strong>e<br />
biodiversity to the leisure <strong>and</strong> recreation <strong>in</strong>dustry <strong>and</strong> its application to mar<strong>in</strong>e spatial plann<strong>in</strong>g.<br />
Mar<strong>in</strong>e Policy 34(5), 868-875.<br />
Reijonen et al. 2008 Mar<strong>in</strong>e l<strong>and</strong>scapes <strong>and</strong> benthic habitats <strong>in</strong> the Archipelago Sea (the Baltic<br />
Sea) – a case study. Balance Interim Report No. 31).<br />
Robb<strong>in</strong>s, B.D., Bell, S.S. 1994. Seagrass l<strong>and</strong>scapes: a terrestrial approach to the mar<strong>in</strong>e<br />
environment. Trends <strong>in</strong> Ecology <strong>and</strong> Evolution 9(8), 301–304.<br />
R<strong>of</strong>f, J.C., Taylor, M.E. 2000. National frameworks for mar<strong>in</strong>e conservation – a hierarchical<br />
geophysical approach: Aquatic Conservation: Mar<strong>in</strong>e <strong>and</strong> Freshwater Ecosystems 10, 209-223.<br />
R<strong>of</strong>f, J.C., Taylor, M.E., Laughren, J. 2003. Geophysical approaches to the classification,<br />
del<strong>in</strong>eation <strong>and</strong> monitor<strong>in</strong>g <strong>of</strong> mar<strong>in</strong>e habitats <strong>and</strong> their communities: Aquatic Conservation:<br />
Mar<strong>in</strong>e <strong>and</strong> Freshwater Ecosystems 13(1), 77- 90.<br />
Rubec, P.J., Christensen, J.D., Arnold, W.S., Norris, H., Steele, P., Monaco, M.E. 1998a. GIS<br />
<strong>and</strong> modell<strong>in</strong>g: coupl<strong>in</strong>g habitats to Florida fisheries. Journal <strong>of</strong> Shellfish Research 17 (5), 1451–<br />
1457.<br />
Rubec, P.J., Coyne, M.S., McMichael Jr, R.H., Monaco, M.E. 1998b. Spatial methods be<strong>in</strong>g<br />
developed <strong>in</strong> Florida to determ<strong>in</strong>e essential fish habitat. Fisheries 23 (7), 21–25.<br />
Sala, E., Aburto-Oropeza, O., Paredes, G., Parra, I., Barrera, J.C., Dayton, P.K. (2002) A general<br />
model for design<strong>in</strong>g networks <strong>of</strong> mar<strong>in</strong>e reserves. Science 298, 1991–1993.<br />
Selkoe, K.A., Halpern, B.S., Ebert, C.M., Frankl<strong>in</strong>, E.C., Selig, E.R., Casey, K.S., Bruno, J.,<br />
Toonen, R.J. 2009. A map <strong>of</strong> human impacts to a “prist<strong>in</strong>e” coral reef ecosystem, the<br />
Papahānaumokuākea Mar<strong>in</strong>e National Monument. Coral Reefs 28, 635-650.<br />
88
Sharples, C. 2006. Indicative Mapp<strong>in</strong>g <strong>of</strong> Tasmanian Coastal Vulnerability to Climate Change<br />
<strong>and</strong> Sea-Level Rise: Explanatory Report (Second Edition); Consultant Report to Department <strong>of</strong><br />
Primary Industries & Water, Tasmania, 173 pp., plus accompany<strong>in</strong>g electronic (GIS) maps.<br />
(http://www.dpiw.tas.gov.au/<strong>in</strong>ter.nsf/Attachments/PMAS-<br />
6RG4MS/$FILE/TasCoastVulnMapRept_2ndEd_Summary.pdf).<br />
Sharples, C. <strong>and</strong> Mount, R.E., Pedersen, T.K., Lacey, M.J., Newton, J.B., Jaskierniak, D.,<br />
Wallace, L., 2009. The Australian Coastal Smartl<strong>in</strong>e Geomorphic <strong>and</strong> Stabililty Map Version 1:<br />
Project Report, Australian Government, Geoscience Australia, 1 (2009) [Contract Report].<br />
Shears, N.T., Smith, F., Babcock, R.C., Villouta, E., Duffy, C.A.J. 2008. Evaluation <strong>of</strong><br />
biogeographic classification schemes for conservation plann<strong>in</strong>g: application to New Zeal<strong>and</strong>’s<br />
<strong>coastal</strong> mar<strong>in</strong>e environment. Conservation Biology 22, 467-481.<br />
Sherman, K., Duda. AM. 1999. An ecosystem approach to global assessment <strong>and</strong> management <strong>of</strong><br />
<strong>coastal</strong> waters. Mar<strong>in</strong>e Ecology Progress Series. 190, 271-287.<br />
Shreffler, D. K., Thom, R.M. 1993. Restoration <strong>of</strong> urban estuaries: new approaches for site<br />
location <strong>and</strong> design. Battelle/Mar<strong>in</strong>e Sciences Laboratory, Sequim, WA.<br />
Snickars <strong>and</strong> Pitkänen 2007. GIS tools for mar<strong>in</strong>e spatial plann<strong>in</strong>g <strong>and</strong> management. BALANCE<br />
Interim Report No. 28.)<br />
Spald<strong>in</strong>g, M.D., Fox, H.E., Allen, G.R., Davidson, N, Ferdana, Z.A., F<strong>in</strong>layson, M., Halpern,<br />
B.S., Jorge, M.A., Lombana, A., Lourie, S.A., Mart<strong>in</strong>, K.D., McManus, E., Molnar, J., Recchia,<br />
C.A., Robertson, J. 2007. Mar<strong>in</strong>e ecoregions <strong>of</strong> the world: a bioregionalization <strong>of</strong> <strong>coastal</strong> <strong>and</strong><br />
shelf areas. Bioscience 57(7), 573-582.<br />
89
Stelzenmüller, V., Rogers, S.I., Mills, C.M. 2008. Spatio-temporal patterns <strong>of</strong> fish<strong>in</strong>g pressure on<br />
UK mar<strong>in</strong>e l<strong>and</strong>scapes, <strong>and</strong> their implications for spatial plann<strong>in</strong>g <strong>and</strong> management. ICES<br />
Journal <strong>of</strong> Mar<strong>in</strong>e Sciences 65(6), 1081-1091.<br />
Stelzenmüller, V., Ellis, J.R., Rogers, S.I. 2010. Towards a spatially explicit risk assessment for<br />
mar<strong>in</strong>e management: Assess<strong>in</strong>g the vulnerability <strong>of</strong> fish to aggregate extraction. Biological<br />
Conservation 143, 230-238.<br />
St. Mart<strong>in</strong>, K., Hall-Arber, M. 2008. The miss<strong>in</strong>g layer: Geo-technologies, communities, <strong>and</strong><br />
implications for mar<strong>in</strong>e spatial plann<strong>in</strong>g. Mar<strong>in</strong>e Policy 32, 779-786.<br />
Stevens, T., Connolly, R.M. 2004. Test<strong>in</strong>g the utility <strong>of</strong> abiotic surrogates for mar<strong>in</strong>e habitat<br />
mapp<strong>in</strong>g at scales relevant to management. Biological Conservation 119, 351-362.<br />
Thompson, S.D., Gergel, S.E. 2008. Conservation implications <strong>of</strong> mapp<strong>in</strong>g rare habitats us<strong>in</strong>g<br />
high spatial resolution imagery: Recommendations for heterogeneous <strong>and</strong> fragmented<br />
l<strong>and</strong>scapes. L<strong>and</strong>scape Ecology 23(9), 1023-1037.<br />
Troy, A., Wilson, M.A. (2006) Mapp<strong>in</strong>g ecosystem services: practical challenges <strong>and</strong><br />
opportunities <strong>in</strong> l<strong>in</strong>k<strong>in</strong>g GIS <strong>and</strong> value transfer. Ecological Economics 60(2), 435–449.<br />
Valavanis, V. D., Pierce, G. J., Zuur, A. F., Palialexis, A., Saveliev, A., Katara, I., Wang, J. J.<br />
2008. Modell<strong>in</strong>g <strong>of</strong> essential fish habitat based on remote sens<strong>in</strong>g, spatial analysis <strong>and</strong> GIS.<br />
Hydrobiologia 612, 5-20.<br />
Valiela, I., Bowen, J.L., York, J.K. 2001. Mangrove forests: one <strong>of</strong> the world’s threatened major<br />
tropical environments. BioScience 51(10), 807-815.<br />
V<strong>in</strong>cent, M.A., Atk<strong>in</strong>s, S., Lumb, C., Gold<strong>in</strong>g, N., Lieberknecht, L. M., Webster, M.. 2004.<br />
Mar<strong>in</strong>e nature conservation <strong>and</strong> susta<strong>in</strong>able development: the Irish Sea Pilot. Report to Defra by<br />
the Jo<strong>in</strong>t Nature Conservation Commission, Peterborough, UK.<br />
90
Wells, S., Ravilous, C., Corcoran, E. 2006. In the front l<strong>in</strong>e: Shorel<strong>in</strong>e protection <strong>and</strong> other<br />
ecosystem services from mangroves <strong>and</strong> coral reefs. United Nations Environment Programme<br />
World Conservation Monitor<strong>in</strong>g Centre, Cambridge, UK, 33 pp.<br />
Weiss, A. D. 2001. Topographic Positions <strong>and</strong> L<strong>and</strong>forms Analysis (Conference Poster). ESRI<br />
International User Conference. San Diego, CA, July 9-13.<br />
Wiens J.A. 2000. Ecological heterogeneity: an ontogeny <strong>of</strong> concepts <strong>and</strong> approaches. In:<br />
Hutch<strong>in</strong>gs, M.J., John, E.A., Stewart, A.J.A. (Eds), The Ecological Consequences <strong>of</strong><br />
Environmental Heterogeneity. Blackwell Science, Oxford, pp. 9-31.<br />
Williams, K.B., 2002. The Potential Wetl<strong>and</strong> Restoration <strong>and</strong> Enhancement Site Identification<br />
Procedure. NC Division <strong>of</strong> Coastal Management, Raleigh, NC.<br />
Wright, D.J., 2005. Report <strong>of</strong> HURL Cruise KOK0510: Submersible Dives <strong>and</strong> Multibeam<br />
Mapp<strong>in</strong>g to Investigate Benthic Habitats <strong>of</strong> Tutuila, American Samoa. Technical Report NOAA's<br />
Office <strong>of</strong> Undersea Research Submersible Science Program, Hawai'i Undersea Research Lab.<br />
http://dusk.geo.orst.edu/djl/samoa/hurl (Last accessed 7 September 2009).<br />
Wright, D.J., Lundblad, E.R., Lark<strong>in</strong>, E.M., R<strong>in</strong>ehart, R.W., Murphy, J., Cary-Kothera, L.,<br />
Draganov, K. 2005. Benthic Terra<strong>in</strong> Modeler (BTM) extension for ArcGIS 8.x <strong>and</strong> 9.x, ver. 1.0.<br />
[http://www.csc. noaa.gov/products/btm/].<br />
Wright, D.J., Heyman, W.D. 2008. Mar<strong>in</strong>e <strong>and</strong> <strong>coastal</strong> GIS for geomorphology, habitat mapp<strong>in</strong>g,<br />
<strong>and</strong> mar<strong>in</strong>e reserves, Mar<strong>in</strong>e Geodesy 31(4), 1-8.<br />
Wright, D.J., Lundblad, E.R., Fenner, D., Whaylen, L., Smith, J.R. 2006. Initial results <strong>of</strong><br />
submersible dives <strong>and</strong> multibeam mapp<strong>in</strong>g to <strong>in</strong>vestigate benthic habitats <strong>of</strong> Tutuila, American<br />
Samoa, Eos, Transactions <strong>of</strong> the American Geophysical Union 87(36), Ocean Sciences Meet<strong>in</strong>g<br />
Supplement, Abstract OS12B-04.<br />
91
Tyler-Walters, H., Jackson, A. 1999. Assess<strong>in</strong>g seabed species <strong>and</strong> ecosystems sensitivities.<br />
Rationale <strong>and</strong> user guide, June 2000 edition. Report to the Department <strong>of</strong> the Environment<br />
Transport <strong>and</strong> the Regions from the Mar<strong>in</strong>e Life Information Network (MarLIN). Mar<strong>in</strong>e<br />
Biological Association <strong>of</strong> the United K<strong>in</strong>gdom, Plymouth.<br />
Tyler-Walters, H., Rogers, S.I., Marshall, C.E., Hiscock, K. 2009. A method to assess the<br />
sensitivity <strong>of</strong> sedimentary communities to fish<strong>in</strong>g activities. Aquatic Conservation: Mar<strong>in</strong>e <strong>and</strong><br />
Freshwater Ecosystems 19, 285-300.<br />
Wedd<strong>in</strong>g, L., Lepczyk, C., Pittman, S.J., Friedl<strong>and</strong>er, A., Jorgensen, S. (<strong>in</strong> press) Quantify<strong>in</strong>g<br />
seascape structure: Extend<strong>in</strong>g terrestrial spatial pattern metrics to the mar<strong>in</strong>e realm. Mar<strong>in</strong>e<br />
Ecology Progress Series.<br />
WWF/Conservation Law Foundation. 2006. Mar<strong>in</strong>e ecosystem Conservation for New Engl<strong>and</strong><br />
<strong>and</strong> maritime Canada: A science-based approach to identify<strong>in</strong>g priority areas for conservation.<br />
http://www.clf.org/work/OC/oceanconservationareas/docs/CLF_WWF_2006.pdf<br />
Zacharias, M.A., Howes, D.E., Harper, J.R., Wa<strong>in</strong>wright, P. 1998. The development <strong>and</strong><br />
verification <strong>of</strong> a mar<strong>in</strong>e ecological classification: A case study <strong>in</strong> the Pacific mar<strong>in</strong>e region <strong>of</strong><br />
Canada. Coastal Management 26(2), 105-124.<br />
Zacharias, M.A. Gregr, E. J. 2005. Sensitivity <strong>and</strong> Vulnerability <strong>in</strong> Mar<strong>in</strong>e Environments: an<br />
Approach to Identify<strong>in</strong>g Vulnerable Mar<strong>in</strong>e Area. Conservation Biology 19(1), 86-97.<br />
Zitello, A.G., Bauer, L.J., Battista, T.A., Mueller, P.W., Kendall, M.S., Monaco, M.E. 2009.<br />
Shallow-Water Benthic Habitats <strong>of</strong> St. John, U.S. Virg<strong>in</strong> Isl<strong>and</strong>s. NOAA Technical<br />
Memor<strong>and</strong>um NOS NCCOS 96. Silver Spr<strong>in</strong>g, MD. 53 pp.<br />
http://ccma.nos.noaa.gov/ecosystems/coralreef/benthic_usvi.html<br />
92
FIGURE LEGENDS<br />
Figure 1. A) Classes <strong>of</strong> topographic complexity calculated from 4m resolution bathymetry<br />
collected by an airborne laser us<strong>in</strong>g LiDAR (Light Detection <strong>and</strong> Rang<strong>in</strong>g). B) Average fish<br />
species richness from underwater surveys grouped for each class <strong>of</strong> topographic complexity.<br />
Figure 2. (A) Comb<strong>in</strong>ed benthic <strong>and</strong> pelagic seascapes <strong>of</strong> the Scotian Shelf. (B) Seascape<br />
heterogeneity <strong>of</strong> comb<strong>in</strong>ed pelagic <strong>and</strong> benthic seascapes. Intensity <strong>of</strong> color <strong>in</strong>creases with<br />
number <strong>of</strong> unique seascapes quantified with<strong>in</strong> a slid<strong>in</strong>g w<strong>in</strong>dow <strong>of</strong> 18 km radius that passes over<br />
the entire pelagic-benthic seascape map (adapted from R<strong>of</strong>f et al. 2003).<br />
Figure 3. A.) Topographic classification based on topographic <strong>and</strong> bed-form features, B.) Coastal<br />
physiographic classification based on major <strong>coastal</strong> features (estuaries, lagoons, sounds, bays,<br />
archipelago, <strong>and</strong> fjords) identified by coastl<strong>in</strong>e, bathymetry <strong>and</strong> sal<strong>in</strong>ity (figures adapted from<br />
Al-Hamdani <strong>and</strong> Reker 2007).<br />
Figure 4. Map show<strong>in</strong>g five classes <strong>of</strong> habitat heterogeneity at a 1 x 1 km grid for the<br />
Archipelago Sea region <strong>of</strong> the Baltic Sea based on summed values <strong>of</strong> classes based on variability<br />
<strong>of</strong> wave exposure, depth classes <strong>and</strong> ratio <strong>of</strong> shallow water, proximity to l<strong>and</strong> <strong>and</strong> shorel<strong>in</strong>e<br />
complexity (reproduced with permission from Snickars <strong>and</strong> Pitkänen 2007.<br />
Figure 5. Sample <strong>of</strong> output from the habitat mapp<strong>in</strong>g component <strong>of</strong> the onl<strong>in</strong>e NRM Report<strong>in</strong>g<br />
module illustrat<strong>in</strong>g the presence <strong>and</strong> absence <strong>of</strong> seagrass-dom<strong>in</strong>ated habitats at: (a) the national<br />
93
scale (50 kilometre grid cells) <strong>and</strong> (b) <strong>in</strong> Tasmania (10 kilometre grid cells). (c) Users can also<br />
zoom to scales
Figure 10. Ecological evaluation <strong>in</strong>dex (EVI) developed for the Massachusetts Ocean Plan<br />
developed to support identification <strong>of</strong> special, sensitive, or unique <strong>estuar<strong>in</strong>e</strong> <strong>and</strong> mar<strong>in</strong>e life <strong>and</strong><br />
habitats.<br />
Figure 11. An example <strong>of</strong> the use <strong>of</strong> <strong>classifications</strong> <strong>in</strong> ocean zon<strong>in</strong>g <strong>and</strong> optimiz<strong>in</strong>g zon<strong>in</strong>g <strong>in</strong><br />
mar<strong>in</strong>e spatial plann<strong>in</strong>g <strong>in</strong> the Baltic Sea (Ekebom et al. 2008).<br />
Figure 12. A.) Map show<strong>in</strong>g all the legally permitted activities <strong>and</strong> uses <strong>of</strong> the UK Irish Sea; B.)<br />
Proposed Multiple Use Zon<strong>in</strong>g Map for the UK Irish Sea based on exist<strong>in</strong>g legal <strong>and</strong> political<br />
management jurisdictions <strong>and</strong> mechanism show<strong>in</strong>g the locations <strong>of</strong> the five rarest mar<strong>in</strong>e<br />
l<strong>and</strong>scape types (adapted from Boyes et al. 2007).<br />
Figure 13. A.) Distribution <strong>of</strong> demersal fish<strong>in</strong>g effort, <strong>and</strong> B.) Relative economic value <strong>of</strong><br />
demersal fishery around Brita<strong>in</strong> <strong>and</strong> Irel<strong>and</strong>. (CEFAS Sensitivity Maps report 1998).<br />
Figure 14. A.) Mar<strong>in</strong>e l<strong>and</strong>scape categories <strong>in</strong> UK (Engl<strong>and</strong> <strong>and</strong> Wales) waters based on a 2 x 2<br />
nautical mile grid resolution (modified after Connor et al. (2006); B.). Average annual fish<strong>in</strong>g<br />
pressure (AvAFPcell), as a proportion <strong>of</strong> grid cell affected by beam trawl<strong>in</strong>g, otter trawl<strong>in</strong>g, <strong>and</strong><br />
scallop dredg<strong>in</strong>g (Stelzenmüller ety al. 2008).<br />
Figure 15. Location <strong>of</strong> a Natura 2000 conservation area <strong>and</strong> listed habitat types <strong>in</strong> the SE North<br />
Sea with<strong>in</strong> the German Exclusive Economic Zone. Inset map shows fish<strong>in</strong>g effort from trawlers<br />
encroach<strong>in</strong>g on the conservation area <strong>and</strong> listed habitat types based on GPS coord<strong>in</strong>ates <strong>of</strong><br />
satellite tracked vessels (adapted from Pederson et al. 2009).<br />
95
Figure 16. Classes or themes represented <strong>in</strong> maps can be utilized as strata <strong>in</strong> the optimal design<br />
<strong>of</strong> monitor<strong>in</strong>g or sampl<strong>in</strong>g strategies. Most biological populations are heterogeneous, therefore, a<br />
stratified r<strong>and</strong>om sampl<strong>in</strong>g design is one option for optimiz<strong>in</strong>g sampl<strong>in</strong>g design.<br />
Figure 17. Trend analysis for <strong>coastal</strong> habitats <strong>of</strong> Barnegat Bay, New Jersey from 1972 to 1995<br />
show<strong>in</strong>g how a consistent classification framework can be effectively applied to detect changes<br />
over time. Analyses conducted by Rutgers University Center for Remote Sens<strong>in</strong>g <strong>and</strong> Spatial<br />
Analysis (Lathrop <strong>and</strong> Bognar 2001).<br />
Figure 18. Spatial classification <strong>of</strong> losses <strong>and</strong> ga<strong>in</strong>s <strong>in</strong> wetl<strong>and</strong>s from 1990 to 2000 <strong>in</strong><br />
southwestern Louisiana (Barras et al. 2003).<br />
Figure 19. A.) Spatially explicit change detection us<strong>in</strong>g a consistent l<strong>and</strong> use classification<br />
reveals where changes occurred <strong>and</strong> type <strong>of</strong> class that mangrove was converted to <strong>in</strong> several SE<br />
Asian countries. B.) Example <strong>of</strong> l<strong>and</strong> change map show<strong>in</strong>g spatial distribution <strong>of</strong> mangrove<br />
deforestation <strong>in</strong> Ayeyarwady Delta, Burma, from 1975-1990, 1990-2000, <strong>and</strong> 2000-2005 (Giri et<br />
al. 2007).<br />
Figure 20. Environmental Sensitivity Index (ESI) map for a section <strong>of</strong> the Alabama coastl<strong>in</strong>e.<br />
96
Figure 21. Comb<strong>in</strong><strong>in</strong>g '<strong>in</strong>tolerance' <strong>and</strong> 'recoverability' assessments to classify <strong>and</strong> rank<br />
'sensitivity' for UK mar<strong>in</strong>e environments. NS = not sensitive, NR = not relevant.<br />
http://www.marl<strong>in</strong>.ac.uk/sensitivityrationale.php<br />
Figure 22. Estimated general sensitivity (1 = low; 10 = high) to aggregate extraction based on the<br />
sensitivity <strong>in</strong>dex <strong>of</strong> the eleven commercially important fish <strong>and</strong> shellfish species (left) <strong>and</strong> a map<br />
<strong>of</strong> associated uncerta<strong>in</strong>ty (right) (Stelzenmüller et al. 2010).<br />
Figure 23. Classification <strong>of</strong> Pass-a-Grille Beach NW, P<strong>in</strong>ellas County, Florida <strong>in</strong>clud<strong>in</strong>g classes<br />
represent<strong>in</strong>g geomorphic structure <strong>and</strong> urban development for the USGS Coastal Hazards Maps.<br />
Figure 24. Selected data relevant to climate change impacts for the Papahãnaumokuãkea Mar<strong>in</strong>e<br />
National Monument. Maps a-d represent raw data layers <strong>and</strong> panels e-f are cumulative impact<br />
models (reproduced from Selkoe et al. 2009).<br />
Figure 25. A ‘smartl<strong>in</strong>e’ geomorphology map from the L<strong>and</strong>forms <strong>and</strong> Stability module <strong>in</strong><br />
OzCoasts. Each l<strong>in</strong>e segment <strong>in</strong>cludes multiple attribute fields that describe important aspects <strong>of</strong><br />
the geomorphology <strong>of</strong> the coast <strong>in</strong>clud<strong>in</strong>g its vulnerability to <strong>coastal</strong> erosion.<br />
Figure 26. Sample <strong>of</strong> report card show<strong>in</strong>g the locations <strong>of</strong> estuaries <strong>and</strong> the proportion <strong>of</strong> the<br />
condition classes <strong>of</strong> estuaries <strong>in</strong> the Southern Rivers NRM region <strong>in</strong> 2000 (Schelt<strong>in</strong>ga <strong>and</strong> Tilden<br />
2008).<br />
97
Figure 27. Distribution <strong>of</strong> broad habitat types with<strong>in</strong> 11 regions <strong>of</strong> UK waters, used for assess<strong>in</strong>g<br />
habitat status for Chart<strong>in</strong>g Progress 2 (habitats aggregated from EUNIS types, based on modeled<br />
data from MESH; <strong>in</strong>tertidal rock <strong>and</strong> sediment habitats not shown, but were assessed).<br />
Figure 28. Aggregated impact scores across all habitats (6) per region <strong>of</strong> UK waters. Aggregated<br />
scores allocated to one <strong>of</strong> five categories to <strong>in</strong>dicate overall severity <strong>of</strong> each pressure. F<strong>in</strong>al<br />
column provides overall rank<strong>in</strong>g for the UK.<br />
Figure 29. Restoration classes for Buckridge Coastal Reserve identified through the wetl<strong>and</strong><br />
restoration <strong>and</strong> enhancement site identification procedure developed by North Carol<strong>in</strong>a Division<br />
<strong>of</strong> Coastal Management (Williams 2002).<br />
Figure 30. Priority areas identified <strong>and</strong> ranked with Priority 1 <strong>in</strong>dicat<strong>in</strong>g the highest priority areas<br />
for restor<strong>in</strong>g vegetated habitat for juvenile salmon <strong>in</strong> the Skagit Estuary, Wash<strong>in</strong>gton State.<br />
Figure 31. A.) Estimated value <strong>of</strong> labor costs for mar<strong>in</strong>e tourism bus<strong>in</strong>esses. The number <strong>of</strong><br />
employees was multiplied by an estimated average salary <strong>and</strong> a factor proportional to the level <strong>of</strong><br />
dependence on mar<strong>in</strong>e tourism. B.) Comb<strong>in</strong>ed economic value <strong>of</strong> boats, shorel<strong>in</strong>e cottages <strong>and</strong><br />
labor costs <strong>of</strong> mar<strong>in</strong>e tourism related bus<strong>in</strong>esses. The class values <strong>in</strong>dicate cumulative economic<br />
importance.<br />
Figure 32. Spatial analysis <strong>of</strong> biodiversity <strong>and</strong> the selected ecosystem services. The seven benefit<br />
functions (feature values) are displayed <strong>in</strong> color with the accompany<strong>in</strong>g best networks <strong>of</strong><br />
98
selected plann<strong>in</strong>g units <strong>in</strong> gray <strong>in</strong>sets. Feature values range from 0 (or locked out; white), to low<br />
(light blue), moderate (dark blue), <strong>and</strong> high (purple). The boundary <strong>in</strong>dicates the ecoregion plus<br />
the 10-km buffer. Yellow l<strong>in</strong>es <strong>in</strong>dicate stratification units, with<strong>in</strong> which <strong>in</strong>dividual targets were<br />
pursued. Numbers <strong>in</strong> the thous<strong>and</strong>s (3000) are stratification unit labels. B) Ecosystem service<br />
<strong>and</strong> biodiversity hotspots. Colors represent the number <strong>of</strong> features for which each plann<strong>in</strong>g unit<br />
was selected <strong>in</strong> the best MARXAN network (Chan et al. 2006).<br />
Figure 33. Estimated percentage reduction <strong>in</strong> yearly ecosystem service value flows between<br />
current conditions <strong>and</strong> full zon<strong>in</strong>g buildout conditions by parcel for Maury Isl<strong>and</strong> (Troy <strong>and</strong><br />
Wilson 2006).<br />
99
Box 1. Def<strong>in</strong>itions <strong>of</strong> ecosystem-based management <strong>and</strong> mar<strong>in</strong>e spatial plann<strong>in</strong>g.<br />
Ecosystem-based management (EBM) <strong>and</strong> <strong>in</strong>tegrated mar<strong>in</strong>e spatial<br />
plann<strong>in</strong>g (MSP) have recently emerged as strategic priorities for<br />
many natural resource stewardship agencies around the world, with<br />
the overall objective <strong>of</strong> manag<strong>in</strong>g diverse mar<strong>in</strong>e uses <strong>in</strong> a<br />
comprehensive <strong>and</strong> susta<strong>in</strong>able way us<strong>in</strong>g a holistic <strong>and</strong> spatiallyexplicit<br />
framework (Douvere <strong>and</strong> Ehler 2009).<br />
OSPAR (Commission for the Protection <strong>of</strong> the Mar<strong>in</strong>e Environment<br />
<strong>of</strong> the Northeast Atlantic) def<strong>in</strong>es ecosystem-based management as:<br />
“The comprehensive <strong>in</strong>tegrated management <strong>of</strong> human activities<br />
based on the best available scientific knowledge about the<br />
ecosystem <strong>and</strong> its dynamics, <strong>in</strong> order to identify <strong>and</strong> take action on<br />
<strong>in</strong>fluences which are critical to the health <strong>of</strong> mar<strong>in</strong>e ecosystems,<br />
thereby achiev<strong>in</strong>g susta<strong>in</strong>able use <strong>of</strong> goods <strong>and</strong> services <strong>and</strong><br />
ma<strong>in</strong>tenance <strong>of</strong> ecosystem <strong>in</strong>tegrity”.<br />
NOAA def<strong>in</strong>es an ecosystem approach to management (EAM) as:<br />
“A geographically specified, adaptive approach that takes account <strong>of</strong><br />
ecosystem knowledge <strong>and</strong> uncerta<strong>in</strong>ties, considers multiple external<br />
<strong>in</strong>fluences, <strong>and</strong> strives to balance diverse societal objectives”.<br />
The UK government def<strong>in</strong>es the purpose <strong>of</strong> MSP as:<br />
“The creation <strong>of</strong> a strategic mar<strong>in</strong>e plann<strong>in</strong>g system that will clarify<br />
mar<strong>in</strong>e objectives <strong>and</strong> priorities for the future, <strong>and</strong> direct decisionmakers<br />
<strong>and</strong> users towards more efficient, susta<strong>in</strong>able use <strong>and</strong><br />
protection <strong>of</strong> mar<strong>in</strong>e resources” (Defra, 2007).<br />
100
Box 2. Classifications as thematic maps.<br />
Classifications as thematic maps<br />
Classes <strong>of</strong> environmental data <strong>in</strong>clud<strong>in</strong>g social data with<strong>in</strong> a known<br />
geographical location can be represented as a map to create a spatially<br />
explicit classification schemes or thematic map. This helps to organize,<br />
visualize <strong>and</strong> analyze diverse <strong>in</strong>formation <strong>in</strong> a systematic, transparent,<br />
cost-effective <strong>and</strong> operationally mean<strong>in</strong>gful way to support efficient<br />
management decision mak<strong>in</strong>g.<br />
• Classes can be a s<strong>in</strong>gle textual descriptor or a numeric value or a<br />
range <strong>of</strong> values <strong>and</strong> can be derived from expert op<strong>in</strong>ion or<br />
numerically through a multivariate group i.e. “cluster group”<br />
based on a statistical classifier or some comb<strong>in</strong>ation<br />
• When mapped, classes are usually composed <strong>of</strong> a number <strong>of</strong><br />
discrete <strong>and</strong> spatially homogeneous units that are assigned to<br />
grid cells or represented as polygons with discrete boundaries <strong>in</strong><br />
a Geographical Information System (GIS)<br />
• The map accuracy, spatial <strong>and</strong> temporal resolution, geographical<br />
extent <strong>and</strong> thematic resolution (i.e. detail <strong>of</strong> the classes) are<br />
important consideration when apply<strong>in</strong>g <strong>classifications</strong> to support<br />
management decision mak<strong>in</strong>g<br />
101
Box 3. Potential applications <strong>of</strong> the Scotian Shelf mar<strong>in</strong>e habitat classification (R<strong>of</strong>f et al. 2003).<br />
• Def<strong>in</strong>ition <strong>of</strong> habitat-community associations<br />
• Assessment <strong>of</strong> resource conflicts<br />
• Judg<strong>in</strong>g potential impact <strong>of</strong> <strong>in</strong>vad<strong>in</strong>g species<br />
• Assessment <strong>of</strong> the potential role <strong>of</strong> focal species<br />
• Guide to habitat management<br />
• Framework evaluation <strong>of</strong> ecosystem processes<br />
• Framework for assessment <strong>of</strong> global climate change<br />
• Assessment <strong>of</strong> habitat suitability<br />
• Exam<strong>in</strong><strong>in</strong>g patterns <strong>of</strong> biodiversity<br />
• Evaluat<strong>in</strong>g mar<strong>in</strong>e protected areas<br />
• Guide to environmental monitor<strong>in</strong>g<br />
102
Figure 1.<br />
1
Figure 2.<br />
A. Seascape classes B. Seascape class richness<br />
2
Figure 3.<br />
3
Figure 4.<br />
4
Figure 5.<br />
5
Figure 6.<br />
A.<br />
B.<br />
C.<br />
6
Figure 7.<br />
7
Figure 8.<br />
8
Figure 9.<br />
9
Figure 10.<br />
Massachusetts<br />
10
Figure 11.<br />
11
Figure 12.<br />
12
Figure 13.<br />
13
Figure 14.<br />
14
Figure 15.<br />
Fish<strong>in</strong>g effort (hrs/day)<br />
Small beam trawlers Large beam trawlers<br />
15
Figure 16.<br />
Ref<strong>in</strong>ed sampl<strong>in</strong>g with<strong>in</strong><br />
estimates <strong>of</strong> variance <strong>and</strong><br />
strata from habitat map<br />
Simple spatially r<strong>and</strong>om<br />
sampl<strong>in</strong>g design<br />
Stratified r<strong>and</strong>om<br />
sampl<strong>in</strong>g design<br />
16
Figure 17.<br />
17
Figure 18.<br />
18
Figure 19.<br />
100%<br />
Conversion.<br />
80%<br />
60%<br />
40%<br />
20%<br />
to other<br />
to urban<br />
to aquaculture<br />
to agriculture<br />
0%<br />
Thail<strong>and</strong><br />
Malaysia<br />
Indonesia<br />
Burma<br />
Bangladesh<br />
India<br />
Sri Lanka<br />
19
Figure 20.<br />
20
Figure 21.<br />
21
Figure 22.<br />
22
Figure 23.<br />
23
Figure 24.<br />
24
Figure 25.<br />
25
Figure 26.<br />
26
Figure 27.<br />
27
Figure 28.<br />
Climate<br />
change<br />
Hydrological<br />
pressures (local)<br />
Pollution & other<br />
chemical pressures<br />
Other physical<br />
pressures<br />
Physical<br />
changes<br />
Biological pressures<br />
Regional Sea 1 2 3 4 5 6 7 8 9 10 11<br />
Overall<br />
RANK<br />
Climate change L L L M L L L VL 10<br />
Temperature changes (local) VL VL VL VL VL VL VL 14<br />
Sal<strong>in</strong>ity changes (local) VL VL VL VL VL VL VL 15<br />
Changes <strong>in</strong> water flow, wave<br />
action & emergence regime<br />
(local)<br />
Contam<strong>in</strong>ation by hazardous<br />
substances<br />
L VH H H M VL VL 3<br />
L M M M M L L VL VL 7<br />
Radionuclide contam<strong>in</strong>ation VL VL VL VL VL VL VL 17=<br />
De-oxygenation VL VL VL VL L VL VL 12<br />
Nitrogen & phosphorus<br />
enrichment<br />
L M M L L L L 8<br />
Organic enrichment M M M M M L L 6<br />
Electromagnetic changes VL VL VL VL VL VL VL 13<br />
Litter L L L L L L L L L L L 11<br />
Underwater noise VL VL VL VL VL VL VL 17=<br />
Barrier to species movement 21=<br />
Death or <strong>in</strong>jury by collision VL VL VL VL VL VL VL 17=<br />
Siltation rate changes M M M M VL M L M L L L 5<br />
Physical damage VH VH H VH VL VH H VH L VH VL 2<br />
Physical loss M H M M VL M L M VL H VL 4<br />
Visual disturbance 21=<br />
Genetic modification VL VL VL VL VL VL VL 16<br />
Introduction <strong>of</strong> microbial<br />
pathogens<br />
Introduction <strong>of</strong> non-<strong>in</strong>digenous<br />
species & translocations<br />
Removal <strong>of</strong> species (target &<br />
non-target)<br />
VL VL VL VL 20<br />
L M M M VL VL VL 9<br />
VH VH H VH VL VH H VH L VH VL 1<br />
Cumulative impact across all 6 habitats, per<br />
Regional Sea<br />
Very high<br />
(>50)<br />
High (25-<br />
Figure 29.<br />
29
Figure 30.<br />
30
Figure 31.<br />
31
Figure 32.<br />
32
Figure 33.<br />
33