Soil Fertility Status - Chambal Fertilisers - Home
Soil Fertility Status - Chambal Fertilisers - Home
Soil Fertility Status - Chambal Fertilisers - Home

You also want an ePaper? Increase the reach of your titles
YUMPU automatically turns print PDFs into web optimized ePapers that Google loves.
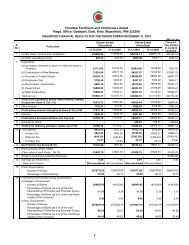
TABLE 2 : STATEWISE NUTRIENT INDEX OF N, P & K IN NORTH - WESTERN STATES<br />
S. STATE TOTAL NO NITROGEN PHOSPHOROUS POTASH<br />
No. OF SOIL<br />
SAMPLES VALUE CATEGORY VALUE CATEGORY VALUE CATEGORY<br />
1 Uttar Pradesh 145152 1.56 L 1.47 L 1.93 M<br />
2 Madhya Pradesh 35708 2.13 M 1.45 L 2.84 H<br />
3 Rajasthan 271800 1.57 L 1.45 L 2.57 H<br />
4 Uttrakhand 1533 1.95 M 1.45 L 1.48 L<br />
5 Gujarat 16026 1.90 M 1.41 L 2.47 H<br />
6 Haryana 121915 1.51 L 1.64 L 2.42 H<br />
7 Punjab 93591 1.53 L 1.73 M 2.36 H<br />
8 Chhattisgarh 7598 2.16 M 1.20 L 2.51 H<br />
9 Jammu & Kashmir 2713 1.99 M 1.31 L 1.82 M<br />
10 West Bengal 360 1.86 M 2.48 H 1.68 M<br />
11 Himanchal Pradesh 141 2.64 H 1.59 L 2.30 M<br />
12 Assam 47 1.77 M 2.57 H 1.19 L<br />
Overall 696584 1.60 L 1.52 L 2.39 H<br />
<strong>Soil</strong> <strong>Fertility</strong> <strong>Status</strong><br />
of North-Western States of India<br />
NUTRIENT INDEX < 1.67 - LOW, 1.67 - 2.33 - MEDIUM, > 2.33 - HIGH<br />
L - LOW, M - MEDIUM & H - HIGH<br />
Nutrient Index = (Per cent Samples falling in low category X 1) + (Per cent samples falling in<br />
medium category X 2) + (Per cent samples falling in high category X 3 ) / 100<br />
14